 News
News  Market Data
  Discover
Support: 888-992-3836
Copyright © 2023 InvestorsHub Inc.


Register for free to join our community of investors and share your ideas. You will also get access to streaming quotes, interactive charts, trades, portfolio, live options flow and more tools.
The grains look really good from here including rice and bean oil.
Elevated sugar prices mean that inflation and gold have not peaked yet - MarketGuage's Mish Schneider
By: Neils Christensen | March 1, 2023
After bouncing off a nine-week low at the start of the week, the gold market is seeing some new technical buying, pushing prices to resistance at around $1,850 an ounce. According to one market analyst, this could be the start of a bigger bullish move as the Federal Reserve is unlikely to bring inflation back down to its 2% target.
In an interview with Kitco News, Michele Schneider, director of trading education and research at MarketGauge, said that if investors want to know where gold is going, they should pay closer attention to sugar prices.
The little-watched commodity is currently trading around $0.205 per pound. Last month sugar pushed to a multi-year high above $0.21. At the same time, sugar prices are up more than 120% from their 2020 COVID-19 lows.
Unlike other agricultural commodities like wheat and corn, sugar has maintained most of its gains following the global pandemic market disruptions. Schneider said elevated sugar prices indicate that inflation is not going away.
"Sugar is in everything, which means it will keep food prices elevated globally, and there is not much the Federal Reserve will be able to do about that," she said.
Late last year, food shortages of sugar, vegetable oil, rice and even bottled water in Tunisia caused fights to break out among consumers waiting in food market queues. Schneider said that supply disruptions with reduced exports from India and Russian sanctions, as its invasion of Ukraine enters its second year, could lead to higher sugar prices through 2023.
"The sugar market appears to be this underlying indication that we haven't seen the peak in geopolitical problems. We haven't seen the peak in social disruption, and therefore we haven't seen the peak in inflation," she said. "This also means we haven't seen the peak in gold and silver."
While sugar has been the quiet indicator Schneider is watching, she said it is not the only commodity that points to higher inflation. She explained that supply constraints in most industrial metals, like copper, aluminum and tin, will continue to support higher prices and will ultimately filter down to consumers, keeping inflation elevated.
Schneider said that there are already signs that gold investors doubt that the Federal Reserve will be able to raise interest rates enough to cool down inflation.
After a strong start to the year, February was gold's worst month since mid-2021. The gold market saw a sharp decline last month as interest rate expectations started to shift, with investors looking for the Federal Reserve to maintain higher interest rates for longer than initially anticipated.
However, Schneider said that despite gold's selloff, it had held critical support. She added that she expected gold prices to hold their ground at $1,800 an ounce.
"No matter how unpopular gold has gotten, its price action tells me that investors are still worried about inflation and protecting themselves," she said.
Gold's new momentum comes as market chatter highlights growing prospects that the Federal Reserve could raise interest rates to 6%. At the same time, the yield on 10-year notes has briefly pushed to 4%. The two-year yield remains at a multi-year high of around 4.8%.
Schneider also noted that despite gold's selloff, it continues to outperform the S&P 500. She said that as soon as it becomes clear that the Federal Reserve cannot cool inflation, gold will take off to new highs.
"It's going to take just one little catalyst to ignite a bigger rally in gold," she said. "Whether that is inflation as sugar prices rally or some geopolitical event, it won't take much for conditions to spiral out of control."
Although investors go back and forth over a potential recession, Schneider said that the bigger threat to the economy remains stagflation, a period of lower growth and high inflation.
"It's not about the doom and gloom. My job is not necessarily to predict but to forewarn and prepare people," she said.
Read Full Story »»»
 DiscoverGold
Today's Futures Heat Map • Weakest: Lumber, Orange Juice, Coffee, Milk
By: Barchart | March 1, 2023
• Today's Futures Heat Map
Strongest: Sugar, Heating Oil, Cocoa, Copper
Weakest: Lumber, Orange Juice, Coffee, Milk

Read Full Story »»»
DiscoverGold
Look Out Below Funds Big Sellers. The Corn & Ethanol Report
By: Daniel Flynn | March 1, 2023
We kickoff the day with MBA 30-Year Mortgage Rate, MBA Mortgage Market Index, MBA Mortgage Refinance Index, MBA Purchase Index and MBA Mortgage Applications at 6:00 A.M., S&P Global Manufacturing PMI Final at 8:45 A.M., ISM Manufacturing PMI, ISM Manufacturing Employment , ISM Manufacturing New Orders, ISM Manufacturing Prices and Construction Spending MoM at 9:00 A.M.,
EIA Energy Stocks 9:30 A.M., 17-Week Bill Auction at 10:30 A.M., Cotton System, Dairy Products Sales and Fats & Oils at 2:00 P.M.
On the Corn Front massive fund selling kept the bulls at bay with a 13 ¼ cents break in yesterday’s action. The market is waiting for a dead cat bounce as the grain complex has been pummeled over the last week. Even the market will look to who can supply the global demand and exports could push US exports. At the moment US exports are dismal compared to the five-year average even discounting the surge of the export market with China. Things will change when price for feed and human consumption will dominate with tight global supplies. In the overnight electronic session the May corn is currently trading at 630 ½ which is a ¼ of a cent higher. The trading range has been 635 to 630 ¼.
On the Ethanol Front the EIA reports ethanol volumes continue to recover from the pandemic blues. The Biden administration is expected to approve a rule that would expand sales of gasoline with higher blends in certain US MIDWEST states. The rule making is not to take effect until the summer of 2024 sources said. Too little too late. The CBOT ethanol futures continue to show zero trades and open interest. Any doubt in traders mind. The pattern continues.
Read Full Story »»»
DiscoverGold
Brewing. The Energy Report
By: Phil Flynn | March 1, 2023
A global oil supply squeeze is brewing as China’s economy looks like it’s getting ready to soar. Overnight data showed the Chinese manufacturing sector saw its biggest surge in a decade and will soon erase any perception of short-term oversupply. China’s official manufacturing PMI hit 52.6 in February, and in their outlook, they are predicting even more growth in the coming months. The news initially caused oil to rally but now is pulling back as traders fear what the Energy Information Administration may say about crude supply and are even more fearful of the reaction by the Fed if China starts increasing commodity prices.
The oil supply picture short term is muddled after the American Petroleum Institute (API) showed another stunning 6.203 million barrel increase in crude supply as refinery maintenance is reducing US demand by millions of barrels a day. Yet they had better not stay in maintenance much longer as the US is exporting a record amount of petroleum products to the world as the US product supply is well below normal. The API reported drops in oil products with gasoline down 1.774 million barrels and distillate inventories down 341,00 barrels.
In fact yesterday, the Energy Information Administration (EIA) said in their monthly report that the supply of crude and petroleum products in the United States fell in December to 19.49 million bpd, the lowest since March 2021. The US refineries will have to get to work and that should add 2 to 4 million barrels a day of demand in the coming weeks and months.
On top of that, if China’s manufacturing sector does not falter it will intensify the global shortfall of distillate inventories. That will add to diesel prices and inflation and does not even raise the issue of gasoline additive shortages that are looming because of the Russia-Ukraine war.
It is also unlikely that OPEC will be able to feed this demand as Russia starts its production cut as Nigeria helped OPEC raise output even as the cartel is still below its output targets. Reuters reported that an OPEC poll showed that OPEC production was up 150,000 barrels a day but is still underproducing by 880,000 barrels a day.
The EIA also had a big downward adjustment in their previously reported oil production number. The EIA reported that US December crude production was at 12.101 mbpd vs 12.377 mbpd (revised from 12.375 mbpd) in November. That number is a concern as the Biden administration’s anti-oil policies and rising production costs are causing a pullback in US oil drillers. Rig counts are falling and costs are rising. Thank goodness at least the US is finally allowing Gulf of Mexico lease sales that were privately held up by the anti-oil Biden administration.
The U.S. Bureau of Ocean Energy Management (BOEM) will hold an oil and gas lease sale in the Gulf of Mexico in March 2023 it announced Friday. The lease sale is one of three offshore lease sales initially canceled by the Biden administration in May 2022. The Gulf of Mexico Oil and Gas Lease Sale 259 will offer approximately 13,600 blocks on 73.3 million acres in the Western, Central, and Eastern Planning Areas on the U.S. Outer Continental Shelf. The opening and reading of the bids will begin at 9 a.m. Central Daylight Time on March 29, 2023.
Of course, once you buy the lease you have to worry whether the Biden Administration will block your permission because they are the pettiest and most vindictive administration in the history of the country against oil and gas. Not only do they falsely accuse the industry of price gouging and manipulation, but their policies have also led to higher prices and more global price instability. The long-term damage from these policies will sadly be felt for years.
For oil, we must get through the EIA report. The market is sensing another crude build based on the API. Yet the focus should start to change soon as refineries will not stay down forever. You have to try to ignore the fact that the global product situation is dangerously below average even with one of the warmest winters on record in the US and Europe as far as heating degree days are concerned. Yet with China roaring back, you had better hope for a deep recession to avoid a major supply squeeze this summer.
Natural gas is trying to come back from one of its deep price dives. Freeport LNG’s progress as well as some concerns about some production cutbacks is fueling the rebound. The EIA reported that in December 2022, dry natural gas production increased year over year for the month for the 21st consecutive month. The preliminary level for dry natural gas production in December 2022 was 3,068 billion cubic feet (Bcf), or 99.0 billion cubic feet per day (Bcf/d). This level was 1.0% (1.0 Bcf/d) higher than December 2021 (98.0 Bcf/d) and the highest level for the month since 1973, when we began tracking dry natural gas production. Gross withdrawals also increased from December 2021: Gross withdrawals: 3,717 Bcf for the month, or a daily rate of 119.9 Bcf/d and A 1.0% increase compared with December 2021 (118.7 Bcf/d) The highest daily rate of gross withdrawals for the month since 1980, the earliest year in this data set. So a record.
Estimated natural gas consumption in December 2022 was 3,385 Bcf, or 109.2 Bcf/d. This level was 12.6% higher than in December 2021 (97.0 Bcf/d) and the highest for the month since we began using the current methodology for natural gas consumption in 2001. So a record.
Read Full Story »»»
DiscoverGold
Today's Futures Heat Map • Weakest: Natural Gas, Soybean Meal, Corn, Soybean
By: Barchart | February 28, 2023
• Today's Futures Heat Map
Strongest: Gasoline, Orange Juice, Lumber, Copper
Weakest: Natural Gas, Soybean Meal, Corn, Soybean

Read Full Story »»»
DiscoverGold
Agriculture Master Report
By: Bill Moore | February 28, 2023
MAR BEANS

Given the recent carnage in Mar Corn (down .50) & Mar Wht (down 1.00) since mid-Feb & considering the record bean Brazilian Bean crop, Mar Beans have held up remarkably well – holding just 40 cents off their recent highs! Helping to support was the USDA OUTLOOK FORUM last week that estimated bean acreage would remain unchanged from 2022 at 87.5 MA & The Buenos Aires Grain Exchange lowered their Arg bean production to 33.5 MMT (INITIAL-48) – the lowest in 14 years! Also, the Macro Mkts scored a big down last week with THE DJI registering its biggest weekly loss of 2023! Normally a huge negative for Beans! The mere fact that Beans are holding at over $15.00 -right now -is quite impressive!
MAR CORN

Mar Corn was bludgeoned with a perfect storm of mkt events – which induced massive fund selling – resulting in a nearly 30 cent weekly drop! First was more-than-expected week-end rains in Argentina – Second, bearish #’s from the USDA AG OUTLOOK FORM including increased acres – 91.0 MA (88.6), stocks – 1887 (1267) & production – 15.08 (13.73). Finally, the Macros turned sour with the DJI down 1000 points for the week & the US Dollar up 120 points! Exports were expected to increase – even incrementally in 2023 – but that has been slow to happen so far! Still, the Corn Futures are hovering in the mid-6’s in early Feb – mostly off historically low carry-out! Should there be any additional hiccup in production from either hemisphere in 2023, May & July Corn could easily tack on .50 to .75 – especially if exports ramp up in Mar-June!
MAR WHT

In 2 week’s time, Mar Wht has experienced a free-fall – plummeting over $1.00 (8.00-694) for a plethora of reasons! The main catalyst has been Russia as they have inundated the global mkt with cheap exports from their record crop – as they attempt to finance their war efforts! Then, last week, the USDA OUTLOOK FORUM issued some higher #’s for this year’s crop – acres – 49.5 MA (ly-45.7), production -1887 MB (ly-1650) & ending stocks – 608 MB (ly-568). Also, a winter storm has helped replenish some subsoil moisture for the drought-ravaged Western Plains – finally, the Russia-Ukraine Grain Corridor Deal is expected to be renewed by Mid-March! The mkt is severely oversold now & due for an upside correction!
JUNE CAT

After 4 consecutive contract highs, June Cattle registered a key reversal (new highs & an outside day down) – a “tempting sell” but NOT SO FAST! Despite its really historically high level, the supply/demand fundamentals suggest a correction – not a top! The production decrease from the 4th Qtr to the 1st Qtr was the 2nd largest ever – & demand seems to be good enough to support further up! Last Friday’s bevy of livestock reports were positive – with the Cold Storage reflecting less than last month & the Cattle-On-Feed reflecting both placements & total on-feed at 96% of 2022! Currently, the only “fly-in-the-ointment” is a looming recession – which could sharply undercut beef demand!
APL HOGS

Burdensome supplies continue to plague the hog complex – highlighted by the 60% jump in Pork Belly Supplies from last year 70,134 (ly-44,707) – as reflected in last Fridays monthly Cold Storage Report! The down is especially egregious when juxtaposed against a cattle mkt which makes new contract highs every 3rd day! We feel the consumer may have partially turned the tide – opting for cheap pork chops versus expensive steaks – as the futures haven’t made any new lows in 2-3 weeks. But rallying from here is another story as the massive pork supplies will probably keep the mkt just consolidating at current levels!
Read Full Story »»»
DiscoverGold
First Notice Day March Grains. The Corn & Ethanol Report
By: Daniel Flynn | February 28, 2023
We kickoff the day with Goods Trade Balance Adv, Retail Inventories Ex Autos MoM Adv and Wholesale Inventories MoM Adv at 7:30 A.M., Redbook YoY at 7:55 A.M., S&P/Case-Shiller Home Price MoM & YoY, House Price Index MoM & YoY and House Price Index at 8:00 A.M., Chicago PMI at 8;45 A.M., CB Consumer Confidence, Richmond Fed Manufacturing Index, Richmond Fed Manufacturing Shipments Index and Richmond Fed Services Index at 9:00 A.M., Dallas Fed Services Index and Dallas Fed Services Revenues Index at 9:30 A.M., and API Energy Stocks at 3:30 P.M.
On the Corn Front today we have or are rolling into May or July contracts with July being more of a market traders look to trade longer term positions. The market took on some more pressure in yesterday’s action with the spot slipping to its lowest level in 3 months. Drought conditions remain across Argentina, weather in Brazil remains favorable with spotty rains across the north central growing regions will accelerate soybean harvest and 2nd corn seedings in Mato Grosso.
Rhonda Brooks with AGWEB reports Ken Ferrie and his agronomic team conduct yield map meetings with Illinois customers this winter, They are seeing some excellent nutrient use efficiencies from the 2022 season, especially with nitrogen (N). In many cases, corn yield results were higher than farmers set goals and expectations. “At side-dressing time, our growers were raising their yield goals because of strong corn stands, which was a result of corn coming out of the ground in four-and-a-half to five days,” recalls Ferrie, Farm Field Journal Agronomist. “In most cases, pushing yield goals was the right move,” he adds. “Some growers who started with 220-bu. yield goals for instance bumped it to 240, and we adjusted the N rate accordingly.” With grain markets continuing to slide (5 sessions in a row) we may get a bounce with some short-covering but the market is trying to find support, two wildcards come into play long-term with global corn feed demand, ethanol demand and demand for human consumption which may or may not push US exports, while, the other wildcard will be Prospective Plantings March 31st. In the overnight electronic session the May corn is currently trading at 641 ¾ which is 1 ¾ of a cent lower. The trading range has been 646 ¾ to 641 ¼.
On the Ethanol Front Pro Farmer reports the Brazilian government is set to resume the collection of federal taxes on fuels this week, the Finance Ministry said on Monday, with the rate of fossil fuels higher than for biofuels. A measure to exempt federal taxes levied on fuel was launched by former President Jair Bolsonaro last year as he sought to boost his popularity by lowering prices ahead of a re-election bid. But President Luiz Inacio da Silva, who defeated Bolsonaro in October, extended the tax waiver on diesel and biodiesel until December of this year, and on gasoline and ethanol until February. The end of the waiver is seen positively by Brazil’s ethanol industry, since without taxes the biofuel loses its competitiveness against gasoline. There were no trades or open interest in the CBOT ethanol futures.
Read Full Story »»»
DiscoverGold
Russian Raking It In. The Energy Report
By: Phil Flynn | February 28, 2023
Oil is popping off Russian oil comments surrounding its production cut as a false sense of security has blanketed Europe’s surrounding victory over the global energy crisis. Gazprom Neft Chief Alexei Miller (Chairman) Alexander Dyukov in a meeting in Iran said that he predicts that oil will be in a range between $80-$110 per barrel is the predicted oil price range in 2023. He also defends Russian oil production cuts. He said that, “the world oil market is currently in surplus, he added, noting that the decision to cut oil production in Russia in March is aimed at balancing it. He also said to get ready for more volatility, so you had better buckle up.
Mr. Dyukov also is right about volatility as the oil market can’t decide if weak economic data should be bullish or bearish. Yesterday Dan Molinski at Dow Jones reported that, “US crude-oil prices are extending earlier declines, recently down 0.8% at $75.72 a barrel after a January report on US durable goods didn’t paint the rosiest of pictures for industrial activity, or more specifically the transportation sector, which accounts for two-thirds of all oil demand. The Commerce Department report showed an overall 4.5% month-on-month decline in new durable goods orders, but a 13.3% drop in new transportation equipment orders. That was due mostly to volatile nondefense aircraft and parts orders, but less-volatile motor vehicles and parts orders stayed sluggish, showing a paltry 0.2% increase in January after a 0.6% rise in December and no growth in November.
Yet previously the market was worried that the economy was too strong based on home sales and stronger than expected consumer confidence and jobs. That was a sign that the Fed wants to be more aggressive with interest rates that increased the value of the dollar. Make up your mind. This Dr. Jekyll and Mr. Hyde’s reactions to data that is too hot or too cold will soon change as the reality that demand will soon rise and supplies will fall as refinery runs and China ramps up. That is why I strongly recommend hedging before things start to heat up.
Russian oil revenues are much better than previously reported. SSRN reported that as sanctions on Russian energy were only implemented towards the end of 2022—and as global prices for oil and gas soared—Russia’s goods exports reached a record $532 billion in 2022, resulting in an all-time high trade surplus of $316 billion. Russia was able to redirect crude oil exports from Europe to alternative markets such as India, China, and Turkey with no loss of volumes, albeit at the cost of accepting discounts in a subset of markets where the EU embargo has dramatically lowered demand (i.e., shipments from Baltic and Black Sea ports). This curbed Russian oil export revenues in 2022, which would have been considerably larger without discounts. This also suggests that Russia, at least initially, chose to not reduce volumes in the face of downward pressure on prices. Surprisingly, we do not find crude oil discounts as large as those reflected in Urals prices: in the post-embargo/price cap period, the average export price for Russian crude oil stood at around $74/barrel based on our data—compared to Urals at $52/barrel.
Crude oil inventories should get their first drawdown this year and should lead to a long trend of falling US oil supply. We won’t have SPR oil to back us up much longer.
Fox Business reported that Biden’s favorite anti US oil company talking point is just wrong. Argus Media also reported that Joe Biden’s repeated claim that oil companies are sitting on 9,000 federal drilling permits overstated the backlog of unused permits, according to new data.
Oil and gas operators only had 6,650 approved but unused drilling permits on federal and tribal lands as of 31 January, according to the US Bureau of Land Management’s (BLM) latest data. The government’s tally of unused drilling permits was overstated, an error caused by a “reporting discrepancy” arising from a transition to a new database in 2020, BLM said today. The 9,000 tally became a core talking point for the White House last summer, as administration officials attempted to blame the oil industry for a spike in gasoline and oil prices at the time. Biden argued the industry was intentionally holding back on a new production as a way to inflate their own profits.
“They have 9,000 permits to drill,” Biden said last June. “Why aren’t they drilling? Because they make more money not producing more oil.” The White House said its criticisms of the oil and gas sector are still valid, even if there are fewer unused federal drilling permits than it stated before. They also stand by forcing people to get vaccinated and covering up evidence that the covid 19 virus most likely came from a lab in Wuhan China. And covering up that the vaccine actually would not stop you from getting covid as they claimed.
There is global importance of the US as a natural gas producer to the world and the reality that usage of natural gas is not going away anytime soon. Dow Jones reported that Cheniere could be included in the S&P 500. Dow Jones said that shares of Houston-based Cheniere Energy, the largest US LNG producer and the world’s second-largest operator, may be included in the S&P 500, says Cowen. “It is unclear how quickly the name could be included in the index, though the market is likely to find out March 3 when new adds are announced.
Read Full Story »»»
DiscoverGold
Grains Report: Wheat, Rice, Corn and Oats, Soybeans
By: Jack Scoville | February 27, 2023
• WHEAT
General Comments: Wheat markets were lower last week and Chicago SRW prices traded to new lows for the last year. News that USDA estimated planted area very high for the coming production and ideas that big Russian offers and cheaper Russian prices would be a feature for a while in the world market were the driving forces for the weaker prices, and price weakness could continue this week. News that Russia has launched a new offensive in Ukraine provided much of thew support this week. Russia appears to be sending three divisions across the border to fight and it looks as though this could be a major operation for the Russian army. Wire report now suggest that Russia has now committed almost its entire army to the war. Fears of deliveries of Wheat from the Black Sea will be cut significantly are surfacing again. Ideas are that both Australia and Russia are harvesting record to near record Wheat crops this year. Russia is said to be plotting a huge new invasion of Ukraine that could prevent farmers in Ukraine from harvesting Wheat and planting Corn. Russia has a large production and is undercutting most world prices in the international market. However, Russian production estimates have dropped recently. The demand for US Wheat in international markets has been a disappointment all year and has been hindered by low prices and aggressive offers from Russia. Ukraine is also looking for new business for its crops and Russia is aggressive in the world market as it looks for cash to fund the war.
Overnight News: The southern Great Plains should get mostly dry conditions. Temperatures should be below normal. Northern areas should see big snows. Temperatures will average below normal. The Canadian Prairies should see mostly dry conditions. Temperatures should average below normal.
Chart Analysis: Trends in Chicago are mixed to down with no obj3ectives, Support is at 716, 704, and 692 May, with resistance at 744, 765, and 773 May. Trends in Kansas City are down with no objectives. Support is at 825, 807, and 800 May, with resistance at 853, 862, and 866 May. Trends in Minneapolis are down with no objectives. Support is at 927, 922, and 906 March, and resistance is at 942, 947, and 955 May.
• RICE:
General Comments: Rice was lower again Friday and sharply lower for the week as the market is in a free fall from recent highs. USDA forecast a jump in production and demand yesterday with a fall in prices. Reports indicate that the farmers have been selling and ideas are that they might dump on the market if they think a big crop is coming at the end of the new growing season that is now getting ready to start in southern growing areas. Demand has been good from domestic sources. Export demand has been uneven. Demand has been an issue for the market all year. There is not much going on in the domestic market right now although mills are milling for the domestic market in Arkansas and are bidding for some Rice. Markets from Texas to Mississippi are called quiet. Demand in general has been slow to moderate for Rice for exports and solid for domestic uses.
Overnight News: The Delta should get mostly dry conditions. Temperatures should be below normal.
Chart Analysis: Trends are down with objectives of 1625 May. Support is at 1689, 1683, and 1670 May and resistance is at 1714, 1728, and 1737 May.
• CORN AND OATS
General Comments: Corn closed sharply lower last week in response to the USDA Outlook Conference that showed increased planted and harvested area and increased yields for potential production of more than 15 billion bushels and the second biggest crop on record and partly on the charts as price trends turned down and some big support areas were broken. US prices are currently very competitive with those from South America and US demand has improved because of the price differentials. Prices from South America should now remain strong as countries there concentrate on Soybeans exports, so the US has chance now to see export demand improve more than it has already. The export demand remains well behind the pace to make USDA objectives. Brazil has been hanging on for its Summer crop although losses are now being reported. The situation is now more stable in southern Brazil and northern Argentina after recent rains, but the situation in central and southern Argentina remains stressed. Argentina has suffered through some extreme drought and losses could be large. The Brazil Winter crop is harvested and China has been buying the surplus. The Summer crop and the Argentine crop is developing under stressful conditions. The next Winter crop is going into the ground in good conditions, but it has been wet so the Soybeans harvest has been delayed and the Corn planting is becoming delayed as well. There are concerns about demand with the Chinese economic problems caused by the lockdowns creating the possibility of less demand as South America has much better crops this year to compete with the US for sales. China is now moving rapidly to open the economy and allow people to move around with no lockdowns so the demand could start to improve
Overnight News:
Chart Analysis: Trends in Corn are down with objectives of 638 May. Support is at 648, 645, and 637 May, and resistance is at 660 668, and 672 May. Trends in Oats are mixed. Support is at 342, 333, and 330 May, and resistance is at 348, 358, and 361 May.
• SOYBEANS
General Comments: Soybeans and the products were a little lower on Friday and Soybean Oil closed a little lower for the week while the others closed a little higher. The market is weaker in response to the USDA Outlook Conference reports that showed planted and harvested area the same as last year and increased yields for increased production and in anticipation of the South American harvest coming to export channels in the near term. It remains hot and dry in Argentina and crop conditions are getting worse. However, weather is becoming less important now as the harvest is already underway in central and northern Brazil and will spread south soon. Sothern Brazil and northern Argentina are getting enough rain to stabilize conditions and production losses but central and southern Argentina remain very dry. Central and northern Brazil have seen harvest operations interrupted with too much rain. Soybean Meal saw strong weekly export sales as Argentina is having to withdraw from the market for Soy products sales due to the drought in the country and the fact that they have already sold a lot of Soybeans into the world market. They are now buying from Brazil. The harvest in Brazil is slowly expanding in central and northern areas. These areas have seen too much rain and the harvest has been slow. Production potential for the Brazil is called very strong even with potential problems and losses in the south. Argentine production ideas continue to drop with the drought as planting is delayed and the crops already in the ground are stressed. Ideas that Chinese demand will improve, but this could take a few more weeks as a very large part of the population now has Covid. This has delayed a robust economic return for the country.
Overnight News:
Chart Analysis: Trends in Soybeans are mixed. Support is at 1510, 1500, and 1476 May, and resistance is at 1533, 1549, and 1560 May. Trends in Soybean Meal are mixed. Support is at 474.00, 471.00, and 465.00 May, and resistance is at 485.00, 487.00, and 493.00 May. Trends in Soybean Oil are mixed. Support is at 6080, 5970, and 5900 May, with resistance at 6240, 6480, and 6440 May.
Read Full Story »»»
DiscoverGold
Softs Report: Cotton, OJ, Coffee, Sugar, Cocoa
By: Jack Scoville | February 27, 2023
• COTTON
General Comments: Cotton was higher on Friday and for the week as USDA kept with low planted area forecasts in its ideas released to the market on Thursday. Export demand was very strong when the sales report was released on Friday morning. USDA forecast a significant reduction in US planted area for Cotton in its outlook conference at about 10.5 million acres. Demand was very strong in the report last week and has been ramping up for the last couple of months. Some ideas that demand could soon increase more as China could start to open its economy in the next couple of months as Covid outbreaks should start to weaken as people get vaccinated or immune. Covid is now widespread in China so the beneficial economic effects of the opening are being delayed but these effects should start to be felt as the people there achieve immunity over the next week or two. The charts show that futures held at a test of the lows formed since November and that prices could start to move higher to the top end of the range at ab out 90 cents in the next few weeks.
Overnight News: The Delta will get mostly dry conditions and above normal temperatures. The Southeast will see isolated showers and above normal temperatures. Texas will have mostly dry conditions and above normal temperatures. The USDA average price is now 82.86 ct/lb. ICE said that certified stocks are now 1,147 bales, from 8,900 bales yesterday. ICE NY said that 0 notices were posted for delivery against March contracts and that total deliveries for the month are now 0 contracts.
Chart Trends: Trends in Cotton are mixed to up with objectives of 8740 and 9140 May. Support is at 82.90, 82.40, and 80.90 May, with resistance of 85.70, 86.90 and 87.90 May.
• FCOJ
General Comments: FCOJ was higher Friday and for the week as production remains the overriding force. The charts show that May is now challenging contract highs, but futures need to trade t about 367.00 to make new all time highs. Historically low estimates of production due in part to the hurricanes and in part to the greening disease that have hurt production, but conditions are significantly better now with scattered showers and moderate temperatures. The weather remains generally good for production around the world for the next crop including production areas in Florida that have been impacted in a big way by the two storms seen previously in the state. Brazil has some rain and conditions are rated good. Brazil continues to export to the EU and is increasing its exports to the US. Mexico is also exporting to the US. Even so, the Florida Dept of Citrus reported that inventories are still 40.6% below last year at 102.39 million pounds.
Overnight News: Florida should get mostly dry conditions. Temperatures will average above normal. Brazil should get scattered showers and near normal temperatures.
Chart Trends: Trends in FCOJ are up with objectives of 255.00 May. Support is at 235.00, 228.00, and 223.00 May, with resistance at 249.00, 253.00, and 261.00 May.
• COFFEE
General Comments: New York and London closed lower Friday in correction trading after the big rally early last week tied to higher differentials in Brazil and Vietnam caused by a lack of offers from producers in both countries. Futures finished higher for the week and could work higher again this week. Producers are not offering right now and the market wonders how much Coffee is left. Ideas of big production for Brazil continue due primarily to rains falling in Coffee production areas now. Vietnam is estimated to have veery good production this year due to a good growing season. There are ideas that production potential for both countries has been overrated. The weather in Brazil is currently very good for production potential but worse conditions seen earlier in the growing cycle hurt the overall production prospects as did bad weather last year. Vietnam is getting less rain now to aid harvet progress but volumes offered have not increased.
Overnight News: ICE certified stocks are lower today at 0.800 million bags. The ICO daily average price is now 178.96 ct/lb. Brazil will get scattered showers with near to above normal temperatures. Central America will get scattered showers. Vietnam will see scattered showers. ICE NY said that 0 contracts were tendered for delivery against March futures and that total deliveries for the month are now 572 contracts.
Chart Trends: Trends in New York are up with objectives of 209.00 May. Support is at 190.00, 187.00, and 184.00 May, and resistance is at 201.00, 205.00 and 206.00 May. Trends in London are up with no objectives. Support is at 2130, 2090, and 2080 May, and resistance is at 2210, 2250, and 2280 May.
• SUGAR
General Comments: New York and London closed lower on Friday and for the week as traders continue to factor in production losses in India and Brazil and other locations as well. Indian production is thought to be 33 million tons this year or less and the market has had to ration that supply via price. Thailand expects to export 7% more than last year. Good production prospects are seen for crops in central and northern areas of Brazil, but the south has seen drier weather. There is concern that the rainy areas will stay too wet and delay the harvest and dilute the Sugar concentrations in the cane in central areas. The harvest is active in Thailand. Australia and Central America harvests are also active. European production is expected to be reduced again this year.
Overnight News: Brazil will get scattered showers. Temperatures should average near to above normal. India will get mostly dry conditions and near to above normal temperatures.
Chart Trends: Trends in New York are mixed. Support is at 1960, 1940, and 1900 May and resistance is at 2030, 2050, and 2080 May. Trends in London are mixed. Support is at 557.00, 549.00, and 545.00 May and resistance is at 578.00, 582.00, and 588.00 May.
• COCOA
General Comments: New York and London closed mostly a little lower on Friday and for the week in correction trading as West African exporters are not offering. Wire reports suggest that exporters are currently looking for Cocoa to make good on current contracts and are not entering into new contracts right now. However, the Ivory Coast Cocoa and Coffee Council said that there will be more than enough Cocoa for export and that exporters can fix contracts. Trends have turned up in both New York and London for the longer term, but have turned mixed for the short term. Talk is that hot and dry conditions reported in Ivory Coast could curtail mid crop production, but main crop production ideas are strong. Ghana has reported a disease in its Cocoa to hurt production potential there. The rest of West Africa appears to be in good condition. Good production is reported for the main crop and traders are worried about the world economy moving forward and how that could affect demand. The weather is good in Southeast Asia.
Overnight News: Mostly dry conditions are forecast for West Africa. Temperatures will be near normal. Malaysia and Indonesia should see scattered showers. Temperatures should average near normal. Brazil will get scattered showers and near to above normal temperatures. ICE certified stocks are lower today at 5.042 million bags. ICE NY said that there were 380 notices posted for delivery against March contracts and that total deliveries for the month are now 601 contracts.
Chart Trends: Trends in New York are up with objectives of 2840 and 2860 May. Support is at 2700, 2670, and 2650 May, with resistance at 2810, 2840, and 2870 May. Trends in London are mixed. Support is at 2100, 2060, and 2040 May, with resistance at 2150, 217e0, and 2200 May.
Read Full Story »»»
DiscoverGold
Lumber- Up And Down And All Around
By: Barchart | February 27, 2023
Lumber is a critical industrial commodity that reflects the overall economy and the demand for new housing. On February 1, in a Barchart article, I highlighted the rally in lumber futures that took the price above $500 per 1,000 board feet. In that piece, I wrote, “the most recent inflation data shows the economic condition is declining. While inflation is nowhere near the Fed’s 2% target, the potential for a recession could curb the central bank’s enthusiasm for increasing short-term rates. Lumber’s price action could tell us that rates will level off in 2023, and the demand for new homes will increase.” Meanwhile, March lumber futures peaked at $533.70 on February 1, where they ran out of upside steam. While inflation data remains below last year’s high, the most recent readings were above the market’s expectations, and lumber prices have turned lower, with the March random-length lumber contract falling below $400 per 1,000 board feet.
The Fed is not likely to stop increasing rates
The January consumer and producer price index data and the latest minutes from the FOMC’s early February meeting set the stage for continuation interest rate hikes to push the Fed Funds Rate over the 5% level.
From March 2022 through early February 2023, the central bank increased the short-term interest rate from a band of zero to twenty-five basis points to 4.5% to 5.0%. The latest rate hike was only 25 basis points, but the Fed took an aggressive approach to tighten credit throughout 2022:

Source: Forbes.com
The chart shows four consecutive 75-point rate hikes from June 2022 to November 2022. The U.S. central bank is committed to returning inflation to its 2% target rate, but the economic condition remains at the highest level in decades, despite the significant credit tightening.
Meanwhile, short-term rate hikes are just one of the tools the Fed has employed. Quantitative tightening or reducing the central bank’s swollen balance sheet has put upward pressure on interest rates further along the yield curve.
The Fed follows the personal consumption expenditures price index or PCE instead of CPI or PPI. Last Friday, the PCE data for January showed a 0.6% from the prior year, which was about economists’ expectations. The inflation data tells us the Fed will increase the short-term rate by 25 or 50 basis points at the upcoming March FOMC meeting.
Random-length and physical lumber prices declined
Lumber is a primary requirement for new home building, and higher interest rates have caused the demand for new homes to decline. After reaching record highs in 2021 and 2022, lumber prices have plunged and returned to levels not seen since the global pandemic gripped markets across all asset classes.

The long-term chart shows the all-time high in the lumber futures market before 2018 was the 1993 $493.50 high. In March 2021, the price exploded to a record $1,711.20 per 1,000 board feet. After correcting to $448 in August 2021, the price took off on the upside again, reaching $1,477.40 in March 2022. Lumber reached highs in the zero percent short-term interest environment. With 30-Year fixed-rate mortgages rising from below 2% in late 2021 to over 7%, new home, and lumber demand has plunged, with the nearby March 2023 random-length lumber futures below the $400 level on February 27...
* * *
Read Full Story »»»
DiscoverGold
Today's Futures Heat Map • Strongest: Orange Juice, Natural Gas, Sugar, Platinum
By: Barchart | February 27, 2023
• Today's Futures Heat Map
Strongest: Orange Juice, Natural Gas, Sugar, Platinum
Weakest: Hard Red Wheat, Wheat, Soybean Oil, Crude Oil

Read Full Story »»»
DiscoverGold
Deliveries on Sugar/Energies/Grains/Treasuries/Canola/Metals/Ethanol
By: The PRICE Futures Group | February 27, 2023
• Tues, Feb 28th is LTD for Feb Cattle, March Sugar #11, March Heating Oil and RBOB.
• Tues, Feb 28th is FND for March MGEX Wheat, CBOT Grains, CBOT Treasuries, IFUS Canola and March Metals.
• Fri, March 3rd is LTD for March Ethanol.
Read Full Story »»»
DiscoverGold
Closing In On Spring. The Corn & Ethanol Report
By: Daniel Flynn | February 27, 2023
We kickoff the day with Durable Goods Orders MoM, Durable Goods Ex Transportation MoM, Non-Defense Goods Orders Ex Air and Durable Goods Orders ex Defense MoM at 7:30 A.M., Pending Home Sales MoM & YoY at 9:00 A.M., Dallas Fed Manufacturing Index and Fed Jefferson Speech at 9:30 A.M., Export Inspections at 10:00 A.M., 3-Month & 6-Month Bill Auction at 10:30 A.M., and Trout Production at 2:00 P.M.
On the Corn Front weather in the US and South America is another factor weighing in on the pendulum as other factors come into play with the USDA January report showing a reduction of 1.6 million acres of corn harvested in the 2022 crop and Argentina is experiencing their worst drought in 60 years. The 2023 production estimate pressured the market and the export market is doing anything but hype the bulls. We most likely will have a clearer direction after Prospective Plantings on March 31st. I still see a danger zone with food shortages with corn feed for livestock and global demand for food for human consumption. In the overnight electronic session the March corn is currently trading at 651 ¼ which is 1 ¼ of a cent lower. The trading range has been 654 to 649 ¾.
On the Ethanol Front Alexandria Chapman and Eduardo Tinti reporting for Fastmarkets Agricensus said Brazilian officials will decide on ethanol, gasoline tax exemption. A group of Brazilian officials including President Luiz Inacio da Silva will meet today in an effort to make the ethanol, gasoline market affordable. This is showing a thriving ethanol cash market while US ethanol futures remain dormant.
Read Full Story »»»
DiscoverGold
Too Hot? The Energy Report
By: Phil Flynn | February 27, 2023
Global oil markets are having a hard time determining whether they should worry about the economy. Is it too hot or too cold. Red hot inflation data in the US sent the stock market tumbling and weighed on oil even though there are signs of an increase in risk to supplies.
Over the weekend, a sign of what may be more to come, Russia cut oil flows to Poland, following through on their threat to not sell oil to any country, directly or indirectly, involved with the EU price cap. Later, Russian oil pipeline monopoly Transneft on Monday said there were no flows of oil to Poland because the paperwork for supplies in the second half of February had not been completed, Russia’s TASS news agency reported. Yet the reality is that this is Russia’s first shot across the bow and should serve as a warning to those that ideally dismiss Russia’s threat to not sell oil. It should also serve as a warning to the grain trade as well.
While the US sends record amounts of oil and gas to Europe, there are signs that because of low natural gas prices and the Biden administrations’ selling of Strategic Petroleum Reserves supplies, that US oil and gas drillers are pulling back. Reuters reported that – U.S. energy firms in February cut the most oil and natural gas rigs in a month since June 2020, with the gas rig count falling to the lowest since April, energy services firm Baker Hughes Co (BKR.O) said in its closely followed report on Friday. The oil and gas rig count, an early indicator of future output, fell seven to 753 in the week to Feb. 24. Despite this week’s rig decline, Baker Hughes said the total count was still up 103 rigs, or 15.8%, over this time last year.
There are true signs in the marketplace right now that the Biden administration’s unprecedented intervention of releasing Strategic Petroleum Reserve supplies is going to leave the market short later in the year. The market has become dependent on strategic reserve supplies like a drug addict is on drugs. It will start to be painful when they start to realize that there are no more supplies from the SPR. Losing the SPR release is like losing the 16th biggest oil producer in the world and that’s going to be felt especially when the US refiners start to come out of maintenance. The foolishness of these policies will be very apparent later in the year.
One of the most bullish factors for oil continues to be the reopening of the Chinese economy. S&P Global Platts reported that China’s small independent refineries doubled their fuel oil imports the month in February amid good refining margins and a tight supply of the alternative feedstock bitumen blend, refining, and trading sources told S&P Global Commodity Insights Feb. 27.
Read Full Story »»»
DiscoverGold
Commodities Pressured By Rising Dollar Index And Uncertainties
By: Barchart | February 26, 2023
Commodities appear severely pressured by the rising dollar index and several factors coming into play with grains, livestock, metals and energies. We follow our precise entry/exit strategies for the short-term hedger with some commentary in the Ag and Livestock sectors:

Charts - Drop us a note on Twitter @TradeGuidance or via email for a ToS Chartbook for the entire set of instruments shown above. Better yet, join us for a month and see if we can help improve your overall trading results.
In the Livestock sector:
Lean hogs stayed net green for week, but saw Friday losses between 15~ 55 cents across the front months. From Friday to Friday April hogs were still up by 75 cents. USDA’s National Average Base Hog price was 15 cents stronger to $77.68. The CME Lean Hog Index for 2/22 was 20 cents stronger at $77.73.
Pork cutout futures went into the weekend with Friday losses up to $0.45. USDA’s National Pork Carcass Cutout value was $85.35, down by 68 cents. USDA estimated FI hog slaughter for the week through Saturday at 2.375m head. That is down from 2.505 million last 2.492m head during the same week last year. The YTD total of 20.068m head is 1.3% ahead of last year’s pace.
Cattle
Monthly reports from NASS had the cattle herd numbers pegged at 11.704m head on Feb 1 for the 1,000+ head capacity feedlots. That was a tad bit over 4.1% loss YoY compared to the average estimate of -3.5%. January placements were shown at 1.932m head, a 3.6% drop YoY compared to the average 2.9% expectation. The report had 1.847m head marketed in Jan, a 4.2% increase compared to the expected 3.9% increase. USDA mentioned 1,000+ head feedlots made up 82.5% of the total inventory on Jan 1, which was up from almost 82% share last year.
In the Grains sector:
Wheat
USDA reported 339K MT of wheat was sold for export during the week that ended 2/16. That was up from 209k MT last week, as a 4-wk high led by sales to the Philippines. By class, the report had 36% of the total sale as HRS with 24% each for white and HRW. Old crop wheat commitments were 16.85 MMT, trailing last year’s 17.98 MMT pace. New crop wheat has 413,461 MT on the books as of 2/16. The European Union took 400k MT off their wheat production estimates citing multiple reasons ranging from the war in Ukraine to weather and now at 126 MMT, and among other reasons calling out low soil moisture reserves into the growing season.
Beans
Soymeal sales were 65.5K MT for the week that ended 2/16, which was below estimates. Accumulated meal commitments were 7.553 MMT as of 2/16. Soybean oil bookings for the week were shown as 755 MT of net cancelations. Soy oil commitments were just under 51K MT as of 2/16. The BAGE lowered their estimate for Argentina’s soybean crop by 4.5 MMT to 38 MMT.
Corn
USDA’s FAS reported a 20% drop in weekly corn bookings with the first sub-1 MMT booking in 4 weeks. The Export Sales report had 823k MT of sales, which was within the range of estimates, as Japan bought 312k MT (including 137k MT switched from unknown) and Mexico booked 290k MT. The old crop book numbers are lower by 40% YoY and include 14.36 MMT of shipments and 14.28 MMT of outstanding sales. For new crop corn, there is 1.563 MMT on the books as of 2/16. Meanwhile, Brazil’s 2023 ethanol output is expected to increase 5.4% citing a better sugar crop and the need for domestic production following tariff implementation on U.S. ethanol. It is estimated that over half of Brazil’s 2nd crop corn has missed the “ideal planting window” as 18.2% of Parana fields. Argentina Corn crop estimates have also seen a lowered reading.
Read Full Story »»»
DiscoverGold
Today's Futures Heat Map • Weakest: Platinum, Wheat, Copper, Palladium
By: Barchart | February 24, 2023
• Today's Futures Heat Map
Strongest: Natural Gas, Orange Juice, Heating Oil, Lumber
Weakest: Platinum, Wheat, Copper, Palladium

Read Full Story »»»
DiscoverGold
Sugar in the Red: Just a Bump or Is the Sweet Ride Over?
By: Investing.com | February 24, 2023
• Sugar in the red for Feb after rallying from end-Sept through Jan
• Sweetener gained 22% in four months; now Feb slide less than 1%
• Some analysts say output is building, and this could weigh on sugar prices
• Others predict a deeper technical slide to allow the market to ‘recharge’
After a sweet four-month ride, those long sugar are seeing red for the first time in February as good or active cane harvests in Brazil to Thailand trigger profit-taking among investors fearing higher output.
February's setback in New York-traded raw sugar futures is modest: With just two sessions left for the month, the market is off less than 1%. That too after a rally of 22% from end-September through January that came with cherry topping in the form of a six-year high of 21.82 cents a lb.
In Thursday’s trade, sugar futures front-month contract for March settled at 21.58 a lb. As of this writing, the commodity trades marginally higher, at 21.68 a lb.
So, is this slide just a bump or is the sweet ride about to end?
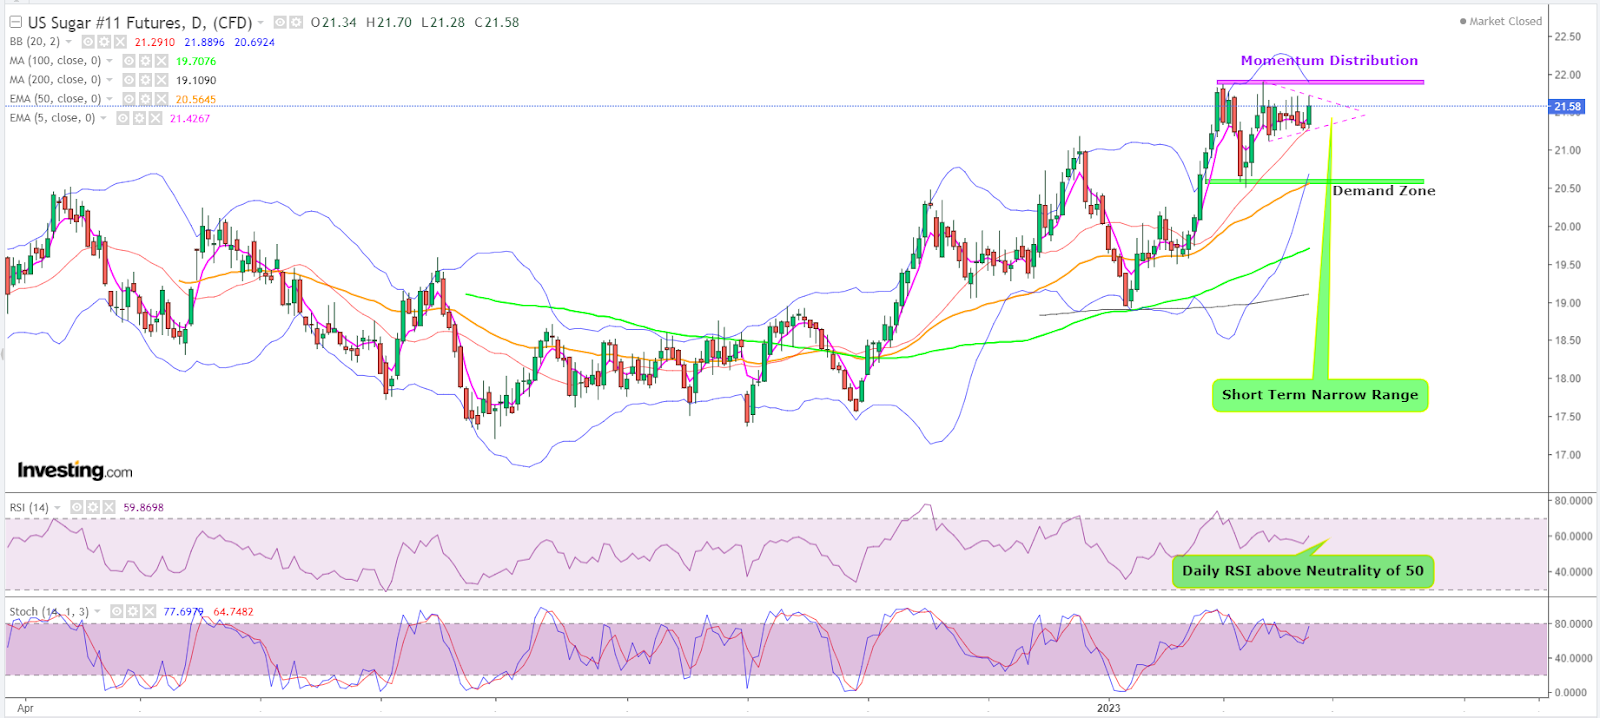
Sugar Daily Chart
Charts by SKCharting.com, with data powered by Investing.com
At the outset, there doesn't seem to be too much that can severely disrupt the momentum of the past four months or send the market completely in the reverse.
Yet, some analysts are cautioning that production is building. Others are citing the possibility of a further technical slide before bulls can regroup at the lower level to charge higher.
Output-wise, good progress is seen in the crop in major growing countries Brazil and Thailand, said Jack Scoville, chief crop analyst at Chicago’s Price Futures Group. He adds:
“Thailand expects to export 9.0 million tons of sugar in the current crop year, 7% more than last year. Ideas are that the market has also priced in production losses in India and Brazil.
Good production prospects are seen for crops in central and northern areas of Brazil, but the south has seen drier weather. There is concern that the rainy areas will stay too wet and delay the harvest and dilute the sugar concentrations in the cane in central areas. The harvest is active in Thailand. Australia and Central America harvests are also active while European production is expected to be reduced again this year.”
India, the world's second-largest sugar exporter, is likely to produce 34 million tonnes of the sweetener in 2022/23, down 7% from the previous forecast, a leading trade body said at the end of January.
The rally from a month ago was also helped by speculation that top exporter Brazil might also produce less if its energy policy improves ethanol's profitability.
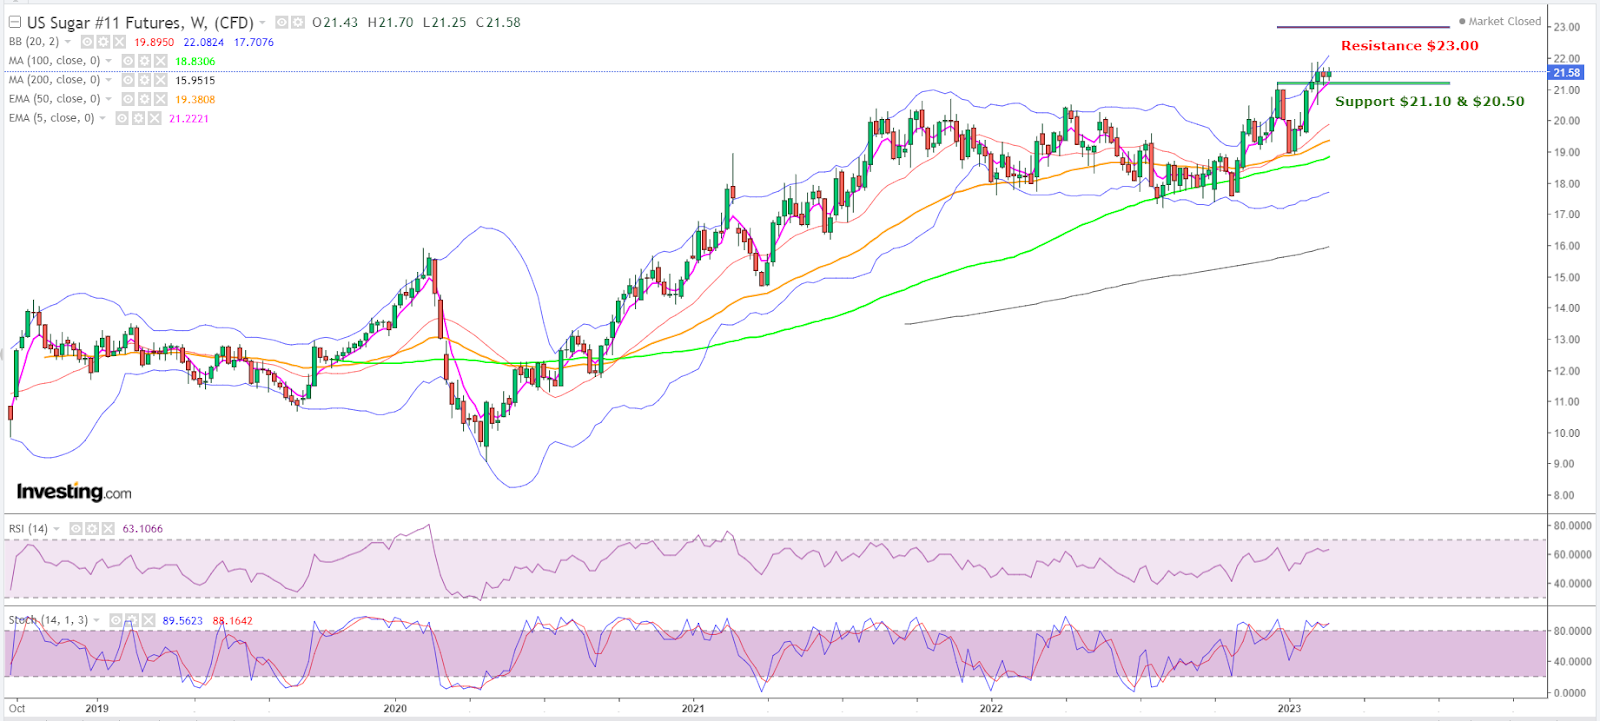
Sugar Weekly Chart
On the charts side, sugar futures are strong enough on daily, weekly and monthly time frames to sustain their broadly bullish perspective, said Sunil Kumar Dixit, chief technical strategist at SKCharting.com.
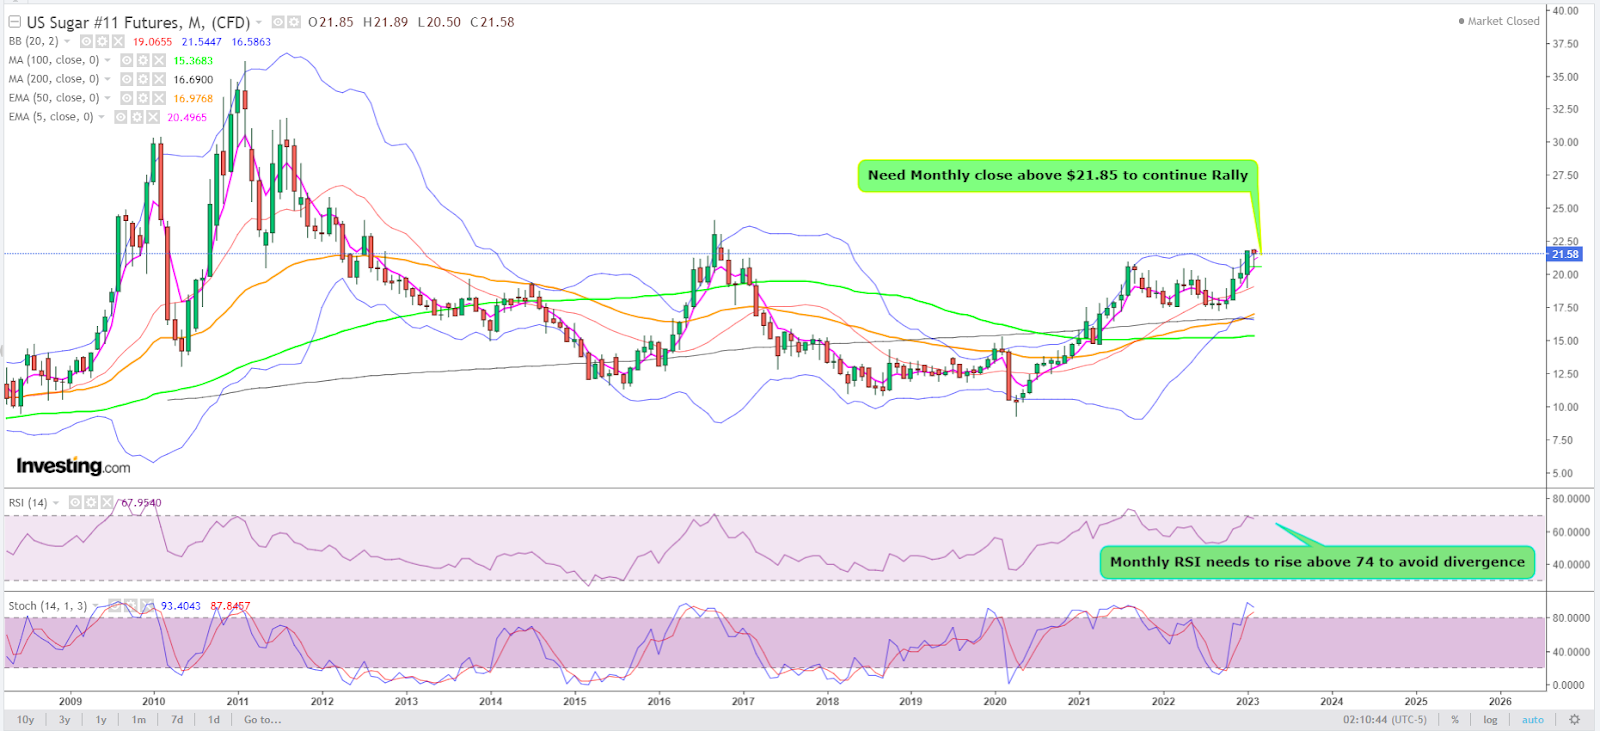
Sugar Monthly Chart
But he also cautioned that the market could retest support at the lower 21-cent level to find energy for a push higher, adding:
“Daily chart is nearly done with momentum distribution supported by the Relative Strength Index at above neutrality of 50 while Stochastics at 77/64 are firmly positioned.
But prices could also be awaiting a break above the symmetrical triangle resistance of 21.75 cents. The alternative is a retest of support at $21.40 before uptrend resumes with targets of 23 cents and 24.10 cents.”
Read Full Story »»»
DiscoverGold
Grains Report: Wheat, Rice, Corn and Oats, Soybeans
By: Jack Scoville | February 24, 2023
• WHEAT
General Comments: Wheat markets were mostly lower yesterday on newss that USDA estimated planted area very high for the coming productiio and on ideas that big Russian offers and cheaper Russian prices would be a feature for a while in the world market. News that Russia has launched a new offensive in Ukraine provided much of thew support this week. Russia appears to be sending three divisions across the border to fight and it looks as though this could be a major operation for the Russian army. Wire report now suggest that Russia has now committed almost its entire army to the war. Fears of deliveries of Wheat from the Black Sea will be cut significantly are surfacing again. Ideas are that both Australia and Russia are harvesting record to near record Wheat crops this year. Russia is said to be plotting a huge new invasion of Ukraine that could prevent farmers in Ukraine from harvesting Wheat and planting Corn. Russia has a large production and is undercutting most world prices in the international market. However, Russian production estimates have dropped recently. The demand for US Wheat in international markets has been a disappointment all year and has been hindered by low prices and aggressive offers from Russia. Ukraine is also looking for new business for its crops and Russia is aggressive in the world market as it looks for cash to fund the war.
Overnight News: The southern Great Plains should get mostly dry conditions. Temperatures should be below normal. Northern areas should see big snows. Temperatures will average below normal. The Canadian Prairies should see mostly dry conditions. Temperatures should average below normal.
Chart Analysis: Trends in Chicago are mixed to down with obj3ectives of 704, 698, and 689 March, Support is at 733, 721, and 713 March, with resistance at 744, 755, and 760 March. Trends in Kansas City are down with objectives of 848 March. Support is at 859, 849, and 842 March, with resistance at 871, 877, and 884 March. Trends in Minneapolis are mixed to down with objectives of 900, 876 and 867 March. Support is at 902, 896, and 890 March, and resistance is at 915, 919, and 928 March.
• RICE:
General Comments: Rice was lower again yesterday as the market is in a free fall from recent highs near 1800 March. USDA forecast a jump in production and demand yesterday with a fall in prices. It looks like traders took the fall in prices to heart and tried to make it true for anytime after yesterday. Reports indicate that the farmers have been selling and ideas are that they might dump on the market if they think a big crop is coming at the end of the new growing season that is now getting ready to start in southern growing areas. Demand has been good from domestic sources. Export demand has been uneven. Demand has been an issue for the market all year. There is not much going on in the domestic market right now although mills are milling for the domestic market in Arkansas and are bidding for some Rice. Markets from Texas to Mississippi are called quiet. Demand in general has been slow to moderate for Rice for exports and solid for domestic uses.
Overnight News: The Delta should get mostly dry conditions. Temperatures should be below normal.
Chart Analysis: Trends are down with no objectives. Support is at 1666, 1652, and 1640 March and resistance is at 1699, 1723, and 1746 March.
• CORN AND OATS
General Comments: Corn closed sharply lower in response to the USDA Outlook Conference that showed inceased planted and harvested area and increased yields for potential production of more than 15 billion bushels and the second biggest crop on record and partly on the charts as price trends turned down and some big support areas were broken. US prices are currently very competitive with those from South America and US demand has improved because of the price differentials. Prices from South America should now remain strong as countries there concentrate on Soybeans exports, so the US has chance now to see export demand improve more than it has already. The export demand remains well behind the pace to make USDA objectives. Brazil has been hanging on for its Summer crop although losses are now being reported. Argentina has suffered through some extreme drought and losses could be large. The Brazil Winter crop is harvested and China has been buying the surplus. The Summer crop and the Argentine crop is developing under stressful conditions. The next Winter crop is going into the ground in good conditions, but it has been wet so the Soybeans harvest has been delayed and the Corn planting is becoming delayed as well. There are concerns about demand with the Chinese economic problems caused by the lockdowns creating the possibility of less demand as South America has much better crops this year to compete with the US for sales. China is now moving rapidly to open the economy and allow people to move around with no lockdowns so the demand could start to improve
Overnight News:
Chart Analysis: Trends in Corn are down with objectives of 651, 642, and 636 March. Support is at 654, 649, and 647 March, and resistance is at 669, 673, and 676 March. Trends in Oats are mixed. Support is at 360, 357, and 348 March, and resistance is at 375, 3782, and 389 March.
• SOYBEANS
General Comments: Soybeans and Soybean Oil were lower, but Soybean Meal closed higher. The market is weaker in response to the USDA Outlook Conference reports that showed planted and harvested area the same as last year and increased yields for increased production and in anticipation of the South American harvest coming to export channels in the near term. It remains hot and dry in Argentina and southern Brazil and crop conditions are getting worse. However, weather is becoming less important now as the harvest is already underway in central and northern Brazil and will spread south soon. Central and northern Brazil have seen harvest operations interrupted with too much rain. Soybean Meal saw strong weekly export sales as Argentina is having to withdraw from the market for Soy products sales due to the drought in the country and the fact that they have already sold a lot of Soybeans into the world market. They are now buying from Brazil. The harvest in Brazil is slowly expanding in central and northern areas. These areas have seen too much rain and the harvest has been slow. Production potential for the Brazil is called very strong even with potential problems and losses in the south. Argentine production ideas continue to drop with the drought as planting is delayed and the crops already in the ground are stressed. Ideas that Chinese demand will improve, but this could take a few more weeks as a very large part of the population now has Covid. This has delayed a robust economic return for the country.
Overnight News:
Chart Analysis: Trends in Soybeans are mixed. Support is at 1532, 1517, and 1511 March, and resistance is at 1556, 1562, and 1574 March. Trends in Soybean Meal are mixed. Support is at 488.00, 478.00, and 472.00 March, and resistance is at 501.00, 508.00, and 514.00 March. Trends in Soybean Oil are mixed to up with objectives of 6350, 6710, and 6950 March. Support is at 6100, 6070, and 5960 March, with resistance at 6360, 6520, and 6500 March.
Read Full Story »»»
DiscoverGold
Softs Report: Cotton, OJ, Coffee, Sugar, Cocoa
By: Jack Scoville | February 24, 2023
• COTTON
General Comments: Cotton was a little higher in consolidation trading yesterday. USDA forecast a significant reduction in US planted area for Cotton in its outlook conference yesterday. Futures are still showing bad demand fundamentals as the weekly export sales reports have shown moderate sales at best. Some ideas that demand could soon increase as China could start to open its economy in the next couple of months as Covid outbreaks should start to weaken as people get vaccinated or immune. Covid is now widespread in China so the beneficial economic effects of the opening are being delayed but these effects should start to be felt as the people there achieve immunity over the next week or two.
Overnight News: The Delta will get mostly dry conditions and above normal temperatures. The Southeast will see isolated showers and above normal temperatures. Texas will have mostly dry conditions and near normal temperatures. The USDA average price is now 80.12 ct/lb. ICE said that certified stocks are now 1,147 bales, from 8,900 bales yesterday. ICE NY said that 0 notices were posted for delivery against March contracgts and that total deliveries for the month are now 0 contracts. USDA said that weekly net Upland Cotton export sales were 435,300 bales this year and 11,900 bales next year. Net Pima sales were 1,400 bales this year and 0 balex next year.
Chart Trends: Trends in Cotton are mixed. Support is at 80.80, 80.50, and 80.10 May, with resistance of 83.50, 83.90 and 84.50 May.
• FCOJ
General Comments: FCOJ was higher yesterday as production remains the overriding force. Historically low estimates of production due in part to the hurricanes and in part to the greening disease that have hurt production, but conditions are significantly better now with scattered showers and moderate temperatures. The weather remains generally good for production around the world for the next crop including production areas in Florida that have been impacted in a big way by the two storms seen previously in the state. Brazil has some rain and conditions are rated good. Brazil continues to export to the EU and is increasing its exports to the US. Mexico is also exporting to the US. Even so, the Florida Dept of Citrus reported that inventories are still 40.6% below last year at 102.39 million pounds.
Overnight News: Florida should get mostly dry conditions. Temperatures will average above normal. Brazil should get scattered showers and near normal temperatures.
Chart Trends: Trends in FCOJ are mixed to up with no objectives. Support is at 234.00, 229.00, and 220.00 March, with resistance at 249.00, 253.00, and 256.00 March.
• COFFEE
General Comments: New York and London closed lower yesterday in correction trading after the big rally this week tied to higher differentials in Brazil caused by a lack of offers from producers. Producers are not offering right now and the market wonders how much Coffee is left in the country. Ideas of big production for Brazil continue due primarily to rains falling in Coffee production areas now. Vietnam is estimated to have veery good production this year due to a good growing season and less rain now as harvest expands again. There are ideas that production potential for Brazil had been overrated. The weather in Brazil is currently very good for production potential but worse conditions seen earlier in the growing cycle hurt the overall production prospects as did bad weather last year.
Overnight News: ICE certified stocks are lower today at 0.809 million bags. The ICO daily average price is now 180.91 ct/lb. Brazil will get scattered showers with near to above normal temperatures. Central America will get scattered showers. Vietnam will see scattered showers. ICE NY said that 0 contracts were tendered for delivery against March futures and that total deliveries for the month are now 572 contracts.
Chart Trends: Trends in New York are up with objectives of 209.00 May. Support is at 190.00, 187.00, and 184.00 May, and resistance is at 201.00, 205.00 and 206.00 May. Trends in London are up with no objectives. Support is at 2130, 2090, and 2080 May, and resistance is at 2210, 2250, and 2280 May.
• SUGAR
General Comments: New York and London closed higher yesterday as traders continue to factor in production losses in India and Brazil and other locations as well. Indian production is thought to be 33 million tons this year or less and the market has had to ration that supply via price. Thailand expects to export 7% more than last year. Good production prospects are seen for crops in central and northern areas of Brazil, but the south has seen drier weather. There is concern that the rainy areas will stay too wet and delay the harvest and dilute the Sugar concentrations in the cane in central areas. The harvest is active in Thailand. Australia and Central America harvests are also active. European production is expected to be reduced again this year.
Overnight News: Brazil will get scattered showers. Temperatures should average near to above normal. India will get mostly dry conditions and near to above normal temperatures.
Chart Trends: Trends in New York are mixed to up with objectives of 2040 and 2080 May. Support is at 1990, 1960, and 1940 May and resistance is at 2050, 2080, and 2110 May. Trends in London are mixed. Support is at 564.00, 557.00, and 549.00 May and resistance is at 578.00, 582.00, and 588.00 May.
• COCOA
General Comments: New York and London closed mostly a little lower yesterday in correction trading as West African exporters are not offering. Wire reports suggest that exporters are currently looking for Cocoa to make good on current contracts and are not entering into new contracts right now. However, the Ivory Coast Cocoa and Coffee Council said that there will be more than enough Cocoa for export and that exporters can fix contracts. Trends have turned up in both New York and London. Talk is that hot and dry conditions reported in Ivory Coast could curtail mid crop production, but main crop production ideas are strong. Ghana has reported a disease in its Cocoa to hurt production potential there. The rest of West Africa appears to be in good condition. Good production is reported for the main crop and traders are worried about the world economy moving forward and how that could affect demand. The weather is good in Southeast Asia.
Overnight News: Mostly dry conditions are forecast for West Africa. Temperatures will be near normal. Malaysia and Indonesia should see scattered showers. Temperatures should average near normal. Brazil will get scattered showers and near to above normal temperatures. ICE certified stocks are lower today at 5.053 million bags. ICE NY said that there were 0 notices posted for delivery against March contracts and that total deliveries for the month are now 221 contracts.
Chart Trends: Trends in New York are up with objectives of 2840 and 2860 May. Support is at 2700, 2670, and 2650 May, with resistance at 2810, 2840, and 2870 May. Trends in London are mixed. Support is at 2100, 2060, and 2040 May, with resistance at 2150, 217e0, and 2200 May.
Read Full Story »»»
DiscoverGold
Commodities’ Wild Ride: Spikes, Plunges, Re-spikes: Lithium, Lumber, Coal, Wheat, Copper, Steel, Iron Ore, Soybeans, Coffee, Corn
By: Wolf Richter | February 23, 2023
• Oh no, coffee! Commodities are not moving in lockstep.
We’re going to look at a few spectacular wild rides in commodities – but not including crude oil, gasoline, and natural gas which I discuss here separately quite a bit and in greater detail.
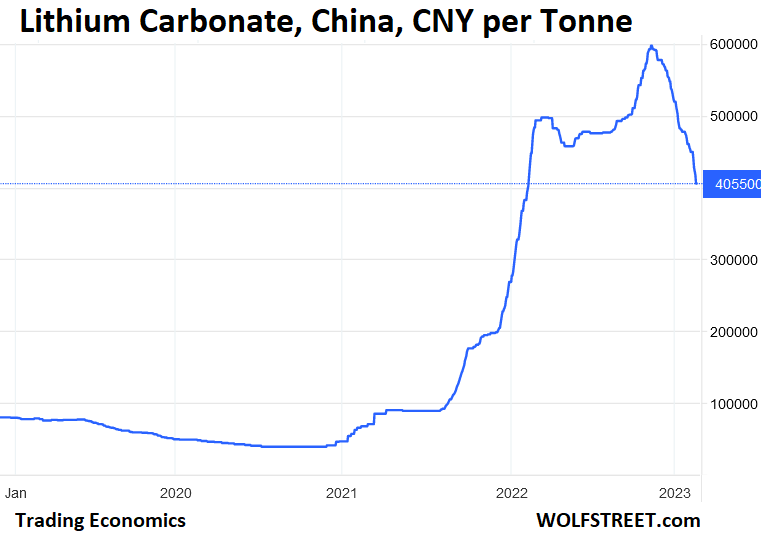
Lithium. Remember, just last year, the world was going to have a shortage of lithium carbonate, one of the key raw materials for EV batteries. With all the hype about supply shortages, and booming demand from manufacturers of EV batteries, the price of lithium carbonate spiked. The China lithium carbonate index, a benchmark price, exploded by a factor of 15 in two years, from CNY 40,000 per tonne in November 2020 to CNY 600,000 per tonne by November 2022. And then that was it.
New supply was being put on the map, including in Australia – makes sense at these crazy prices – and demand was strong but not that strong, and all that became clear late last year, and when the hype fizzled as it always does, the price began to plunge. At the moment at CNY 405,500, the price has plunged by 32% in two months, and is now below where it had been a year ago (all charts here via Trading Economics):
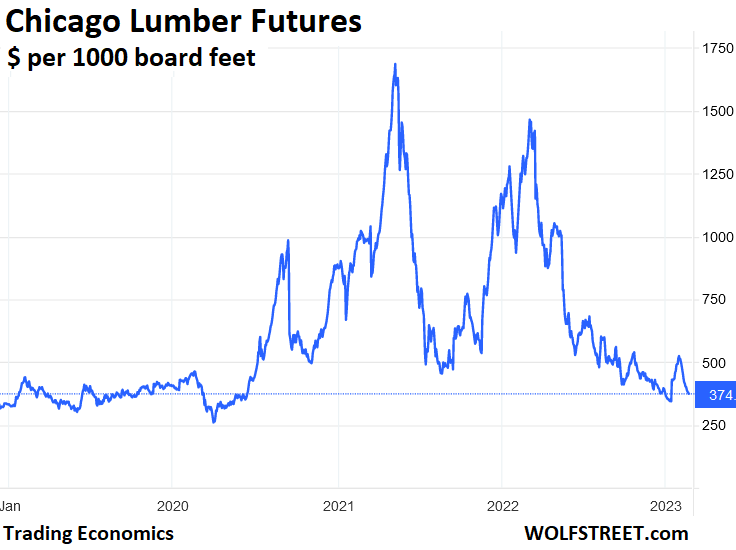
Lumber. The price of Chicago lumber futures went through epic gyrations during the pandemic, spiking by 350%, then plunging, then spiking all over again, the plunging all over again, and now it’s back where it used to be, currently at $374 per thousand board feet:
* * *
Read Full Story »»»
DiscoverGold
The Corn & Ethanol Report
By: Daniel Flynn | February 24, 2023
We kickoff the day with Core PCE Price Index MoM & YoY, Export Sales, PCE Price Index MoM & YoY and Personal Income at 7:30 A.M., New Home Sales MoM, New Home Sales, Michigan Consumer Sentiment Final, Michigan 5-Year Inflation Expectations Final, Michigan Current Conditions Final and Michigan Inflation Expectations Final at 9:00 A.M., Fed Jefferson Speech and Fed Mester Speech at 9:15 A.M., Baker Hughes Oil & Total Rig Count at 12:00 P.M., Cattle on Feed and Cold Storage at 2:00 P.M., Building Permits Final, Monetary Policy Forum and Building Permits MoM Final.
On the Corn Front a report of the Ohio toxic spill trainwreck could have been 100% preventable according to boots on the ground reports. The damage in soil and waterbeds will take years if not decades to fully recover and have acceptable readings. Any crops grown in the area will be and be carefully monitored for export, and the Ohio River locks remain closed until cleanup is underway and maybe longer. This may further disrupt barge traffic in the main arteries In the coming months sending barges to the New Orleans shipping region. We closed lower yesterday after the USDA projection for 91 million acres of corn was vied a negative for corn prices late in 2023 and selling pressure led by farmers and funds kicked into high gear. Corn bulls were not excited to see sizable supply numbers in the upcoming US crop year. However, they know that both acreage and yield numbers are far from settled. Traders will be waiting for Prospective Plantings on March 31st. In the overnight electronic session the March corn is currently trading at 654 ½ which is 5 ¾ cents lower. The trading range has been 662 ½ to 653 ½.
On the Ethanol Front production and consumption for ethanol as a transportation fuel grew significantly over the last three decades in the US before plateauing in recent years due to the pandemic. Meanwhile, the US Grains Council staff and Ethanol Advisory Team members traveled to Ottawa, Canada, from Jan31 to Feb2, 2023, to meet Canadian government officials and private stakeholders to discuss details related to the Canadian Clean Fuel Regulation released in July 2022. During this visit, the Council reiterated its enthusiasm and support for regulation and advised against further delay of clear guidance necessary for its successful implantation. Canada has been a significant growing market for US ethanol the past decade and the top destination the last three years setting racords. There were no trades or open interest in ethanol futures.
Read Full Story »»»
DiscoverGold
Give Or Take. The Energy Report
By: Phil Flynn | February 24, 2023
The Energy Information Administration (EIA) reported yesterday that US commercial crude oil inventories increased by 7.6 million barrels last week, give or take 15 million barrels or so. For the second week in a row, the EIA had a major crude oil adjustment to balance the books coming in at an astounding 2.073 million barrels a day or 14.511 million barrels. Last week the adjustment was an equaling puzzling 13.8 million barrels adjustment. These adjustments are way out of whack with historical norms and the EIA has said that typically the adjustment is less than 2% of refinery crude oil inputs. Last week crude inputs were at 15 million barrels so last week’s adjustment is closer to a 14.5% precent adjustment. Regardless, the EIA tells us that based off of that adjustment, U.S. commercial crude oil inventories are about 9% above the five-year average for this time of year. Just do not look at the SPR man behind the curtain. SPR Barrels are still 210.8 million barrels below a year ago.
The EIA also reported a surprise increase in distillate fuels which caused a big sell-off in ultra-low sulfur diesel futures before a late day incredible come back. Why the comeback? Perhaps because despite the fact that distillate fuel inventories increased by 2.7 million barrels last week, they are still 12% below the five year average for this time of year. That is not a comfortable place to be and as John Kemp of Reuters points out is a major problem.
Kemp writes that, “Global inventories of diesel and other distillate fuel oils are exceptionally low – meaning prices will surge higher again quickly if the economy avoids a recession in 2023. Inventories have risen modestly from troughs in October and November 2022 as a result of increased exports from China and the worldwide slowdown in manufacturing and freight transport. But stocks in most regions are still close to multi-decade lows and would deplete quickly in the event the manufacturing and freight cycle turns up again soon.
He points out further that, “U.S. distillate inventories were -16 million barrels (-12% or -0.95 standard deviations) below the prior ten-year seasonal average on February 17. Europe’s distillate stocks were -41 million barrels (-10% or -1.43 standard deviations) below the ten-year average at the end of January. Singapore’s distillate inventories were -3 million barrels (-30% or -1.53 standard deviations) below the ten-year average on February 19. U.S. jet fuel inventories (closely related to distillates) were -4.0 million barrels (-10% or -1.77 standard deviations) below the average on February 17, at the lowest seasonal level since 1996. Middle distillates including jet fuel account for roughly a third of all global petroleum consumption (36 million barrels per day out of total global consumption of 98 million in 2019). Kemp reminds us that, “Distillate fuel oil is the workhorse of the industrial economy, providing the main fuel used in trucking, railroads, manufacturing, construction, mining and oil and gas drilling.”
Now if you think you are getting a free pass at the gas pump if you use gasoline, you better think again. The EIA reported yesterday that, “Total motor gasoline inventories decreased by 1.9 million barrels from last week and are about 5% below the five year average for this time of year. Not only that the War in Ukraine is raising concerns about the availability of gasoline additives.
The Wall Street Journal reported that, “Some analysts said gasoline’s premium is poised to surge further because of a looming shortage of a petroleum product called vacuum gas oil, or VGO. VGO is essentially the sludge that remains after lighter and more valuable products are distilled by refiners out of crude oil. Complex refineries, like many in the U.S. and Europe, have the equipment to process VGO and turn it into gasoline. Simpler ones, like many in Russia, lack this capability. Until recently, Russia was the world’s largest exporter of VGO, and most of it went to the U.S. and Europe.
Now Western sanctions on Russia’s exports of refined products, which took effect earlier this month and which halted most European imports of VGO, could reduce the capacity of the U.S. and its allies to make gasoline. The sanctions’ potential impact on diesel supplies and prices is widely recognized, but it pales in comparison with the possible consequences on those of gasoline, some analysts have said.
By the way, according to the EIA, gasoline demand was up last week.
The Fed might not like that because they seem to be unhappy that people have jobs. In the Fed minutes they said that, “Participants stated that the continued tight job market would contribute upward pressure to inflation. Darn you people that have the gall to work. You’re running the Feds plans!
Yet while in the short-term oil is obsessed at looking at the small picture and short term increases in crude supply, the outlook looks like we are just in the eye of an energy crisis hurricane. Oil movements do not show signs of a recession yet. Oil Price dot com points out that China is buying oil like crazy. They say that China is on a global crude oil buying spree, snapping up oil from the U.S., U.A.E, Saudi Arabia, and Russia. Ten supertankers are heading to the U.S. aiming to take advantage of a “remarkable, profitable arbitrage” opportunity sparked by Biden’s SPR releases. The IEA noted in January that, “China will drive nearly half this global demand growth even as the shape and speed of its reopening remains uncertain.”
Oil Price goes on to say that, “On Tuesday, we got another indication of precisely that: Unipec, the largest oil trader in China and the trading unit of state-held refiner Sinopec, and PetroChina, the largest oil and gas producer and distributor in China, have both hired ten supertankers in March to haul US crude back to Asia, according to Bloomberg, citing people with direct knowledge of the matter. Each vessel can transport a whopping 2 million barrels of crude. The people said that the loading of the tankers is expected to occur across US Gulf Coast terminals. “Chinese buying activity of US barrels seems to be the hottest activity right now,” Viktor Katona, a lead crude analyst at Kpler, told Bloomberg. He said Chinese firms are taking advantage of a “remarkable, profitable arbitrage” for US crude that has been suppressed because of Biden’s massive releases from the Strategic Petroleum Reserve.
In the meantime climate craziness is making the world poorer and less secure. The Guardian reports that, “Soaring energy prices triggered by the Russia-Ukraine conflict could push up to 141 million more people around the globe into extreme poverty, a study has found. The cost of energy for households globally could have increased by between 62.6% and 112.9% since Russia’s invasion of Ukraine, according to a modelling study by an international group of scientists published in Nature Energy. The study modeled the impact of higher energy prices on the spending of 201 groups, representing different expenditure levels, in 116 countries, covering 87.4% of the global population. Despite efforts by governments to insulate consumers from price rises, researchers estimated that overall household expenditure rose by between 2.7% and 4.8%. As a result, they estimate that an additional 78–141 million people worldwide could be pushed into extreme poverty.
Save the Whales! Stop Offshore Wind Farms! While officials deny that offshore wind farms killed whales, now native Americans have problems with off-shore wind. Oil Price is reporting that, “The National Congress of American Indians (NCAI) is calling on the Biden Administration to halt all permitting and scoping for offshore wind projects until a comprehensive procedure to protect tribal interests is in place.
Natural Gas is trying to bottom. It is helpful that Freeport LNG is getting back in business and winter weather is not hurting either. The price crash more than likely is going to force some to rein in production especially as the cost associated with shale production keeps rising.
In the short term oil is still fighting off macroeconomic fears. But we think the tightness in the market is going to become obvious when we start to come out of maintenance. We still highly recommend to be hedged going into summer because there are significant upside risks to this market. Unless there is a severe economic slowdown, we are going to be undersupplied in just a few months.
The Phil Flynn Energy Report was halted yesterday due to the ice storm that knocked out power. Have a great weekend and stay inside and watch the Fox Business Network!
Read Full Story »»»
DiscoverGold
Sugar Rallies On Strength In Brazilian Real And Crude Oil
By: Barchart | February 23, 2023
May NY world sugar #11 (SBK23) on Thursday closed up +0.44 (+2.21%), and May London white sugar #5 (SWK23) closed up +7.70 (+1.36%).
Sugar prices Thursday rallied sharply to 2-1/2 week highs. Strength in the Brazilian real (^USDBRL) was bullish for sugar prices after the real Thursday climbed to a 2-1/2 week high against the dollar. The stronger real discourages export selling from Brazil's sugar producers.
Sugar also had support from Thursday's rally in crude oil (CLJ23) by more than +1%. Higher crude prices benefit ethanol prices and could prompt Brazil's sugar mills to divert more cane crushing toward ethanol production rather than sugar, thus curbing sugar supplies.
Sugar prices have carry-over support from last Friday when India said it wouldn't allow additional sugar exports beyond the 6.1 MMT it has already allowed this season. The government is concerned that a smaller Indian sugar crop could tighten domestic supplies this year, so it decided not to allow additional exports. However, sugar prices fell back from their best levels, with London sugar falling into negative territory, after the Indian Sugar Mills Association (ISMA) reported that India's 2022/23 sugar output from Oct-Feb 15 rose +2.8% y/y to 22.84 MMT.
Sugar prices have rallied sharply over the past month on concern about smaller global sugar production, with NY sugar posting a 6-1/4 nearest-futures high on Feb 10. On Jan 31, the Indian Sugar Mills Association (ISMA) cut its 2022/23 India sugar production estimate to 34 MMT from an Oct estimate of 36.5 MMT and cut its India 2022/23 sugar export estimate to 6.1 MMT from an Oct forecast of 9 MMT. In addition, the ISMA said that it sees India's sugar mills diverting 4.5-5.0 MMT of sugar to ethanol production in 2022/23. India is the world's second-largest sugar producer.
Reduced sugar production in Europe is a supportive factor for sugar prices. The European Association of Sugar Manufacturers on Dec 8 forecasted that EU 2022/23 sugar output would fall -7% y/y to 15.5 MMT.
A bearish factor for sugar is an increase in Thailand's sugar output. Green Pool Commodity Specialists on Monday said that Thailand's 2023 sugar production reached 6.59 MMT by Feb 8, up nearly +10% from last season, with sugar content in the cane crop at a record high. Thailand is the world's second-largest sugar exporter.
Strong Brazil sugar output is bearish for prices after Unica reported last Friday that Brazil's 2022/23 sugar production through January rose +4.5% y/y to 33.500 MMT. Brazil is the world's largest sugar producer.
A bearish factor for sugar was the Feb 1 projection from the Thai Sugar Mills Corp that Thailand's 2022/23 sugar production would climb +14% y/y to 11.55 MMT. Likewise, Thailand's 2022/23 sugar exports are projected to increase +17% y/y to 9.05 MMT.
In a bearish factor, the International Sugar Organization (ISO) on Nov 22 projected that global 2022/23 sugar production would climb +5.5% y/y to a record high of 182.1 MMT. Also, ISO projected that the 2022/23 global sugar market would be in a surplus of +6.2 MMT.
Read Full Story »»»
DiscoverGold
Coffee Prices Pressured By Dollar Strength
By: Barchart | February 23, 2023
May arabica coffee (KCK23) on Thursday closed down -3.65 (-1.89), and May ICE robusta coffee (RMK23) closed down -44 (-2.00%).
Coffee prices Thursday posted sharp losses after a rally in the dollar index to a 1-1/2 month high sparked long liquidation pressures in coffee futures.
On Wednesday, coffee prices rallied to 4-1/4 month highs on a lack of coffee for sale in the cash market after reports that Brazilian coffee farmers are withholding supplies for higher prices due to increased growing costs, especially fertilizers.
Signs of tighter coffee inventories are bullish for prices. ICE arabica coffee inventories fell to a 7-week low of 809,566 bags Thursday. Also, last Wednesday, the Green Coffee Association reported U.S. Jan green coffee inventories fell -1.8% m/m to 6.265 mln bags. Finally, robusta coffee inventories are shrinking as ICE-monitored robusta coffee inventories last Wednesday fell to 5,933 lots, the lowest since contract rules changed in 2016.
Smaller global coffee exports support coffee prices after the International Coffee Organization (ICO) reported on February 2 that Oct-Dec global coffee exports have fallen -2.8% y/y to 30.27 mln bags. Cecafe reported on February 9 that Brazil Jan green coffee exports fell -18.5% y/y to 2.52 mln bags. Coffee exports from Guatemala, the second-largest coffee producer in Central America, fell -8% y/y in January to 172,439 bags. Coffee exports from Colombia, the world's second-largest producer of arabica coffee beans, fell -19% y/y to 835,000 in January. Vietnam Jan coffee exports sank -27.7% y/y to 142,544 MT.
Coffee prices have support as recent heavy rain in Minas Gerais, Brazil's largest arabica growing region, has kept farmers out of fields and delayed the application of fertilizers and pesticides. The heavy rain has also increased coffee rust in some trees and may lower coffee yields. Somar Meteorologia reported last Monday that Brazil's Minas Gerais region received 63.4 mm of rain in the week ended February 12, or 126% of the historical average. Minas Gerais accounts for about 30% of Brazil's arabica crop.
Robusta has support after coffee trader Volcafe forecasted that the global 2023/24 robusta coffee market would see a record deficit of 5.6 mln bags as Indonesia, the world's third-largest robusta producer is expected to see its 2023/24 robusta coffee production fall to 9.1 mln bags, the smallest robusta crop in 10 years due to damage from excessive rainfall across its growing regions.
A bearish factor for arabica coffee is the recovery in ICE arabica coffee inventories. Since falling to a 23-year low of 382,695 bags on November 3, ICE arabica coffee inventories rose to a 7-1/4 month high of 891,933 bags on February 8.
The USDA, in its bi-annual report released on December 23, cut its global 2022/23 coffee production estimate by -1.3% to 172.8 mln bags from a June estimate of 175.0 mln bags. In addition, the USDA cut its 2022/23 global coffee ending stocks estimate by -1.7% to 34.1 mln bags from a June estimate of 34.7 mln bags. Meanwhile, the USDA's Foreign Agriculture Service (FAS) on November 22 cut its Brazil 2022/23 coffee production forecast by -2.6% to 62.6 mln bags from a prior estimate of 64.3 mln bags. This year was supposed to be the higher-yielding year of Brazil's biennial coffee crop, but coffee output this year was slashed by drought. By contrast, Conab on January 19 forecasted the 2022/23 Brazil arabica crop would increase +14.4% to 37.4 mln bags.
Read Full Story »»»
DiscoverGold
Top 5 Corn Outlook Points To Watch
By: Barchart | February 23, 2023
Top 5 corn outlook points to watch
• 1. US Demand. MY 22/23 domestic corn demand has been lethargic as feed and ethanol use has been declining. Despite the Ukraine supply shock, US corn exports have struggled as end users are procuring feed inputs from other origins. Global animal units are falling, and corn exports are declining.
• 2. Softening global production costs. Domestic and global fertilizer, diesel, natural gas, and propane prices are declining. This can limit price appreciation.
• 3. Brazil’s domination. Brazil is estimated to produce a record large 125.0 mmt corn crop and is forecast to be the world’s largest corn exporter. Last year China bought record volumes of Brazilian corn.
• 4. Global risk premiums. Despite the Russian invasion, Ukraine corn exports are overperforming. The MY 23/24 harvest remains a large and looming question. rising political tensions between the US and China, can help favor Brazilian corn.
• 5. Weather & Yields. Forecasters are predicting a neutral/ weak El Nino weather cycle which can translate to trend/above UC corn yields.
Read Full Story »»»
DiscoverGold
Top 5 Soybean Outlook Points To Watch
By: Barchart | February 23, 2023
Top 5 soybean outlook points to watch
• 1. US acres. US soybean acres can experience some year-on-year expansion should lag corn.
• 2. Brazil. Brazil is forecast to produce a record 153.0 mmt soy crop and export a record 92.0 mmt while China is increasing soybean production. The Brazilian real is weak against the US dollar. Does this slow US exports and US futures prices?
• 3. Renewable fuel demand. MY 22/23 domestic soy processor demand is robust and is being driven by soybean oil and renewable fuels. US soy crush capacity and renewable fuel refineries are expanding which is positive for basis and disappearance.
• 4. Argentina. Argentina is forecast to produce the smallest soy crop since MY 17/18. Soybean meal and oil exports are forecast to decline but the US has not seen material increases in export sales.
• 5. Weather and yields. A neutral ENSO climate pattern translates to trend US yields.
Read Full Story »»»
DiscoverGold
Today's Futures Heat Map • Weakest: Palladium, Copper, Coffee, Corn
By: Barchart | February 23, 2023
• Today's Futures Heat Map
Strongest: Natural Gas, Gasoline, Crude Oil, Sugar
Weakest: Palladium, Copper, Coffee, Corn

Read Full Story »»»
DiscoverGold
Deliveries on Metals/Nat Gas/Long Gilts/Sugar/Energies/Grains/Treasuries/Canola
By: The PRICE Futures Group | February 23, 2023
• Tomorrow, Feb 24th is LTD for Feb Metals and March Nat Gas.
• Mon, Feb 27th is FND for March Long Gilts.
• Tues, Feb 28th is LTD for Feb Cattle, March Sugar #11, March Heating Oil and RBOB.
• Tues, Feb 28th is FND for March MGEX Wheat, CBOT Grains, CBOT Treasuries, IFUS Canola and March Metals.
Read Full Story »»»
DiscoverGold
The Corn & Ethanol Report
By: Daniel Flynn | February 23, 2023
We kickoff the day with GDP Price Index QoQ 2nd Est, GDP Growth Rate QoQ 2nd Est, Initial Jobless Claims, Chicago Fed National Activity Index, Continuing Jobless Claims, Core PCE Prices QoQ 2nd Est, Jobless Claims 4-Week Average, PCE Prices QoQ 2nd Est, Real Consumer Spending QoQ 2nd Est, and GDP Sales QoQ 2nd Est at 7:30 A.M., EIA Natural Gas Storage at 9:30 A.M., Fed Bostic Speech at 9:50 A.M., EIA Energy Stocks at 10:00 A.M.,4-Week & 8-Week Bill Auction at 10:30 A.M., 7-Year Note Auction at 12:00 P.M. and Dairy Products Sales at 2:00 P.M.
On the Corn Front Rain in Brazil is forecasted to lighten up in the next 10 days, which will aid fieldwork in the region. Still precipitation in Central Brazil will slow planting in the same timeframe. Also, Mad Cow disease in Brazil halts beef exports to China. Rainfall will boost crop prospects in Bolivia and Paraguay. In Argentina, rain fell in northeastern Cordoba this week and showers are expected in the next two weeks in the western quarter of corn and soybean growing regions. Meanwhile, blizzard warnings are still in effect in the eastern Dakotas and western Minnesota. Temperatures are expected to drop to minus 25 degrees Fahrenheit. Conditions gradually improving through the morning but significant drifting is still likely. Winter weather advisories are in effect until 9:00 A.M. in parts of central Iowa where mixed precipitation is forecasted. Roads are expected to be icy and some power outages may occur due to ice on trees and power lines. In the overnight electronic session the March corn is currently trading at 674 ½ which is a ½ of a cent higher. The trading range has been 676 ¼ to 674.
On the Ethanol Front Rep. Randy Feenstra R-Iowa has reintroduced 3 bills that aim to support the US biofuels industry by comparing the costs of electric vehicles (EVs) and flex fuel vehicles (FFVs) fleets, supporting research and development for sustainable aviation fuel (SAF) and supporting development of biofuel fuel cells. All three bills were previously introduced during the 117th Congress. There were no trades or open interest in ethanol futures.
Read Full Story »»»
DiscoverGold
Today's Futures Heat Map • Weakest: Hard Red Wheat, Gasoline, Crude Oil, Lean Hogs
By: Barchart | February 22, 2023
• Today's Futures Heat Map
Strongest: Natural Gas, Coffee, Orange Juice, Cotton
Weakest: Hard Red Wheat, Gasoline, Crude Oil, Lean Hogs

Read Full Story »»»
DiscoverGold
Tightness In Sugar Pushes The Price To A Multi-Year High
By: Barchart | February 22, 2023
My Q4 2022 soft commodity review on Barchart highlighted sugar’s close at 20.04 cents per pound on December 30, 2022. Looking forward to 2023, I wrote, “Soft commodities are agricultural products, and worldwide inflation is increasing production costs.” Nearby sugar futures reached a 17.20 cents per pound low in August 2022 and have made higher lows and higher highs over the past months. I expect the bullish trend to continue at the 21.32 cents per pound level on the expiring March futures on February 22, but the road to higher highs could be bumpy.
The Teucrium Sugar ETF (CANE) tracks the price of a portfolio of the sweet commodity futures higher and lower.
Sugar reaches a new multi-year high
As the global pandemic gripped markets across all asset classes in April 2020, nearby ICE world sugar futures fell to 9.05 cents per pound, the lowest price since August 2007.

The twenty-year chart highlights that world sugar futures have made higher lows and higher highs since the April 2020 low, with the latest peak in February 2023 at 20.89 cents per pound, the highest price since November 2016.
The forward curve displays supply tightness
The forward curve, or sugar futures prices for deferred delivery, reflects short-term supply concerns.

As the chart shows, sugar prices for deferred delivery are progressively lower. While the nearby contract was over the 21.40 cents per pound level on February 22, free-market sugar for delivery in October 2025 was below 16.30 cents.
The backwardation, or progressively lower prices, highlights nearby market tightness. Backwardation assumes that producers will increase output to address supply concerns, and it also reflects that higher nearby prices will dampen the demand, adjusting future prices lower.
Production costs are rising
Inflation is increasing production costs for all commodities, and sugar is no exception. Rising labor, energy, transportation, fertilizer, and other input costs put upward pressure on all agricultural commodities and other raw material prices.
The most recent January U.S. consumer and producer price index data showed that inflation remains at the highest level in decades, with CPI and PPI coming in above the consensus forecasts. Food and energy prices have played a central role in pushing inflation higher. While interest rate hikes and other monetary policy tools address the economic condition, which has declined over the past months, monetary policy is most effective in fighting demand-side inflationary pressures. The supply side can be immune to interest rate hikes and other central bank policies.
When it comes to world sugar, Brazil is the world’s leading producer and exporter. Labor and other costs are highly sensitive to the local currency, the Brazilian real. Since sugar futures trade in U.S. dollar terms, the currency relationship between the dollar and the real can impact sugar prices. When the real moves higher against the dollar, output costs rise...
Read Full Story »»»
DiscoverGold
The Corn & Ethanol Report: Learning US GM Crops Are Growing Abroad
By: Daniel Flynn | February 22, 2023
We kickoff the day with MBA 30-Year Mortgage Rate, MBA Mortgage Market Index, MBA Mortgage Refinance Index, MBA Purchase Index and MBA Mortgage Applications at 6:00 A.M., Redbook YoY at 7:55 A.M.,2-Tear FRN Auction and 17-Week Bill Auction at 10:30 A.M., 5-Year Note Auction at 12:00 P.M., FOMC Minutes at 1:00 P.M., Milk Production at 2:00 P.M., and Energy Stocks at 3:30 P.M.
On the Corn Front China’s Ministry of Agriculture and Rural Affairs vowed on Tuesday to further expand the scope of pilot projects for the industrialization observers called a significant step to the legalization of GM crops in the world’s second largest economy amid efforts to bolster its food and security. The ministry also stressed efforts to strengthen supervision of the technology in accordance with the law. Efforts such as accelerating breakthroughs in key technologies and expanding soybean production areas are highlighted in the statement. “China will promote GM pilot projects inline with the international standards in an orderly manner this year, and if trials go smoothly and successfully legalization may take place this year,” Li Guoxlang, a research fellow at the Chinese Academy of Social Sciences, told the Global Times on Tuesday. However, Li stressed that the test will only involve animal feed rather than human food , due to uncertainties and safety concerns. “China has conducted careful preparations and strict evaluations for domestic planting of GM crops for many years, and it won’t take a “huge jump” in the area as some media predicted,” Li said. This information source was Shen Weidu and the Global Times. Meanwhile, Brazil rains have delayed harvest, and planting of the second corn crop. Showers provide some relief in the growing ragions of Argentina and across Brazil’s RIO Grande do Salin in the week -ending Feb 18th, but showers need to continue in order to improve crop conditions reporting Krissy Klinger with Successful Farming. In the overnight electronic session The March corn is currently trading at 678 ¼ which is 2 ¼ cents lower. The trading range has been 681 ½ to 677 ¾.
On the Ethanol Front the government of Japan at the beginning of the month issued proposed biofuel standards for 2023-2027 that address both ethanol and sustainable aviation fuel (SAF). The USDA predicts increased ethanol demand through 2030. An Iowa bill aims to implement new requirements for CO2 pipelines. The Iowa Fuels Association has spoken out against the legislation. This just shows the interest in biofuels, corn, ethanol and soybeans in the coming days or years. There were no trades or open interest in ethanol futures.
Read Full Story »»»
DiscoverGold
Agriculture Master Report
By: Bill Moore | February 22, 2023
MAR BEANS
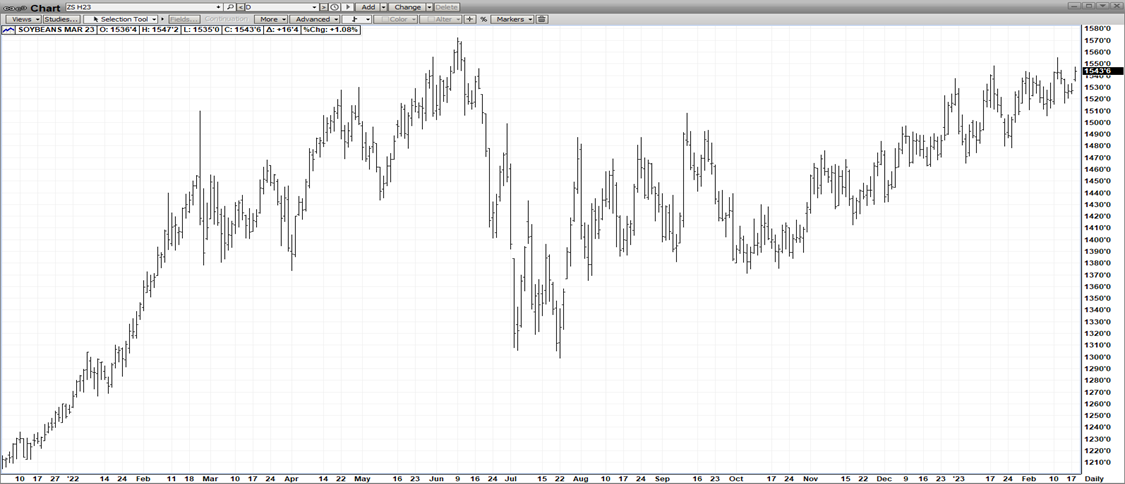
A continuing drought in Argentina opened the mkt higher – but macro concerns about the Feds ongoing program of raising interest rates to combat decades-high inflation pared the gains – however, the mkt has clawed its way back to just a few cents from the highs! A short but busy week ahead – with the Fed releasing its minutes from the recent FOMC on Wed, the USDA AG OUTLOOK FORUM on Thur & the annual 1 year anniversary of the Russian invasion of Ukraine on Fri! The mkt will continue to key on the Arg drought, the record crop in Brazil, the potential renewal of the Corridor Pact at the end of this month and the potential of improved exports with a cheaper dollar & a re-opening China!
MAR CORN
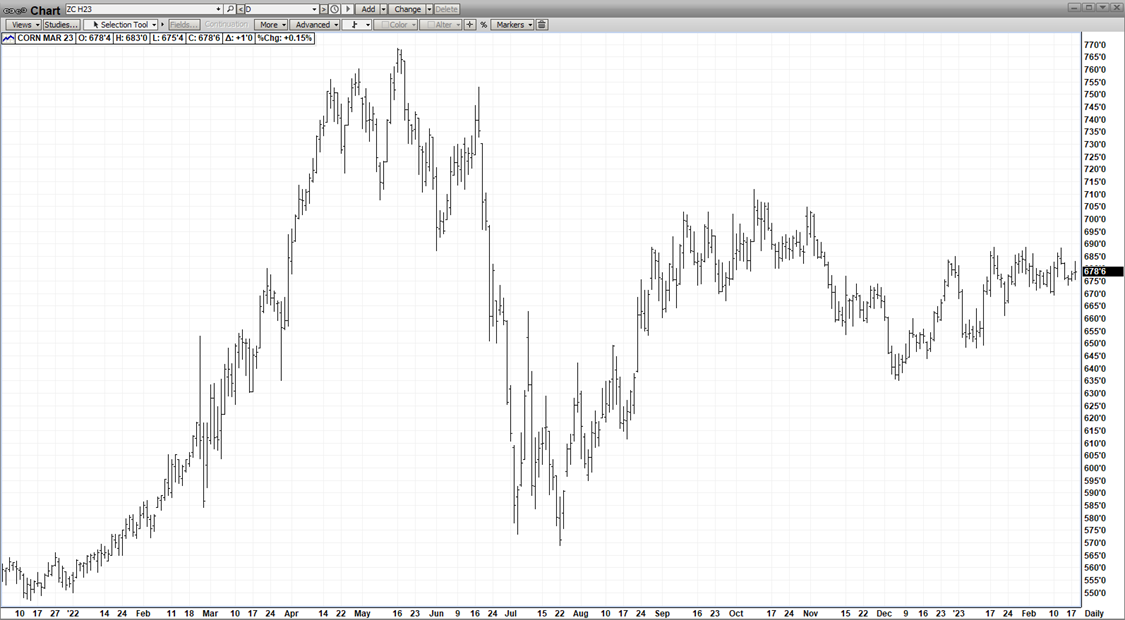
As you can see, the mkt is locked in a tight congestion pattern – positive & negative forces are perfectly offsetting each other! Today is a perfect example as a dry Argentine forecast opened the mkt higher after the 3-day W/E – then a sharply lower DJI & a higher US $$ sold the mkt off – it has since recovered to trade 2-3 higher! From a “big picture” scenario, the sheer fact that the mkt is able to hover just under $7.00 for this time of the year is quite impressive! A shaky economy & a record Brazil crop are providing headwinds but the Arg Drought & the improved export likelihood are supplying tailwinds! The 6-7 year low global stocks that were NOT enhanced by disappointing crops from both hemispheres – continue to underpin the mkt! The annual USDA AG OUTLOOK FORUM starts on Thur & is projecting 90.9MA (ly – 88.6) & production at 14.888BB (ly – 13.730). Soy acres are pegged at 88.6MA (ly – 87.5) & soy production at 4.510 (ly – 4.276).
MAR WHT
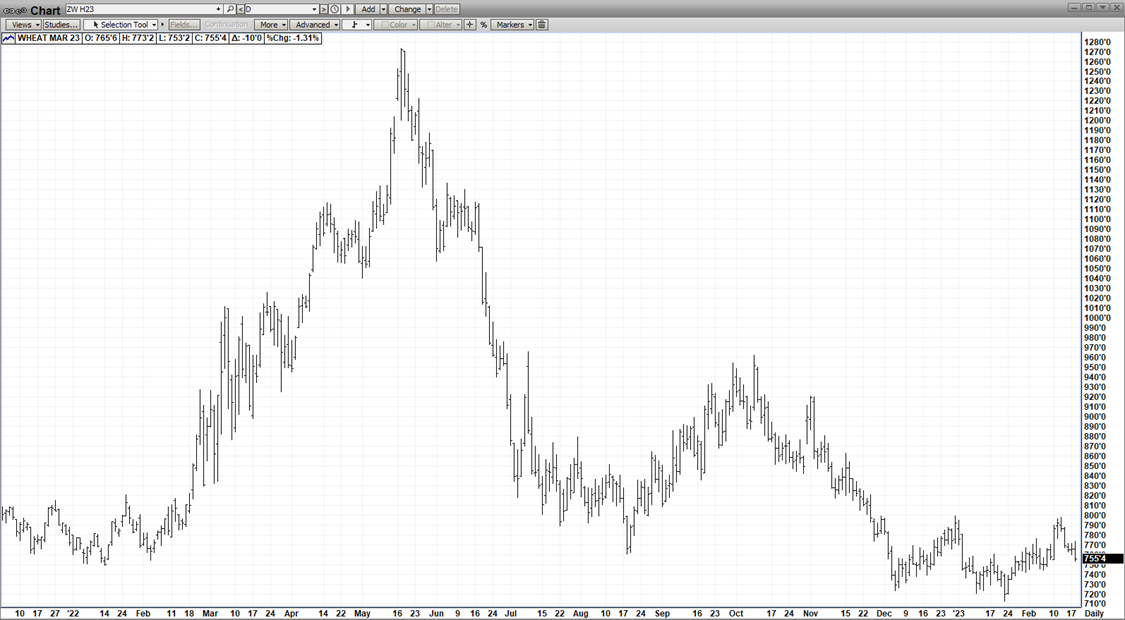
Today’s disappointing mkt action in the wheat – against positive gains in the Beans & Corn is perfect example of how the Russian Wheat Export dominance is insulating the wht mkt from everything else! Their record crop followed by the inundation of their cheap wht onto the export mkt has kept the lid on wht futures – regardless of any positivity from its sister mkts – corn & beans! Even dry pockets in France, Algeria & Morocco weren’t enough today to nudge the Mar Wht into positive territory!
APL CAT
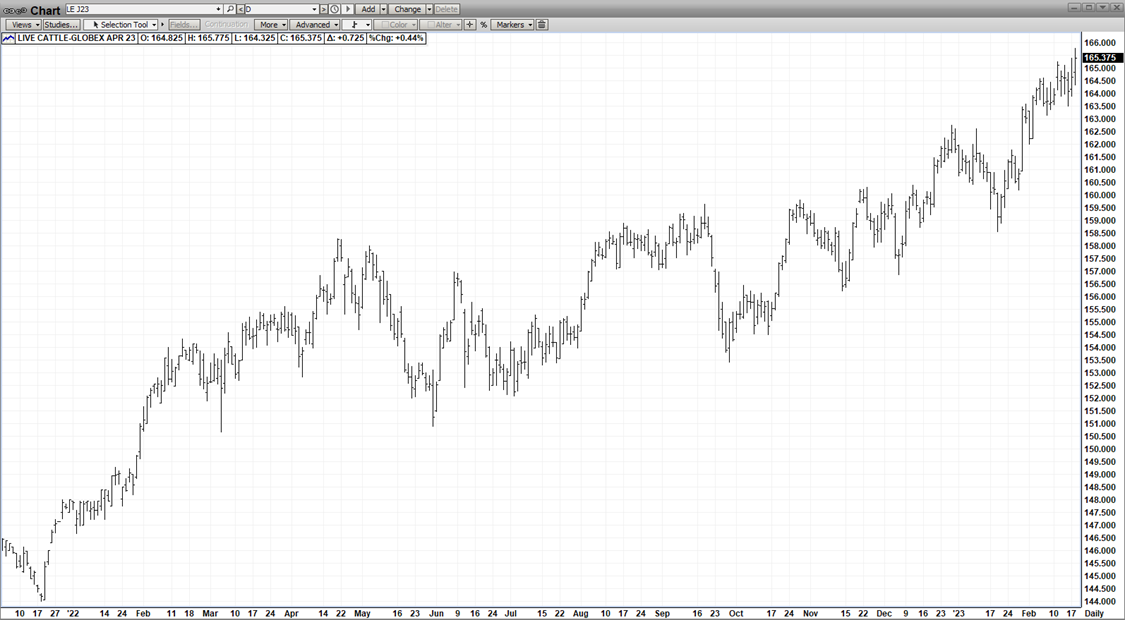
The relentless “supply bull” that is Apl Cat keeps on chugging – fed by 8% lower beef production last week over 2022, a strong beef mkt, strong exports from last Thursday’s report & good-enough demand! Once again, the dramatic reduction in production from the 4th to the 1st Qtr has set the stage for continuing this Bull! Given the historical high level, the corrections are frequent but mostly consist of tight consolidation – which are able to relieve the “overbought condition”!
On Friday at 2pm, two major livestock reports – a Cattle-on-Feed & a Cold Storage report will be issued – which could force some profit-taking & and back-and-forth as the mkt awaits fresh info from the USDA!
APL HOGS
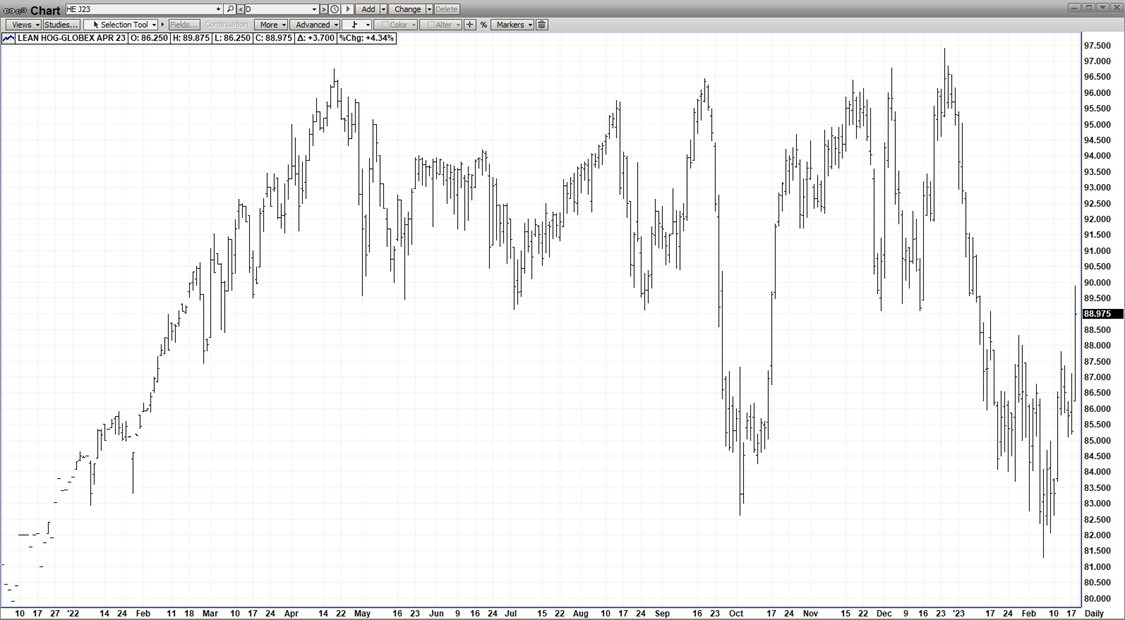
Enough really is enough! After getting absolutely decimated for the past two months, April Hogs scored a “spike low” on 2-7-23 at $81.00 and since then have rallied a whopping $8.00! Today, the mkt has soared on the strength of last weeks jump in pork cut-out! The “supply bear” that has been April Hogs looks to have run its course – as the heavy supplies have been dialed in! Ultimately, the consumer triggered the turn-around – opting for very cheap pork chops versus high-priced steaks! The mkt might well take a breather after today’s action – in advance the Cold Storage & Cattle-on-Feed Reports due out Friday!
Read Full Story »»»
DiscoverGold
Recession Obsession. The Energy Report
By: Phil Flynn | February 22, 2023
The oil market still has a recession obsession. Oil prices were under pressure as rate fears are raising larger concerns of oil demand destruction even as the signs are showing just the opposite. Not only did JODI yesterday say that global oil demand hit an all-time high in December, but warnings from at least one Fed Official that the market is too pessimistic on the outlook for the economy.
Chief Executive Officer of the Federal Reserve Bank of St. Louis James Bullard says that the markets are overpricing the risk of recession. If that is the case, then oil is very underpriced. Oil prices have been held back on fears that rising interest rates will cause a recession and reduce demand. The comments gave oil a bit of a boost after selling off on a stronger dollar and weak treasuries.
Oil traders are still debating whether China’s reopening will leave the globe undersupplied. Argus Media is reporting that Opec secretary-general Haitham al-Ghais sees “positive signs” when it comes to the reopening of the Chinese economy but insists these should still be viewed with “caution” as those signs have not yet “physically materialized on the ground”.
Natural gas continues to crash, falling below the $200 mark for the first time since 2020. The total washout is happening because winter is among the mildest on record in terms of heating degree days. EBW Analytics points out that the cumulative 1,440 gHDDs for January and February is on pace for the second-mildest start to a new year in the past 43 years. This is a 5th percentile tail risk that has not only rendered early winter risk premiums unnecessary but sent prices plummeting in an attempt to ward of burgeoning surpluses.
On top of that the same thing happened in Europe. A warmer than normal winter in Europe saved them from disaster. Reuters reported that European countries slashed their gas use from August to January as unusually warm weather curbed household heating. Soaring prices curtailed industrial output and governments launched emergency measures to contain the energy crisis. Overall gas use in the 27-nation European Union plunged by 19.3% from August to January compared with the five-year average for the same period, according to data published on Tuesday by EU statistics office Eurostat. EU countries appear on track to overachieve their target to voluntarily cut gas demand by 15% from August to March – one of numerous emergency efforts introduced by Brussels and national governments last year to save fuel and replace Russian supplies with alternatives ahead of the northern hemisphere winter.
Read Full Story »»»
DiscoverGold
Deliveries on Cotton/Cocoa/Ldn Coffee/Metals/Nat Gas
By: The PRICE Futures Group | February 21, 2023
• Tomorrow, Feb 22nd is First Notice Day for March Cotton and March Cocoa.
• Thurs, Feb 23rd is First Notice Day for March London Coffee.
• Fri, Feb 24th is LTD for Feb Metals and March Nat Gas.
Read Full Story »»»
DiscoverGold
Today's Futures Heat Map • Strongest: Lean Hogs, Heating Oil, Coffee, Pork Cutout
By: Barchart | February 21, 2023
• Today's Futures Heat Map
Strongest: Lean Hogs, Heating Oil, Coffee, Pork Cutout
Weakest: Natural Gas, Equity Indices, Wheat, Orange Juice

Read Full Story »»»
DiscoverGold
Still liking this constructive uptrend in soybeans
By: Markets & Mayhem | February 21, 2023
• Still liking this constructive uptrend in soybeans.

Read Full Story »»»
DiscoverGold
Inflation & Commodities
By: Gary Tanashian | February 21, 2023
The news is full of articles now discussing how food (Staples) producer prices are going to continue rising, how warehouse and distribution channels are pushing “inflation” higher, how charges to use cargo containers and transportation are all pushing “inflation” higher.
The inflationary acts were committed in 2020 and 2021. The inflation was inflicted then and is now history. What is happening now is a plethora of knock-on effects from the inflation. It’s lagging, sticky and in some cases opportunistic and greedy stuff that is not inflation but instead, the predictable after-effects of it.
What, did we expect that entities given license to mark up their profit margins (or at least try to maintain them for investors) would choose not to do so in the face of pervasive inflationary headlines? It’s an excuse to take the opportunity to PUSH costs. What economists call “cost-push inflation”. They have license to push costs, but it’s not the inflation, which happened already. That matters. Or it will matter.
This graph deflates M2 money stock by the CPI. “Real” M2 is rolling over harder than nominal M2. To me it represents the mature stages of the inflation situation, where the Fed is trying to reel in its past actions while “sticky” prices persist. It’s also a picture of Stagflation, for however long it does persist.
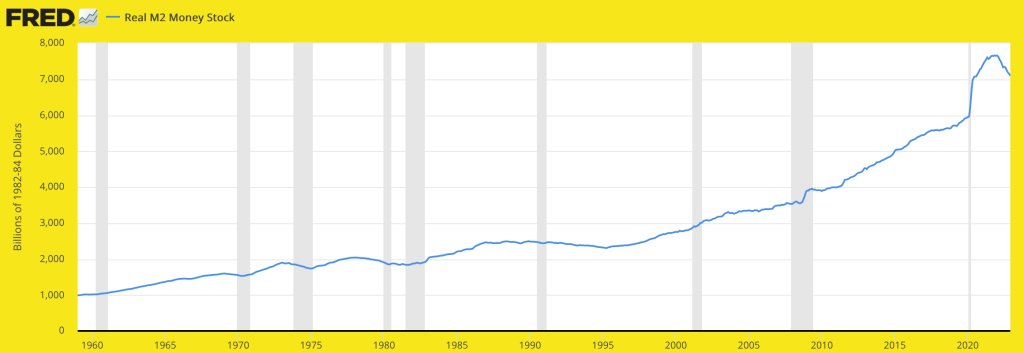
Commodities and materials are the elements of consumer prices. From Oil/Gas to Wheat/Corn to Copper/Steel… commodities are the cyclical bedrock of consumer prices. But the “cost-push” is coming from services and related industries as they look backward at the inflationary effects into 2022 and promote them for all they are worth. And insofar as pricing power is the goal, they are worth a lot as long as the public believes them in its current inflationary mindset.
Yet here the CRB index still resides, trending down after making a top last spring.
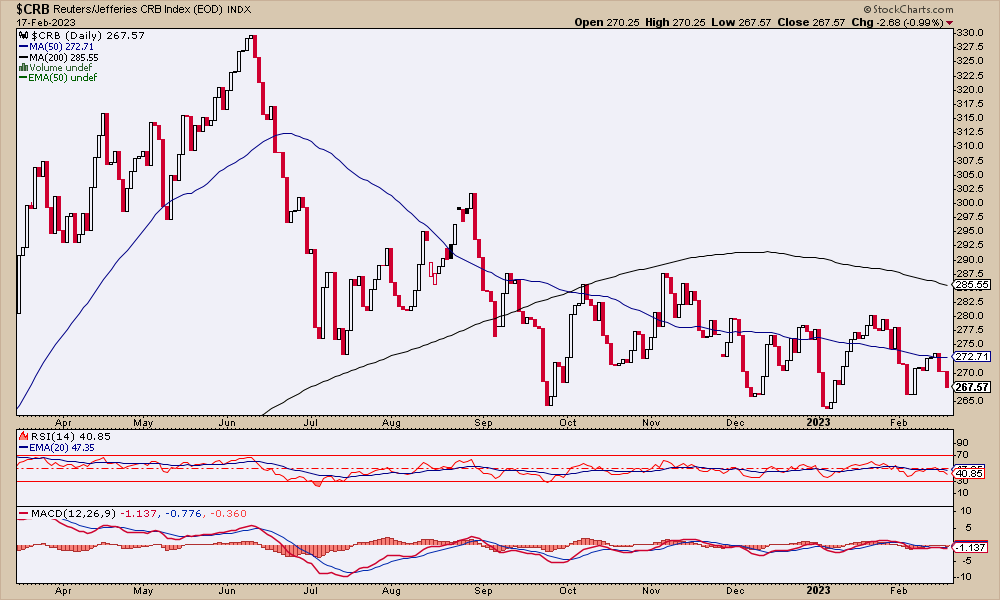
Oil & Gas: Oil is back below its 50 day average and trending down. Gas is still in crash mode. Seasonal positive or not, bounce potential or not, its in a terrible bear market. Energy commodities are not currently responsible for inflation. The inflation in Energy has come and gone.
Agricultural: GKX also topped last spring, although it has stabilized of late and is technically neutral. With GKX below its now down-trending SMA 200, there is certainly no cost uproar happening in Ag commodities. Now, the supply chain and services? That’s a different matter. Cost-push license is at work.
Copper & Industrial Metals: The China story and its own depleted warehouse stocks have bolstered Dr. Copper, which maintains its intermediate-term bullish trend. The wider industrial metals patch (GYX) is somewhat weaker but not yet broken from its intermediate trend either. A lower low to the January low (437.54) would accomplish that (current index price: 451.73). Copper has been leading the cyclical relief rally that we’ve dubbed the Q4-Q1 rally. It should be watched for signs of continuation or failure.
u3o8: The uranium segment (URNM, URA) enjoyed Cameco’s results and popped but ended the week with a short-term unpleasant look on its daily charts. This is in contrast to the commodity, which ended the week with a positive look (ref. Sprott u3o8 fund SRUUF). Uranium is a wildcard and a special situation and often goes its own way within the commodity complex. Uranium price is long-term bullish coming out of a multi-year base but in consolidation.
Lithium, REE, Palladium & Platinum: Premier Li producers LTHM & ALB rammed upward on their quarterly results last week and then were unceremoniously hammered right back down, punishing anyone who would have tried to momo the results. Recall I had already taken profits on each of them, but for now they remain only on watch (ALB is the more technically constructive of the two). As a side note, the Li price has been dropping since November and is currently at support, which needs to hold at this still long-term elevated level or there would be more pain to come.
REE sees the fund REMX having broken back into its ongoing downtrend after a vigorous bounce and watch list item MP more constructive as it tries to hold its downtrending SMA 200. Still not great, but better than the fund. Palladium is firmly in its downtrend and Platinum has tanked out of its intermediate uptrend back into a technically neutral situation with a bearish bias.
Does much of the above sound like an inflation problem? Copper remains bullish on the short-term and that is a warehouse supply situation with the demand side of the equation yet to be determined. Uranium is stable and that is a long-term structural situation (as would be the likes of REE, Li and even Cu with respect to alternative energy and in the future, the after effects of war and assumed rebuilding).
<end excerpt as #745 finished up with currencies and portfolios after having covered US/Global stocks, precious metals, bonds/indicators, sentiment and the whole shootin’ match, as usual>
Read Full Story »»»
DiscoverGold
Grains Report: Wheat, Rice, Corn and Oats, Soybeans
By: Jack Scoville | February 21, 2023
• WHEAT
General Comments: Wheat markets were mixed last week, with SRW and HRW futures in Chicago a little lower but Minneapolis Spring futures unchanged for the week. News that Russia has launched a new offensive in Ukraine provided much of thew support this week. Russia appears to be sending three divisions across the border to fight and it looks as though this could be a major operation for the Russian army. Wire report now suggest that Russia has now committed almost its entire army to the war. Fears of deliveries of Wheat from the Black Sea will be cut significantly are surfacing again. Ideas are that both Australia and Russia are harvesting record to near record Wheat crops this year. Russia is said to be plotting a huge new invasion of Ukraine that could prevent farmers in Ukraine from harvesting Wheat and planting Corn. Russia has a large production and is undercutting most world prices in the international market. However, Russian production estimates have dropped recently. The demand for US Wheat in international markets has been a disappointment all year and has been hindered by low prices and aggressive offers from Russia. Ukraine is also looking for new business for its crops and Russia is aggressive in the world market as it looks for cash to fund the war.
Overnight News: The southern Great Plains should get mostly dry conditions. Temperatures should be below normal. Northern areas should see mostly dry conditions. Temperatures will average near to above normal. The Canadian Prairies should see isolated showers. Temperatures should average above normal.
Chart Analysis: Trends in Chicago are mixed, Support is at 757, 742, and 729 March, with resistance at 776, 784, and 799 March. Trends in Kansas City are mixed. Support is at 866, 859, and 850 March, with resistance at 880, 9893, and 916 March. Trends in Minneapolis are mixed. Support is at 911, 907, and 897 March, and resistance is at 467, 942, and 946 March.
• RICE:
General Comments: Rice was lower last week but held to the recent trading range. Reports indicate that the farmers have been selling and ideas are that they might dump on the market if they think a big crop is coming at the end of the new growing season that is now getting ready to start in southern growing areas. Demand has been good from domestic sources. Export demand has been uneven. Demand has been an issue for the market all year. There is not much going on in the domestic market right now although mills are milling for the domestic market in Arkansas and are bidding for some Rice. Markets from Texas to Mississippi are called quiet. Demand in general has been slow to moderate for Rice for exports and solid for domestic uses.
Overnight News: The Delta should get mostly dry conditions. Temperatures should be below normal.
Chart Analysis: Trends are down with no objectives. Support is at 1746, 1735, and 1729 March and resistance is at 1764, 1777, and 1790 March.
• CORN AND OATS
General Comments: Corn and Oats closed lower last week, but Corn held well as demand is slowly improving. US prices are currently very competitive with those from South America and US demand has improved because of the price differentials. Prices from South America should now remain strong as countries there concentrate on Soybeans exports, so the US has chance now to see export demand improve more than it has already. The export demand remains well behind the pace to make USDA objectives. Brazil has been hanging on for its Summer crop although losses are now being reported. Argentina has suffered through some extreme drought and losses could be large. The Brazil Winter crop is harvested and China has been buying the surplus. The Summer crop and the Argentine crop is developing under stressful conditions. The next Winter crop is going into the ground in good conditions, but it has been wet so the Soybeans harvest has been delayed and the Corn planting is becoming delayed as well. There are concerns about demand with the Chinese economic problems caused by the lockdowns creating the possibility of less demand as South America has much better crops this year to compete with the US for sales. China is now moving rapidly to open the economy and allow people to move around with no lockdowns so the demand could start to improve
Overnight News:
Chart Analysis: Trends in Corn are mixed. Support is at 672, 669, and 666 March, and resistance is at 682, 689, and 693 March. Trends in Oats are mixed. Support is at 361, 348, and 335 March, and resistance is at 368, 370, and 375 March.
• SOYBEANS
General Comments: Soybeans and Soybean Meal were lower last week, but Soybean Oil closed a little higher. The market is weaker in anticipation of the South American harvest coming to export channels in the near term. It remains hot and dry in Argentina and southern Brazil and crop conditions are getting worse. However, weather is becoming less important now as the harvest is already underway in central and northern Brazil and will spread south soon. Central and northern Brazil have seen harvest operations interrupted with too much rain. Soybean Meal saw strong weekly export sales as Argentina is having to withdraw from the market for Soy products sales due to the drought in the country and the fact that they have already sold a lot of Soybeans into the world market. They are now buying from Brazil. The harvest in Brazil is slowly expanding in central and northern areas. These areas have seen too much rain and the harvest has been slow. Production potential for the Brazil is called very strong even with potential problems and losses in the south. Argentine production ideas continue to drop with the drought as planting is delayed and the crops already in the ground are stressed. Ideas that Chinese demand will improve, but this could take a few more weeks as a very large part of the population now has Covid. This has delayed a robust economic return for the country.
Overnight News:
Chart Analysis: Trends in Soybeans are mixed. Support is at 1517, 1511, and 1506 March, and resistance is at 1537, 1545, and 1556 March. Trends in Soybean Meal are mixed. Support is at 488.00, 478.00, and 472.00 March, and resistance is at 500.00, 508.00, and 514.00 March. Trends in Soybean Oil are mixed. Support is at 6070, 5960, and 5890 March, with resistance at 6240, 6360, and 6420 March.
Read Full Story »»»
DiscoverGold
Softs Report: Cotton, OJ, Coffee, Sugar, Cocoa
By: Jack Scoville | February 21, 2023
• COTTON
General Comments: Cotton was lower last week on what appeared to be chart based speculative selling and still remains inside the trading range created since the beginning of November. Short term trends are now down. Futures are still showing bad demand fundamentals as the weekly export sales reports have shown moderate sales at best. Some ideas that demand could soon increase as China could start to open its economy in the next couple of months as Covid outbreaks should start to weaken as people get vaccinated or immune. Covid is now widespread in China so the beneficial economic effects of the opening are being delayed but these effects should start to be felt as the people there achieve immunity over the next week or two.
Overnight News: The Delta will get mostly dry conditions and below normal temperatures. The Southeast will see isolated to scattered showers and near to above normal temperatures. Texas will have mostly dry conditions and below normal temperatures. The USDA average price is now 79.46 ct/lb. ICE said that certified stocks are now 1,147 bales, from 8,900 bales yesterday.
Chart Trends: Trends in Cotton are down with objectives of 8060 and 7670 May. Support is at 80.50, 80.00, and 79.80 May, with resistance of 83.50, 83.90 and 84.50 May.
• FCOJ
General Comments: FCOJ was lower last week, but rallied sharply on Friday to close well off he weekly lows after holding support near 128.00 on the weekly charts. Demand should start to weaken again as the northern Winter passes by. Historically low estimates of production due in part to the hurricanes and in part to the greening disease that have hurt production, but conditions are significantly better now with scattered showers and moderate temperatures. The weather remains generally good for production around the world for the next crop including production areas in Florida that have been impacted in a big way by the two storms seen previously in the state. Brazil has some rain and conditions are rated good. Brazil continues to export to the EU and is increasing its exports to the US. Mexico is also exporting to the US. Even so, the Florida Dept of Citrus reported that inventories are still 40.6% below last year at 102.39 million pounds.
Overnight News: Florida should get mostly dry conditions. Temperatures will average above normal. Brazil should get scattered showers and near normal temperatures.
Chart Trends: Trends in FCOJ are mixed. Support is at 229.00, 220.00, and 214.00 March, with resistance at 236.00, 238.00, and 249.00 March.
• COFFEE
General Comments: New York and London closed higher last week on higher differentials in Brazil. Producers are not offering right now and the market wants its coffee. Ideas of big production for Brazil continue due primarily to rains falling in Coffee production areas now. Vietnam is estimated to have veery good production this year due to a good growing season and less rain now as harvest expands again. There are ideas that production potential for Brazil had been overrated. The weather in Brazil is currently very good for production potential but worse conditions seen earlier in the growing cycle hurt the overall production prospects as did bad weather last year.
Overnight News: ICE certified stocks are lower today at 0.832 million bags. The ICO daily average price is now 177.67 ct/lb. Brazil will get isolated showers in northern areas with near to a4bove normal temperatures. Central America will get scattered showers. Vietnam will see scattered showers. ICE NY said that 509 contracts were tendered for delivery against March futures and that total deliveries for the month are now 571 contracts.
Chart Trends: Trends in New York are up with objectives of 196.00 and 209.00 May. Support is at 183.00, 177.00, and 175.00 May, and resistance is at 189.00, 194.00 and 196.00 May. Trends in London are up with objectives of 2110 and 2170 May. Support is at 2070, 2050, and 2020 May, and resistance is at 2100, 2120, and 2140 May.
• SUGAR
General Comments: New York and London closed a little lower last week in consolidation trading. Ideas are that the market has priced in production losses in India and Brazil and is providing renumeration for Indian and Thai exporters who want to sell. Thailand expects to export 9.0 million tons of Sugar in the current crop year, 7% more than last year. Ideas of better supplies coming might keep futures prices in check even with a rather tight nearby scenario. Good production prospects are seen for crops in central and northern areas of Brazil, but the south should turn dry again and so should some northern areas. There is concern that the rainy areas will stay too wet and delay the harvest and dilute the Sugar concentrations in the cane in central areas. The harvest is active in Thailand. Australia and Central America harvests are also active. European production is expected to be reduced again this year.
Overnight News: Brazil will get scattered showers. Temperatures should average near to above normal. India will get mostly dry conditions and near to above normal temperatures.
Chart Trends: Trends in New York are mixed. Support is at 1960, 1940, and 1900 May and resistance is at 2000, 2030, and 2050 May. Trends in London are mixed. Support is at 564.00, 557.00, and 549.00 May and resistance is at 574.00, 575.00, and 582.00 May.
• COCOA
General Comments: New York and London closed higher last week as West African exporters are not offering. Wire reports suggest that exporters are currently looking for Cocoa to make good on current contracts and are not entering into new contracts right now. Trends have turned up in both New York and London. Talk is that hot and dry conditions reported in Ivory Coast could curtail mid crop production, but main crop production ideas are strong. Ghana has reported a disease in its Cocoa to hurt production potential there. The rest of West Africa appears to be in good condition. Good production is reported for the main crop and traders are worried about the world economy moving forward and how that could affect demand. The weather is good in Southeast Asia.
Overnight News: Mostly dry conditions are forecast for West Africa. Temperatures will be near normal. Malaysia and Indonesia should see scattered showers. Temperatures should average near normal. Brazil will get scattered showers and near to above normal temperatures. ICE certified stocks are higher today at 5.113 million bags.
Chart Trends: Trends in New York are up with objectives of 2730, 2740, and 2750 March. Support is at 2650, 2590, and 2530 March, with resistance at 2730, 2740, and 2750 March. Trends in London are up with objectives of 2120 and 2130 March. Support is at 2040, 2020, and 2000 March, with resistance at 2120, 2150, and 2180 March.
Read Full Story »»»
DiscoverGold
The Corn & Ethanol Report
By: Daniel Flynn | February 21, 2023
We kickoff the day with S&P Global Composite PMI Flash, S&P Manufacturing PMI Flash and S&P Global Service PMI Flash at 8:45 A.M., Existing Home Sales and Existing Home Sales MoM at 9:00 A.M., Export Inspections at 10:00 A.M.,3-Month & 6-Month Bill Auction at 10:30 A.M., 2-Year Note Auction and 52-Week Bill Auction at 12:00 P.M.,
On the Corn Front the market is questioning how much and how long disruptions may occur as Cincinnati closes Ohio River water intake as a safety precaution, local Louisville officials said the Ohio train derailment hasn’t impacted Louisville’s water, the spill is more than 300 miles away and there were no detectable levels in the Louisville area. Despite reservations from some local residents, the officials say the water is safe to drink. Let’s see these officials drink it. The EPA has lost peoples trust and Norfolk Southern has joined the cast of the unpopular. If they want trust let them verify. Corn prices settled higher in Friday’s close. Rains last week across the northern half of Argentina were better than expected. This week’s crop ratings will determine if the rains were of much benefit. Good harvest progress is expected to be made in Brazil last weekend ahead of above normal precipitation returns this week. In the overnight electronic session the March corn is currently trading at 681 which is 3 ¼ cents higher. The trading range has been 681 ¾ to 678 ¼.
On the Ethanol Front the EPA reports 1.75 billion Renewable identification numbers (RINs) generated under the Renewable Fuel Standard ((RFS) up 1.59 billion from last year. More than 1.48 million D3 cellulosic biofuels in January, including 877,915 generated for compressed renewable natural gas (RNG) by domestic producers and 604,915 generated for liquefied RNG by domestic producers. There were no trades or open interest in ethanol futures.
Read Full Story »»»
DiscoverGold
Not So Clear Cuts. The Energy Report
By: Phil Flynn | February 21, 2023
Russia’s oil production cuts are not so clear cut. Russia’s announced 500.000 barrel a day production cut caused a surge in buying in Russian barrels and even motivated the Biden administration to shuffle barrels from the SPR forward which should lead to a supply deficit later this year. This comes as JODI says that global oil demand, instead of falling, is at record highs. Is it any wonder that oil companies are buying their stock back when the Biden administration continues to meddle in the market?
Yet now, according to Reuters, Deputy Prime Minister Alexander Novak said on Tuesday, “We will watch how the situation on the market develops, and decisions… will be made from this. Now, the decision is for March,” the TASS news agency reported him as saying. The cut will be made from January output levels, Novak added. He has said production stood at 9.8 million-9.9 million bpd last month. These reports caused a slight dip in prices, but it was short-lived because the reality is that Russia could announce an even larger cut in April if they wanted to squeeze the market. I am sure that Russia is not very happy with Biden’s trip to Ukraine, and many taxpayers are wondering why all this cash is going to Ukraine while the homeless in this country are living in camps on the streets. Russian President Vladimir Putin for his part is warning that long-range missiles being introduced by the west will lead to an expansion of the war.
Bloomberg News is reporting that President Vladimir Putin said Russia will suspend its observation of the New START nuclear weapons treaty, dealing a blow to the last accord with the US limiting their strategic arsenals. Russia won’t allow the US and the North Atlantic Treaty Organization to inspect its nuclear facilities, though it won’t be the first to resume testing of its atomic weapons, Putin said in his state-of-the-nation address to parliament and top officials in Moscow on Tuesday. The treaty that was extended in 2021 is due to expire in 2026.
Ah, the world is a much safer place with Biden at the helm. More geopolitical risk premium in oil is coming from Iran. Bloomberg News reported that, “The International atomic monitors in Iran last week detected uranium enriched to levels just below that needed for a nuclear weapon, according to two senior diplomats, underscoring the risk that the country’s unrestrained atomic activities could prompt a new crisis. The International Atomic Energy Agency is trying to clarify how Iran accumulated uranium enriched to 84% purity — the highest level found by inspectors in the country to date, and a concentration just 6% below what’s needed for a weapon. Iran had previously told the IAEA that its centrifuges were configured to enrich uranium to a 60% level of purity. Inspectors need to determine whether Iran intentionally produced the material, or whether the concentration was an unintended accumulation within the network of pipes connecting the hundreds of fast-spinning centrifuges used to separate the isotopes. Yeah, that’s it. That pipe thing.
In the meantime, global oil demand is rising, and daily production is falling. That is what is being reported by Joint Organizations Data Initiative (JODI). They say that global oil demand climbed in December by 1.3 mb/d to a new record high. Demand growth was driven primarily by gains in Japan, Indonesia, and Korea. Meanwhile, global crude production declined by 274 kb/d in December to a 5-month low, led by losses in the US and UK. Global demand was at 102 percent of pre-COVID levels in December, while crude production was at 96 percent of pre-pandemic levels. While markets tightened compared to November, global inventories of crude and refined products climbed counter seasonally by 5.46 mb. Inventories remain 354 mb below the five-year average. The increase was helped by a warm winter. The lack of heating demand allowed for the counter-season build. Yet based upon the fact that supplies are still well below average should still be a major concern for markets.
We have demand exceeding expectations and production falling. China’s demand for oil is rising as there are reports that Chinese oil imports will hit record highs. Copper prices are soaring on signs of more Chinese demand and grains are getting a boost on that and the weather and the war in Ukraine. Reuters is reporting that Ukraine grain exports are down 28.7% at 30.3 million tonnes in the 2022/23 season so far, hit by a smaller harvest and logistical difficulties caused by the Russian invasion, agriculture ministry data showed on Monday. The volume so far in the July to June season included about 10.8 million tonnes of wheat, 17.4 million tonnes of corn, and about 2 million tonnes of barley. Exports at the same stage of the previous season were almost 42.5 million tonnes. The ministry said grain exports so far in February had reached 3.3 million tonnes as of Feb. 20, down from 4.07 million tonnes in the same period last year.
BP is turning back from the green madness of the so-called move beyond petroleum but is it really fast food that is their future? Dan Molinski at the Wall Street Journal writes that, “BP originally stood for British Petroleum, then Beyond Petroleum, and now … Burgers & Pizza? That might be a stretch, but the company’s announced acquisition of TravelCenters of America for $1.3B in cash does give it a much larger footprint in the convenience business of 24-hour snacks and goodies, and full and quick-service restaurants. “The acquisition expands BP’s exposure to convenience with about 70% of TA’s gross margin generated from its convenience services businesses, and will almost double BP’s global convenience gross margin,” says Tudor Pickering in a note. BP itself names convenience as one of its top-five “strategic transition growth engines” that could fit well with EV-charging and other changes to how people travel.
Oil prices and products are in a wild trading range but seasonally and from a supply and demand standpoint, should be poised to break out on the upside. US crude supplier builds should show withdraws soon as refiners ramp up out of maintenance.
Natural gas is still plummeting. Talk of a polar vortex has some traders saying that it will be too little too late to save the market. I sure wish they has liquidity in back dated options.
Read Full Story »»»
DiscoverGold
What I'm Watching This Week In The Grain Markets
By: Barchart | February 19, 2023
We survived another week of what could only be described as violently range bound trade in corn and soybeans, while wheat continues to struggle with what appears to be plentiful nearby supplies, but an extremely uncertain future.
Not much has changed from a purely fundamental standpoint in grains over the last 6 weeks or so it seems. The US crop size has been established when it comes to old crop supplies, with all eyes on every nuance of demand until we get closer to putting seeds in the ground.
South American production remains key in the short-term as it will have long lasting implications on US demand for corn and beans, both old and new. At the start of the month Brazilian bean production estimates seemed to be increasing according to cash traders in the country, with some talk of production working towards 155 mmt, versus the USDA’s 153 mmt estimate. However, recent dryness across southern portions of the country, especially in Rio Grande do Sul have some analysts reducing their production outlook, with one private group taking their estimate down to 150.9 mmt, from 152.9 last month.
Argentina continues to battle unprecedented weather events, with a frost over the weekend impacting some parts of the country’s key production areas. The amount of production lost by frost may be difficult to put a number on due to the variability of conditions across the country and the wide range of crop maturities due to an extended planting season. While major losses because of the frost will be isolated, traders are now beginning to discuss the possibility of Argentina's bean crop falling below 30 mmt—potentially worse than an 08/09 style loss that produced a 32 mmt crop.
It is interesting to note, though, the growth in production achieved by surrounding countries since that time, and what it could mean for the global pipeline. Brazilian production in 2008/2009 was around 95 mmt (3.49 billion bushels) less than forecasted for this year. The US produced 4.3 billion bushels of soybeans last year to put that growth into perspective.
The increase in available supplies from surrounding countries and continued strong crush margins for Argentina processors will likely result in record imports for Argentina. While it takes time to rework grain flow as will be required to accomplish record imports, a sharply inverted margin structure will encourage buyers and sellers to work as quickly as they can to capture maximum returns.
While soybean production in South America is down to determining the last 10% or so worth of potential, the bulk of corn production risk is just beginning. Of course, crop losses in Argentina will take center stage first as early planted corn has suffered the most from heat and dryness. While only 25% or so of Argentina’s corn was planted in the early window, the loss there combined with a slow start to safrinha planting in Southern Brazil could create an interesting short-term supply pinch in the region.
Farmers in Mato Grosso have just over half of their second crop corn planted now as of last Friday, an increase of over 16% on the week, but still trailing last year’s pace by over 18%. The optimum planting window is beginning to close, though prices will keep producers planting as long as the weather allows.
Models are pointing to below normal precipitation risks for March, April and May across much of Brazil, raising concern, but with Mato Grosso seeing around 7” of rain on average in the month of March and nearly 5” on average in April, below average precipitation does not necessarily mean crop damage, though the risk warrants watching.
In addition to South American production and export outlooks we continue to watch what is happening with the Fed and monetary policy. The resiliency of the US economy has surprised even the most optimistic analysts at times, with talk of falling inflation and Fed pivots seemingly premature. The recent increase in hawkish rhetoric combined with strong economic data has put a floor under the dollar, allowing it to claw back nearly a quarter of its recent losses over the last few weeks.
What kind of economic landing we have remains hotly debated, with talk of even no landing, where we just kind of remain suspended here with costs elevated across the board, but economic activity continuing as it has somehow. What happens in the world economy can have big implications on demand, especially in the energy sector, which will spill over directly into ethanol and other biofuel demand around the world.
Perhaps the biggest thing I’m watching though in the weeks ahead is what happens between the US and China. The spy balloon story has not gone away, with China continuing to insist the US is overreacting over a weather balloon, with one Chinese official calling the US hysterical. US officials remain undeterred, saying it is just one balloon in a vast program of spy balloons that have been spotted in 40 different countries around the world.
US policies towards China have quietly taken a much more aggressive stance when it comes to communication and trade over the last couple of years from both parties, putting China on the defensive in a big way.
Not only are we seeing a war of words over the balloon, but China also remains angry over the US involvement in Taiwan as well as recent trade policies they claim have seriously damaged their chip industry.
Perhaps the most concerning development though happened this weekend, with the US saying they have intelligence indicating China is moving to potentially provide lethal support to Russia in their war with Ukraine. US Secretary of State Blinken and other administration officials say Chinese companies have already provided Russia with non-lethal resources like helmets and other protective gear, narrowly avoiding sanctionable offenses. However, they say signs point towards a strengthening relationship between the two countries, with Blinken meeting with allies to discuss the risk at this weekend’s security conference in Munich.
We aren’t far enough removed from the Trump era trade war to completely forget what losing China as a major buyer does to the market. With the recent spate of supply shortages China has had no choice but to buy US products in a big way whether they were happy with our relationship or not. This of course remains true so long as supplies remain tight, but a confirmation of adequate stocks in the coming months could see a tremendous increase in rhetoric surrounding trade, with potentially massive implications in the years ahead.
I can’t help but feel we could be on the cusp of a major realignment in global trade without even realizing it.
Looking ahead, without some type of major Black Swan event, this week should be more of the same. We eventually break out of the tightening ranges we’ve seen recently in a big way, though it feels like at this point there are far too many unknowns to see a move with conviction just yet.
As always, let me know if you have any questions, you can find my contact info on our website at www.consusroi.com. Have a great week!
Read Full Story »»»
DiscoverGold
Deliveries on Cotton/Cocoa/Ldn Coffee/Metals/Nat Gas
By: The PRICE Futures Group | February 17, 2023
• Wed, Feb 22nd is First Notice Day for March Cotton and March Cocoa.
• Thurs, Feb 23rd is First Notice Day for March London Coffee.
• Next Fri, Feb 24th is LTD for Feb Metals and March Nat Gas.
Read Full Story »»»
DiscoverGold
Today's Futures Heat Map • Strongest: Coffee, Orange Juice, Cocoa, Mexican Peso
By: Barchart | February 17, 2023
• Today's Futures Heat Map
Strongest: Coffee, Orange Juice, Cocoa, Mexican Peso
Weakest: Natural Gas, Heating Oil, Crude Oil, Gasoline
Rough day for Energy.

Read Full Story »»»
DiscoverGold
The Corn & Ethanol Report
By: Daniel Flynn | February 17, 2023
We kickoff the day with Export Prices and Import Prices MoM & YoY and Fed Barkin Speech at 7:30 A.M., CB Leading Index MoM at 9:00 A.M., and Baker Hughes Oil & Total Rig Count at 12:00 P.M.
On the Corn Front USDA Agriculture projections for corn stated that, “Baseline projects US corn production to grow over the next decade as yield gains offset a slight decline in acreage. Planted area is projected to steadily decline after 2023/24. Strong response to increased global demand and tight supplies.” The stocks-to-use ratio is expected to rise somewhat rapidly, from 11.6% 2023/24 to 16.0% in 2026/27. Later in the production period, supply and use to grow at similar rates, slowing growth in stocks-in-stocks ratio the report said. With respect to ethanol, the report noted that, “Corn used for ethanol production declines slightly over the projection period, from 5.325 billion bushels to 5.300 billion bushels by 2032/33. Expected declines in motor gasoline consumption constrains ethanol production. The report also addressing long-term corn exports. The USDA explained that, “US corn exports are expected to increase by 11.4 million to 69.2 million tons by 2032/33. Corn prices are expected to fall steadily from a near-record peak of $680 per bushel in 2022/23 to $579 in 2023/24 and continue a downward trend through 2026/27 before stabilizing at $430 through 2032-33 the report said. In the overnight electronic session the March corn is currently trading at 676 ¾ which is ¾ of a cent higher. The trading range has been 677 ¾ to 675. There were no trades in ethanol futures.
Read Full Story »»»
DiscoverGold
Fifty. The Energy Report
By: Phil Flynn | February 17, 2023
Commodities are getting crushed as two Fed officials are saying a 50-basis point interest rate increase is in the cards, helping the US dollar to scale to new heights. Both the Federal Reserve Bank of Cleveland President Loretta Mester and St. Louis President James Bullard rang a hawkish tone, suggesting that the economy and the consumer was too strong for its own good. Even European Central Bank Executive Board member Isabel Schnabel warned that markets risked underestimating inflation, raising concerns of more global interest rate increases but even that was not enough to see a surge in the greenback and an exit from commodities. Federal Reserve Bank of Cleveland President Loretta Mester said that there is a “compelling economic case” to raise rate aggressively.
Where is top Chinese Deal Maker Bao Fan. Bloomberg News reports that while there’s no indication the China Renaissance Holdings Ltd. chairman has become a target of regulators, the investment bank said late Thursday it had lost contact with Bao. The banker’s family was told he’s assisting an investigation, a person familiar with the matter said. This story is raising the risk factors for the Chinese stock market that had been benefiting from the covid reopening play.
I would like to tell you the selling is all macro related but there are still concerns about the huge crude oil supply increase this week. It took an almost a 17 million barrel adjustment to arrive at that number and it still is a headwind especially against a backdrop of the promises of more aggressive interest rate increases by global central banks.
The products are still seeing signs of tightness. John Kemp at Reuters wrote that, “Resurgent passenger aviation following the coronavirus pandemic has created shortages of jet fuel, pushing up airlines’ operating costs and fares. U.S. jet fuel inventories stood at just 36.5 million barrels on February 10, according to data from the U.S. Energy Information Administration (EIA). Stocks were at the lowest for the time of year since 1985 and 4.3 million barrels (-11% or -1.94 standard deviations) below the prior ten-year seasonal average. The deficit has narrowed from 6.3 million barrels (-15% or -2.83 standard deviations) at the start of October 2022, but inventories remain stretched.
How is the global green energy transition going? Oil Price reports that, “A recent study published by Nature Energy suggests that up to 141 million people could be pushed into extreme poverty by high energy prices. According to the study, total energy costs of households are set to jump by between 62.6% and 112.9%, leading to a 2.7% to 4.8% increase in household expenditures. While inflation may have peaked, prices have not and an increasing number of people are having to live without electricity. So why don’t they get jobs making wind turbines?
Natural gas has not found its bottom yet. The Freeport LNG export terminal restart is not happening fast enough and in Europe because of a historically warm winter, they are flush with supply. The FT reported, “The price of European natural gas has fallen below €50 per megawatt hour for the first time in almost 18 months, a landmark moment in the energy crisis as mild weather and ample storage helped temper once runaway prices. European gas prices have fallen as much as 85 per cent from their peak of more than €300/MWh in August 2022, when Russia’s deep cuts in supplies to Europe after its full-scale invasion of Ukraine sparked concerns of possible blackouts.
Petroleum in the short term will be dictated by a strong dollar while refineries are in maintenance. Traditionally in February prices can be weak like we are seeing but could turn around dramatically when refineries start to reopen ahead of the summer driving season.
Read Full Story »»»
DiscoverGold
Chart candles for major indices were a sell signal this past Tuesday. Ugly action today as a follow through from yesterday’s misery.
|
Followers
|
89
|
Posters
|
|
|
Posts (Today)
|
0
|
Posts (Total)
|
8951
|
|
Created
|
05/01/07
|
Type
|
Free
|
| Moderators DiscoverGold Pro-Life | |||
- The Commodity Bull is Running... Inflation is Running... Harder Living (i.e. FOOD, CLOTHING, SHELTER) is Dead Ahead... -
- Commodity Futures Trading -
http://finviz.com/futures_performance.ashx
All Commodity Futures Charts From Finbiz.com Available Below:
Daily
Weekly
Monthly
Quarterly
6 Months
12 Months
YTD
2 Years
5 Years
Max
Beneficial Educational Resources on Futures TradingThe futures market is volatile, and it cuts both ways. Leverage that makes it profitable can also ruin reckless, undisciplined traders overnight. Most brokers have paper trading available on their platforms, so those who are new to futures should take advantage and learn with these tools before going live with real money. Mitigate risk with stop loss orders at all times, and cut losses quickly instead of adding contracts and attempting to flip your way out of a losing position. Also, use mini instruments when available, with lower margin requirements, until you have sufficient capital to buy and sell more expensive contracts. Even though the potential is there, don't try to make too many profits at once. If things aren't going well, often times quitting for the day and collecting one's thoughts is the best decision. New opportunities come along daily. Markets are open nearly 24 hours, so set a schedule and stick to it. Avoid trading while tired or distracted, and please don't listen to the advice of others. Do research on fundamentals affecting markets as well as paying attention to TA. Watch key indices, and listen to accurate, real-time news during the session to stay aware of shifting trends. Trade smart, trade safely, and have fun.
Videos on Futureshttps://www.youtube.com/playlist?list=PL9A5C5A93D243CA44 Continuous Improvement in Progress |
Commodity Futures Trading
https://www.tdameritrade.com/investment-products/futures-trading.page
| Volume | |
| Day Range: | |
| Bid Price | |
| Ask Price | |
| Last Trade Time: |


