Natural Gas Pulls Back After Failed Breakout Attempt By: Bruce Powers | April 4, 2024
• Natural gas retreats, testing key support near 8-Day MA at 1.77, following bearish candlestick pattern.
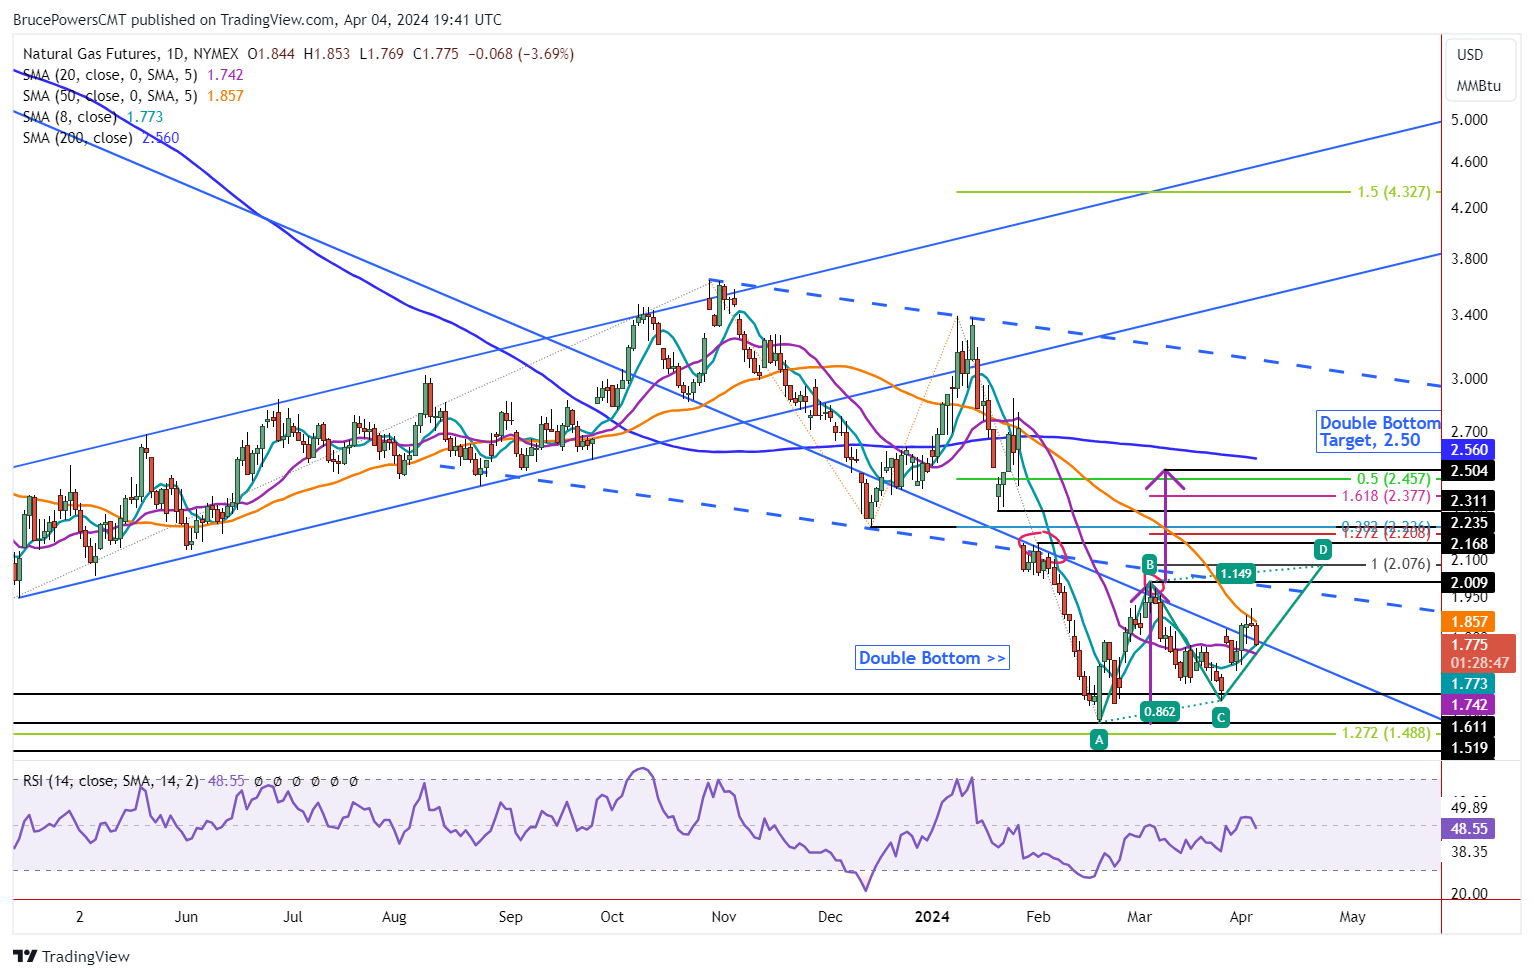
Following Wednesday’s bearish shooting star candlestick pattern, natural gas pulls back to test support around the 8-Day MA (1.77). It has fallen back below the long-term downtrend line and continues to trade near the lows of the day, at the time of this writing. The current low for the day is 1.77. If the retracement continues next watch for possible support around the 20-Day MA, currently at 1.74. This is just the first day of a pullback, so another one or two days of weakness would not be surprising.
Failed Breakout Above 50-Day Moving Average
Natural gas turned lower yesterday following a failed attempt to break out above the 50-Day MA. That was the first time it was approached since late last year. It is not unusual for price to be rejected the first time a common moving average is approached after being away from it for a while. Currently, it is at 1.86 and was tested as resistance earlier in today’s session and rejected to the downside.
Weekly Chart Shows Demand Increasing
When looking at the 8-Week MA on the weekly chart the situation with natural gas gains some clarity. Notice that this week’s low successfully tested support at the 8-Week line with a low of 1.71. Last week, the 1.75 closing price was above the 8-Week MA for the first time since the week of January 22. This shows momentum beginning to switch from bearish to bullish as a potential bottom further develops. There is only one more day to the week with the current weekly pattern reflecting some uncertainty about a bottom.
Weekly Bullish Reversal Triggered
Nonetheless, this week’s advance triggered a bullish reversal on the weekly chart. A close this week above last week’s high of 1.83 would be a stronger close than one below that price level. Currently, natural gas is trading below it. The weekly chart also shows a higher weekly low and higher high, to go along with the recent higher swing low. Each is a bullish sign.
So far upward momentum has been muted, but that can change quickly once the 50-Day MA is exceeded for a second time. A double bottom pattern remains a possibility, while the first higher target is at 2.08, which completes a rising ABCD pattern.
Information posted to this board is not meant to suggest any specific action, but to point out the technical signs that can help our readers make their own specific decisions. Caveat emptor! • DiscoverGold
Register for free to join our community of investors and share your ideas. You will also get access to streaming quotes, interactive charts, trades, portfolio, live options flow and more tools.


 News
News  Market Data
  Discover