 News
News  Market Data
  Discover
Support: 888-992-3836
Copyright © 2023 InvestorsHub Inc.


Register for free to join our community of investors and share your ideas. You will also get access to streaming quotes, interactive charts, trades, portfolio, live options flow and more tools.
Soybeans tried but got turned back. Time is running out for the typically favorable seasonal spring window
By: Jay Kaeppel | May 9, 2024
• Soybeans tried but got turned back. Time is running out for the typically favorable seasonal spring window. Still have yet to take a position. Might end up letting the clock run out on this one.

Read Full Story »»»
 DiscoverGold
Natural Gas Targeting Higher Levels
By: Bruce Powers | May 9, 2024
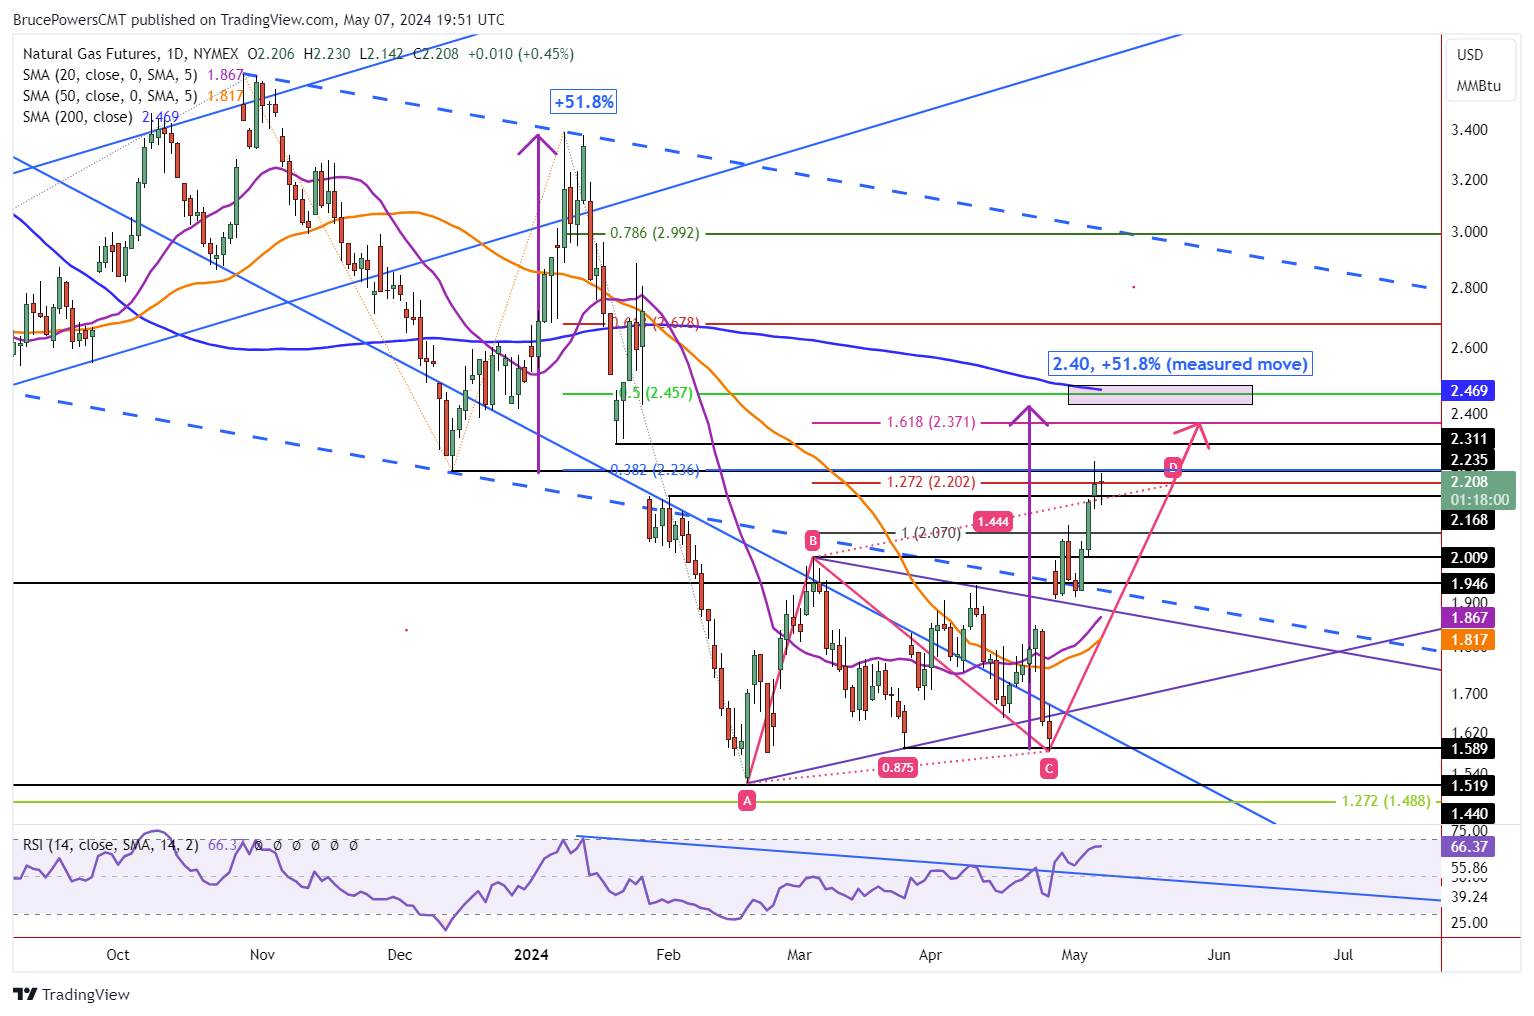
• The current natural gas rally suggests a move towards 2.37-2.465, backed by various technical indications.
Natural gas triggered a bullish continuation today as it rallied above the prior trend high of 2.27. It is on track to possibly close above that price level and confirm the breakout. It will be a clearer sign of strength if it does close above 2.27. Resistance for the day was seen at a high of 2.31, an interim target defined from a prior swing low. Today’s advance followed a retest of support with a low of 2.15, before buyers took back control.
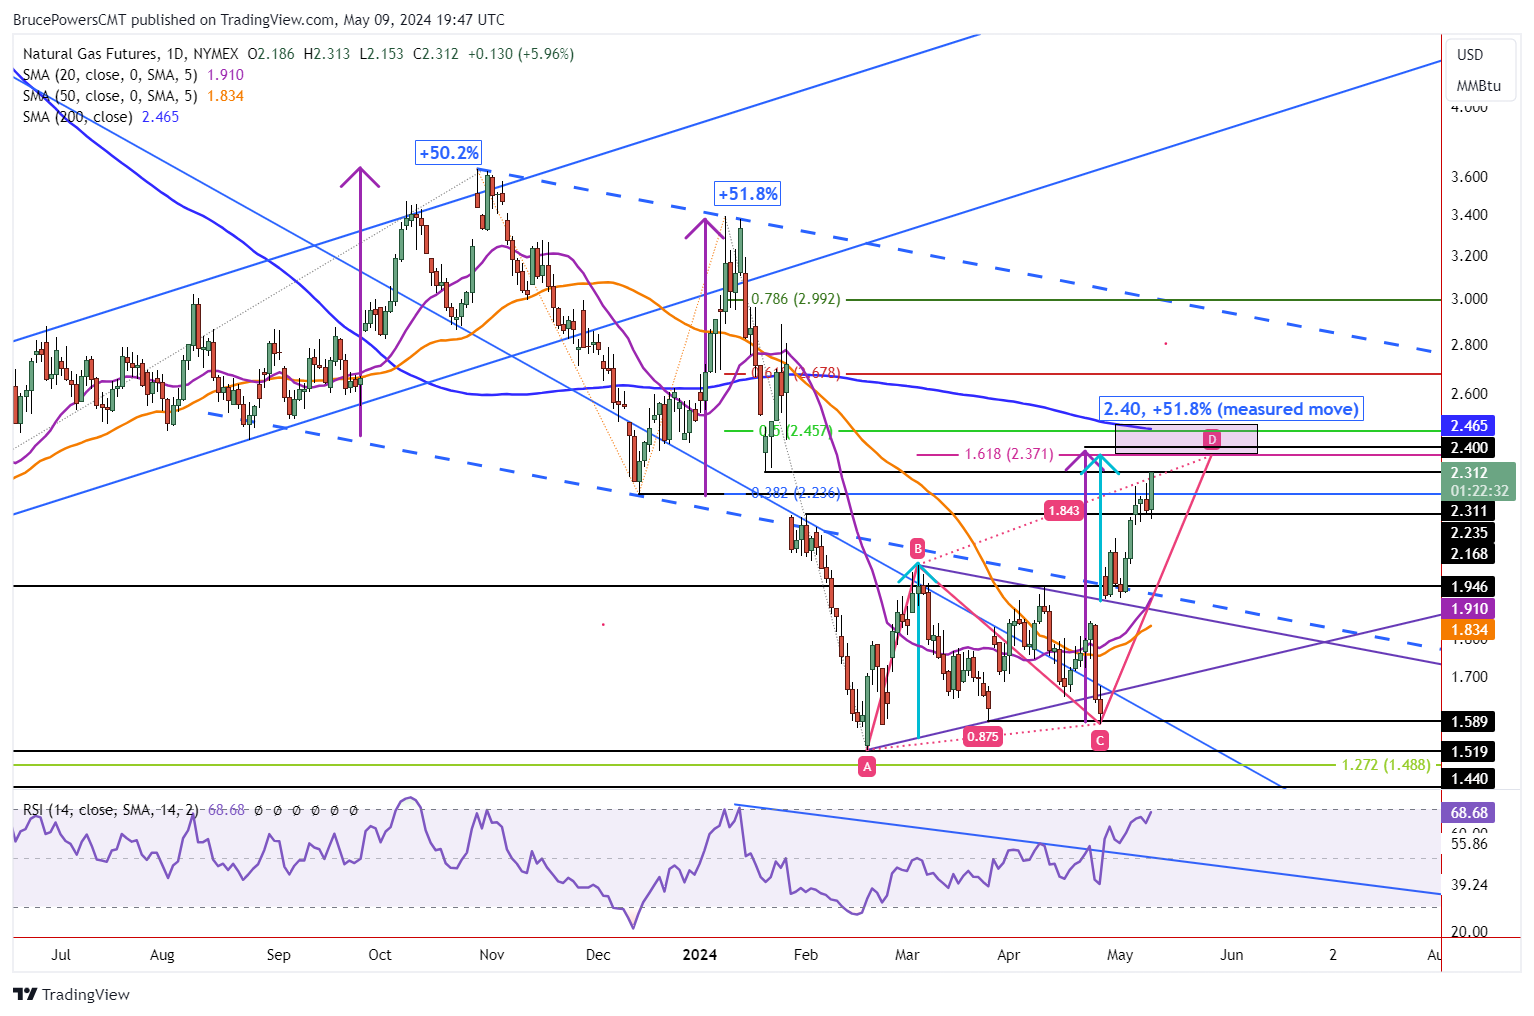
Bullish Price Action Improves Chance of Hitting 2.37 and Higher
Bullish price action seen today improves the chance that natural gas reaches the next higher target zone. It is anchored around the 200-Day MA, currently at 2.465. Given the current trajectory of the trend and the fact that the 200-Day line has not been tested as resistance since late-January, there is a good chance the 200-Day line may be reached. It is the top of a potential resistance zone that starts at 2.37, which is the completion of a rising ABCD pattern where the CD leg of the advance is 161.8% of the AB leg. Also, a minimum target from the bottom symmetrical triangle completes at 2.37 (light blue arrows).
Measured Move Completes at 2.40
A little higher, at 2.40, a measured move completes. That is where the current rally matches the advance from the December 13 low on a percentage basis. The December rise was 51.8% and the current rally matches at 2.40. It would reflect price symmetry between different swings. The December rally was the last advance that was greater than the previous three, which all followed the December rally. It is also close to a match with the rally that began from the August 24 swing low last year. And that rally was just prior to the December advance. Natural gas advanced by 50.2% from that low.
Can the price of natural gas extend beyond the 200-Day MA. Of course it can, but the resistance zone noted above is backed by multiple indications that a potentially significant resistance zone begins at 2.37. The risk of a retracement will be highest upon entering the 2.37 to 2.465 price zone.
Read Full Story »»»
DiscoverGold
Natural Gas Potential Pullback Ahead as Price Approaches Key Levels
By: Bruce Powers | May 8, 2024
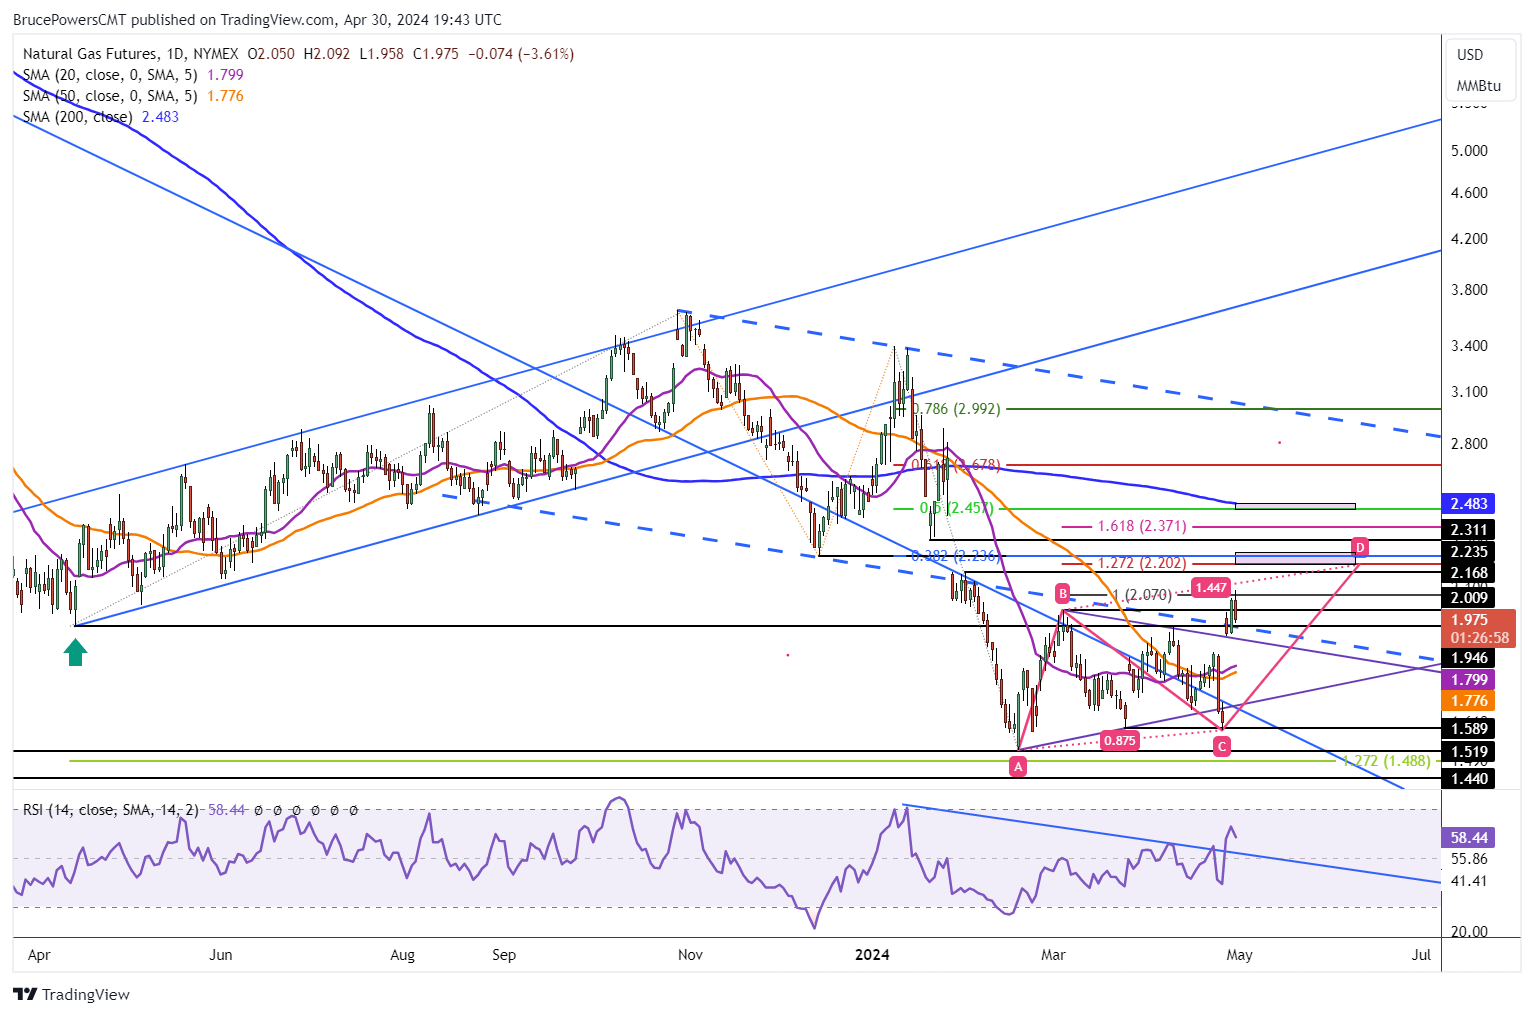
• Natural gas price movement suggests potential for a deeper retracement, with key levels at 2.09, 2.01, and 1.95 to 1.93 on the downside.
Additional consolidation around this week’s high of 2.26 continues in natural gas today as it tests support around 2.17. The 2.17 price level was busted last week on the rally to the 38.2% Fibonacci retracement target zone and now is showing minor support. Further signs of strength were seen briefly earlier in today’s session as the 2.26 high was exceeded to reach 2.27. However, it looks like natural gas may end in the red and short-term bearish, in the lower third of the day’s price range. Subsequently, if it falls below today’s low of 2.17 a deeper retracement may be in the works. And a decline below Tuesday’s low of 2.14 would further secure the pullback.
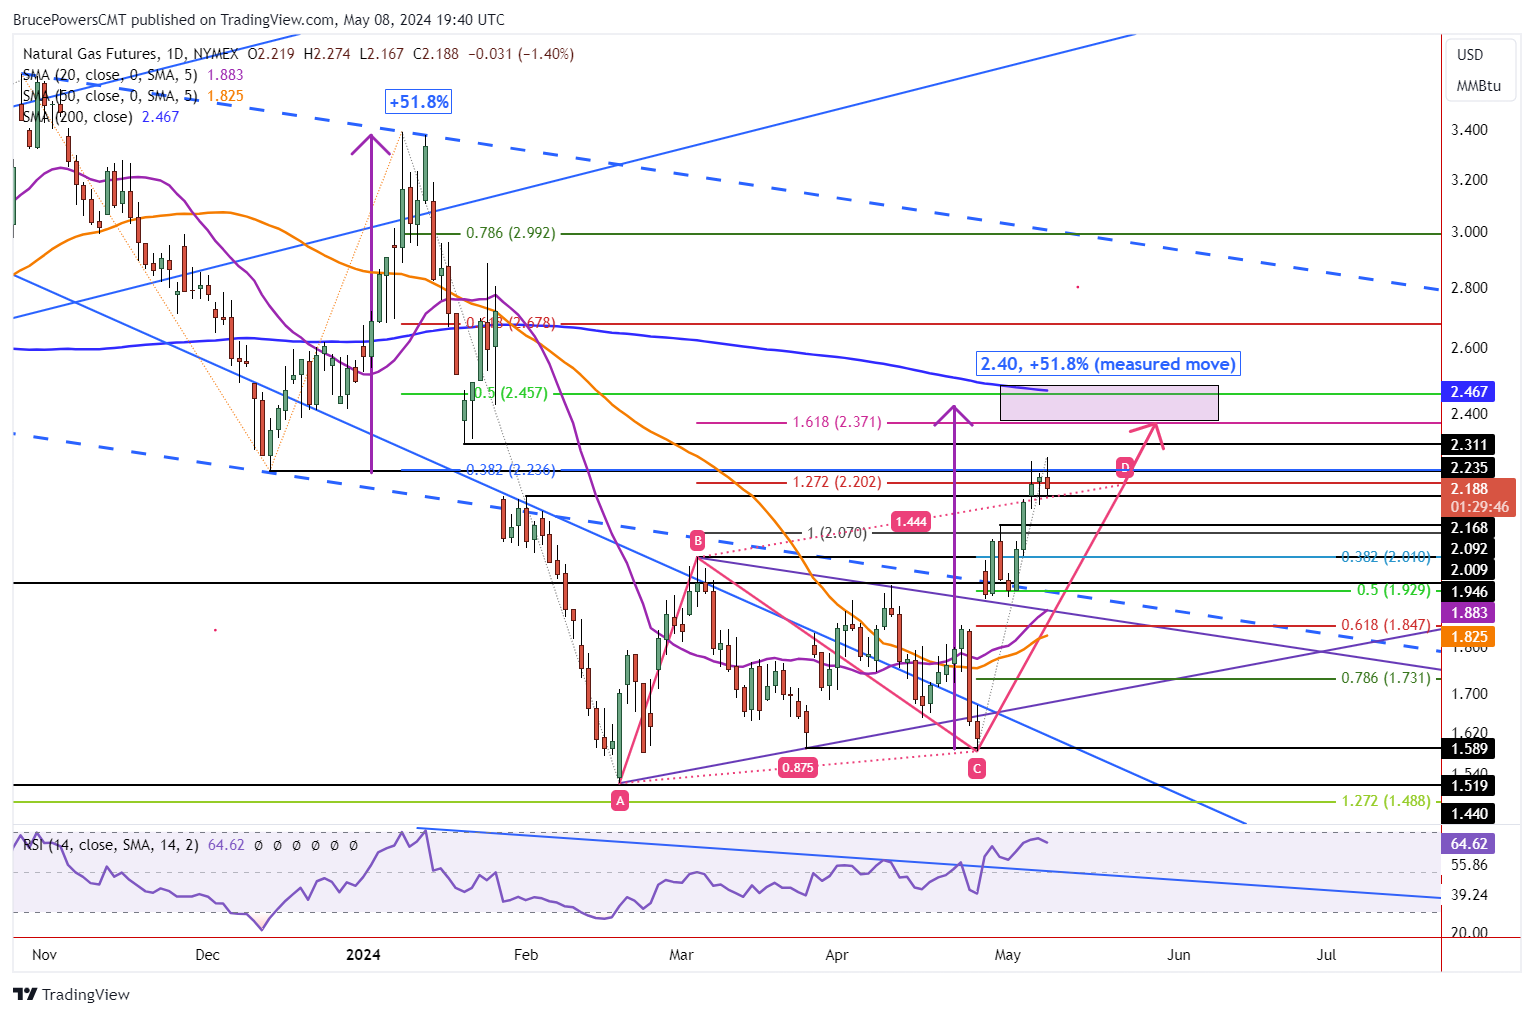
Failed Continuation
Price areas to watch on the way down include 2.09, 2.01, and a range from 1.95 to 1.93. The first level was previously the trend high from April 30. It is followed by the initial target from the rising ABCD pattern. And the lower range is derived from the April 2023 trend low and 50% retracement, respectively. Given today’s minor weakness following a new trend high, it looks likely that a pullback may come before new trend highs. Even if a new high is launched it may quickly encounter resistance as seen today as the launch pad is of questionable integrity.
Upside Target Begins at 2.37
Nevertheless, if the trend does continue higher, the next primary target zone is from around 2.37 to 2.47. The relatively long-range begins an approach towards the 200-Day MA at 2.40. A rising ABCD pattern with the CD leg extended by 161.8% of the AB leg is at 2.46. Moreover, a measured move completes at 2.40, followed by the 50% retracement at 2.37. The measured move is a match with the rally from the December 13 swing low on a percentage basis. That rally saw the price of natural gas rise by 51.8%. A similar percentage advance in the current rally completes at the 2.40 price level. The December 13 advance is being used as it was the largest advance of the past three rallies.
Read Full Story »»»
DiscoverGold
USDA & Adjusting Risk. The Corn & Ethanol Report
By: Daniel Flynn | May 8, 2024
We kickoff the day with MBA 30-Year Mortgage Rate, MBA Mortgage Applications, MBA Mortgage Market Index, MBA Mortgage Refinance Index, and MBA Purchase Index at 6:00 A.M., Wholesale Trade at 7:30 A.M., Wholesale Inventories at 9:00 A.M., EIA Energy Stocks at 9:30 A.M., Fed Jefferson Speech at 10:00 A.M., 17-Week Bill Auction at 10:30 A.M., Fed Collins Speech at 10:45 A.M., 10-Year Auction at 12:00 P.M., Fed Cook Speech at 12:30 P.M., and Dairy Products Sales at 2:00 P.M.
Were coming in lower this morning as traders prepare for Friday’s USDA May crop report. Talk on the street is the report is expected to produce “market fireworks” with initial 2024/25 world and US balance sheets included. Private analysts maintain that US 2023/24 and 2024/25 corn end stocks will hold above 2,000 Mil Bu while soybean and wheat stocks grow on larger pending soybean and wheat stocks grow larger pending harvests. And its doubtful that WASDE will cut the 2024 Russian wheat crop this early in the season with product pegged at 89-91 MMT’s. The May USDA reports are likely to be bearish. If we see a bullish USDA surprises, they will be 2024 South American crop sizes with WASDE expected to adjust Argentine corn (corn stunt disease) and Brazilian soybean crop lower due to historic flooding across RDDS. Argentine and Brazilian grain exports will be trimmed allowing a US export opportunity. The Argentine soybean was delayed by excessive rain which slowed the arrival of new crop soybeans product supplies to world importers. However the Argy soybean harvest has accelerated and nearing 45% complete with export licenses rising sharply. In the past week Argentine grain exporters registered 600,000 Mt’s of soybean, 1.12 MMT’s of meal, ^0,ooo Mt’s of soybean oil. Other news a national labor strike is planned across Argentina which includes the Oilseed Processors Union to protest President Milei’s tax hikes and the privatization of state assets. The strike is expected to be a 1-day affair and will not have a lasting impact on Argentine soybean crush or export potential. A weeklong window for US spring seeding is forecast for Central US with wet weather to return May 16th . The warm/dry 6-7 days should allow for considerable corn/soybean/spring wheat seeding progress. The forecasts call for wet weather to return to the Central US beyond May 16th . The chance of rain includes the Western Plains where cool temperatures favor Hard Red Winter wheat yields.
Read Full Story »»»
DiscoverGold
Agriculture Master Report
By: Bill Moore | May 7, 2024
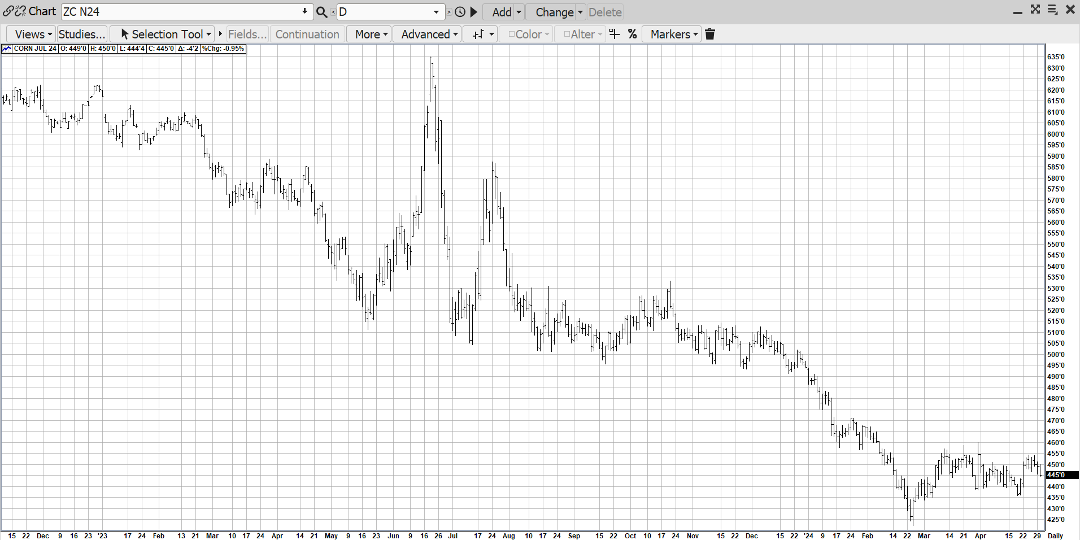
JULY CORN
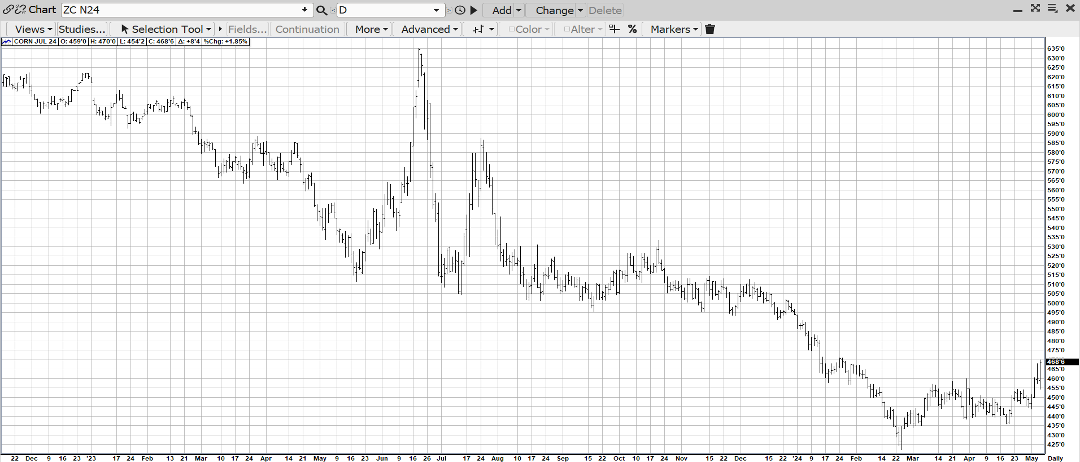
The above chart speaks volumes about July Corn’s upside technical breakout from a coiling, consolidation pattern the mkt was in from Feb-April! And strong fundamentals validate the move – prices are $2.00 cheaper than last Summer – thereby dialing in the adequate carry-over, weekly exports are 35% over 2023, extreme flooding has hurt S. Brazilian crops, excessive rains have slowed US planting & dryness in Russia has shrunk their wht crop! Finally, supportive macros came from the Fed last Friday as weaker-than-expected job #’s resurrected hopes for an easier monetary policy! In addition, the El Nina-La Nina weather shift suggests a hot & dry summer! From current price levels, there is no margin for error!
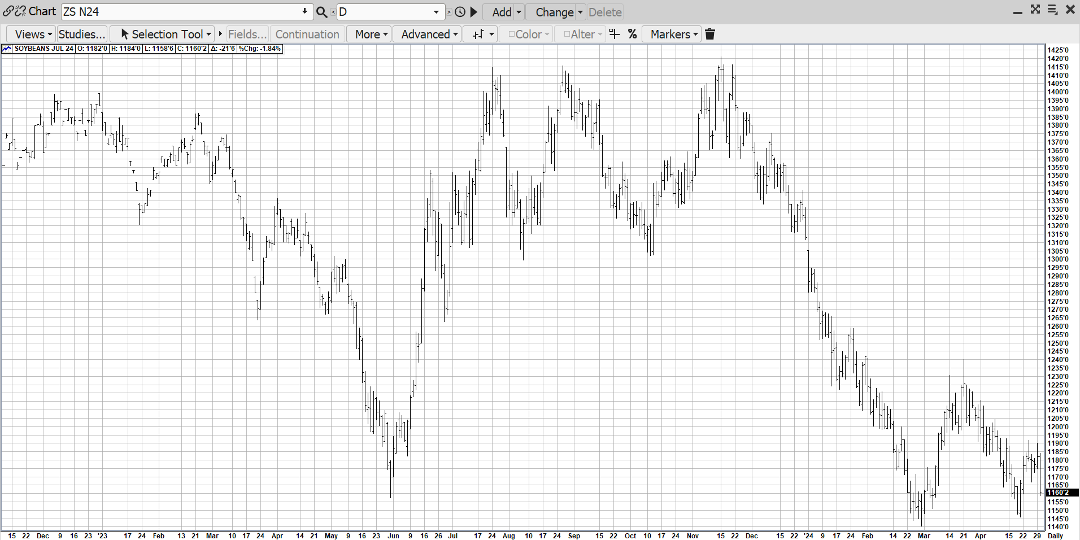
JULY BEANS
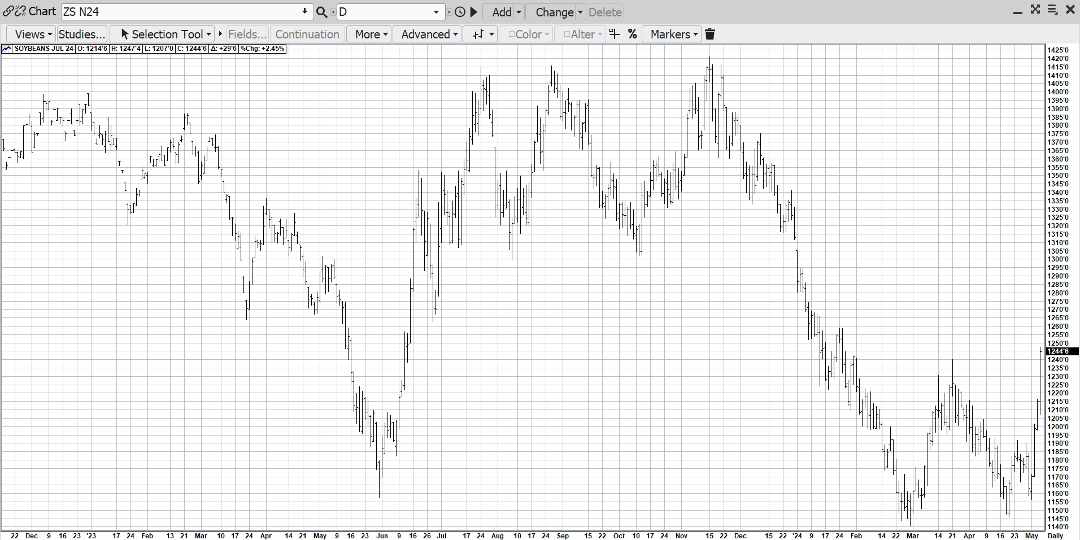
Likewise, July Beans have authored their own upside price explosion – rallying nearly $1.00 in just 4 mkt days – responding to the historic flooding in S Brazil – the worst in 83 years! The crops down there were already on the wane – this will certainly exacerbate their situation! As well, Argentina has its own set of problems with a recent frost & the high probability their transit workers are going on strike! The Feds lower Non-Farm payroll #’s were under expectations Friday which has helped break the US Dollar 200 points in a week – which is friendly for our exports! Like corn, beans are $2.00 cheaper than last summer – which should bring in more exports – & biodiesel demand is strong! We have seen what a weather hiccup in South America at the very tail-end of harvest can do to bean futures! That impact would certainly be magnified should the same thing occur in our growing season this summer!
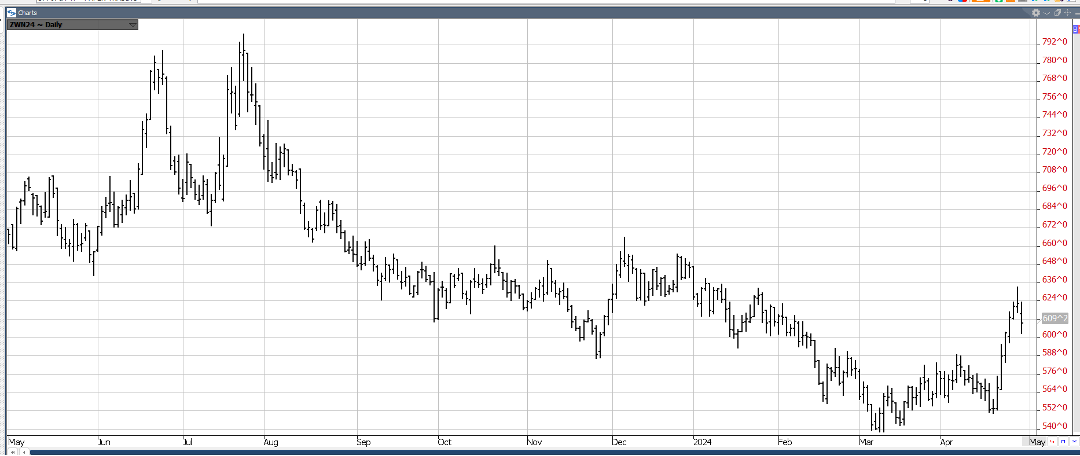
JULY WHT
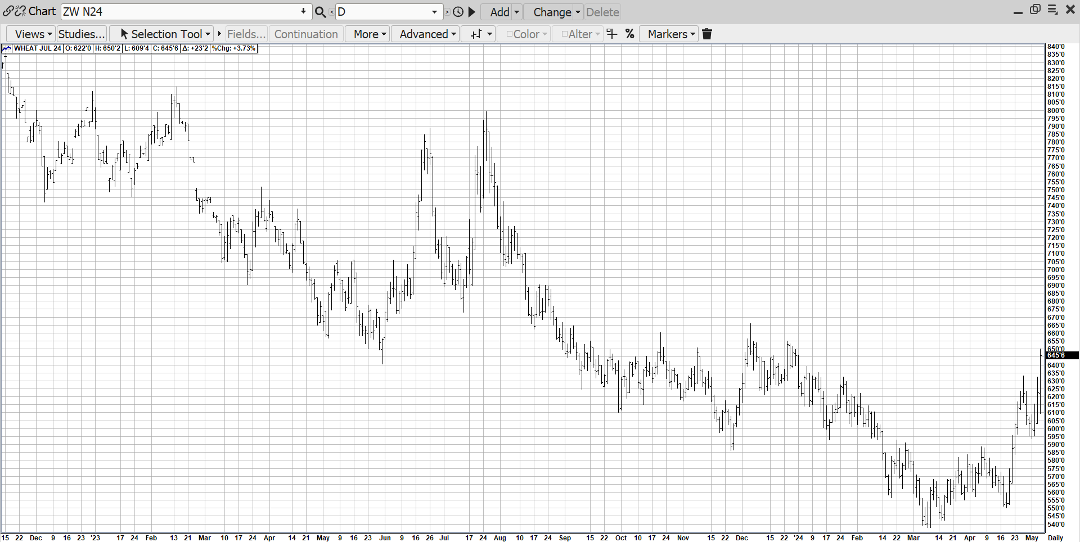
Unexpected rainfall in the SW Plains opened wheat futures lower but persistent dryness in the Black Sea areas impacting Russia & Ukraine rallied all three wht contracts rallied 22-23 cents higher! Russia has had the lowest precip for April in 10 years! Plus, spillover strength in corn (better exports, pltg delays) & beans (flooding in S Brazil) augmented the wht rally!
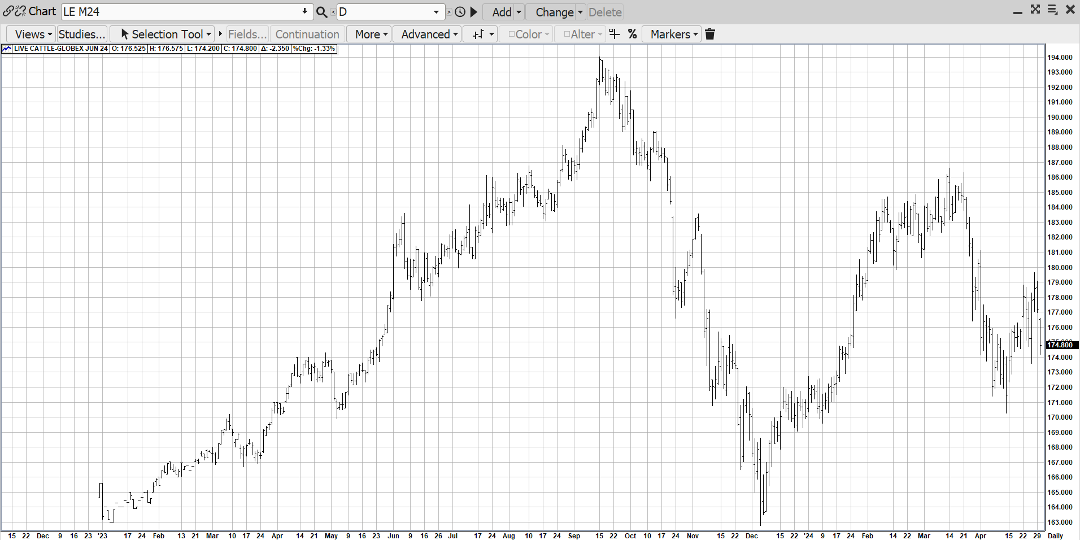
JUNE CAT
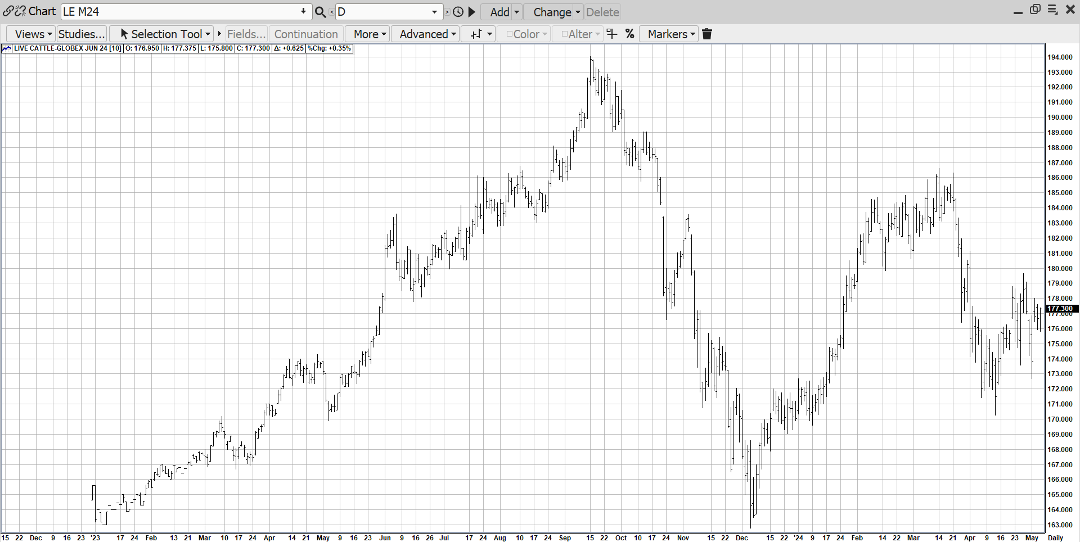
Persistent heavier daily weights & slaughter are offsetting the solid demand offered up by the “grilling season” keeping the June Cattle in tight trading pattern some $7-8 off its 2024 highs! Recurring Bird Flu rumors seem to stop any rallies but seasonal demand supports on breaks!
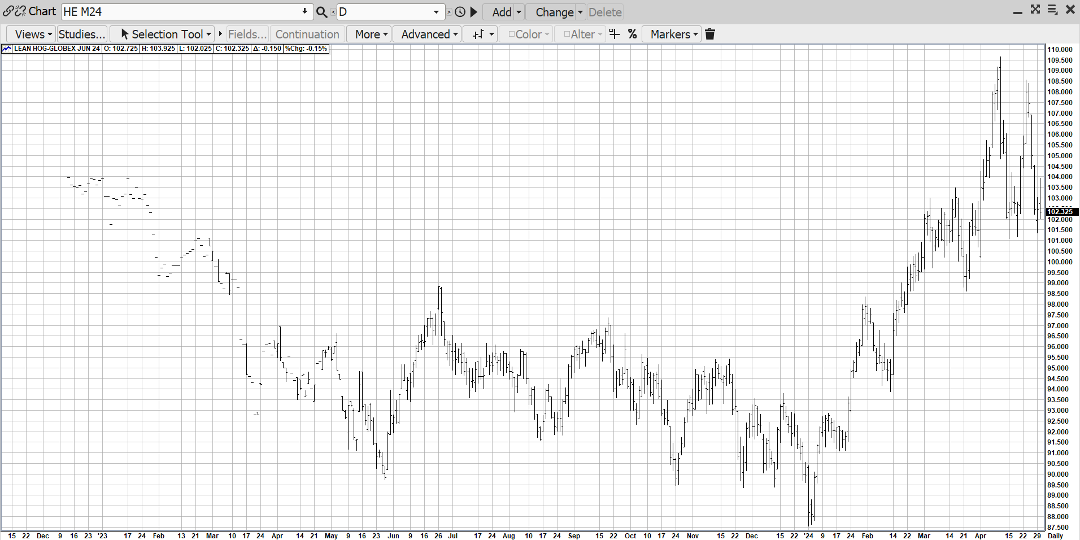
JUNE HOGS
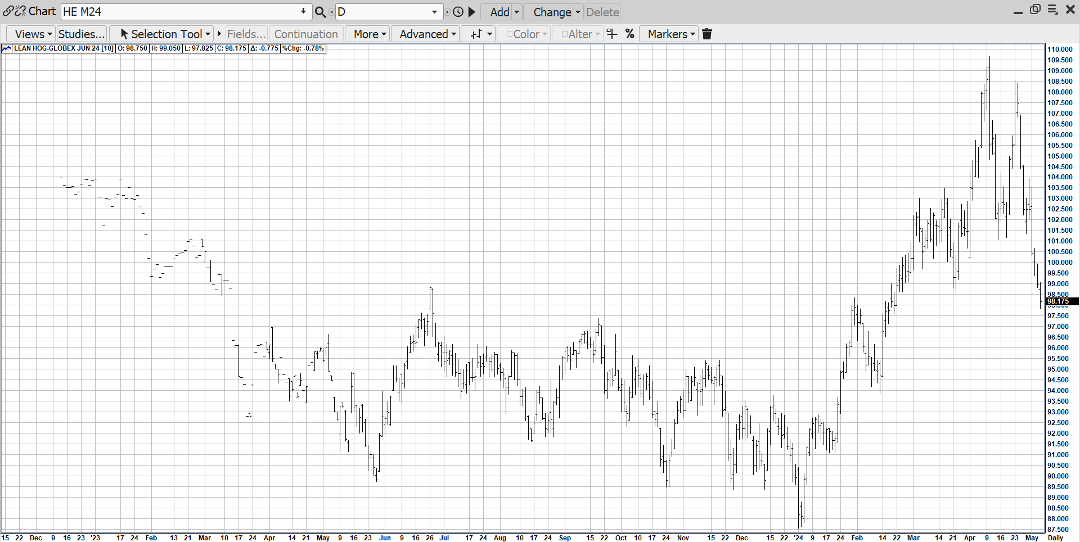
June Hogs have been a virtual “train wreck” the past 2 weeks – dropping $10 (108-98) due to several factors – a record long open interest, heavier daily weights, lost demand to beef due to Bird Flu mitigation & poor exports as a result of China’s over-production! However, the mkt is currently very oversold & due for a correction – especially in front of export sales Thur & the WASDE REPORT on Friday!
Read Full Story »»»
DiscoverGold
Natural Gas Testing Resistance Levels Amidst Bullish Momentum
By: Bruce Powers | May 7, 2024
• As natural gas approaches resistance levels, a breakout above 2.23 could lead to testing higher potential resistance areas, including the 200-Day MA at 2.47.
Natural gas pauses its ascent to again test resistance around the 38.2% Fibonacci retracement, which is at 2.24. Today’s high was 2.23, at the time of this writing, and natural gas is poised to end Tuesday with an inside day bullish doji hammer candlestick pattern. It reflects continuing strength in the advance. Further, Monday’s high slightly exceeded the 38.2% resistance zone to reach a trend high of 2.26 before turning down. Another rise above the 38.2% price area could see a continuation of the rising trend if signs of strength continue thereafter.
Inside Day Sets Up
An inside day provides a potential bull trend continuation setup. A decisive advance above today’s high would trigger the breakout. Then, further signs of strength should be seen to reflect increasing demand, including a daily close above today’s high. Once yesterday’s high is exceeded, the path is clear to test higher potential resistance areas. As noted in prior articles, the key higher price area to watch is around the 200-Day MA, now at 2.47. It is also marked by the 50% retracement at 2.46. In addition, a measured move completes at 2.40.
Measured Move Targets 2.40
The measured move is looking for a match with the mid-December rally on a percentage basis. That rally ended at a high of 3.39 to complete a 51.8% advance. A similar size move for the current rally completes at 2.40. It deserves attention especially since the target is close to the 200-Day line. When two or more indicators identify a similar price zone, it is the market’s way of identifying an area of interest. Since there is some distance to be traveled to approach the 200-Day line, it is anticipated to act as resistance on the first approach.
Watch Support on Deeper Pullback
Alternatively, if a deeper pullback happens before a bullish continuation, a drop below today’s low of 2.14 will provide the next sign of weakening. Yesterday’s low of 2.13 may act as near-term support, but if not the prior recent trend high at 2.09 is then a target. During uptrend, it is common for resistance around a prior trend high to act as support during pullbacks.
Read Full Story »»»
DiscoverGold
Grains Report: Wheat, Rice, Corn and Oats, Soybeans, Canola and Palm Oil
By: Jack Scoville | May 7, 2024
• WHEAT
General Comments: Wheat was higher yesterday on fund buying fueled by part patterns and the dry weather in Russia. Trends are up in Minneapolis. The weather is still a key, with extreme dryness reported in Russia and parts of the US and too wet conditions reported in Europe. The weekly export sales report showed poor sales once again and sales are not likely to improve anytime soon with the Dollar strength. Big world supplies and low world prices are still around. Export sales remain weak on competition from Russia, Ukraine, and the EU as those countries look to export a lot of Wheat in the coming period. Black Sea offers are still plentiful, but Russia has been bombing Ukraine again and shipments might be hurt from that origin.
Overnight News: The southern Great Plains should get mostly dry conditions. Temperatures should be above normal. Northern areas should see mostly dry conditions. Temperatures will average above normal. The Canadian Prairies should see mostly dry conditions. Temperatures should average above normal.
Chart Analysis: Trends in Chicago are mixed. Support is at 610, 596, and 593 July, with resistance at 661, 667, and 673 July. Trends in Kansas City are up with no objectives. Support is at 664, 637, and 630 July, with resistance at 682, 688, and 604 July. Trends in Minneapolis are up with objectives of 747 July. Support is at 709, 705, and 696 July, and resistance is at 733, 738, and 746 July.
• RICE
General Comments: Rice closed lower in old crop months yesterday, but higher in new crop months as spreads got adjusted. The futures market overall remained in a short term trading range. Support comes from adverse weather in South American growing areas while new selling is noted from the potential for a big crop in the US. The big US crops are now in doubt from reports of extreme rains in southern growing areas and especially near Houston. Supply tightness is expected to give way to increased production this year and greatly increased supplies this Fall. These ideas are reflected in the prices seen in the cold crop and the new crop.
Overnight News:
Chart Analysis: Trends are down with no objectives. Support is at 1827, 1785, and 1750 July and resistance is at 1915, 1955, and 1972 July.
• CORN AND OATS
General Comments: Corn and Oats closed higher yesterday on fund buying tied to reports of adverse production conditions in South America. The Argentine crop has been hit by stunting disease that robs yields and the Brazil Winter crop is suffering from hot and dry weather. Demand has been the driving force behind the rally but now South American weather is the driving force. Increased demand was noted in most domestic categories along with rising basis levels, and export demand has been strong. Ethanol demand has turned less due to weaker petroleum prices seen lately. There is very dry weather for the Winter crops in central and northern Brazil
Overnight News:
Chart Analysis: Trends in Corn are up with objectives of 470 July. Support is at 460, 454, and 450 July, and resistance is at 470, 477, and 483 July. Trends in Oats are up with no objectives. Support is at 383, 378, and 362 July, and resistance is at 402, 408, and 414 July.
• SOYBEANS
General Comments: Soybeans and the products closed higher yesterday, with Soybean Meal higher and Soybean Oil lower. Support for Soybeans came from reports of excessive rains falling on unharvested crops in southern Brazil. Rains up to 400 mm were reported by newswires. Ideas of less bio fuels demand have hurt Soybean Oil prices. Some selling from Brazil and Argentina was noted on the early rally attempt last week. Reports of great export demand in Brazil provide some support. Reports indicate that China has been a very active buyer of Brazil Soybeans this season. Ideas that South American production is taking demand from the US have pressured futures lower. Domestic demand has been strong in the US but has suffered as crushers were crushing for oil. Oil demand has suffered as cheaper alternatives for feedstocks hit the bio fuels market. Funds remain short in the market.
Overnight News:
Chart Analysis: Trends in Soybeans are up with objectives of 1248 July. Support is at 1221, 1216, and 1204 July, and resistance is at 1248, 1260, and 1267 July. Trends in Soybean Meal are up with no objectives. Support is at 375.00, 370.00, and 361.00 July, and resistance is at 385.00, 393.00, and 397.00 July. Trends in Soybean Oil are mixed. Support is at 4260, 4200, and 4140 July, with resistance at 4410, 4460, and 4530 July.
• CANOLA AND PALM OIL
General Comments: Palm Oil was lower last week on weaker bio fuels demand but found some support late in the week on reports of strong demand from India and reports of reduced production. Trends are down on the daily and weekly charts. Canola was higher despite weaker prices in world vegetable oils markets. Farmers concentrate on fieldwork and not selling.
Overnight News:
Chart Analysis: Trends in Canola are mixed. Support is at 639.00, 616.00, and 603.00 July, with resistance at 651.00, 52.00, and 560.00 July. Trends in Palm Oil are mixed to down with objectives of 3790 and 3650 July. Support is at 3780, 3740, and 3700 July, with resistance at 3930, 4020, and 4040 July.
Midwest Weather Forecast Mostly dry. Temperatures should average near to below normal.
Read Full Story »»»
DiscoverGold
Softs Report: Cotton, OJ, Coffee, Sugar, Cocoa
By: Jack Scoville | May 7, 2024
• COTTON
General Comments: Cotton was lower yesterday and trends are mixed in the market. Demand remains a problem. The export sales report showed poor sales once again and demand is not likely to improve with the Dollar stronger. USDA made no changes to the domestic supply or demand sides of the balance sheets, but did cut world ending stocks slightly. Trends are still down on the weekly charts. Demand has been weaker so far this year. The US economic data has been positive, but the Chinese economic data has not been real positive and demand concerns are still around. However, Chinese consumer demand has held together well, leading some to think that demand for Cotton in world markets will increase over time.
Overnight News: The Delta will get mostly dry conditions and near normal temperatures. The Southeast will see showers and rains and below normal temperatures. Texas will have mostly dry conditions and near normal temperatures. ICE said that 0 notices were post4ed for delivery against May futures and that total deliveries for the month are now 411 contracts.
Chart Trends: Trends in Cotton are mixed. Support is at 74.90, 74.00, and 73.40 July, with resistance of 79.80, 80.70 and 81.40 July.
This Week Last Qeek Last Year Average
Cotton Planted 24 15 20 20
• FCOJ
General Comments: FCOJ closed lower yesterday and held the trading range once again. Reports of tight supplies are around. Nielsen is reporting less retail demand due to the higher prices and volumes sold at retail have sagged. Futures still appear to have topped out and a range trade has been seen. There are no weather concerns to speak of for Florida or for Brazil right now. The weather has improved in Brazil with some moderation in temperatures and increased rainfall amid reports of short supplies in Florida and Brazil are around but will start to disappear as the weather improves and the new crop gets harvested.
Overnight News: Florida should get scattered showers or dry conditions. Temperatures will average near normal. Brazil should get scattered showers and above normal temperatures. ICE said that 0 notices were posted for delivery against May futures and that total deliveries for the month are now 0 contracts.
Chart Trends: Trends in FCOJ are mixed. Support is at 354.00, 350.00, and 347.00 July, with resistance at 380.00, 391.00, and 392.00Julay.
• COFFEE
General Comments: New York closed lower and London was closed yesterday. The lack of Robusta Coffee in the market was the main feature, but less offers of Arabica are also noted. This appears to be changing. There were some indications that Brazil and Vietnam producers were now offering Coffee, Vietnamese producers are reported to have about a quarter of the crop left to sell or less and reports indicate that Brazil producers are reluctant sellers for now after selling a lot earlier in the year. The next Robusta harvest in Brazil is continuing and offers for all Coffee increased last week in part on weakness in the Real. Roasters and other buyers are pulling back from the market in hopes of lower prices down the road.
Overnight News: The ICO daily average price is now 205.50 ct/lb. Brazil will get mostly scattered showers with near normal temperatures. Central America will get mostly dry conditions. Vietnam will see scattered showers. ICE NY said that 0 notices were posted for delivery today and that total deliveries for the month are now 1,018 contracts.
Chart Trends: Trends in New York are down with objectives of 201.00 July. Support is at 193.00, 187.00, and 183.00 July, and resistance is at 200.00, 208.00 and 212.00 July. Trends in London are down with no objectives. Support is at 3400, 3370, and 3330 July, with resistance at 3770, 3810, and 3950 July.
• SUGAR
General Comments: New York held to a two week long trading range with London closed. There are still ideas that the Brazil harvest can be strong for the next few weeks if not longer and production data released a few weeks ago by CONAB indicated that the cane harvest could be less, but that Sugar production could be higher. Indian production estimates are creeping higher but are still reduced from recent years. There are worries about the Thai and Indian production, but data shows better than expected production from both countries. Offers from Brazil are still active but other origins. are still not offering in large amounts except for Ukraine. Ukraine offers have suffered lately with the war.
Overnight News: Brazil will get rains in the south and scattered showers in the north. Temperatures should average above normal. India will get mostly dry conditions and below normal temperatures.
Chart Trends: Trends in New York are mixed. Support is at 1890, 1860, and 1830 July and resistance is at 2050, 2100, and 2100 July. Trends in London are mixed. Support is at 560.00, 554.00, and 548.00 August, with resistance at 579.00, 590.00, and 600.00 August.
• COCOA
General Comments: New York was lower in range trading yesterday and London was closed. Trends are down on the daily charts. It seemed that speculators were liquidating long positions. Production concerns in West Africa as well as demand from nontraditional sources along with traditional buyers keep supporting futures. Production in West Africa could be reduced this year due to the extreme weather which included Harmattan conditions. The availability of Cocoa from West Africa remains very restricted and projections for another production deficit against demand for the coming year are increasing. Ideas of tig8ht supplies remain based on more reports of reduced arrivals in Ivory Coast and Ghana continue. Mid crop harvest is now underway and here are hopes for additional supplies for the market from the second harvest. Demand continues to be strong, especially from traditional buyers of Cocoa.
Overnight News: Isolated showers are forecast for West Africa. Temperatures will be near normal. Malaysia and Indonesia should see scattered showers. Temperatures should average near normal. Brazil will get isolated showers and above normal temperatures. ICE NY said that 0 contracts were tendered for delivery against May futures and that total deliveries for the month are now 904 contracts.
Chart Trends: Trends in New York are down with no objectives Support is at 6990, 6300, and 5980 July, with resistance at 8790, 9670, and 10210 May. Trends in London are down with no objectives. Support is at 6330, 5960, and 5230 July, with resistance at 7220, 8200, and 8900 July.
Read Full Story »»»
DiscoverGold
The Corn & Ethanol Report. Fund Liquidation Before WASDE
By: Daniel Flynn | May 7, 2024
We kickoff the day with Redbook YoY at 7:55 A.M., RCM/TIPP Economic Optimism Index at 9:00 A.M., NY Fed Treasury Purchases 0 to 1 yrs. at 9:30 A.M., Fed Kashkari Speech and 42-Day Bill Auction at 10:30 A.M., 3-Year Note Auction at 12:00 P.M., Consumer Credit Change at 2:00 P.M., API Energy Stocks, Used Car Prices MoM & YoY, and LMI Logistics Managers Index at 3:30 P.M.
The grains had a turnaround yesterday. Unfortunately the market is having a tough time of deciphering basic fundamentals which is adding to volatility and heavy shorts wanting to command and dominate the marketplace. Managed money has been liquidating longs which help propel yesterday’s rally. If CBOT calendar spreads may cause fund managers to roll forward and hold a net short position. Traders are looking for fund managers next move. Do they keep their powder dry? Or most likely window dress before their next short onslaught. Average estimates for Friday’s USDA report are 696 Mil Bu of US 2024/25 wheat end stocks unchanged, 2,100 Mil Bu of corn down 22 Mil Bu, and 339 Mil Bu of soybeans which is unchanged. New crop US 24/25 end stocks are forecast at 786 Mil Bu of wheat (up 90 Bil Bu from 23/24, 2,285 Mil Bu of corn (up 185 Mil Bu), and 431 Mil Bu of soybeans (up 90 Mil Bu). Internationally, traders look for the WASDE to report a 52 MMT’s of Argy corn crop (down 3 MMT’s), 49.6 MMT’s soybean crop (down 400,000 MT’s), a Brazilian soybean crop of 152.5 MMT’s (down 2.5 MMT’s). The USDA could forecast a 24/25 Brazilian soybean crop at a record large 166-168 MMT’s. It will be difficult for Friday’s WASE report to be overly bullish. So buckle up your chinstrap as volatility and volume are expected to pick up in the US market.
Read Full Story »»»
DiscoverGold
Commodities Daily Market Movers (% Price Change)
By: Marty Armstrong | May 7, 2024
• Top Movers
Wheat #2 6.02 %
Wheat CBT Futures 4.21 %
Soybean Meal CBT Futures 4.14 %
NY Palladium Futures 3.67 %
NSW Baseload Electricity Continuous 3.54 %
• Bottom Movers
Eggs 22.77 %
Cocoa (NYCSCE) Futures 6.84 %
Coffee (NYCSCE) Futures 2.76 %
Gold / Silver Ratio 2.4 %
Platinum / Gold Ratio 2.38 %
*Close from the last completed Daily
DiscoverGold
What Cut? The Energy Report
By: Phil Flynn | May 7, 2024
The oil market was trying to get its hands around the impact of Israel’s military operation in Gaza against a backdrop warning from a Chevron CEO about upside risk to the price of oil when Russia’s Alexander Novak seemed to pull cold water on one of the bullish oil market narratives.
Oil rose as Israeli forces took control of the Palestinian side of Rafah crossing in Gaza but was subdued as the operation looked very targeted and professional. That was after a desperate attempt by Hamas to try to convince the world that they have accepted the ceasefire proposal from Israel the only problem is that was not the ceasefire proposal that Israel offered.
While all the signs were pointing towards the fact that OPEC plus Russia was going to not only to follow through with their production 2.2 million barrel a day production cut into the end of the year possibly talk about extending those cuts into the New Year It was supposed to be augmented with makeup cuts from the producers like Kazakhstan and Iraq that had over produced.
And instead of that tidy little narrative overnight Russians Novak talked about the possibility of increasing oil production.
Novak suggested that under the OPEC deal, it may still be possible to increase oil production. He suggested that no deal has been agreed to and it’s still being analyzed by Russia.
Russia’s Novak of course has always played” bad cop” going into these OPEC plus meetings. Disagreement on production cuts years ago between OPEC and Russia was one of the reasons why they had a production war which eventually caused oil prices to crash to below zero. Novak said that “There is no need to predict further OPEC+ steps, we must look at the market.
And right now, based on the way the markets have been acting, OPEC needs to act as it seems like the market is less concerned about tight supply than it was just a few weeks ago.
Surprise increases in U.S. oil supplies and a drop in US exports suggest that perhaps global demand isn’t as strong as it should be.
John Kemp at Reuters points out that went through the wells calendar spreads have narrowed sharply over the last month in other words flipping from concerns about undersupply to supply so it will be more comfortable in the second half of the year.
If that is the case, then OPEC needs to show solidarity and continue along with their production cuts in Russia’s gentle threat that they could increase oil production is one of the reasons why oil prices have given up some of its gains overnight.
My take on this story from Russia is that it’s just typical pre-OPEC meeting positioning. I think OPEC plus Russia is gonna speak loud and strong because they don’t want to give up the dominance that they have achieved in securing its market share, While there are definitely some issues as far as producers that want to produce more that they will have to deal with I think that will be a problem for next year. I think the entire group realizes that they need to stick together, and they will probably achieve their objective of reducing global supplies in the next couple of months. That means that you should be prepared for upside price risks going forward,
As far as the geopolitical risk factors Biden administration as saying that, if need be, they will be able to tap the Strategic Petroleum Reserve even though they have taken steps to drain it down to its lowest levels in decades. President Joe Biden’s energy adviser Amos Hochstein said on Monday that the U.S. has sufficient supply of oil in the Strategic Petroleum Reserve to address any supply concerns and is monitoring markets on how to use it.
From a technical area of the market still looks extremely oversold at this point and more than likely as close to a bottom seasonal demand should pick up and it’s very clear that the Energy Information Administration has consistently underestimated demand for both gasoline and diesel.
This comes as the CEO of Chevron Mike Wirth is reiterating his warning that there are significant upside price risks to oil.
He also said that natural gas demand will rise on electricity consumption from data centers. He says that Wind and solar still face challenges meeting peak demand due their reliance on variable weather.
He says that reliable baseload power is needed to support renewables and natural gas is the most likely source, he said.
Remember how Transportation Secretary Pete Buttigieg was telling us what a great deal electric car were? Remember how he seemed to blame everybody for not buying that electric car when gasoline prices went up.
I assume he was talking about getting away so away from some of those gasoline taxes that the federal government collects or perhaps the state government collects, where the local government collects. Well now it appears that governments across the globe now want the drivers of electric cars to pay their fair share.
The Financial Times reports that ‘Global policymakers are imposing new taxes on electric vehicles as the shift away from combustion engines threatens to leave a $110bn hole in government revenues owing to a drop in receipts from fuel duties.” So the old adage remains, If you build it! They will tax it!
The UK, New Zealand, Israel and the majority of US states are among jurisdictions introducing tax changes and charges on EVs and hybrid vehicles designed to raise funds and compensate for declines in petrol and diesel excise taxes. The measures are varied, running from registration fees to road usage charges based on mileage and taxes on public charging points. EV owners and green campaigners say they will slow society’s switch from gas-guzzling vehicles to lower-emissions alternatives.”
Reuters is reporting that oil output at Kazakhstan’s giant oilfield Tengiz, operated by Chevron-led CVX.N Tengizchevroil, declined by 25% over May 1-5 from April’s average level to 474,000 barrels per day (bpd), a source familiar with the data told Reuters on Monday.
Natural Gas is risng as US production is falling and demand is rising. Nat gas production in the US fell to 96.9 in May down from 98.1 in April. Increased flows to Freeport and Delays in Cheniere maintenance is helping reduce the Nat gas glut. The long term outlook for gas is getting stronger as green energy realities are sinking in.
Oil Price reports that Back in January, Cheniere predicted that China’s demand for LNG exports could double over the next decade, as reported by the South China Morning Post (SCMP). In the U.S., electricity demand is expected to soar by up to 20% by 2030, based on April data from Wells Fargo, with natural gas demand potentially increasing by 10 billion cubic feet per day as a result. Additionally, Goldman Sachs predicts that natural gas will account for 60% of new electricity demand from data centers, compared to estimated 40% market share for renewables, with gas pipeline operators to benefit significantly.
Read Full Story »»»
DiscoverGold
The grain complex is blasting upward.
The Corn & Ethanol Report. Turnaround Tuesday On Monday
By: Daniel Flynn | May 6, 2024
We kickoff the week with Export Inspections at 10:00 A.M., 3-Month & 6-Month Bill Auction at 10:30 A.M., Fed Barkin Speech at 11:50 A.M., Fed Williams Speech at 12:00 P.M., Loan Officer Survey at 1:00 P.M., Dairy Products at 2:00 P.M., and Crop Progress at 3:00 P.M.
Grain futures started out lower with soybean products reversing last week’s trend. The big Monday decliner was KC Wheat due to better than expected rain that fell across Western Kansas late Friday and early Saturday which diminished the drought. The July KC/Chicago spread to a 20 cent premium. Corn and soybeans followed suit with weakness. During trade this morning it seems that fundamentals may start to take hold. The forecast of more Central US rainfall and a window to seed spring crops in the 5-10 day period. Ag Resources estimates that US farmers were able to seed 36-37% of their corn and 27-28% of their soybean crops through Sunday. Such a seeding pace is only slightly lower below the 5-Year average. Breaks in the market are now buying opportunities. Funds have been forced to cover shorts, but estimations on the street, has funds with a sizable short positions at 200-205,000 contracts. The USDA has their important May WASDE report this Friday. The report will provide the first field survey estimates of US winter wheat crop. WASDE also will update 2024/25 US balance sheets based on the March Seeding Intention report and release the first forecast of world 2024/25 crop production and balance sheets. The trade is based for a bearish USDA report based on the USDA’s reluctance to drop ’24 South American crop sizes to date with Brazil likely to harvest a record 167-169 MMT’s ’25 soybean crop. And another big Russia wheat crop will also be forecast. Again, getting back to managed money cutting the size of their CBOT grain short position due to Argentine corn stunt disease, historical flooding in RGDS in Southern Brazil, and expanding area of Black Sea dryness including Southwest and Central Russia. Although final crop losses will take weeks to decipher, the cuts are important and place more importance on the European/US growing seasons on growing export potential. Unfortunately weather forecasts stay dry for SW Russia/Ukraine and too wet for RGDS in Southern Brazil, which could bolster final loss estimates.
Read Full Story »»»
DiscoverGold
Price Matters. The Energy Report
By: Phil Flynn | May 6, 2024
While some in the marketplace are concerned about weak demand, a move by Saudi Arabia to raise their price for oil seems to suggest that they’re not that concerned. Consider the fact that the well prices according to technical analysis, West TX intermediate crude prices are close to the 100-day moving average and now are the most oversold on a 14-day relative strength index basis since they bottomed out last December.
Now with the Gaza ceasefire talks falling apart, as was expected, the market is starting to realize that the geopolitical risk factors have not gone away. Reports say that Israel is warning Palestinians to evacuate parts of Rafah as they prepare to move to remove Hamas from the area. Reports say Israel struck an area overnight from which Kerem Shalom was attacked. Israel Prime Minister Benjamin Netanyahu made it very clear that just ending the war in Gaza would keep Hamas in power and that would pose a threat that Israel cannot accept. They would be willing to pause fighting in Gaza in order to secure the release of hostages but obviously it doesn’t look like that’s going to happen.
This comes as Saudi Arabia and OPEC plus used their market might and sent a message signaling that they’re not only going to continue their voluntary production cuts into the end of the year but potentially in the New Year. On top of that, the market pricing and the potential for even deeper cuts as Iraq has vowed to make compensation cuts this year of 602,000 barrels a day, we also have a commitment from Kazakstan vowing to reduce production by an additional 389,000 barrels a day.
Bloomberg reported that Saudi Arabia raised the price of its flagship crude to Asia for a third consecutive month, as the kingdom tries to tighten the oil market to prevent a global surplus. Saudi Aramco raised the June official selling price of Arab Light crude for customers in Asia by 90 cents to $2.90 a barrel above the regional Oman-Dubai benchmark, according to a price list seen by Bloomberg. It compares with an increase of 60 cent forecast in a Bloomberg survey of six refiners. Prices for other lighter and heavier varieties were also increased from May.
Gasoline demand in recent weeks has been poor and even though there are reports that it’s improving. In the big picture, Woods MacKenzie is predicting that gasoline demand will be weak because of the greater adoption of electronic vehicles. There are reports that quote penetration of electronic vehicles has been increasing in the US and China this year. Chinese gasoline demand will only grow by 10,000 barrels a day due to a higher electronic vehicle uptake.
Yet despite spite recent mixed signals about U.S. oil demand, the reality is that we’re seeing the science of supplies are going to tighten. We did see a big drop in rig counts for both oil and natural gas last week.
The weekly count for oil dropped to 499 from 506, while gas lost three rigs week to week at 102, Baker Hughes said Friday. The miscellaneous tally grew by two to four. A year earlier, the US had 588 oils, 157 gas and three miscellaneous rigs in operation, the company’s data showed.
We see signs that demand should pick up this weather starts to kick in to more summer like temperatures. I think that last week was a great buying opportunity.
Reports that the Freeport LNG export terminal was taking more inflows last week and they hope that power generation for artificial intelligence and Bitcoin mining and data centers will create an explosion in demand for natural gas next year. It is giving the markets some hope in the face of pretty overwhelming supplies. The market is trying to bottom, and it still might be a good time to buy some long-term calls.
Read Full Story »»»
DiscoverGold
Cocoa declined 23.1% this week, its biggest weekly decline in history
By: Barchart | May 3, 2024
• Cocoa declined 23.1% this week, its biggest weekly decline in history.

Read Full Story »»»
DiscoverGold
Natural Gas Eyes on Further Gains
By: Bruce Powers | May 3, 2024
• Natural gas breaks to a new trend high of 2.16, triggering a monthly breakout. It is likely to close strong, hinting at a continuation higher into next week.
Natural gas breaks out to a new trend high of 2.16 on Friday and it is on track to close strong, in the upper quarter of the day’s range. If it does, a continuation higher heading into next week looks to be on the table. The weekly chart is also set to end strong for the second week in a row.
Further, a monthly breakout triggered today on a move above April’s high of 2.09. Today’s high approached a resistance zone from late-January and early-February with a high for the range at 2.17. If that high gets busted, higher price levels become targets.
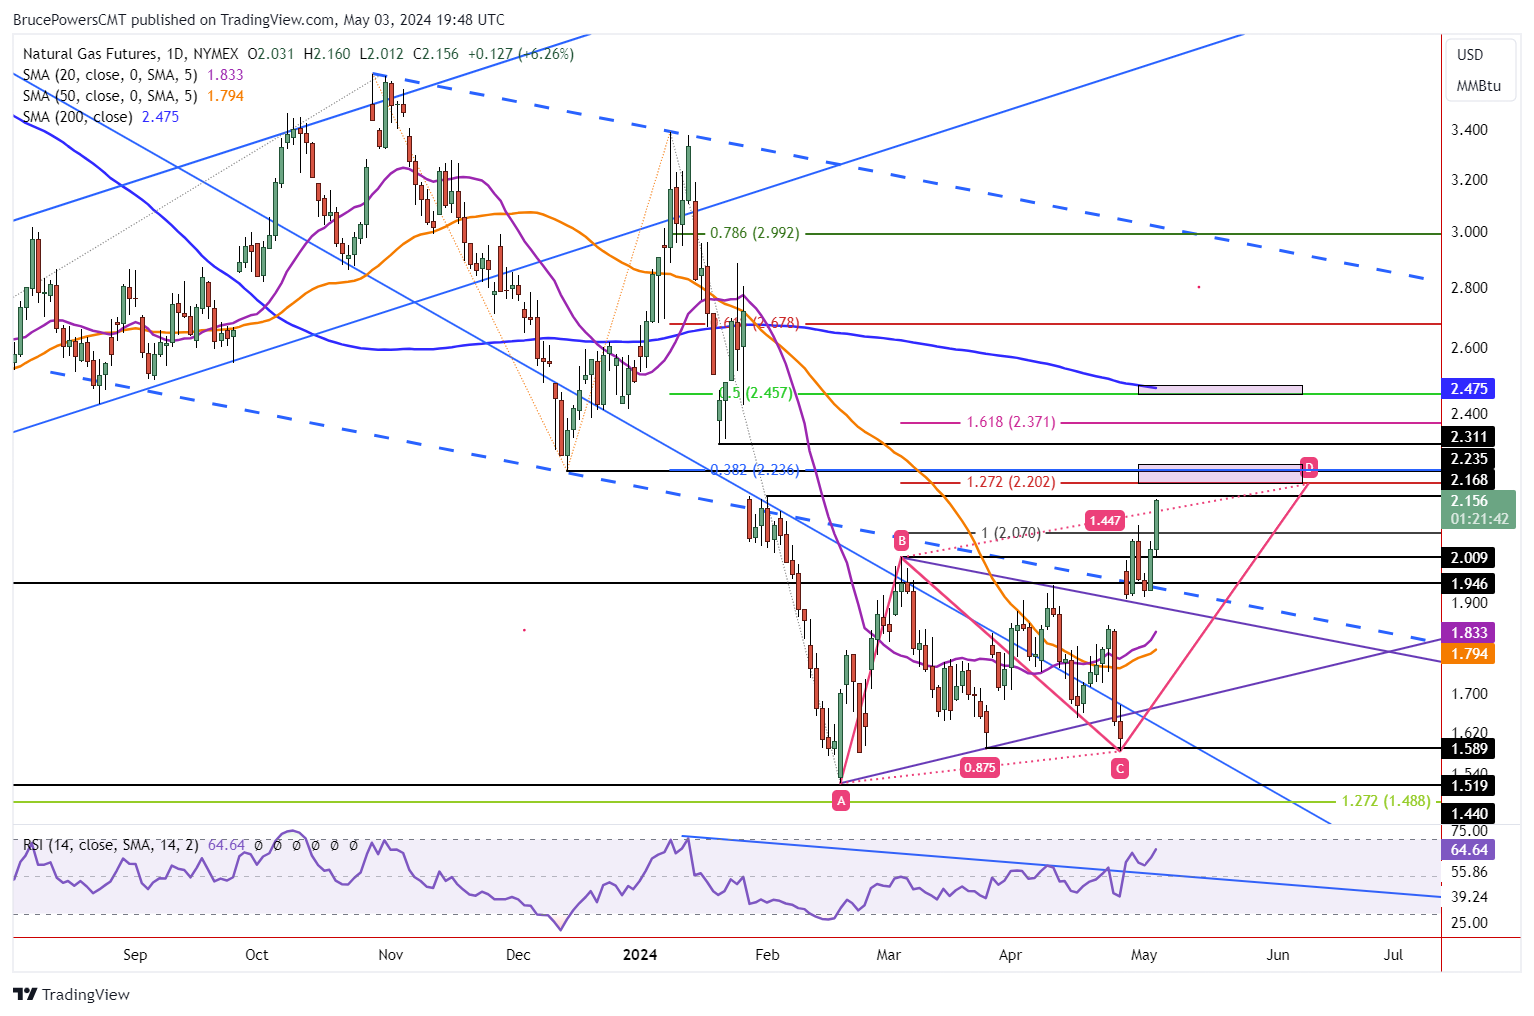
Improvement in Momentum
Given the improvement in momentum and the likely strong closing price for the week, the initial targets could eventually be exceeded. That is, if demand remains strong. The next target zone begins with the completion of an extended rising ABCD pattern at 2.20. That is where the CD leg of the advance is 127.2% of the AB leg.
Nonetheless, an initial Fibonacci retracement of 38.2% is at 2.24, with that price level confirmed by previous support from the December 11 swing low. If natural gas can get through that price level and keep rising it may have a chance to eventually test resistance around the 200-Day MA, which is currently at 2.47.
Signs of Strength in Monthly Chart
Confirmation of strength on both the monthly and weekly charts provides further evidence for a bullish reversal of the bottom from February. This means that that rally should have more to go, and it may just be getting started. Today’s price action extends an advance off support around the lower blue dash trend channel line.
In general, once prices rise above from support at the bottom of a channel, an eventual target is the top channel line. This doesn’t mean it will be reached, just that it could be. Of course, the price represented by the upper line will depend on when it is reached, given that it is downward sloping. However, given that it is now a potential target, it may make the lower price targets more likely to be reached.
Read Full Story »»»
DiscoverGold
Play It! The Energy Report
By: Phil Flynn | May 3, 2024
I was shocked to hear there was gambling going on at Ricks Café and equally shocked to hear that Biden’s price caps on Russian oil have failed. In 2022 the administration of Joe Biden tried to impose a price cap to cut oil revenues for Russia, a major source of funding for its war against Ukraine. Now as my buddy Anas Alhajji points out, the Russian Urals crude price is about $15 above the price cap and is very concerned about who is going to tell Treasury Secretary Yellen or Biden.
Of course if Ms. Yellen or Biden read my report back then, I could have saved them the trouble of putting on the ill-fated price cap in the beginning. I predicted that the price caps would fail and if they asked me, who knows, it could have been the start of a beautiful friendship.
I’m no good at being noble, but it doesn’t take much to see that the problems with price caps are that they never work, and never have worked. People will either find a way around them or if they are truly enforced, it will lead to shortages. You show me a price cap, then I will show you a shortage. Yet the shortage did not happen because the price caps were never enforced.
This week Reuters reported that a group of Western insurers said a Russian oil price cap has become unenforceable and only pushed more ships into joining a shadow fleet, delivering one of the harshest rebukes to the measure that had been meant to cut revenue to the Kremlin. Now there are more calls in congress to lift the Russian oil price caps and try – maybe – some sanctions that might work.
First the Biden administration has been trying to convince people over the last couple of years that the price caps were working. Now it’s clear that they never really did work and I told them that.
Biden’s spendthrift ways of throwing money at the electric car industry, as we said, was doomed to fail and it is failing. Biden’s attacks on the US oil and gas industry and the reversal of many of Trump’s policies on energy was the start of his problems. Killing pipelines, drilling moratoriums and extreme regulations are some of the factors that is causing inflation. His tapping of the Strategic Petroleum Reserve for purely political purposes was part of his ill fated energy policy. Biden’s foreign policy in the Middle East by going hard on Saudi Arabia and soft on Iran has had devastating consequences for the globe. Biden’s energy policies may very well be the reason why he could lose his reelection. Maybe he’ll always have Paris. Paris, as in the Paris Climate accord, at least until the next president pulls out of it. Here’s looking at you, kid.
Yet this week it was the Fed that did more to bring down oil prices than anything Biden or Janet Yellen did. This week the story was bigger than expected increase in crude oil supplies, disappointing gasoline demand and real concerns that the Federal Reserve was going to have to induce a recession to get inflation under control. The problems are being complicated by a slowdown in US manufacturing and talk of the possibility of stagflation is permeating the marketplace. This puts emphasis on today’s jobs report. The other thing that we’ve seen in oil this week is the unwinding of geopolitical risk factors. It’s almost amazing to me that oil prices took seriously the possibility that ceasefire talks were going anywhere, but they obviously did.
It’s going to be interesting to see how oil traders will prepare for what may be coming this weekend as many sources believe that Israel will start to move into Rafah this weekend. This comes as the Wall Street Journal reports that, “The Pentagon is shifting jet fighters, armed drones and other aircraft to Qatar, repositioning its forces to get around restrictions on conducting airstrikes from an air base long used by the U.S. in the United Arab Emirates. The U.A.E. informed the U.S. in February that it would no longer permit American warplanes and drones based at Al Dhafra air base in Abu Dhabi to carry out strikes in Yemen and Iraq. That has prompted U.S. commanders to send the additional aircraft to Al Udeid air base in Qatar, the small Persian Gulf monarchy that hasn’t imposed similar restrictions, U.S. officials said.”
Oil should be close to the low and the correction should be over. If the jobs market is not too hot, then the bottom should be in as the risk premium goes back in.
Natural gas is putting up a good fight in the face of an overwhelming supply. Codes for the US domestic natural gas market is in fact that natural gas prices are historically cheap and data centers unquenchable demand for power continues to grow to incredible heights. With the emergence of cryptocurrencies, artificial intelligence, electricity demand is going to be going through the roof and is it possible that the US natural gas market will be saved by this incredible surge and demand. More on that next week.
Read Full Story »»»
DiscoverGold
Natural Gas Potential for Bullish Trend Continuation
By: Bruce Powers | May 2, 2024
• Weekly chart shows bullish continuation, with last week's high of 2.00 a key level to watch.
Natural gas triggered a bullish reversal on a rise above Wednesday’s narrow range day high on Thursday before encountering resistance at 2.05 and stalling the ascent. This increases the chance that the low of 1.91 from the past week will maintain support. However, further bullish follow-through is necessary to further confirm the indication. Once today’s session is complete, that will start to happen on a rally above today’s high. But there will not be a bullish trend continuation signal until the recent high of 2.09 is exceeded to the upside.

Bullish Weekly Signal
A bullish continuation on the weekly chart was triggered this week further supporting a continuation higher for natural gas. Last week’s high of 2.00 is the price level to watch relative to this week’s closing price. It is currently trading above that price level and a daily close above it will confirm the bullish move on a weekly time frame. Keep in mind that the larger time frames influence the shorter time frames.
Low Volatility Leads to Higher Volatility
Further, volatility in the price of natural gas dropped during the formation of the bottom symmetrical triangle consolidation pattern. What usually follows low volatility? Higher volatility. In other words, the stage is set for a potential rally into higher price zones. That doesn’t mean it goes straight up. There is still the possibility of a dip below this week’s low of 1.91. But it becomes less likely if this week ends above 2.00.
Signs of Strengthening
This week’s high of 2.09 completed an initial rising ABCD target at 2.07 and the high reached the underside of the 20-Week MA, an obvious location for possible resistance, which is what happened. Further supporting a continuation higher is the relationship with the declining blue dashed parallel trend channel. The area around the lower channel line has acted as support for five days and now strength is returning. That is a sign of progress as the top channel line becomes a potential target once this week’s high is exceeded. This doesn’t mean it will be reached but the possibility exists. Therefore, the chance of eventually reaching lower targets increases.
Read Full Story »»»
DiscoverGold
Agriculture Master Report
By: Bill Moore | May 2, 2024
JULY WHEAT
After a near-vertical 80 cent, 6-day rally, July Wht became severely over-bought & is predictably correcting today -with the fundamental attached to the correction expected rain in S Russia! Indeed, dryness in the South US Plains, Russia & Ukraine spawned the rally – along with historical cheapness & export potential uncovered by low prices! As well, pressure from first Notice Day Tues & Crop Progress today at 3pm added to the price pressure! Spring Wht is expected to be 36-38% in & the WW good-to-excellent to decline 2-3 %!
JULY CORN
As you can see, July Corn has been locked in a tight 25 cent range since Mar 1! Today, the headwinds of heavy deliveries (beans, oil & wht) & better than expected planting progress – 27% (avg-22) have the mkt under pressure! But supporting the mkt are the tailwinds of exceptional exports (35% over 2023) & possible pltg delays ahead which would shift corn acres to beans! As well, the general cheapness of corn ($2.00 under last Summer’s highs) & the strong possibility of La Nina’s hot & dry coming – has the mkt leaning up – albeit still range-bound! And there still exists a sizeable short fund OI! There appears to be “no margin for error” for the US Crops this summer!
JULY BEANS
Massive deliveries against the bean complex – oil (1873), beans (537) & meal (222) & impressive planting progress – 18% (10-avg) have July Beans on their heels today! Illinois is 26% in & Iowa 25% in! As well, expected planting delays this week could add to the already sizeable bean acreage! Finally, the ongoing Argentine oilseed & maritime workers strike is adding to the pressure! The Monday inspections showed 250,332MT – cumulative is running 18% under 2023! However, the $2.50 break in July Beans since December is substantial & has dialed in a lot of bearish fundamentals! Plus, the wide disparity between Conab (46mmt) & the USDA (55mmt) regarding Brazil’s crop would seems to resolve itself closer to CONAB than the USDA!
JUNE CAT
After topping out at 186 in Mid-March due to the bearish Cattle-on-Feed Report, June Cat plummeted $16 to 170! The latter part of the down move was exacerbated by the Bird Flu epidemic which has alternately been down-played but then feared as it relates to beef demand! And it’s still a relevant mkt-mover – rearing its ugly head anytime the cattle mounts a rally! Heavy weights & higher US beef production have been offset by resurgent beef demand from the ongoing “grilling season”! The net result is a once powerful bull mkt that has morphed into a consolidating, sideways trade
JUNE HOGS
The April 10 Key Reversal remains the major chart formation of June Hogs for 2024 as the mkt has not breached that high since! Coinciding with this “chart top” was the emergence of Bird Flu in the Midwest – which cast serious doubt over meat demand & has acted like a “wet blanket” on any subsequent rallies! As well, weaker cash & a near-record long-fund open interest has been significant headwinds to June Hogs – staving off any potential rallies! Underpining the mkt is the stellar “grilling season” demand! The net is a range-bound mkt between 101 & 108!
Read Full Story »»»
DiscoverGold
Lack Of Further Progress. The Energy Report
By: Phil Flynn | May 2, 2024
Commodity volatility went crazy as the Federal Reserve signaled, “the lack of further progress on there are inflation target in recent months” shook up a whole host of commodities. We started with dramatic moves in grains, meats, industrial metals, and precious metals and of course in oil that not only had to deal with the Federal Reserve seemingly putting off interest rate cuts, but also a very disappointing weekly inventory report that suggests that U.S. oil demand is sputtering. Yet the further lack of interest rate cuts and the drop in oil prices means that OPEC plus could extend its voluntary production cuts beyond the second quarter and into the New Year. The plunge in oil might reverse if OPEC sources are correct and OPEC signals an extension of the cuts then more than likely this is going to be a trial balloon, but our expectations are very clear. If prices don’t hold this area, then OPEC will extend cuts and possibly even work towards a larger cut in production.
While the weekly demand numbers for total petroleum products came in at an impressive 20.417 million barrels of oil a day, we saw an uptick in gasoline demand which was up 195,000 barrels a day from the week before and is still coming in at a weak 8.618 million barrels a day. Distillate demand was also up week over week, coming in at 3.678 million barrels a day. But where you see the demand discrepancy is when you look at the four-week moving average, for example gasoline averaged 8.6 million barrels a day which is down by 3.6% from the same period last year. The weakness in gasoline demand probably reflects the big drop that we saw in consumer confidence last week.
This is a warning sign that high inflation is really starting to cut into the consumer’s ability to spend the money. Now if you put this in the context of the Federal Reserve coming out saying that they are going to have to potentially pause an interest rate cut, it means that there’s going to be more pain for consumers because the only way you’re going to bring down gasoline demand is to make the economy tougher for most people.
We were expecting a bigger uptick in gasoline demand this week and while the weekly numbers have not been so accurate, the trend is not encouraging. The data shows a drop in distillate inventory that if you look at the four-week moving average, is down 8.2% from the same period a year ago. The other main reason why the report came out as bearish as it did was the fact that we saw commercial crude inventories surge by 7.3 million barrels from the previous week. Not all of that was demand related but due to a surprising increase in U.S. oil imports and a big decrease in U.S. oil exports from the record-breaking numbers that we’ve been seeing. US crude exports fell from 5.179 million barrels a day to 3.918 million barrels a day, down 1.261 million barrels a day. US crude oil imports on the other hand rose to 2.854 million barrels a day and that was up from 1.318 million barrels a day the week before.
The market also seemed to be removing some of the geopolitical risk and worst-case scenarios. Even with the hopes of a ceasefire deal between Hamas and Israel falling apart, the market seems unfazed that it’s going to have any negative consequences for the flow of oil.
Get geopolitical risks remain. Overnight it was reported that Ukraine drones hit a Rosneft refinery. Bloomberg reported that Ukrainian drones hit a major oil refinery owned by state-controlled Rosneft PJSC in Ryazan, southeast of Moscow, just as the facility’s crude-processing had recovered from a previous strike. The overnight attack caused a fire at the plant, a person in the Ukraine military who is familiar with the matter told Bloomberg News.
Apparently the Wall Street Journal reported that they found evidence of collusion! They reported that Ex-Pioneer CEO Scott Sheffield was barred from the Exxon Board in the merger between the two companies. The Journal says that antitrust enforcers are set to allege Scott Sheffield discussed coordinating oil-production levels with other producers and OPEC. Exxon agreed in October to buy Pioneer for $60 billion in stock, marking its biggest deal since it merged with Mobil in the late 1990s and the largest oil-and-gas deal in two decades. The WSJ says that they will all edge that Sheffield engaged in collusive activity that could have raised the price of oil, these people said. The allegations will include that Sheffield sent hundreds of messages to representatives of the Organization of the Petroleum Exporting Countries about market dynamics, including pricing and production levels.
The Journal, in a must read, said that, “For years, investors urged frackers to stop overspending on drilling new wells and pumping ever-increasing amounts of crude, and instead to keep production largely flat, which would increase cash flows and enable higher returns to shareholders. It took years—and a crippling pandemic—for shale producers to agree.” U.S. frackers fiercely competed for years with OPEC for market share. At a 2017 dinner in Houston, shale executives sat down for a first-of-its-kind dinner with Mohammad Barkindo, then the secretary-general of OPEC. Sheffield attended the dinner, during which Barkindo discussed OPEC negotiations on cutting oil output, among other topics.”
This is going to be interesting. Many investors and people in the oil industry believe that when the US frackers started to over produce and flood the market with oil that it was not a good business decision.
The column of oil depressed prices and many of the producers racked up huge debt. OPEC on the other hand is a well oiled machine these days and they can really have an impact on global inventories. The question becomes at what point does collusion crossover with common sense.
Many people in the industry think that shell producers were derelict in their duty by not cutting back production earlier. One of the things I used to write during those days is that the frackers used to try to lose money on every barrel then try to make up for that in volume. Of course the commodity markets are probably the best way to hedge the risk of the boom and bust industry. But perhaps there has to be a better way for the US oil and gas industry to judge the market so that they can stay competitive with the likes of OPEC and Russia.
After the huge sell off the last couple of days as we ended the big plunge on the last trading day of April and we continued to sell off on the first day of May, we do believe that we’re getting pretty close to a value range for oil. While there still could be some downside today this will probably be a good opportunity to put on your spring hedges.
Natural gas is attempting to bottom but failed when the rest of the global markets seemed to fall apart. Today is going to be a big day as far as the natural gas injection number. We’re looking for an increase of 54 BCF.
The Biden administration’s attitude towards the energy policy is to throw as much of it on the wall and see what will stick. New rules by Bidens Environmental Protection Agency is going to compel coal and natural gas power plants to cut or capture 90% of their carbon pollution by 2032 according to the very optimistic but not very scientific EPA. They say this is going to reduce carbon dioxide emissions by 75% compared to its peak in 2005. The EPA wants to use 2005 as a benchmark because it makes them look good. The Biden administration wants to push through as many environmental rules as they can we regardless of the economic fallout because they need to start pleasing their environmental base that is turning against them. Biden’s approval ratings are in the sewer and in desperation they’re going to throw out as much as they can in the next few months.
West Virginia attorney general Patrick Morrisey he said he’s going to challenge the new EP rules in court he said that the US Supreme Court has placed significant limits on what the Environmental Protection Agency can do and we plan on ensuring that those limits are repelled and we expect that once again we will prevail on this out of control EPA.
Read Full Story »»»
DiscoverGold
Commodities Daily Market Movers (% Price Change)
By: Marty Armstrong | May 2, 2024
• Top Movers
ICE Newcastle Coal Continuous 3.62 %
Oats (CBOT) Futures 2.17 %
Oats (Minneapolis) 1.89 %
Orange Juice (NYCE) Futures 1.77 %
Canola Futures 1.25 %
• Bottom Movers
Cocoa (NYCSCE) Futures 10.76 %
NYMEX RBOB Gasoline Futures 4.23 %
AU - Queensland Base-Load Electricity Futures 4.15 %
Tokyo Palladium Futures 4 %
AU - Victoria Base-Load Electricity Futures 3.95 %
*Close from the last completed Daily
DiscoverGold
Fed Freak Out. The Energy Report
By: Phil Flynn | May 1, 2024
Oil prices tried to stay strong in the face of the market doing a Federal Reserve freak out. Rumors that the Fed today is going to be extremely hawkish, even reports of potentially talking about raising rates before the end of the year, caused a major sell off in a lot of the markets. That wave of pessimism eventually dragged oil down and took the products with it.
Obviously, the fear of a more hawkish Fed and even a delay of interest rates could slow the economy and could slow the demand for oil at the same time. The rate differentials between the US dollar and other commodities could keep oil prices under pressure. It’s a story and they’re sticking to it.
Economic data yesterday though may suggest that the Fed is getting too hawkish and might be premature as consumer confidence is plummeting, falling to a reading of 97 yesterday when the expectations were for it to come in at 104.7. This came as manufacturing data in Chicago took a dive.
After the close it didn’t help that the American Petroleum Institute (API) reported a whopping 4.906-million-barrel increase in crude supplies. While oil products saw a supportive 1.48 million barrel drop in gasoline supplies and an equally supportive 2.187 million barrel drop in distillate supplies. The market was overwhelmed with the size of the crude oil supply increase.
It’s going to be interesting to see if today’s Energy Information Administration (EIA) report confirms the crude oil increase and if they do, what makes up that increase. We’ll look at production and see if it’s a case of reduced refinery runs or more just an aberration.
The concerns about slowing demand or the potential slowing of demand come as OPEC has shown further commitment to reducing global oil supplies. In the latest Reuters survey, they show that oil output from OPEC fell by 100,000 barrels a day in March as exports from Iran, Iraq and Nigeria seem to be signaling better compliance from the countries that have been over producing.
Geopolitical risk factors continue to be at play but the fact that Israel has not invaded Rafah just yet seems to be taking some of that risk premium off the table. The latest news is Hamas is saying that they’re still studying the recent ceasefire offer. Yet Israel has ceasefire or no ceasefire, they’re going to eliminate Hamas. This comes as reports say that the Biden administration is going to welcome in refugees from the Gaza Strip into the United States.
The Biden administration offers new rules that will add to the cost of energy and inflation. My friend Mike “Mish” Shedlock reports that, “New Biden Energy Rules Will Raise the Cost of a New Home by $31,000.” He says that new HUD energy rules will raise the cost of home construction by imposing stricter building codes. Payback time is 90 years. Maybe time to bring back the 100 year mortgage?
Now The United States Department of Energy (DOE) has decided to mandate federal agencies to construct only fossil fuel-free buildings starting 2030. “DOE estimates that over the next 30 years, the new rule will reduce carbon emissions from federal buildings by 2 million metric tons and methane emissions by 16 thousand tons—an amount roughly equivalent to the emissions generated by nearly 310,000 homes in one year, while also reducing infrastructure costs”. The rule, which enforces the 2007 Energy Independence and Security Act, applies to construction projects with start dates that fall in 2025 or later. The rule requires projects breaking ground in 2025–29 to be designed in such a way that fossil fuel energy in each building is 90 percent lower relative to 2003 levels. Projects that begin construction 2030 or later must cut consumption by 100 percent relative to 2003 levels. The sense is that the Biden administration is trying to push through as much crazy stuff regulation as they can because they think they’re going to lose the election.
Bloomberg writes that, “Nations from the Group of Seven have agreed to work to reduce their reliance on “civil nuclear-related goods” from Russia, as major industrialized nations work to reset their energy plans while isolating Moscow. G-7 energy ministers said their countries will engage in a multilateral effort to promote a diversified fuel supply chain free from Russian influence, according to the closing statement from a meeting in the Italian city of Turin. The ministers also committed to promoting fusion as a future energy source alongside regulatory efforts. Germany had previously objected to any reference to nuclear power as part of the group’s initiatives for so-called green transition.
Gold prices also pulled back on the Fed concerns but MarketWatch cited healthy investment from the over the counter market as well as central bank purchases according to a report from the world council that was released on Tuesday. Total first-quarter gold demand, which includes the investment and industrial sectors and central-bank purchases, climbed 3% from the same period a year ago to 1,283.3 metric tons — the strongest first quarter since 2016, according to the World Gold Council report. The total demand figure included 136.4 metric tons in over-the-counter (OTC) purchases, characterized by market participants trading directly with each other, it said. That’s more than triple the year-ago amount of 42.7 metric tons.
Saudi Arabia and Iran met to try to develop a road map for economic cooperation in the public and private sector. Both sides said the talks were constructive in these two adversaries are trying to find a way to work together.
The New York Times reported that, “the Biden administration on Tuesday released rules designed to speed up permits for clean energy while requiring federal agencies to more heavily weigh damaging effects on the climate and on low-income communities before approving projects like highways and oil wells. As part of a deal to raise the country’s debt limit last year, Congress required changes to the National Environmental Policy Act, a 54-year-old bedrock law that requires the government to consider environmental effects and to seek public input before approving any project that necessitates federal permits. That bipartisan debt ceiling legislation included reforms to the environmental law designed to streamline the approval process for major construction projects, such as oil pipelines, highways and power lines for wind- and solar-generated electricity. The rules released Tuesday, by the White House Council on Environmental Quality, are intended to guide federal agencies in putting the reforms in place.
The morning after a big sell off in the oil makes it harder to recover. Margin selling and position adjustment is adding to early morning weakness. Still oil is at a value range and after we get through the EIA and Fed, we should start the trek higher.
Natural gas is trying to find a bottom against incredible odds. Look to buy long dated calls.
Read Full Story »»»
DiscoverGold
Natural Gas Price Forecast: Current Patterns and Potential Price Targets
By: Bruce Powers | May 1, 2024
• Natural gas has exceeded its first target in a rising ABCD pattern, with trading now eyeing a test of support in a declining channel. Recent highs suggest the potential for further price increases.
Natural gas exceeded its first target today at the completion of a rising ABCD pattern. The high for Tuesday is 2.09 and the pattern target was 2.07. Resistance was seen off the high and trading is happening at the lows of the day at the time of this writing. It looks like a test of support at the lower declining blue dashed parallel channel may be in the works.
The April 14 swing low of 1.95 can be used as a proxy for the line if reached today as it is crossing the dashed line. Otherwise, watch for support at or above the top boundary line (purple) of the symmetrical triangle bottom. The three-day low of 1.91 can be used as a proxy for the line, however, keep in mind that the line will represent a lower price in the future given its downward slope.
Highest Daily Closing Price in 59 Days
On Monday natural gas ended the session at its highest daily closing price in 59 days. Along with today’s new recent high, it looks like it is telegraphing higher prices. If it continues to rise, and there is a good chance it will, the next higher ABCD pattern target is up at 2.20. That price is within a target zone from around 2.17 to 2.24 and it includes the 38.2% Fibonacci retracement at 2.24.
Further up is the price area around the 200-Day MA at 2.48. Notice that the moving averages are showing improving demand. Recently, the purple 8-Day MA crossed up through the orange 50-Day MA after being below it for some months. Further, the relative strength index momentum oscillator (RSI) recently broke a trendline to the upside.
Below 1.91, Likely Leads to Test of Support Lower Down
Ideally for the bulls, natural gas stays above the April 26 gap day low support price of 1.91 during retracements. If so, the above bullish case becomes more likely and may occur faster than otherwise. However, if the 1.91 price level fails to act again as support and is broken to the downside, a test of lower price levels becomes likely. Lower meaning, from 1.90 to the 1.61 closing price from the day before the gap. The April 23 high of 1.85 and the 20-Day and 50-Day MAs from 1.80 to 1.78 are two price areas that stand out.
Read Full Story »»»
DiscoverGold
Grains Report: Wheat, Rice, Corn and Oats, Soybeans, Canola and Palm Oil
By: Jack Scoville | April 30, 2024
• WHEAT
General Comments: Wheat was lower yesterday ion correction trading, but trends are up in all three markets. The weather is the key, with extreme dryness reported in Russia and parts of the US and too wet conditions reported in Europe. The weekly export sales report showed poor sales once again. The problems with Russian Wheat exporters continue but are apparently getting resolved in the governments favor. The reports indicate that the government is seeking more control of the exports and has made life very difficult on the private exporters in an effort to extract more sales and powers to the government. Russia is the world’s largest exporter and sets the world price and prices remain low. Big world supplies and low world prices are still around. Export sales remain weak on competition from Russia, Ukraine, and the EU as those countries look to export a lot of Wheat in the coming period. Black Sea offers are still plentiful, but Russia has been bombing Ukraine again and shipments might be hurt from that origin.
Overnight News: The southern Great Plains should get mostly dry conditions. Temperatures should be above normal. Northern areas should see mostly dry conditions. Temperatures will average above normal. The Canadian Prairies should see mostly dry conditions. Temperatures should average above normal.
Chart Analysis: Trends in Chicago are up with no objectives. Support is at 602, 593, and 586 July, with resistance at 633, 639, and 655 July. Trends in Kansas City are up with no objectives. Support is at 636, 625, and 613 July, with resistance at 664, 669, and 675 July. Trends in Minneapolis are up with no objectives. Support is at 697, 686, and 682 July, and resistance is at 717, 721, and 732 July.
• RICE
General Comments: Rice closed higher yesterday and maintained the current trading range. Supply tightness is expected to give way to increased production this year and greatly increased supplies this Fall. Trends are up in this market on the daily charts. The market noted good planting and emergence progress in the weekly USDA reports.
Overnight News:
Chart Analysis: Trends are up with no objectives. Support is at 1850, 1826, and 1785 July and resistance is at 1978, 1993, and 2004 July.
• CORN AND OATS
General Comments: Corn and Oats closed slightly lower yesterday on reports of rapid planting progress in the Midwest as traders think that good Spring weather here will greatly increase planted Corn area. Demand has been the driving force behind the rally. Increased demand was noted in all domestic categories along with rising basis levels, and export demand has been strong. There are mixed ideas about how many acres of Corn will be planted in the US this year. It is very expensive to plant Corn and Corn is considered unprofitable to plant right now, so planted are might not increase that much if at all. USDA issued its crop progress report for Corn and Corn planting is proceeding at an average pace. Demand for Corn has been strong at lower prices. Big supplies and reports of better demand are still around, but futures have been very oversold. Funds remain very large shorts in the market.
Overnight News:
Chart Analysis: Trends in Corn are mixed. Support is at 446, 440, and 436 July, and resistance is at 454, 460, and 467 July. Trends in Oats are up with objectives of 382 July. Support is at 360, 354, and 349 July, and resistance is at 383, 386, and 389 July.
• SOYBEANS
General Comments: Soybeans closed a little higher and the products closed mixed yesterday, with Soybean Meal higher and Soybean Oil lower and making new lows for the move. Some selling from Brazil and Argentina was noted on the early rally attempt last week. Reports of great export demand in Brazil provide some support, but increased availability of Soy products from Argentina kept prices down. Reports indicate that China has been a very active buyer of Brazil Soybeans this season. Ideas that South American production is taking demand from the US have pressured futures lower. Domestic demand has been strong in the US. Funds remain large shorts in the market.
Overnight News:
Chart Analysis: Trends in Soybeans are mixed. Support is at 1164, 1146, and 1141 July, and resistance is at 1191, 1204, and 1216 July. Trends in Soybean Meal are mixed. Support is at 342.00, 340.00, and 336.00 July, and resistance is at 355.00, 360.00, and 363.00 July. Trends in Soybean Oil are mixed. Support is at 4410, 4350, and 4300 July, with resistance at 4610, 4690, and 4780 July.
• CANOLA AND PALM OIL
General Comments: Palm Oil was lower last week on ideas of seasonally increasing production and weaker demand from India and China. Trends are down on the daily and weekly charts. Canola was a little higher as farmers concentrate of=n fieldwork and not selling.
Overnight News:
Chart Analysis: Trends in Canola are mixed. Support is at 631.00, 627.00, and 618.00 July, with resistance at 641.00, 650.00, and 653.00 July. Trends in Palm Oil are down with objectives of 3790 and 3650 July. Support is at 3820, 3780, and 3740 July, with resistance at 3930, 4020, and 4040 July.
DJ Malaysia April 1-30 Palm Oil Exports Fell 11.5% on Month to 1,144,100 Tons, AmSpec Says
By Ying Xian Wong
Malaysia’s palm oil exports during the April 1-30 period are estimated down 11.5% on month at 1,144,100 metric tons, cargo surveyor AmSpec Agri Malaysia said Tuesday.
The following are the major items in the AmSpec estimate:
(All figures in metric tons)
April 1-30 March 1-31
RBD Palm Olein 369,668 413,601
RBD Palm Oil 143,935 139,780
RBD Palm Stearin 90,601 85,758
Crude Palm Oil 242,474 246,927
Total* 1,144,100 1,292,130
*Palm oil product volumes don’t add up to total as some products aren’t included.
Midwest Weather Forecast Scattered showers. Temperatures should average near to above normal.
Read Full Story »»»
DiscoverGold
Softs Report: Cotton, OJ, Coffee, Sugar, Cocoa
By: Jack Scoville | April 30, 2024
• COTTON
General Comments: Cotton was a little higher yesterday in sideways trading. Demand remains a problem. The export sales report showed poor sales once again. USDA made no changes to the domestic supply or demand sides of the balance sheets, but did cut world ending stocks slightly. Trends are still down on the weekly charts. Demand has been weaker so far this year. The US economic data has been positive, but the Chinese economic data has not been real positive and demand concerns are still around. However, Chinese consumer demand has held together well, leading some to think that demand for Cotton in world markets will increase over time.
Overnight News: The Delta will get mostly dry conditions and near normal temperatures. The Southeast will see showers and rains and below normal temperatures. Texas will have mostly dry conditions and near normal temperatures. ICE said that 198 notices were post4ed for delivery against May futures and that total deliveries for the month are now 411 contracts.
Chart Trends: Trends in Cotton are mixed. Support is at 80.60, 79.70, and 79.10 July, with resistance of 82.50, 84.30 and 86.20 July.
This Week Last Week Last Year Average
Cotton Planted 15 11 14 14
• FCOJ
General Comments: FCOJ closed sharply lower yesterday and the market can’t seem to settle on a direction for prices. Reports of tight supplies are around. Futures still appear to have topped out and a range trade has been seen. There are no weather concerns to speak of for Florida or for Brazil right now. The weather has improved in Brazil with some moderation in temperatures and increased rainfall amid reports of short supplies in Florida and Brazil are around but will start to disappear as the weather improves and the new crop gets harvested.
Overnight News: Florida should get scattered showers or dry conditions. Temperatures will average near normal. Brazil should get scattered showers and above normal temperatures.
Chart Trends: Trends in FCOJ are mixed. Support is at 354.00, 350.00, and 347.00 July, with resistance at 380.00, 391.00, and 392.00Julay.
• COFFEE
General Comments: New York and London closed higher yesterday on a lack of offers from Brazil and Vietnam. The lack of Robusta Coffee in the market is still the main feature, but less offers of Arabica are also noted. Robusta offers from Vietnam remain difficult to find and the lack of offer of Robusta is a bullish force behind the London market action. There were some indications that Vietnam producers were now offering a little Coffee, but not much and not nearly enough to satisfy demand. Vietnamese producers are reported to have about a quarter of the crop left to sell or less and reports indicate that Brazil producers are reluctant sellers for now after selling a lot earlier in the year. The next Robusta harvest in Brazil is starting now and offers for all Coffee increased last week in part on weakness in the Real.
Overnight News: The ICO daily average price is now 226.26 ct/lb. Brazil will get mostly scattered showers with near normal temperatures. Central America will get mostly dry conditions. Vietnam will see scattered showers. ICE NY said that 36 notices were posted for delivery today and that total deliveries for the month are now 866 contracts.
Chart Trends: Trends in New York are down with objectives of 221.00 and 204.00 July. Support is at 220.00, 215.00, and 213.00 July, and resistance is at 231.00, 245.00 and 253.00 July. Trends in London are mixed. Support is at 4070, 3950, and 3720 July, with resistance at 4340, 4420, and 4480 July.
• SUGAR
General Comments: New York and London closed higher yesterday and trends remain down on the charts as the market seems to have supplies available for sale. There are still ideas that the Brazil harvest can be strong for the next few weeks if not longer and production data released last week by CONAB indicated that the cane harvest could be less, but that Sugar production could be higher. Indian production estimates are creeping higher but are still reduced from recent years. There are worries about the Thai and Indian production, but data shows better than expected production from both countries. Offers from Brazil are still active but other origins. are still not offering in large amounts except for Ukraine. Ukraine offers have suffered lately with the war.
Overnight News: Brazil will get rains in the south and scattered showers in the north. Temperatures should average above normal. India will get mostly dry conditions and below normal temperatures.
Chart Trends: Trends in New York are mixed. Support is at 1890, 1860, and 1830 July and resistance is at 1990, 2050, and 2100 July. Trends in London are mixed. Support is at 560.00, 554.00, and 548.00 August, with resistance at 580.00, 590.00, and 600.00 August.
• COCOA
General Comments: New York and London were sharply lower yesterday and trends are down on the daily charts. It seemed that speculators were liquidating long positions. Production concerns in West Africa as well as demand from nontraditional sources along with traditional buyers keep supporting futures. Production in West Africa could be reduced this year due to the extreme weather which included Harmattan conditions. The availability of Cocoa from West Africa remains very restricted and projections for another production deficit against demand for the coming year are increasing. Ideas of tig8ht supplies remain based on more reports of reduced arrivals in Ivory Coast and Ghana continue. Mid crop harvest is now underway and here are hopes for additional supplies for the market from the second harvest. Demand continues to be strong, especially from traditional buyers of Cocoa.
Overnight News: Isolated showers are forecast for West Africa. Temperatures will be near normal. Malaysia and Indonesia should see scattered showers. Temperatures should average near normal. Brazil will get isolated showers and above normal temperatures. ICE NY said that 0 contracts were tendered for delivery against May futures and that total deliveries for the month are now 827 contracts.
Chart Trends: Trends in New York are mixed. Support is at 8700, 8330, and 8060 July, with resistance at 9600, 10210, and 11030 May. Trends in London are mixed. Support is at 7480, 7200, and 6460 July, with resistance at 8040, 8910, and 9160 July.
Read Full Story »»»
DiscoverGold
The Corn & Ethanol Report. US Plantings & Weather Key
By: Daniel Flynn | April 30, 2024
We kickoff the last day of April with Employment Cost – Benefits QoQ, Employment Cost – Wages QoQ, and Employment Cost Index QoQ at 7:30 A.M., Redbook YoY at 7:55 A.M., S&P/Case-Shiller Home Price MoM & YoY, House Price Index MoM & YoY, and House Price Index at 8:00 A.M., Chicago PMI at 8:45 A.M., CB Consumer Confidence at 9:00 A.M., Dallas Fed Services Index and Dallas Fed Services Revenues Index at 9:30 A.M., API Energy Stocks at 3:30 P.M., and Day 1 FOMC Meeting.
The USDA’s April food inflation forecasts narrowed the range of expectations and lowered the average. The USDA estimated US food inflation in a range of 0.7% to 3.8%, with an average estimate of 2.2%. The upper end of the range was the lowest estimate since the 2024 estimates began in July 2023, the lower estimate was the highest. The average estimate of 2.2% was at a 3-month low. If realized, it will be the 2nd consecutive year of declining food inflation rates and the largest 2-year decline since 1976. While the rate of inflation is expected to decline, food prices will again reach a new all-time high in 2024. What can Biden-omics do for an encore. On the weather front corn farmers plantings got off to a good start with 27% planted vs. 23% last year and will want to get back in the fields provided the recent rainfall hopefully did not cause any flooding, ahead of round 2 of storms. We have a wetter forecast in the next 6-15 day period. An active pattern persists across the E Plains, Midwest, and Delta into the coming weekend, with additional rain chances being added May 8th to 10th . We also have Crop Production, USDA Supply/Demand, and WASDE on May 10th . Rainfall in the extended range is projected to favor areas east of the Mississippi River, with spotty showers advertised in the Dakota’s and Minnesota. It’s an outright wet forecast, and a lengthy period of warmth and dryness is desired mid-May onward. This morning we are coming in lower in the grain futures based on larger than expected deliveries in May soybean oil, wheat and soybeans.
The EPA/Biden Administration is expected to announce revised GREET model for measurement of carbon intensity of biofuel feedstocks today. The updated model was expected to be released in March but was delayed. The revised GREET model is critical to determining the eligibility of sustainable aviation fuel for new tax credits created by the Inflation Reduction Act. Key will be monitoring how US ethanol is scored and pathways forward to dropping its carbon score under 50%. To achieve a sub-50% carbon score requires US farmers adapting no till farming practices, plant a cover crop or start using precision fertilizer applications. There may be another delay in announcing the revised GREET model with the attention is on college riots taking front stage.
Read Full Story »»»
DiscoverGold
Making Russian Oil Great Again. The Energy Report
By: Phil Flynn | April 30, 2024
Oil prices, after dipping yesterday on cease fire talks, reacted to an announcement of the start of an important Canadian oil pipeline and a report that Biden will ease sanctions on Russian banks to allow energy deals to help keep prices lower headed into his election, are now back on the rise as geopolitical risk factors realities resurface. Israeli Prime Minister Benjamin Netanyahu is warning that, “Israel will enter city of Rafah in south Gaza to eliminate Hamas, with or without a ceasefire and hostage release deal.” Mr. Netanyahu says that they have begun evacuating Palestinians from Rafha in preparation for an upcoming operation. Hamas said they will respond in writing to Israel’s ceasefire proposal but are not giving a time as to when they will do so.
The market is now starting to realize that Israel’s attack on Rafha is a match that will be played and asked to increasingly worry about the fallout. This comes as Biden’s administration is showing signs of panic surrounding the potential price spike that may be coming ahead of the Presidential election.
Oil prices took a dip after the Treasury Department renewed sanction relief for at least 10 Russian banks, including the Central Bank, to allow energy-related operations amid rising energy cost. Bloomberg says that, “General License No. 8I allows Central Bank of the Russian Federation; Vnesheconombank; Otkritie; Sovcombank; Russia’s largest state-owned bank Sberbank; VTB Bank; the country’s top private bank Alfa-Bank; Rosbank; Zenit and Bank Saint-Petersburg to engage in production, refinement, transport, purchase of crude oil, natural gas and petroleum products. The License also allows for operations related to coal, agricultural products used to make biofuels, wood, uranium, development, production of power including nuclear, thermal and other sources.
This easing comes after the Biden administration discouraged Ukraine from hitting Russia where it hurts and that is their oil and gas sector. The pressure for Ukraine to quit attacking Russia’s oil and gas infrastructure comes because of that could cause prices to rise.
And of course, as I predicted, the so-called Russian price cap has become an abject failure. Bloomberg News is reporting, “A Group of Seven-imposed cap on the price of Russia oil is becoming increasingly unenforceable, an organization at the heart of the global insurance industry said, offering one of the most direct criticisms yet of measures that were meant to deprive the Kremlin of petrodollars. About 800 oil tankers that were previously covered by member organizations of the International Group of P&I Clubs have migrated into what’s known as a shadow-fleet, the club said in a written submission to a UK government inquiry on the effectiveness of sanctions on Russia. In addition, there’s no way for insurers to check whether traders are genuinely sticking to the price cap. The policy “appears increasingly unenforceable as more ships and associated services move into this parallel trade,” the International Group’s submission said. It “is concerned that increasing responsibility and obligations on companies in the G-7 coalition will result in a further migration of trade activities and ancillary services outside of the G-7.”
The other report that put a little downward pressure on prices was the long-awaited announcement of the start of the Canada’s Trans Mountain pipeline expansion. Reuters reported that Canada’s Trans Mountain pipeline expansion (TMX) is set to enter partial operation on May 1, years behind schedule and at more than four times the original cost – but with the potential to affect oil flows even outside North America. The expanded pipeline will ship an extra 590,000 bpd from Alberta to Canada’s Pacific Coast, giving Canada’s heavy crude producers access to U.S. West Coast and Asian markets, and boosting prices for their grades. I guess this might be a good time to mention that the old Keystone XL pipeline would have been up and running for years helping to ease prices and improve the oil flow. Of course, somebody decided to kill the approval of that at the last minute, I wonder who that might be?
Behind all the drama, we’re also seeing signs of global demand that continues to be strong for oil and suggests a very tight global oil market. Saudi Arabia reportedly feels confident enough to raise prices for most oil grades to Asia. This comes as the OPEC secretary general suggests that crude oil demand will grow by 2.2 million barrels a day in 2024 and confirmed that OPEC production cuts are going to continue through the end of the year. So, more demand and less supplies are normally very bullish.
At the same time we’re continuing to get warnings about underinvestment in future supplies of oil and natural gas. A big part of the reason is politicians that are obsessed with climate targets and not reality. A couple years ago, when I was doing the speaking circuit at different events talking about oil, I used to get a lot of blowback from my thesis that the world was not going to run out of oil. In those days the thesis of “peak oil” was all the rage. Peak oil was the contention that conventional sources of crude oil had already been reached and we were about to reach maximum production capacity worldwide that was supposed to diminish significantly.
“Twilight in the Desert” was a bestselling book about peak oil production in Saudi Arabia and many people believed that the United States oil production was already in an irreversible decline and the country’s economy might collapse if we couldn’t find ways to import more supplies of natural gas. Yet I never believed those doom and gloom predictions and was what you might call a peak oil denier. They said I ignored science, and that oil was a finite resource. On and on they went.
Even though I was in the minority and took a lot of heat for it, I had a belief in the power of the market. That when prices got high enough, we would find a way to find more oil. I believe that the free market and free market capitalism would drive innovation and even though I might not have known exactly how it was going to play out, I knew that the world would not run out of oil anytime soon and probably not ever. Price and profit incentive would drive innovation and I knew that we would find a way.
Let us fast forward to a report yesterday by the Energy Information Administration (EIA) that would have been the fantasy 20 years ago. The EIA reported that U.S. oil and natural gas reserves hit a record high this year. They said it couldn’t be done 20 years ago but the US oil and gas industry did it anyway. The EIA said that, “U.S. crude oil and lease condensate proved reserves increased 9% from 44.4 billion barrels to 48.3 billion barrels at year-end 2022. U.S. crude oil and lease condensate production increased 6% in 2022. In Texas, which has more proved reserves of crude oil and lease condensate than any other state, proved reserves increased 9% in 2022 (1.7 billion barrels), the largest net increase in any state).
In New Mexico, crude oil and lease condensate proved reserves increased 26%, the second-largest net increase (1.3 billion barrels). In North Dakota proved reserves increased 14%, the third-largest increase (0.6 billion barrels).
The 12-month, first-day-of-the-month average spot price for West Texas Intermediate (WTI) crude oil at Cushing, Oklahoma, increased by 43%, from $66.26 per barrel in 2021 to $94.54 per barrel in 2022.
Proved reserves of U.S. natural gas increased 10%, from 625.4 Tcf at year-end 2021 to 691.0 Tcf at year-end 2022, establishing a new record for natural gas proved reserves in the United States for a second consecutive year. Natural gas proved reserves in Alaska increased 25% in 2022, raising that state’s total from 99.8 Tcf to 125.2 Tcf—the largest increase of all states in 2022.
Natural gas did get a bit of a bounce and stational electric demand hit a near record high for this time of year. Early season cooling demand in the southeast is causing prices to go a bit higher. In 2022, U.S. natural gas exports were 6.9 Tcf, the highest volume on record. Cheap natural gas prices also had a part in lowering the demand for wind generated electricity which fell for the first time since 1990s. U.S. electricity generation from wind turbines decreased for the first time since the mid-1990s in 2023 despite the addition of 6.2 gigawatts (GW) of new wind capacity last year. Data from our Power Plant Operations Report show that U.S. wind generation in 2023 totaled 425,235 gigawatthours (GWh), 2.1% less than the 434,297 GWh generated in 2022.
Read Full Story »»»
DiscoverGold
The rapid unwinding in cocoa is what happens when speculators get trapped in over-leveraged positions
By: Jason Goepfert | April 30, 2024
• The rapid unwinding in cocoa is what happens when speculators get trapped in over-leveraged positions.
Now just wonder what could happen in the yen as specs are pushing record short positions against (even as % of open interest).

Read Full Story »»»
DiscoverGold
Commodities Daily Market Movers (% Price Change)
By: Marty Armstrong | April 30, 2024
• Top Movers
NY Natural Gas Futures 5.56 %
Platinum / Gold Ratio 5.13 %
NY Platinum Futures 4.27 %
Sugar World (CSCE) Futures 3.61 %
Zinc 3.58 %
• Bottom Movers
Eggs 16.18 %
Cocoa (NYCSCE) Futures 15.7 %
Oats (Minneapolis) 4.28 %
Soybean Oil CBT Futures 2.57 %
Wheat CBT Futures 2.22 %
*Close from the last completed Daily
DiscoverGold
Natural Gas Bullish Momentum Continues
By: Bruce Powers | April 29, 2024
• With a breakout above 2.01, natural gas is eyeing targets at 2.07 and then 2.20, supported by a potential retracement to 2.22 before aiming for the 200-Day MA at 2.49.
Natural gas rose above Friday’s high on Monday before triggering a breakout above the top of a symmetrical triangle at 2.01 (B). The high of the day at the time of this writing was 2.04, which was followed by an intraday pullback. Of interest will be the daily close.
A daily close above 2.01 will be a stronger sign of strength than a close below it as it would confirm the breakout above (B). Also, keep an eye on today’s close relative to Friday’s high. Once a daily close above 2.01 confirms the bullish breakout, natural gas should be ready to proceed towards higher target areas.
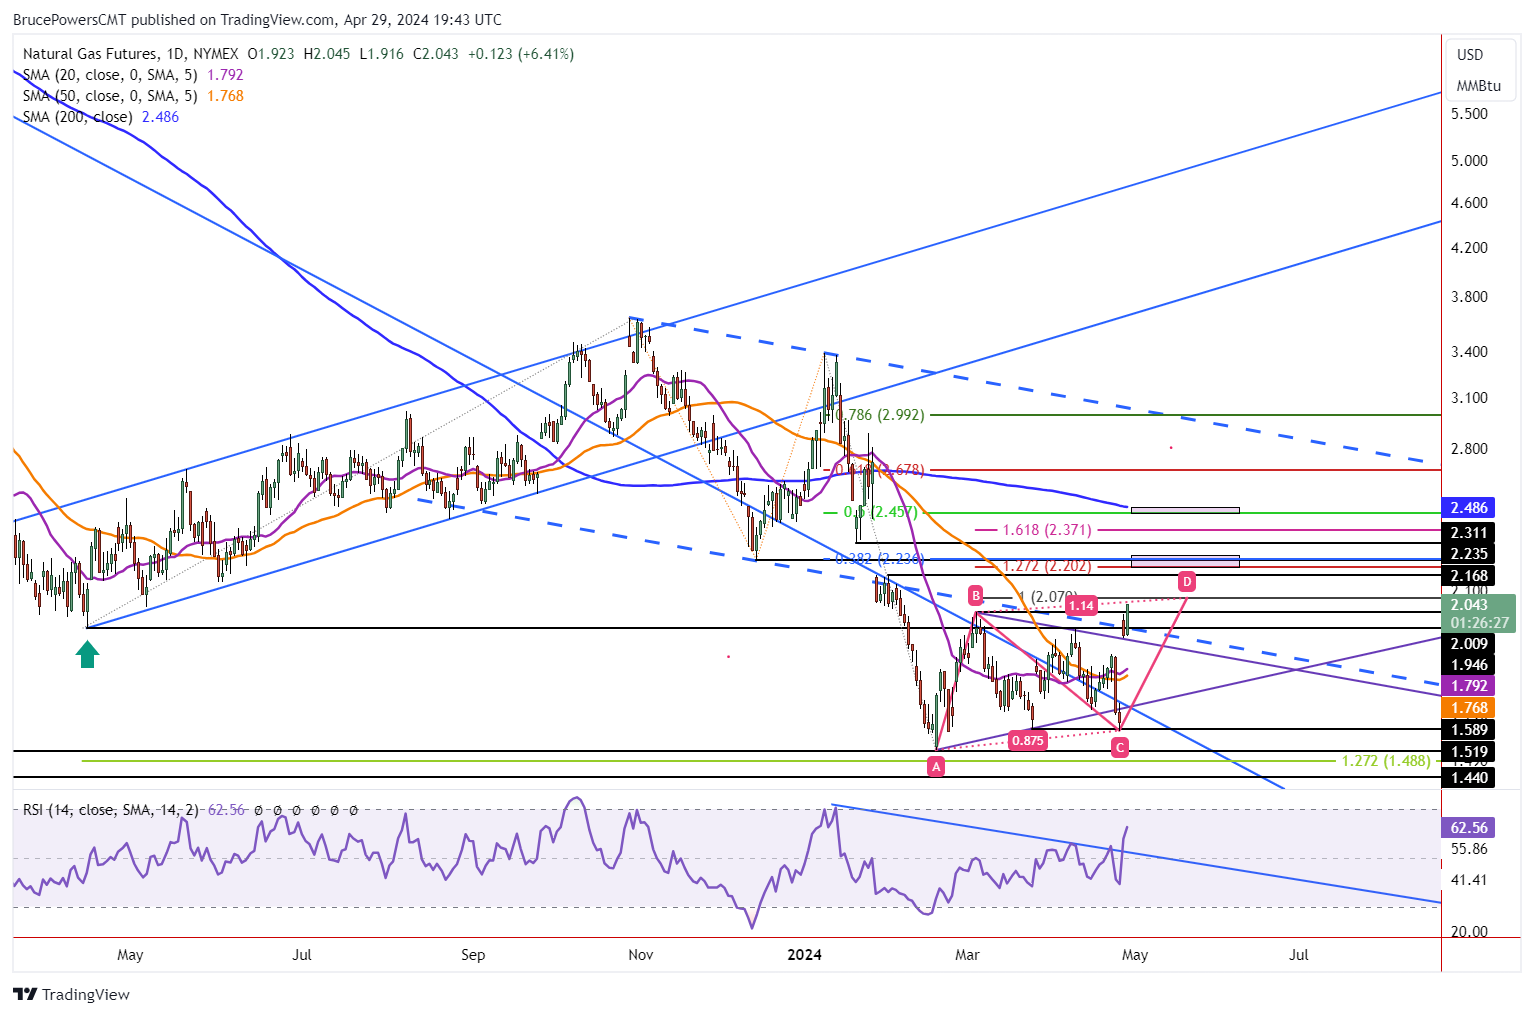
Upside Targets
The first upside target is close by at 2.07. If hit, it will complete an initial target for a rising ABCD pattern that is identifying price symmetry between the AB and CD legs of the advance. However, since it is close to the top of a symmetrical triangle higher prices remain on the radar. The second target from the ABCD pattern is 2.20. That target completes an ABCD pattern where the CD leg is extended by 127.2% of the AB portion of the advance.
It begins with a target range from 2.07 to the prior December 13 swing low at 2.24. Inside that price range is the completion of a 38.2% Fibonacci retracement at 2.24. Generally, a 38.2% retracement is usually the more common minimum retracement that might be seen. This means that since natural gas is showing improving strength, the 38.2% retracement should eventually be reached, at a minimum.
Signs of Strength
Last Friday natural gas rose above the lower dashed blue channel line before ending the day below it. Today, it is on track to close above it for the first time. The lower line is parallel to the top falling dashed blue line that connects the October and January swing highs. Further, natural gas is set to end on Monday at its highest daily closing price since February 5. If the top of the first target zone at 2.235 is exceeded, the next higher zone is around the 200-Day MA, currently at 2.49. It is further anchored by the 50% retracement at 2.46.
Read Full Story »»»
DiscoverGold
The Corn & Ethanol Report
By: Daniel Flynn | April 29, 2024
We kickoff the day with Dallas Fed Manufacturing Index at 9:30 A.M., Export Inspections at 10:00 A.M., 3-Month & 6-Month Bill Auction at 10:30 A.M., Treasury Refunding Financing Estimates at 2:00 P.M., and Crop Progress at 3:00 P.M.
What we see ahead so far this week is FOMC Meeting tomorrow and decision on rates on Wednesday. The guess is the FED may just hold rates in check, after some Fed officials hawkish stand on rates panicked the market suggesting rate hikes are back in the fold but my bet the FED keeps it’s powder dry. And Friday we will have the Unemployment data, that yet again, is in a total disconnect. The so-called jobs added are not supposed to count illegal aliens employment, and the next question, are the illegals immigrants paying taxes? JOLT’s number are starting to be in disconnect as well. Now the FED’s preferred inflation indicator, the Personal Consumption Expenditure Index, came in hotter than expected, with an annualized inflation rate of 2.7%, the highest in 5 months. The PCE Index also set new all-time high in March. Nevertheless, the PCE inflation rate has been below the long-term average for 6 consecutive months. What is concerning is that while the inflation rate is allegedly in retreat, the savings rate has yet to pick up. The savings rate to a 14-yaer low of 2.7% in June 2022 and average savings rate of 8.4%. The March figure was the lowest since November of 2022. If prices are indeed declining, where are consumer funds going? Talking with several economists, they expect a rate cut in September ahead of the November Presidential election. The basis of their guesstimates is if the FED does not cut rates before the election, it will open up a nasty political football. Now Biden says he will strike yet another Trump era that helped the economy roll. He has an extremely bad record of breaking things that are not broken. Whatever the administration is peddling TAX CUTS WORK. The proof is in the pudding with President Kennedy was the first President to do so it also worked for Reagan, Bush the second, and Trump. On the corn front traders will be following cash basis in corn for sale.
Severe storms ripped through the heartland over the weekend covering 16 states and a tornado count of 137 in a 24 hour period. They are getting boots on the ground to further access the damage and the damage would leave anyone in awe. There is another snow storm forming over the Rockies and Tuesday and Wednesday are forecast for Round 2 in the same areas. Are prayers are with all affected by the Act of God. Fridays open interest fell 39,164 contracts in corn, 32,868 contracts of soybeans with funds overall buyers of 18,861 contracts of soybeans but overall was a liquidating market with May First Notice Day tomorrow. Wheat sold off as well and new fund interest is showing in soybean meal. We seem to be waiting for another event to set the market tone.
Read Full Story »»»
DiscoverGold
Oil Coil. The Energy Report
By: Phil Flynn | April 29, 2024
Oil prices are coiling as the market tries to determine whether a push by US Secretary of State Anthony Blinken to convince Hamas to release hostages in return for a cease fire will bear any fruit. Mr. Blinken says that Hamas needs to decide, and it needs to decide quickly, on what he says is a proposal that is extremely generous. Mr. Blinken is also warning Israel that they need to do more to get humanitarian aid into Gaza.
While the market has seen some easing of risk premium as the threat of a direct confrontation between Israel and Iran has gone away, the ongoing drama in the continuing risk of supply against what should be record-breaking demand is going to keep the market well supported. There is a little bit of concern about Chinese demand that last month hit a 13-month low and talk that Iran is having a harder time moving their barrels of oil. Is it possible that Iran is having a harder time moving their barrels of oil because demand is slowing or is it possible that people are starting to find Iranian oil a little bit too hot to handle. This all comes against a backdrop of tightening global supply and more pressure by many in congress to actually enforce sanctions on Iran, a novel idea as far as the Biden administration is concerned. Energy Tidbits reported that global oil in floating storage fell by 32.67 million barrels in the last two weeks to just 16.64 million barrels of oil.
The other concern for Biden is rising inflation and gasoline prices that according to Triple A have eased a bit coming in at $3.659 which is a bit higher than yesterday but 2 cents lower than a week ago. That’s still 5 cents higher a gallon than a year ago. This comes as a CNN poll shows that 61% of Americans believe Biden’s presidency is a failure. The growing pressure on Biden to do something about gasoline prices could lead to another Strategic Petroleum Reserve release as the administration has already hinted, they may do just that. Yet that will be met with a lot of dissension from the Republicans who realized that the damage that the Biden administration has done by misusing the strategic reserve is going to cost taxpayers a lot of money over the long run.
In the short run supplies in the US should tighten again this week. We are looking for a 3-million-barrel drawdown in crude oil supplies and we’re looking for a 2 million barrel drop in distillate inventories and a 1 million barrel drop in gasoline inventories. We are also looking for refinery runs to uptick by 0.5%.
The risk of products going higher is still high. Tass, the Russian news agency, reported that the Slavyansk refinery in Russia’s Krasnodar Krai, which was attacked by Ukrainian drones on 27 April, has been forced to suspend some operations. “The plant’s operations have been partially suspended. Exactly 10 UAVs flew directly into the territory of the refinery, causing a severe fire. There may be some undetected damage,” said Eduard Trudnev, the security director of the company that operates the Slavyansk refinery, as quoted by Tass. It is not reported which operations have been suspended or whether the plant is operating at all.
Reuters also reported that, “The U.S. military said on Sunday it had engaged five unmanned drones over the Red Sea that, “presented an imminent threat to U.S. coalition and merchant vessels in the region. “U.S. Central Command did not say in the statement if the drones were destroyed. Marine Log reported that, “After a period with few reports of Houthi activity, the Iranian-backed group has resumed its targeting of merchant shipping, with Al Arabiya and other regional news outlets quoting the Houthi’s military spokesman as saying the group had attacked the “U.S. ship Maersk Yorktown and an American destroyer in the Gulf of Aden and Israeli ship MSC Veracruz in the Indian Ocean.” According to U.S. Central Command: “At 11:51 a.m. (Sanaa time) on April 24, a coalition vessel successfully engaged one anti-ship ballistic missile (ASBM) launched from Iranian-backed Houthi terrorist-controlled areas in Yemen over the Gulf of Aden. The ASBM was likely targeting the MV Maersk Yorktown, a U.S.-flagged, owned, and operated vessel with 18 U.S. and four Greek crew members. There were no injuries or damage reported by U.S., coalition, or commercial ships.”
When you look at the preponderance of market action, it seems like the oil market as well as the petroleum products are coiling for a potential big move. We think the risk of an upside move is more likely.
Natural gas has some glut issues to deal with. EBW analytics reported that Freeport LNG’s false start raised demand-side concerns into early May to amplify the downturn. Although weakness appears likely to linger in the near term, however, dry gas production continuing to grind lower may offer notable upside potential into mid-summer. For the natural gas market, we’re looking for a 92 BC injection this week.
Read Full Story »»»
DiscoverGold
The Bull Case For Commodities Is As Strong As Ever
By: Jesse Felder | April 26, 2024
Below are some of the most interesting articles, quotes and charts I came across this week. Click here to subscribe to our free weekly newsletter and get this post delivered to your inbox each Saturday morning.
The bull case for commodities is as strong as ever.
Commodity prices are moving higher driven by the following:
— Jesse Felder (@jessefelder) April 25, 2024
1) Reaccelerating US growth
2) Geopolitical uncertainty
3) Segmentation of global trade, and
4) Strong AI demand for energyhttps://t.co/Xn4xKGpboB pic.twitter.com/nefZvogVAj
US Oil & Gas stocks are historically cheap to the broader market. pic.twitter.com/AwlMXIWzCj
— Bob Elliott (@BobEUnlimited) April 21, 2024
"Shale has redrawn the map of world oil in a way most people don't seem to understand. It has changed not only the supply-demand balance but it has changed the geopolitical balance and the psychological balance." -Daniel Yergin https://t.co/KW5zx9fbc3 pic.twitter.com/FCi4g1g14B
— Jesse Felder (@jessefelder) April 23, 2024
'Valuations of the world's gold producers, led by Newmont and Barrick, have rarely been as heavily discounted in the past 40 years versus the gold price as they are now.' https://t.co/tk5OLBdy5n pic.twitter.com/12lidOsnpV
— Jesse Felder (@jessefelder) April 26, 2024
"Another wage-price spiral attributable to rising oil prices would be very reminiscent of the Great Inflation of the 1970s, when the price of gold soared. In this scenario, $3,500 per ounce would be a realistic target for gold through 2025." -@yardeni https://t.co/5eINSEOqHq
— Jesse Felder (@jessefelder) April 21, 2024
DiscoverGold
The Corn & Ethanol Report
By: Daniel Flynn | April 26, 2024
We kickoff the day with Core PCE Price Index MoM & YoY, PCE Price Index MoM & YoY, Personal Income, and Personal Spending at 7:30 A.M., Michigan Consumer Sentiment Final, Michigan 5-Year Inflation Expectations Final, Michigan Consumer Expectations Final, Michigan Current Conditions Final, and Michigan Inflation Expectations Final at 9:00 A.M., and Baker Hughes Oil & Total Rig Count at 12:00 P.M.
It’s the economy stupid! It’s the Border! Yesterday the street had pegged GDP at roughly up 2.5 %, which is anemic in itself. But the reality came in at 1.6% which is just pitiful. Federal debt continues to outpace GDP by a wide margin. If it were not for government spending, the US GDP would be deeply negative. Taxpayers and actual US citizens covering migrant debit cards and migrant employment that is counted in Unemployment should not count illegal aliens to be counted in the workforce. Now we face a huge dilemma for the US taxpayer – and can the US economy can grow without creating massive piles of new debt. Add in $1 trillion of new US debt every 100 days argues that a debt crisis will emerge for the US in the years ahead. Can the current administration curb spending and realize they doing the opposite of balancing the budget? The line is off in Vegas.
Corn futures ended slightly higher as an early end of Brazil’s wet season threatens yields. Brazilian new crop corn sales as of late April are scrapping along at decade lows. US corn stays competitive in the global marketplace through July. Brazil is not producing a serious export offer until August. Weather in the Central US remains favorable. Widespread planting will continue for another 24 hours before soaking rainfall blanket the Central Plains, Midwest, and Delta. Fieldwork halts nearby, but drought will be nearly eliminated in from E KS, MO, and Pockets of IA. Rainfall of 2-4” is forecast into Monday & Tuesday with additional rain thereafter.
Read Full Story »»»
DiscoverGold
Natural Gas Upside Breakout from Consolidation, Eyes Higher Levels
By: Bruce Powers | April 26, 2024
• Natural gas reverses higher, breaking out of a triangle pattern and testing resistance near 2.01.
Natural gas reverses higher on Friday, following an initial breakdown from a symmetrical triangle consolidation pattern yesterday. The reversal triggered an upside breakout of the triangle with an advance above the 1.94 swing high from April 10. Resistance was seen just shy of the 2.01 swing high from March 5 at the day’s high of 2.00, leading to an intraday pullback.
A test of support around the top boundary line of the triangle is in process with a low for the day of 1.91, at the time of this writing. However, be aware that today’s gap up bullish reversal may be influenced by the change in the future’s contract as the chart shown is for continuous futures.
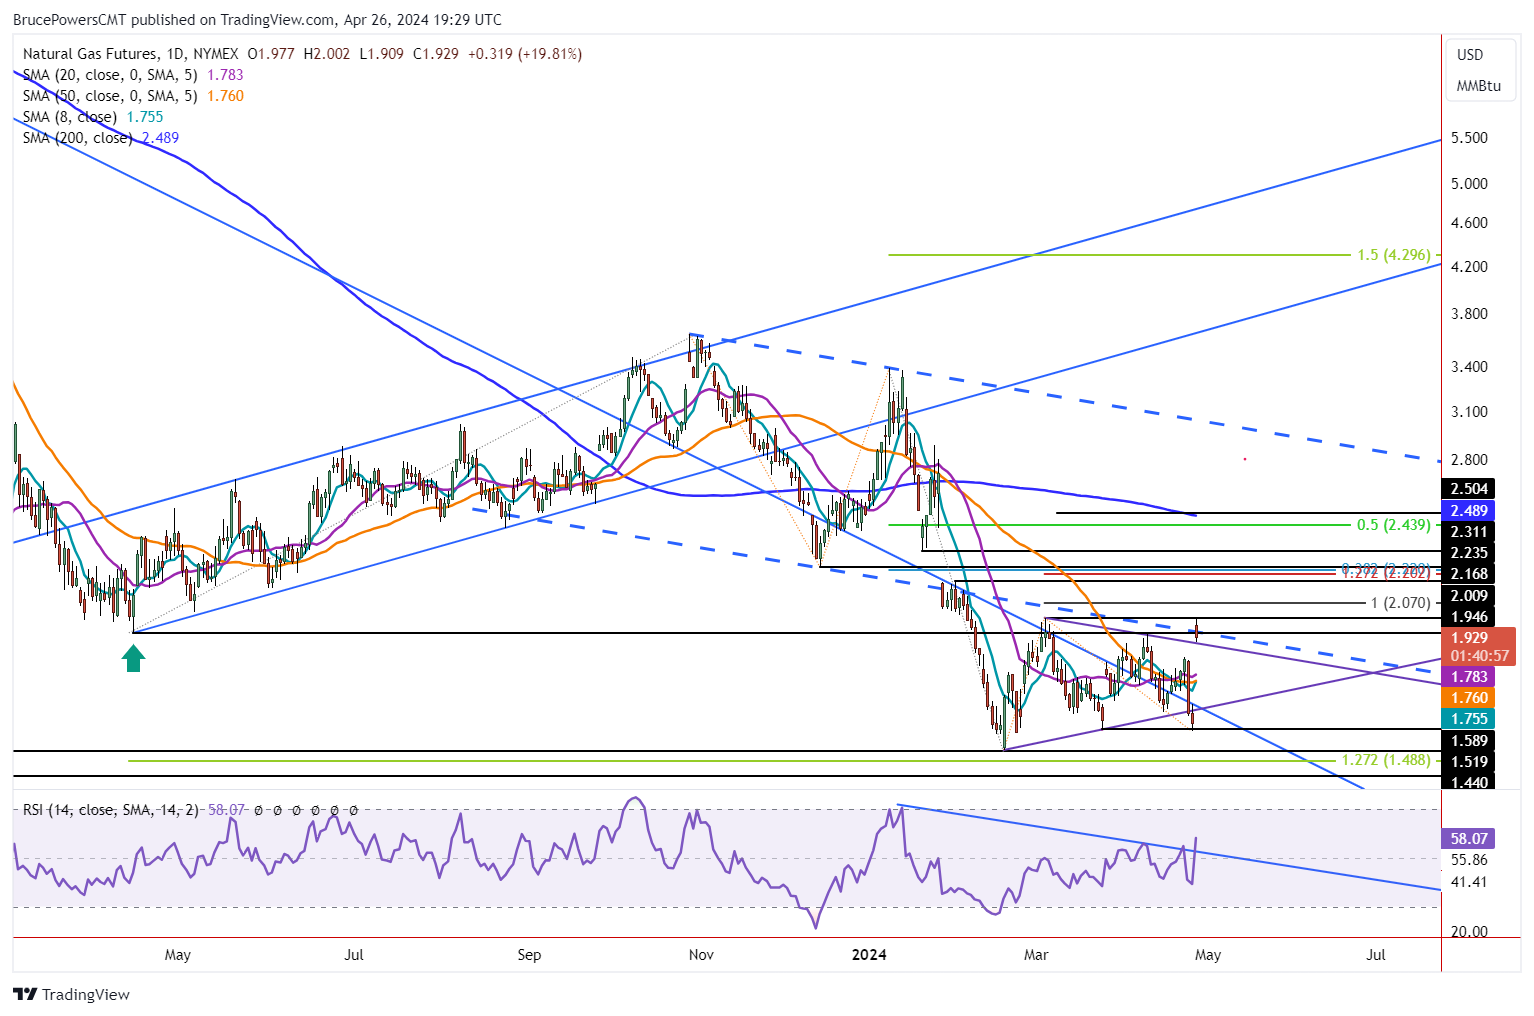
Out of Symmetrical Triangle, Eyes Higher Levels
The 1.94 swing high matches the previous trend low from April 2023 at 1.95. Therefore, it has some longer-term significance. It was exceeded to the upside over several days in early-March but there was no close above that price level. This means that a daily close above 1.95 will provide a sign of increasing demand and that a breakout above the 2.01 swing high is a bullish signal.
Also, notice that today’s advance exceeded the lower dashed blue declining parallel channel line, another sign of strength. Further, the trendline on the relative strength index momentum oscillator (RSI) was busted to the upside today. Nevertheless, what happens in the coming days will be more revealing than today’s price action.
Further Confirmation of Strength Needed
It doesn’t look like today will end above the 1.94 swing low. So, moving forward a daily close above that price level will provide confirmation of strength. And, on a daily close above the lower blue channel line, although it is more of a sign of strength rather than a reliable signal.
There are several upside price levels to watch, and more details will be discussed in the future. For now, the 38.2% Fibonacci retracement completes at 2.22. That area is also highlighted by the swing low from mid-December. If there is a rally above 2.01, higher targets become more likely of being tested.
Read Full Story »»»
DiscoverGold
Coffee Hits All-Time High
By: Barchart | April 26, 2024
• Coffee Hits All-Time High

Read Full Story »»»
DiscoverGold
Stag Party. The Energy Report
By: Phil Flynn | April 26, 2024
Stagger Lee shot Billy DeLions and he blew that poor guy down. Yesterday’s gross domestic product showed higher inflation and lower growth than expected which brings back the memories of that 70s melody called stagflation wand blew that poor stock market down. Yet despite the turmoil, petroleum products remained resilient.
The US economy grew at just 1.6%, the slowest pace in almost two years, rising 3.4% in the fourth quarter of 2023, according to the Bureau of Economic Analysis (BEA). Economic forecasts had called for a deceleration of growth over the previous month, with the expectation that the economy would expand by 2.4%, according to a Reuters report. Janet Yellen, later in the day, tried to put a positive spin on the numbers claiming that the economy is really stronger than the numbers suggest. While that is partially true, it doesn’t explain away the sticky inflation. The personal consumption expenditures (PCE) price index, excluding food and energy prices — a key metric the Federal Reserve tracks to measure inflation — increased by 3.7% after rising to 2% in the fourth quarter. Inflation is going to be one of the biggest challenges for central bankers.
Oil prices shook off stagflation fears and rallied late in the session after trading down after the GDP report because overall the fundamentals for oil are looking more bullish. Not only do we have to price in geopolitical tensions going into the weekend, we also have to be concerned about the looming supply shortage that we are seeing in the global marketplace that will see all-time record demand next month.
Reports that Israel is stepping up its attacks in Gaza as they prepare for the Rafah invasion and the ongoing concerns about Ukraine’s attacks on Russia’s oil infrastructure, has geopolitical risk factors that continue to support prices. The World Bank is warning that a conflict in the Middle East could push the price of oil above $100 a barrel and that could reverse the recent downtrend in global inflation. They said that the recent drop and commodity prices have been leveling off even before the missile strikes in Iran and Israel, but they acknowledge that the complexity of rising commodity prices is going to make global central banks jobs more difficult especially when it comes to reversing the historic amount of interest rate increases. The World Bank is predicting that crude oil prices will average $84 a barrel this year but be careful because any disruptions could cause prices to spike.
On further review, the Energy Information Administration report is very supportive and while a lot of people are concerned about the weakness in US gasoline demand the record exports continue to support this market. The administration is very worried about the potential for a gasoline price spike going into the election and yesterday’s gross domestic product number didn’t help the overall mood of the market. Tanker trackers is reporting though that there’s been a record amount of ship-to-ship transfers totaling 116,000,000 barrels of Iranian crude oil worth $1.4 billion pre discount and were visually identified in the South China Sea all headed to China. The Biden administration continues to turn a blind eye to Iranian oil sanctions and even though the passage of new sanctions should allow it, Biden should really crack down on Iran. In fact, they have the tools to crack down on Iran, but they refuse to do so.
The Biden administration did impose new sanctions on Venezuela. It appears it’s not going to slow down Venezuelans oil exports completely. Not only will it not impact Venezuelan oil exports, they are already moving to cut deals with other countries.
Bloomberg News reports that, ”Spanish oil major Repsol SA expects production to climb with the addition of two oil fields in a joint venture with Venezuela, where the company is exempt from reimposed US sanctions. The company recently signed a deal with state-owned Petroleos de Venezuela SA that adds the fields to its operations, which in the next few months are expected to produce 20,000 barrels a day, doubling what the European major currently produces in one of its three ventures, Chief Executive Officer Josu Jon Imaz said in a call with investors Thursday. The expansion agreement was signed hours before the US reimposed sanctions last week on Venezuela’s oil and gas activities. Companies such as Repsol and Italy’s Eni SpA have said previously arranged waivers with the US government allow them to continue operating. The waivers allow Repsol “to continue operations as we have been doing so far, even with sanctions in force,” the CEO said.
How’s that green energy transition going for you. In Europe competitors are making energy decisions based on politics and not reality and is causing a huge backlash in the region. Not only have we seen riots break out with farmers angry about green energy regulations but now it appears that the EU once again has to pull back on some of its green energy mandates. There are reports that the EU countries are going to reverse a distilled fuel tax that had angered farmers that essentially could put them out of business. In the meantime, the German economy is struggling because of its green energy short sightedness mayor. This is a country that says that they want a carbon free future but then went ahead and closed down their nuclear power plants. Has the entire world lost all common reason and sense?
Reuters reports that The European Commission’s next sanctions package is expected to propose restrictions on Russian liquefied natural gas (LNG) for the first time, including a ban on trans-shipments in the EU and measures on three Russian LNG projects, three EU sources said. The Commission is in the final stages of ironing out its proposal and is engaged in informal talks with member states this week. The Commission declined to comment.
The new oil market action is very positive and the big question is how much of this is going to be geopolitical risk premium and how much of it is going to be based off supply and demand. We think that the market is still undervalued based on supply and demand and we think the talk of a huge geopolitical risk premium is overstated. While there’s no doubt there’s some geopolitical risk premium in the price of oil, there are reports saying it could be as much as $5.00 or $10.00 a barrel and that seems to be very high based upon the supply and demand realities that we face. For most of this year we have expected a supply deficit going into this part of the year and apparently it looks like that’s where we are headed. This is why we’ve been recommending staying hedged for most of this year and we still believe that there is upside price risk going into the end of the year and it could be significant.
Natural gas is trying once again to find some support even in the face of a very bearish weekly injection report. The supply glut is real and one of the big problems we continue to have with the natural gas market is Freeport LNG. Reduce flows to Freeport is a concern for this market because of the oversupply. We need to move as much gas as we can and it does not help when Freeport is down. The market is looking ahead to expanded Langport capacity in the future but the uncertainty surrounding the Biden administration’s study on LNG exports is going to continue to discourage investment in US energy.
Reuters reported that the second-largest U.S. liquefied natural gas (LNG) export facility has been running below 80% of its capacity due to technical problems, data from financial firm LSEG showed, denting U.S. exports. Since Jan. 15, Freeport LNG’s Quintana, Texas, liquefaction plant has been operating without at least one of its three gas-processing trains. In the last two weeks, it has taken barely enough gas for one of its trains to fully operate.
Read Full Story »»»
DiscoverGold
Sugar fell to its lowest price since January 2023
By: Barchart | April 25, 2024
• Sugar fell to its lowest price since January 2023.

Read Full Story »»»
DiscoverGold
Natural Gas Will Support Hold or Breakdown Continue?
By: Bruce Powers | April 25, 2024
• Natural gas broke down from a symmetrical triangle, finding support at 1.60. Monthly support is at 1.59.
Natural gas breaks down from a symmetrical triangle on a drop below Wednesday’s low before finding support at 1.60 and bouncing. The high for the day was 1.675, which completed a test of resistance at the long-term downtrend line. Support is around the most recent swing low of 1.59. If broken to the downside and natural gas stays below it, lower prices may be coming.
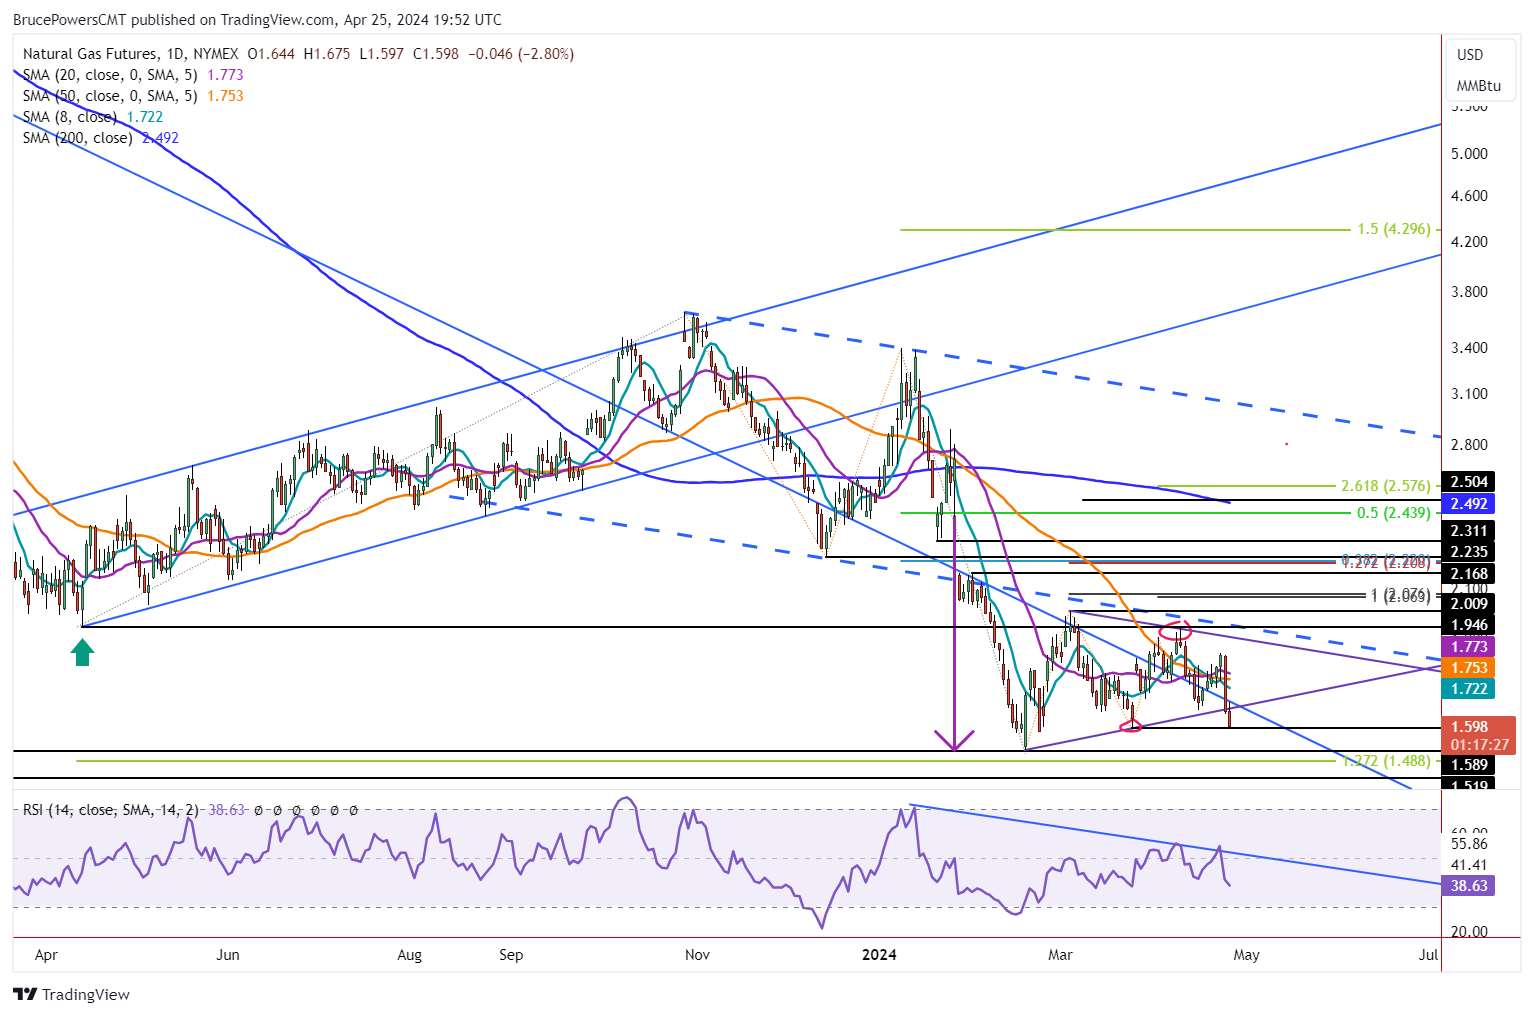
Breakdown in Play
The trend low of 1.52 from February is a significant support level going back 29 years. Although a breakdown from consolidation has triggered, downside follow through is key. Will selling pressure accelerate or support hold and eventually turn prices higher? There are no signs of it yet, but this possibility remains. A bullish sign will next be indicated on a rally above today’s high (at time of this writing) of 1.675. The key near term resistance level of significant is this week’s high of 1.84. Once there is a daily close above that price level the possibility of an upside continuation improves.
Monthly Support May Continue to Hold
Monthly support is also at the 1.59 swing low. During April natural gas has remained within the range from March forming a possible second sequential inside month. Therefore, a sustained breakdown below 1.59, if it occurs before the end of the month, will trigger an inside month breakdown from March. That’s a bearish signal that could be followed by an expansion of volatility.
Strong Support at or Above 1.52 May Continue
As noted above, the 1.52 price level is significant and may continue to act as support. Consequently, if volatility expands there is a possibility the 1.52 level is broken. If that happens the next lower target is around 1.44, a 29-year low. However, there is another price area to watch at 1.49. That is the target from an extended retracement of the six-month rally that began from the prior trend low a year ago.
Contraction in Volatility
If April ends without a breakdown below last month’s low, there will be two inside months further highlighting the decline in volatility experienced recently. As price compresses it prepares for its next move and a pickup in volatility. That could come from a bounce off monthly support or a breakdown.
Read Full Story »»»
DiscoverGold
Supplying The World. The Energy Report
By: Phil Flynn | April 25, 2024
While the US oil and gas industry continues to get bashed by the Biden administration, the reality is that the US oil and gas industry is providing supply stability to the global economy. US petroleum exports hit 12,094 million barrels a day which is an all-time record high but gasoline demand in the US is tepid at best. Still, global economic growth continues to suggest that global oil demand will break records next month and if that demand is going to be met, it will be because of the efforts of the US oil and gas industry.
The Energy Information Administration (EIA) reported the first US crude draw in 5 weeks, and it was a whopper, down 6.4 million barrels to 453.6 million barrels, in what may be the first of many. Gasoline demand though continues to be weak in a sign that consumers are feeling the pain of inflation as the demand over the last four weeks averaged 8.7 million barrels a day, down by 3.7% from the same period last year.
Yet gasoline inventories still fell by 600,000 barrels from last week and are about 4% below the five-year average as we exported 778.000 overseas. Distillate fuel inventories did increase by 1.6 million barrels last week and are about 7% below the five-year average for this time of year.
The world is becoming more reliant on the United States energy producer to fill the void in the global market that was partly created by bad energy policy in Europe that led to the war in Ukraine. And there are open worries from our trading partners that Biden’s policies in restricting production and by pausing liquefied natural gas exports terminals, is going to leave our trading partners and the global economy in a precarious state.
This comes as we are seeing warnings that the geopolitical risk factors surrounding oil and gas have not gone away and warnings from trading partners in Europe that the natural gas crisis may reappear next winter. The tightening supply situation comes against high anxiety and geopolitical risk factors that may get worse before it is better. Bloomberg reports that, “European Gas Traders Are Already Worrying About Next Winter and that Gas capacity deals at Russia-Ukraine border set to end and that Next winter gas is trading at a premium to all other contracts. They write that, “While demand remains muted and the region exited the heating season with the highest stocks on record, industry players gathering at the Flame conference in Amsterdam this week see risks mounting. And prices are responding. Worries include uncertainty over remaining Russian flows through Ukraine and rebounding gas demand in Asia. A colder-than-normal winter spurring consumption at home is also seen as more likely after two consecutive mild ones. The concerns are showing up in the futures market. The contracts for next winter are the most expensive on the curve.
A Rigzone report says that, “recent reports indicate that Iran intends to disrupt operations in the Strait of Hormuz, Dryad Global stated in its latest Maritime Security Threat Advisory (MSTA), which was released on April 22. “The most recent incident, the seizure of the MSC Aries, demonstrates that Iran, despite being preoccupied with missile operations against Israel, continues to interdict and control vessel movement in the Strait of Hormuz, Persian Gulf, and Arabian Sea,” Dryad noted in the MSTA.
Of course the Biden administration despite their policies that make oil and gas prices go higher, continue to insist they want to do things to get prices lower and we must admit that maybe they’ve succeeded in one area and that area would be Venezuela. Bloomberg reported that, “Chinese refiners are paying a little less for Venezuelan oil after the US reimposed sanctions on the South American producer. Merey crude, often used to make bitumen to pave roads in China, traded at a discount of $14 a barrel to ICE Brent in recent days on a delivered basis, according to traders. That compares to $11 before sanctions were reinstated last week, and $8 at the start of the year. China’s likely to draw more barrels from Venezuela after the US discontinued its six-month sanctions waiver, as other buyers, including India, shun embargoed oil to avoid run-ins with Washington. An average of 130,000 barrels a day previously bought by Indian refiners and 174,000 barrels a day of US-bound shipments could now be redirected to the world’s biggest crude importer, according to data intelligence firm Kpler.”
Reports of fires at refineries in Russia and Mexico are other reasons to be bullish for oil and products and we are not the only ones that are predicting record demand. Standard Chartered just put out a note that said that they expect that global oil demand will pick up strongly in May and June and will exceed 103 million barrels a day for the first time in May.
Once again, the preponderance of evidence continues to suggest there is significant risk of upside price movements in crude oil, gasoline and diesel over the coming weeks. We do think we’ll see a bounce back in US demand for gasoline when the weather starts to warm up, but the global demand will continue to keep US supplies very tight. Our global partners continue to be astonished how the United States it’s continuing to make politically motivated decisions to appease the environmental base while the global economy hangs in the balance.
Sure, you can contact me to find ways to hedge and trade this coming crisis. The commodity Supercycle is coming into play once again and copper recourse is one of the markets that we have to keep a real close eye on. Bloomberg reported that, “BHP Group Ltd. proposed a takeover of Anglo-American Plc that values the smaller miner at £31.1 billion ($38.9 billion), in a deal that would create the world’s top copper producer while sparking the industry’s biggest shakeup in over a decade. The No. 1 mining company proposed an all-share deal in which Anglo would first spin off controlling stakes in South African platinum and iron ore companies to its shareholders before being acquired by BHP. The total per-share value of the non-binding proposal is about £25.08, BHP said, a 14% premium to Anglo’s closing share price on Wednesday. A tie-up with Anglo would give BHP roughly 10% of global copper mine supply ahead of an expected shortage that many market watchers have predicted will send prices soaring.”
We do have natural gas inventories today and we’re expecting to see an injection of 85 BCF. The industry is going through some significant challenges domestically. The Biden administration needs to start signaling to the world that we are going to continue to be the world’s largest liquefied natural gas exporter. We need to stop playing politics with US energy and get back to reality that natural gas is going to be the best way to reduce greenhouse gas emissions in emerging markets along with increase use of nuclear power.
Read Full Story »»»
DiscoverGold
Wheat hits highest closing price in more than 3 months
By: Barchart | April 24, 2024
• Wheat hits highest closing price in more than 3 months.

Read Full Story »»»
DiscoverGold
Natural Gas Faces Breakdown Risk Amid Symmetrical Triangle Pattern
By: Bruce Powers | April 24, 2024
• Natural gas price faces a critical juncture as it tests support within a symmetrical triangle pattern, with implications for a potential breakdown. The current price action highlights the challenges of relying on patterns within consolidation.
Natural gas turns down and drops to a five-day low as heads towards a test of support at the lower boundary line of a symmetrical triangle. At this time of this writing the low for the day was 1.63, and trading continues near the lows. Today’s bearish reversal is occurring within a symmetrical triangle consolidation pattern, so the implications are less than if today’s bearish action occurred in a different part of the trend. However, that will change if a breakdown triggers a decisive decline below the lower boundary line. The prior swing low of 1.65 from last week has already failed to provide support.
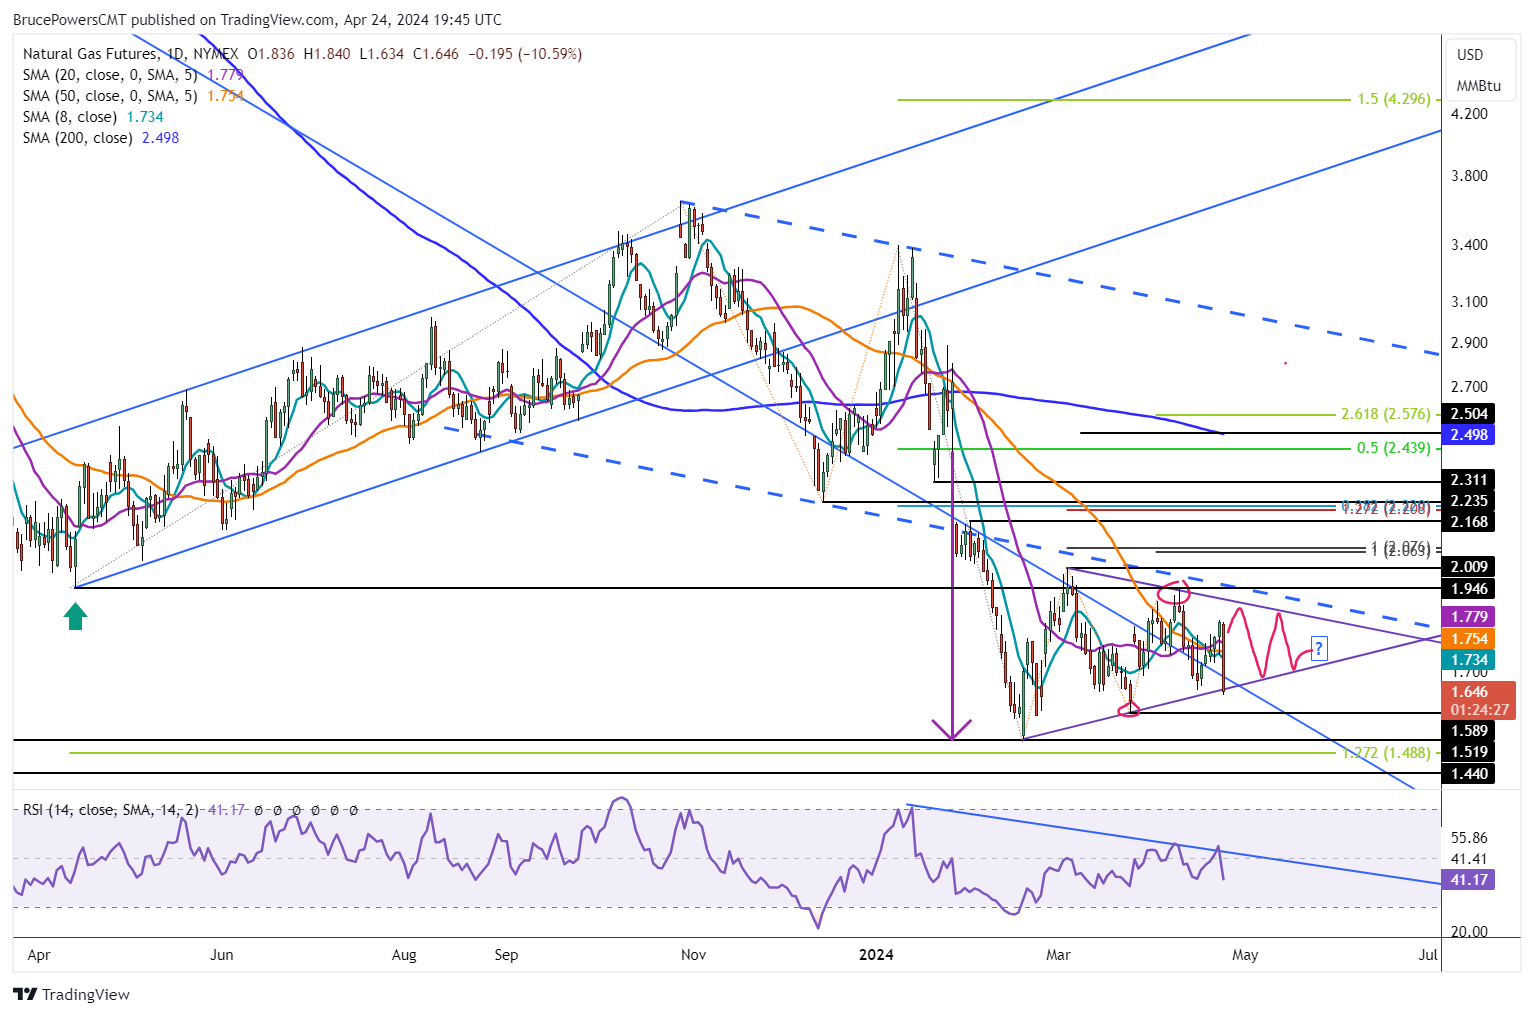
Weekly Support Fails
This puts the weekly bullish reversal of a hammer candlestick pattern that triggered on Wednesday at risk of failure. If the 1.63 price level is the lowest for the day, a drop below it will trigger a breakdown of the triangle pattern. Clearer bearish confirmation is indicated on a decline below the 1.59 swing low from March 25. The next lower target would then be the trend low of 1.52. That is the second lowest support level seen in natural gas in about 29 years. The lowest was 1.44 seen intraday, but the price quickly recovered, and the day ended back above the 1.52 level. In other words, 1.52 is a significant support area.
Support Seen at Bottom of Triangle
Today’s bearish price action is an example of why patterns within consolidation are less reliable to follow through. That is what is happening today following five days of positive performance and a strong close yesterday. It looks like today’s test of support at the lower boundary line may be the lowest price for the day thereby providing a third touch of the line. If it continues to act as support a bullish reversal may yet take natural gas back up towards the top line of the triangle.
Reaction Following Test of Support to Provide Clues
Thursday’s closing price will provide a clue. If natural gas can end the day above last week’s low of 1.65 it will be a slightly stronger close than being below last week’s low. But what happens next should provide further clarity. Either natural gas bounces off today’s low or breaks through it triggering a breakdown of the triangle.
Read Full Story »»»
DiscoverGold
Not Over. The Energy Report
By: Phil Flynn | April 24, 2024
Oil prices rebounded yesterday from signs that the geopolitical tension may not have eased as much as previously believed. After the close we saw the American Petroleum Institute (API) report that petroleum supplies came in tighter than the market was expecting. The API reported the crude oil inventories fell by 3.23 million barrels where the market expectation was that they were going to increase by 1.8 million barrels. We also saw a 595,000 barrel drop in gasoline inventories and distillate inventories eked out a gain of 724,000. Attacks on Russian oil infrastructure and commitments by Russia to lower oil production and keep exports steady should provide some support for diesel. We did see some weakness in a report that Chinese refinery runs fell by 919 kb/d to a seven-month low but that could be offset by signs that maybe this week US demand is going to look robust, at least compared to recent weeks.
The reduction of the war premium in oil came when it appeared that the global tensions between Israel and Iran had calmed down, yet that war premium is creeping back in on reports as Israel is warning civilians to get out of Rafah as they prepare an invasion. Reports say that Israel is getting ready to find tents for Palestinian civilians they intend to evacuate before the invasion. There’s also some speculation that Israel’s response Iran’s attack isn’t over yet and it’s just biding its time before it sends Iran a real message.
The House and Senate passed new sanctions on Iran. Last week Biden announced sanctions against Iranian steel and drone companies as well as 16 individuals on Thursday in response to last weekend’s aerial attack by Tehran against Israel. Yet the Biden administration is fearful to enforce sanctions on Iran? At first it was an attempt to appease Iran to try to cajole them into a new Iranian nuclear accord that supposedly fixed all the problems with the previous accord that President Trump rightly pulled out of. Now it appears that Iran just used the negotiations to fortify their economic position and their oil production and now it is seeing their exports hit a six-year high. Iran used its Biden oil windfall of course to fund their operations and support groups like Hamas, Hezbollah and the Houthi rebels.
While the Biden administration fails to enforce sanctions on Iran, the truth is that innovation in the oil and gas industry in the US could replace Iranian oil production if there was incentive to do so. Reuters reported that, “Technology advances are making it possible for U.S. shale oil and gas companies to reverse years of productivity declines, but the related requirement to frontload costs by drilling many more wells is deterring some companies from doing so. While overall output is at record levels, the amount of oil recovered per foot drilled in the Permian Basin of Texas, the main U.S. shale formation, fell 15% from 2020 to 2023, putting it on par with a decade ago, according to energy researcher Enverus.
Reuters writes that, “That is because fracking, the extraction method that emerged in the mid-2000s, has become less efficient there. In the technique, water, sand and chemicals are injected at high pressure underground to release the trapped resources. Two decades of drilling wells relatively close together, resulting in hundreds of thousands of wells, have interfered with underground pressure and made getting oil out of the ground more difficult. “Wells are getting worse and that is going to continue,” said Dane Gregoris, managing director at Enverus Intelligence Research firm.
But new oilfield innovations, which began being implemented more widely last year, have made it possible for fracking to be faster, less expensive and higher yielding. The advances in the past few years include the ability to double the length of lateral wells to three miles and equipment that can simultaneously frack two or three wells. Electric pumps can replace high-cost, high maintenance diesel equipment. “Companies now can complete (frack) wells faster and cheaper,” said Betty Jiang, an oil analyst with Barclays.
A drawback to the new simultaneous fracking technology, also called simul-frac, is that companies need to have lots of wells drilled and ready to move to the fracking phase in unison before they can proceed. Pumps inject fluids into and get oil and gas out of two or three wells at the same time, instead of just one. Because these act as an interconnected system, wells cannot be added piecemeal. But companies eager to cut costs have not deployed enough drill rigs to capitalize fully on the potential of the innovations.”
The Biden administration is very anti fossil fuel production in the United States. While they are trying to take credit for record oil and gas production, it’s clear that most of the gains have been made by innovation by the oil and gas industry and most of it has been done on private lands. Private oil and gas companies have been flourishing despite the attempts by the Biden administration to accuse them of war profiteering and price gouging. Matador Resources Co. pumped more oil than expected in the first three months of 2024 at a time when most US producers have pledged flat to moderate output growth this year.
Bloomberg reports that Matador’s 2% production over-performance to start the year was done while spending less money on drilling than projected, the company said. During the first quarter of 2024, Matador’s average oil production of 84,777 barrels per day beat its guidance of 83,500 barrels, the company said. “We now expect full-year production for 2024 at the high end of our previously announced average production guidance for oil of 91,000 to 95,000 barrels of oil per day,” the statement said.
The commodity super cycle comes in waves. Coffee and cocoa are making historic moves and industrial and precious metals are back in vogue. Major players have been taking notice and shifting their investments back to the futures. Bloomberg News is reporting that, “Some of the world’s biggest energy trading companies are returning to metals, years after getting burnt in the notoriously difficult markets. Vitol Group, Gunvor Group and Mercuria Energy Group are among the traders building out their metal’s teams, as they look to deploy capital generated by record profits. The shift comes as forecasters turn increasingly bullish on copper, aluminum and other metals, where long-anticipated production shortfalls are starting to take shape. Many commodities house’s also see strong links between metals usage and power markets — another growth area for traders according to Bloomberg.
What are we going to do with the electric car glut. The Biden administration says that we are in a race with China to control the EV market. The problem is that the Chinese consumers, like the American consumers, just don’t not want them. Oh sure, the International Energy Agency claims that, “over 20% of global car sales this year are projected to be electric, driving a transformative shift in the auto industry and cutting oil use for transport.” Yet these are the same folks that predicted that global oil demand would peak years ago.
Reuters reported that, “By most measures, the last thing China needs is more electric cars crowding a market with more losers than winners, driving down prices at the expense of profit and taking the fight for market share beyond China. And that’s just what it is getting. Automakers are expected to launch 110 EVs and plug-in hybrids in 2024, many at the Beijing auto show that starts Thursday. Those new offerings, dominated by Chinese brands, will join By contrast, there were just over 50 EV models on sale in the United States last year. But while there is a peril in China’s overcapacity, there is also a power in the hyper-competition it has unleashed, analysts, suppliers and executives say. China’s leading EV makers have found ways to slash vehicle development time, combining speed to market with new features and a pricing advantage rivals outside cannot match. the almost 400 “new energy” models already in China’s showrooms, according to industry data.” But the main problem is still sales, which even though they are growing in China, are not growing at the pace to get rid of the oversupply. And there doesn’t appear to be any plan to deal with the batteries once they start to go bad in 10 years.
Natural gas is still trying to put in a little bit of a bottom here. It has a tough road ahead. We are looking for an injection of 85 BCF this week.
Read Full Story »»»
DiscoverGold
$Wheat has exploded... from 523.50 about 8 weeks ago to today at 597
$Natgas is looking primed. TY
Wheat jumps 28¢ in the last 2 sessions.
Agriculture Master Report
By: Bill Moore | April 23, 2024
JULY WHEAT
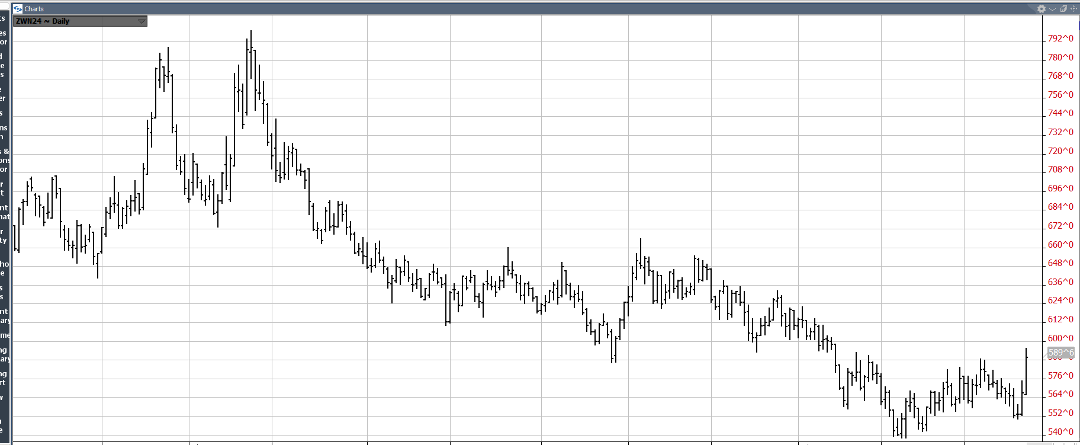
A plethora of bullish fundamentals have driven July Wht to two month highs – including historical cheapness, dryness in the US Southern Plains & Russia & military strikes into Ukraine perpetrated by Russia! Also, Russia has had recent difficulties with its export system! These factors coupled with a probable upside technical break-out could finally signal a long-awaited bottom in July Wht!
JULY CORN
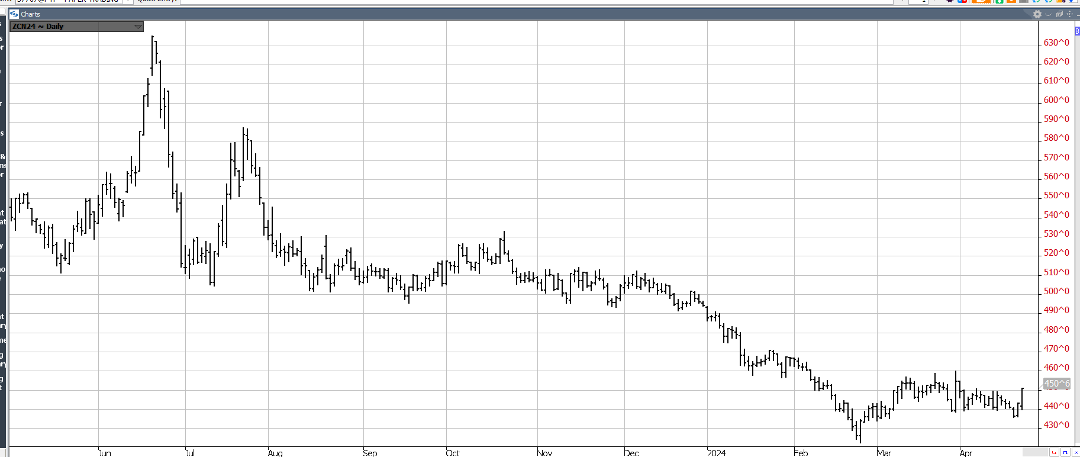
July Corn was “down & dirty” at the end of last wk breaking out of its consolidation pattern on the downside, but it quickly reversed with solid gains Friday & today as the contract quickly marched up to the top end of its March trading range! Marketing year high export inspections of 1.623mmt also helped – as well as July Wht’s 20 cent upside explosion to 7 wk highs! The corn contract has dropped $2.00 since last summer -in the process factoring in a lot of bearishness – including adequate stocks & slack exports! Since the 1st, exports have run about 35% over 2023! At current levels, July Corn can allow no margin for error – should there be any glitches in the US Crop!
JULY BEANS
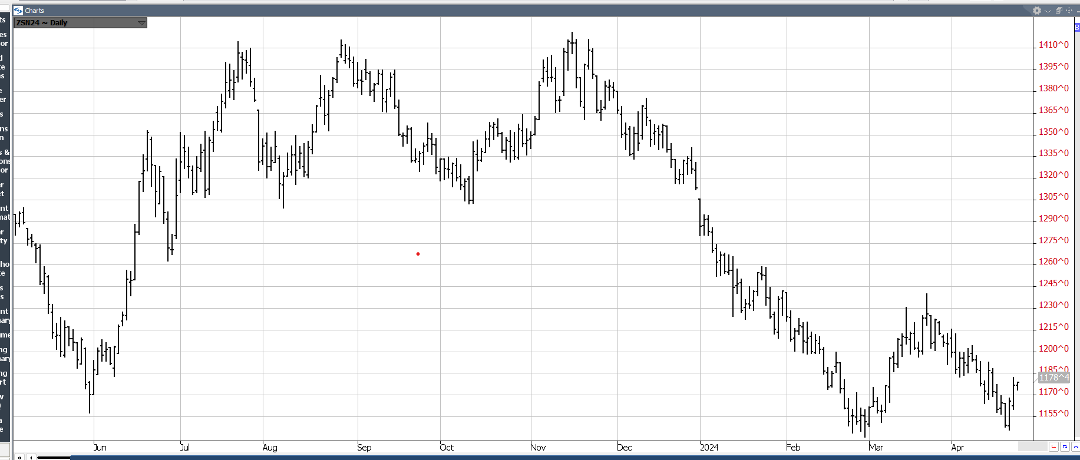
July Beans rode the short-covering wave that engulfed grains today as harvest is nearly complete in Brazil & dryness persists in Argentina! Flash sales have begun appearing regularly with 3 last week & the fund short position is quite large – as well, the mkt is $2.50 off last Summer’s highs! Spiller-over from wheat was prominent as global dryness in wht areas & geopolitical issues sent wht more than 20 cent higher! Bean stocks are not abundant & there is no weather premium in the mkt as planting is just beginning!
JUNE CAT
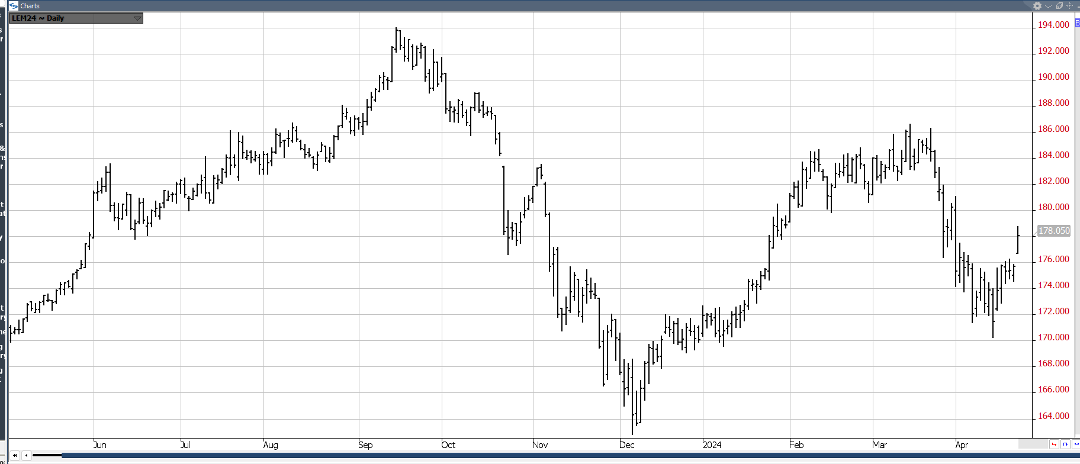
Cattle-on-Feed reports have been widely unpredictable of late & the April version issued last Friday at 2pm was no exception! Placements came in at 88% (est-93) after last months 110% which started cattle’s $16 slide! The expected reaction was a gap-higher, sharply higher close as the mkt rallied to the midpoint of the recent break! Two factors helped encourage the rally – one was the realization that the Bird Flu impact was mitigated & two is the grilling season we’re currently in – cattle’s best demand period of the year!
JUNE HOGS
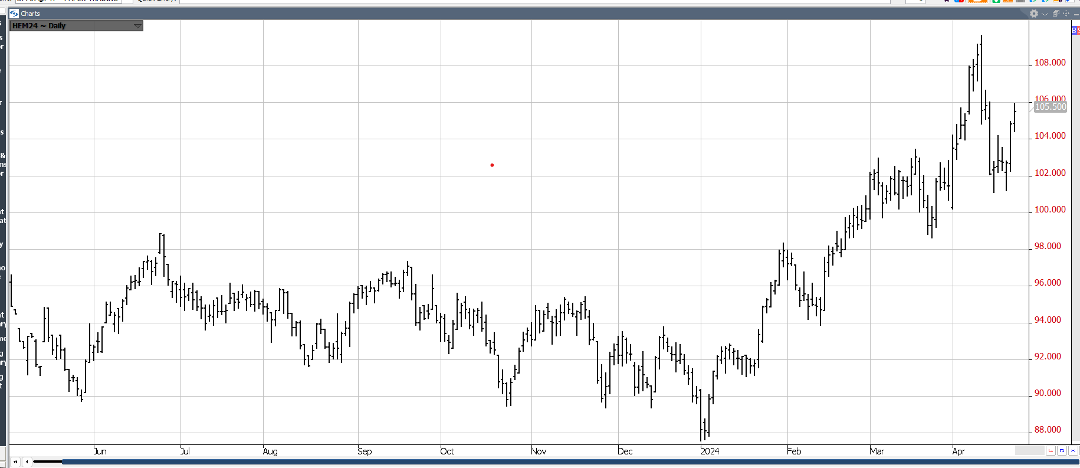
June Hogs basically jumped on board the short-covering rally in grains & cattle posting modest gains but closing within $3.00 of the recent of its recent highs! They are also the beneficiary of an excellent demand as folks roll out their grills! Also, recent slaughter & avg weights have been down & exports up as China’s recent herd liquidation has leveled out!
Read Full Story »»»
DiscoverGold
Grains Report: Wheat, Rice, Corn and Oats, Soybeans, Canola and Palm Oil
By: Jack Scoville | April 23, 2024
• WHEAT
General Comments: Wheat was lower last week and trends remain mixed in all three markets. The weekly export sales report showed poor sales once again. The problems with Russian Wheat exporters continue but are apparently getting resolved in the governments favor. The reports indicate that the government is seeking more control of the exports and has made life very difficult on the private exporters in an effort to extract more sales and powers to the government. Russia is the world’s largest exporter and sets the world price and prices remain low. Big world supplies and low world prices are still around. Export sales remain weak on competition from Russia, Ukraine, and the EU as those countries look to export a lot of Wheat in the coming period. Black Sea offers are still plentiful, but Russia has been bombing Ukraine again and shipments might be hurt from that origin.
Overnight News: The southern Great Plains should get mostly dry conditions. Temperatures should be above normal. Northern areas should see mostly dry conditions. Temperatures will average above normal. The Canadian Prairies should see mostly dry conditions. Temperatures should average above normal.
Chart Analysis: Trends in Chicago are mixed. Support is at 527, 517, and 510 May, with resistance at 557, 568, and 575 May. Trends in Kansas City are mixed. Support is at 571, 561, and 556 May, with resistance at 597, 602, and 605 May. Trends in Minneapolis are mixed. Support is at 626, 610, and 604 May, and resistance is at 651, 658, and 660 May.
• RICE
General Comments: Rice closed higher again last week and has rallied back to the contract highs. Trends are up in this market on the daily charts. The market noted good planting and emergence progress in the weekly USDA reports.
Overnight News:
Chart Analysis: Trends are up with no objectives. Support is at 1818, 1792, and 1778 May and resistance is at 1907, 1916, and 1935 May.
• CORN AND OATS
General Comments: Corn closed lower and Oats closed higher last week as traders think that good Spring weather here will greatly increase planted Corn area. Increased demand was noted in all domestic categories, but export demand was left unchanged. South American production estimates were little changed. It is very expensive to plant Corn and Corn is considered unprofitable to plant right now, so planted are might not increase that much if at all. USDA issued its crop progress report for Corn and Corn planting is proceeding slowly. Demand for Corn has been strong at lower prices. Big supplies and reports of better demand are still around, but futures have been very oversold. Funds remain very large shorts in the market.
Overnight News:
Chart Analysis: Trends in Corn are mixed. Support is at 426, 422, and 408 May, and resistance is at 437, 448, and 459 May. Trends in Oats are mixed. Support is at 339, 334, and 328 May, and resistance is at 369, 362, and 369 May.
• SOYBEANS
General Comments: Soybeans and the products closed lower last week. Reports of great export demand in Brazil provide some support. Reports indicate that China has been a very active buyer of Brazil Soybeans this season. Ideas that South American production is taking demand from the US have pressured futures lower. Domestic demand has been strong in the US. Funds remain large shorts in the market. The US reports strong domestic demand.
Overnight News:
Chart Analysis: Trends in Soybeans are mixed. Support is at 1128, 1114, and 1100 May, and resistance is at 1156, 1181, and 1193 May. Trends in Soybean Meal are mixed. Support is at 330.00, 325.00, and 323.00 May, and resistance is at 348.00, 352.00, and 357.00 May. Trends in Soybean Oil are down with objectives of 4430 May. Support is at 4360, 4300, and 4240 May, with resistance at 4620, 4730, and 4830 May.
• CANOLA AND PALM OIL
General Comments: Palm Oil was lower on price action in Chicago. The export pace is expected to continue to really improve but this is part of the price already, in part due to stronger world petroleum prices that have affected world vegetable oils prices as well. Domestic biofuels demand is likely to improve. Ideas of weaker production ideas against good demand still support the market overall. Trends are turning up on the daily charts. Canola was lower in response to the price action in Chicago.
Overnight News:
Chart Analysis: Trends in Canola are mixed to down with objectives of 596.00 May. Support is at 602.00, 594.00, and 588.00 May, with resistance at 621.00, 637.00, and 645.00 May. Trends in Palm Oil are mixed. Support is at 4970, 3920, and 3860 July, with resistance at 4020, 4080, and 4140 July.
Midwest Weather Forecast Scattered showers. Temperatures should average near to above normal.
Read Full Story »»»
DiscoverGold
Softs Report: Cotton, OJ, Coffee, Sugar, Cocoa
By: Jack Scoville | April 23, 2024
• COTTON
General Comments: Cotton was higher yesterday in recovery trading. Demand remains a problem. The export sales report showed poor sales once again. USDA made no changes to the domestic supply or demand sides of the balance sheets, but did cut world ending stocks slightly. Trends are still down on the daily and weekly charts. Demand has been weaker so far this year. The US economic data has been positive, but the Chinese economic data has not been real positive and demand concerns are still around. However, Chinese consumer demand has held together well, leading some to think that demand for Cotton in world markets will increase over time.
Overnight News: The Delta will get mostly dry conditions and near normal temperatures. The Southeast will see showers and rains and below normal temperatures. Texas will have mostly dry conditions and near normal temperatures.
Chart Trends: Trends in Cotton are mixed. Support is at 77.40, 76.80, and 76.20 May, with resistance of 82.00, 85.30 and 86.20 May.
This Week Last Qeek Last Year Average
Cotton Planted 11 8 11 11
• FCOJ
General Comments: FCOJ closed sharply higher to limit up yesterday and futures are back in the middle of the trading range. Reports of tight supplies are around. Florida said that Oranges production will be low, but above a year ago. Futures still appear to have topped out even with no real downtrend showing yet, so a range trade has been seen. Prices had been moving lower on the increased production potential for Florida and the US and in Brazil but is now holding as current supplies remain very tight amid only incremental relief for supplies is forecast for the coming new crop season. There are no weather concerns to speak of for Florida or for Brazil right now. The weather has improved in Brazil with some moderation in temperatures and increased rainfall amid reports of short supplies in Florida and Brazil are around but will start to disappear as the weather improves and the new crop gets harvested.
Overnight News: Florida should get scattered showers or dry conditions. Temperatures will average near normal. Brazil should get scattered showers and above normal temperatures.
Chart Trends: Trends in FCOJ are mixed. Support is at 354.00, 350.00, and 347.00 May, with resistance at 380.00, 389.00, and 391.00 May.
• COFFEE
General Comments: New York closed lower and London closed higher yesterday and both are now developing a trading range. The lack of Robusta Coffee in the market is still the main feature. Robusta offers from Vietnam remain difficult to find and the lack of offer of Robusta is a bullish force behind the London market action. There were some indications that Vietnam producers were now offering a little Coffee, but not much and not nearly enough to satisfy demand. Vietnamese producers are reported to have about a quarter of the crop left to sell or less and reports indicate that Brazil producers are reluctant sellers for now after selling a lot earlier in the year. The next Robusta harvest in Brazil is starting now and offers increased yesterday on weakness in the Real.
Overnight News: The ICO daily average price is now 228.48 ct/lb. Brazil will get mostly scattered showers with near normal temperatures. Central America will get mostly dry conditions. Vietnam will see scattered showers. ICE NY said that 384 notices were posted for delivery today and that total deliveries for the month are now 742 contracts.
Chart Trends: Trends in New York are mixed. Support is at 239.00, 215.00, and 210.00 July, and resistance is at 249.00, 253.00 and 259.00 July. Trends in London are mixed. Support is at 4070, 3980, and 3850 July, with resistance at 4290, 4350, and 4400 July.
• SUGAR
General Comments: New York and London closed higher yesterday in recovery trading and trends remain down on the charts as the market seems to have supplies available for sale. There are still ideas that the Brazil harvest can be strong for the next few weeks if not longer. Indian production estimates are creeping higher but are still reduced from recent years. There are worries about the Thai and Indian production, but data shows better than expected production from both countries. Offers from Brazil are still active but other origins. are still not offering in large amounts except for Ukraine. Ukraine offers have suffered lately with the war.
Overnight News: Brazil will get rains in the south and scattered showers in the north. Temperatures should average above normal. India will get mostly dry conditions and below normal temperatures.
Chart Trends: Trends in New York are mixed. Support is at 1960, 1920, and 1890 July and resistance is at 2050, 2100, and 2150 July. Trends in London are mixed. Support is at 566.00, 580.00, and 554.00 August, with resistance at 580.00, 590.00, and 600.00 August.
• COCOA
General Comments: New York and London were lower and trends are mixed. Production concerns in West Africa as well as demand from nontraditional sources along with traditional buyers keep supporting futures. Production in West Africa could be reduced this year due to the extreme weather which included Harmattan conditions. The availability of Cocoa from West Africa remains very restricted and projections for another production deficit against demand for the coming year are increasing. Ideas of tig8ht supplies remain based on more reports of reduced arrivals in Ivory Coast and Ghana continue. Mid crop harvest is now underway and here are hopes for additional supplies for the market from the second harvest. Demand continues to be strong, especially from traditional buyers of Cocoa.
Overnight News: Isolated showers are forecast for West Africa. Temperatures will be near normal. Malaysia and Indonesia should see scattered showers. Temperatures should average near normal. Brazil will get isolated showers and above normal temperatures.
Chart Trends: Trends in New York are mixed. Support is at 10600, 9990, and 9880 May, with resistance at 12200, 12380, and 12500 May. Trends in London are mixed. Support is at 9500, 9060, and 8500 May, with resistance at 10280, 10400, and 10520 May.
Read Full Story »»»
DiscoverGold
Commodities Daily Market Movers (% Price Change)
By: Marty Armstrong | April 23, 2024
• Top Movers
Cheese 4.76 %
Wheat #2 3.68 %
Wheat CBT Futures 3.67 %
US - Dow / Gold Ratio 3.56 %
Gold / Silver Ratio 2.92 %
• Bottom Movers
NY Silver COMEX Futures 5.54 %
Cocoa (NYCSCE) Futures 3.46 %
Palm Kernel Oil 3.46 %
LME Tin (99.85%) 3.42 %
NY Gold Futures 2.79 %
*Close from the last completed Daily
DiscoverGold
|
Followers
|
89
|
Posters
|
|
|
Posts (Today)
|
0
|
Posts (Total)
|
8810
|
|
Created
|
05/01/07
|
Type
|
Free
|
| Moderators DiscoverGold Pro-Life | |||
- The Commodity Bull is Running... Inflation is Running... Harder Living (i.e. FOOD, CLOTHING, SHELTER) is Dead Ahead... -
- Commodity Futures Trading -
http://finviz.com/futures_performance.ashx
Beneficial Educational Resources on Futures TradingThe futures market is volatile, and it cuts both ways. Leverage that makes it profitable can also ruin reckless, undisciplined traders overnight. Most brokers have paper trading available on their platforms, so those who are new to futures should take advantage and learn with these tools before going live with real money. Mitigate risk with stop loss orders at all times, and cut losses quickly instead of adding contracts and attempting to flip your way out of a losing position. Also, use mini instruments when available, with lower margin requirements, until you have sufficient capital to buy and sell more expensive contracts. Even though the potential is there, don't try to make too many profits at once. If things aren't going well, often times quitting for the day and collecting one's thoughts is the best decision. New opportunities come along daily. Markets are open nearly 24 hours, so set a schedule and stick to it. Avoid trading while tired or distracted, and please don't listen to the advice of others. Do research on fundamentals affecting markets as well as paying attention to TA. Watch key indices, and listen to accurate, real-time news during the session to stay aware of shifting trends. Trade smart, trade safely, and have fun.
Videos on Futureshttps://www.youtube.com/playlist?list=PL9A5C5A93D243CA44 Continuous Improvement in Progress |
Commodity Futures Trading
https://www.tdameritrade.com/investment-products/futures-trading.page
| Volume | |
| Day Range: | |
| Bid Price | |
| Ask Price | |
| Last Trade Time: |


