 News
News  Market Data
  Discover
Support: 888-992-3836
Copyright © 2023 InvestorsHub Inc.


Register for free to join our community of investors and share your ideas. You will also get access to streaming quotes, interactive charts, trades, portfolio, live options flow and more tools.
The Ord Oracle By Tim Ord (08/31/11)_TY_George
* Wednesday, August 31, 2011
For 30 to 90 days horizons SPX: Flat
Monitoring purposes GOLD: Gold ETF GLD long at 147.14 on 6/29/11; stop hit at 170 = gain 15.5%.
Long Term Trend monitor purposes: Flat

The weekly RSI of the SPX came in near 30 three weeks ago and suggested the market was near at least a short term low. A bearish market setup will occur when the weekly RSI reaches back to the 50 range and will suggest the market is near the next high. Current weekly RSI reading is 44.50 and rising. A 50% retracement from the July high came in at 1230 which was hit today and a 61.8% retracement comes in 1261 which is near where the Neckline of a Head and Shoulder top lies. This sell signal setup occurred back mid 2008 (see in blue arrows on chart above) as well as in the decline from the 2000 top. The weekly NYSE McClellan oscillator can also help in finding the next high with surges above the 90 range; Current reading is 79.83. It appears the Market needs to rise a bit more to get the weekly RSI nearer to 50 and McClellan Oscillator over 90. As far as timing goes, a lot of reversals come around the holiday period (last high came on July 5 one day after July 4 holiday) and the next holiday is Labor Day which is on Monday September 5. If the market can stay in rally mode into this holiday and the weekly RSI reaches 50 and into resistance levels of 1220 to 1260 than a potential sell signal could develop. The weekly mid Bollinger bands have been a good trend finder for the SPX and right now the mid Bollinger band is heading down and is why we are looking only the short side of the market for now. This ticks closes have been running at extreme; starting last Friday to today, there are +1123; +1129; +943 and +673 and suggest exhaustion. Obama gives his job speech next Wednesday at 8:00 pm Eastern and market may hold up until then. For now we will remain flat the SPX.

GLD appears to have peaked near 185. Previous times on GLD when the weekly RSI got above 75 and the Chaikin Oscillator traded above 100m, a multi week pull back occurred and we are expecting that here. Strong support comes in near the previous trading range highs which are near 155 level. In weekly up-trends the RSI normally finds support near the 50 range and a low in GLD and something well be looking for on the retracement. Bigger trend is up in GLD, but a pull back near 155 in the coming weeks is possible. Will be looking for buy signal near 155 range on GLD.

The SPX may start another decline possible starting in the next several days and the Gold stocks could pull back as well but will not change the bullish longer term out-look on gold stocks. Above is the Bullish Percent index for the Gold Miners index (GDM). At previous short term highs, the Bullish Percent index for GDM showed a bearish divergence in the RSI similar of what is occurring now. Recently the Bullish Percent index did cross its 7 day moving average bearishly and it appears to be turning down and will give a bearish short term signal and will imply a pull back in this index. Major support comes in near 52.5 range. We are long GDX at 57.01 with a stop at 57.50. If the stop is hit would imply a pull back to previous low near 54 which we will look for another bullish setup.
Long BRD at 1.67 on 8/3/11. Long YNGFF .44 on 7/6/11. Sold on 8/8/11 SLV at 38.32 for gain of 11.4%-Long SLV at 34.39 on 7/5/11. Long EGI at 2.16, on 6/30/11. Long GDX at 57.01( stop at 57.50). Long GLD at 147.14 on 6/29/11; stop 170 hit = gain 15.5% . Long KBX at 1.13 on 11/9/10. Long LODE at 2.85 on 1/21/11. Long UEXCF at 2.07 on 1/5/11. We will hold as our core position in NXG, CDE and KGC because in the longer term view these issues will head much higher. Holding CDE (average long at 27.7. Long cryxf at 1.82 on 2/5/08. KGC long at 6.07. Long NXG average of 2.26. For examples in how "Ord-Volume" works, visit www.ord-oracle.com.
http://www.decisionpoint.com/TAC/ORD.html
George.
SPY 5 min chart TY Axeled
The Ord Oracle By Tim Ord (08/25/11)_TY_George
* Wednesday, August 24, 2011
For 30 to 90 days horizons SPX: Flat
Monitoring purposes GOLD: Gold ETF GLD long at 147.14 on 6/29/11; stop hit at 170 = gain 15.5%.
Long Term Trend monitor purposes: Flat

The weekly RSI of the SPX came in near 30 at last week low and suggested the market was near at least a short term low. A bearish market setup will occur when the weekly RSI reaches back near the 50 range and will suggest the market is near the next high. Also there is resistance at the April 2010 high near 1220 range and may be where the market is heading. This sell signal setup occurred back mid 2008 (see in blue arrows on chart above). As far as timing goes, a lot of reversals come around the holiday period and the next holiday is Labor Day which is on Monday September 5. If the market can bounce into this holiday and the weekly RSI reaches near 50 and near the resistance level near 1220 level than a potential sell signal could develop. The weekly mid Bollinger bands have been a good trend finder for the SPX and right now the mid Bollinger band is heading lower and is why we are looking only the short side of the market for now. For now we will remain flat the SPX.

Yesterday we pointed out that a pull back in GDX should find support at the trend line which was jumped the previous day which came in near 61. Today, GDX fell through that trend and created a potential “Upthrust”. In general an “Upthrust” is a false break above a trend line. A close below the trend line suggests “if a market can’t hold the breakout it will attempt to take out the previous low”. In the current case the previous low comes at the August low near 54. That is why we put a stop on our GDX positions at 57.50 (long at 57.01). This potential pull back does not change the longer term bullish picture. The Slow Stochastics is in overbought position as well as the Chaikin Oscillator. We will look to get long again if our stop is touched, possibly near the 54 range. The bigger picture still suggests that the GDX will double or more over the next 12 months.

The top window is the monthly XAU/GLD ratio dating back to 1991 with the monthly XAU chart second window from the bottom. In bullish environment gold stocks will outperform gold and the XAU/GLD ratio will rise and in bearish environments GLD will out perform XAU and the ratio will fall. The speed of the rise and fall of this ratio give important clues to tops and bottoms in the XAU and is why the RSI of this ratio is important. The monthly charts carry more importance than the weekly and the weekly charts carry more importance than the daily charts. We are dealing with the monthly charts and therefore the most important chart for defining the trend. When the monthly RSI of the XAU/GLD ratio falls below 35 (current reading is 32.59) than decline is unsustainable and near a low. This occurrence has happen five times since 1991 (counting current reading) and proved to be accurate finding lows in XAU (see red arrows on RSI chart). This monthly RSI reading below 35 sets up the signal. The second part of the signal and the triggered is when the Slow Stochastics of the XAU/GLD ratio trades below 20 and than closes above 20 for buy signal. Since this method is on a monthly chart the soonest a buy signal will be triggered is September 1. The past signals of this type had duration of months and some have lasted over a year and we are expecting the current bullish setup once triggered, will last just as long. Gold stocks area historically cheap right now. Long BRD at 1.67 on 8/3/11. Long YNGFF .44 on 7/6/11. Sold on 8/8/11 SLV at 38.32 for gain of 11.4%-Long SLV at 34.39 on 7/5/11. Long EGI at 2.16, on 6/30/11. Long GDX at 57.01( stop at 57.50). Long GLD at 147.14 on 6/29/11; stop 170 hit = gain 15.5% . Long KBX at 1.13 on 11/9/10. Long LODE at 2.85 on 1/21/11. Long UEXCF at 2.07 on 1/5/11. We will hold as our core position in NXG, CDE and KGC because in the longer term view these issues will head much higher. Holding CDE (average long at 27.7. Long cryxf at 1.82 on 2/5/08. KGC long at 6.07. Long NXG average of 2.26. For examples in how "Ord-Volume" works, visit www.ord-oracle.com.
http://www.decisionpoint.com/TAC/ORD.html
George.
The Ord Oracle By Tim Ord (08/17/11)_TY_George
* Wednesday, August 17, 2011
For 30 to 90 days horizons SPX: Flat
Monitoring purposes GOLD: Gold ETF GLD long at 147.14 on 6/29/11; stop hit at 170 = gain 15.5%.
Long Term Trend monitor purposes: Flat

Above is the Cumulative NYSE Summation index with a 30 day moving average. Recently the Cumulative NYSE Summation index closed below its 30 day moving average and triggered a sell signal. We have circled in Red previous sell signals by this method. It’s a longer term signal and does a good job of catching the larger trend. This chart suggests the bigger trend has turned down.

Above is the daily QQQ chart. On August 3 the QQQ produced a “Sign of Weakness” Through support (near 54) and now the 54 range should act as resistance and it appears it is. If the QQQ is finding resistance here than SPY may also be affected and is the reason we are showing this chart. The bottom window is the TRINQ which had extreme readings which is a bullish sign and at least expects a short term low. The top window is the TICKQ and on August 11 it closed at +1312 and implies exhaustion for short term. What may happen here over the next couple of weeks is a backing and filling pattern that in the end will look like a “Rising Wedge” pattern. A “Rising Wedge” pattern is a bearish formation where the market makes modestly higher highs and higher lows and its boundary lines of the high and lows meet out into an apex and as the market works towards the apex the volume decreases. A lot of the time the “Rising Wedge” forms as the half way point of the next move down. Holiday’s a lot the time mark turning points in the Market (last high came on July 5 one day after July 4 holiday). Next holiday is Labour Day which is September 5, and could market the end of this consolidation phase. If the QQQ manages to pushes much past current levels than something else may be going on and would have to re-evaluate. The weekly mid Bollinger band has turned down and has done a good job of finding the bigger trend in the past. We could end up with a sell signal around the Labour day holiday We remain flat for now.

The top window is the monthly XAU/GLD ratio dating back to 1991 with the monthly XAU chart second window from the bottom. In bullish environment gold stocks will outperform gold and the XAU/GLD ratio will rise and in bearish environments GLD will out perform XAU and the ratio will fall. The speed of the rise and fall of this ratio also give important clues to tops and bottoms in the XAU and is why the RSI of this ratio is important. The monthly charts carry more importance than the weekly and the weekly charts carry more importance than the daily charts. We are dealing with the monthly charts and therefore the most important chart for defining the trend. When the monthly RSI is of the XAU/GLD ratio rises above 60 shows the rate of the advance is unsustainable and near a high. This condition help to find the highs in the XAU in mid 1993; mid 1996; early 2002; late 2006 and early 2006 and all proved to be actuate (see blue arrows on RSI chart). When the monthly RSI of the XAU/GLD ratio falls below 35 (current reading is 33.29) than decline is unsustainable and near a low. This occurrence has happen five times since 1991 (counting current reading) and proved to be just as accurate finding lows in XAU (see red arrows on RSI chart). This monthly RSI reading above 60 and below 35 sets up the signal. The second part of the signal and the triggered is that the Slow Stochastics of the XAU/GLD ratio trade above 80 and than close below 80 for sell signal. The buy signal, Slow Stochastics of the XAU/GLD must trade below 20 than close above 20. Again the RSI of the XAU/GLD ratio is below 35 (current reading is 33.29 setup) and Slow stochastics is below 20 (current reading 16.62) and a close above 20 will trigger the buy signal. Since this method is on a monthly chart the soonest a buy signal will be triggered is September 1. However our weekly charts have already gave a buy signal and the monthly buy signal will just confirm the weekly signal. The past signals of this type had duration of months and some have lasted over a year and we are expecting the current signal last just as long. Gold stocks area historically cheap right now. Long BRD at 1.67 on 8/3/11. Long YNGFF .44 on 7/6/11. Sold on 8/8/11 SLV at 38.32 for gain of 11.4%-Long SLV at 34.39 on 7/5/11. Long EGI at 2.16, on 6/30/11. Long GDX at 57.01. Long GLD at 147.14 on 6/29/11; stop 170 hit = gain 15.5% . Long KBX at 1.13 on 11/9/10. Long LODE at 2.85 on 1/21/11. Long UEXCF at 2.07 on 1/5/11. We will hold as our core position in NXG, CDE and KGC because in the longer term view these issues will head much higher. Holding CDE (average long at 27.7. Long cryxf at 1.82 on 2/5/08. KGC long at 6.07. Long NXG average of 2.26. For examples in how "Ord-Volume" works, visit www.ord-oracle.com.
http://www.decisionpoint.com/TAC/ORD.html
George.
The Ord Oracle By Tim Ord (08/10/11)_TY_George
* Wednesday, August 10, 2011
For 30 to 90 days horizons SPX: Flat
Monitoring purposes GOLD: Gold ETF GLD long at 147.14 on 6/29/11
Long Term Trend monitor purposes: Flat

The May high appears to have made a Head of a Head and Shoulder stop. The Neckline was broken on August 2 with a “Sign of Weakness” (big volume on Neckline break) and confirmed the Head and Shoulders bearish outlook. A 38.2% retracement from the bottom of March 2009 to top in May 2011 comes in near 1100 on SPX and 110 on SPY which was tested yesterday. Extreme ticks readings have marked the top and most likely the bottom. On July 1 a 1024 uptick close was recorded which implies an exhaustion move to the upside. The actual high came in on July 5 just a tad higher. On August 8 a 1324 downtick close was recorded which is an exhaustion move to the downside and implies a short term bottom. A lot of the time high volume lows will be tested on lighter volume before the retracement starts and that may be the case here which would imply a test of yesterday’s low on lighter volume. From yesterday’s market letter, the QQQ suggested there may not be much upside. It appears the market is forming a short term low near current levels however the upside may not be that much. The bigger trend is down (according to the TRIN/SPY ratio) and suggest wait and play the next sell signal instead of the current buy signal developing. We remain flat for now.

When the both TRIN/SPY ratio blue and red lines turns up then market turns down. We have identified with blue arrows when both the red and blue lines turned up. When both turn up it predicts an intermediate term bearish signal that can last several weeks if not several months. The Bollinger band on the SPY chart above is calibrated for a weekly timeframe. The weekly mid Bollinger band has done a good job of defining the trend over the years and recently it has also turned down. Short term bounce in the market is likely but the intermediate term trend remains down.

Above is the daily gold ETF GLD that was bought at 147.14. The run up over the last 30 days have pushed the RSI into the 80 levels which shows the market is extended short term. Doesn’t mean GLD can’t move higher, but is extended and vulnerable to a correction. Strong support lies near the previous high of 152 range as well as the 50 day moving average near 153. If GLD continue higher we will move our stop higher (currently at 170).
The bottom window is the Chaikin Oscillator and readings above 20m suggest an overbought condition. The current reading is near 3.5m and not overbought and would imply that GLD can still rally further.
Long BRD at 1.67 on 8/3/11. Long YNGFF .44 on 7/6/11. Sold on 8/8/11 SLV at 38.32 for gain of 11.4%-Long SLV at 34.39 on 7/5/11. Long EGI at 2.16, on 6/30/11. Long GDX at 57.01. Long GLD at 147.14 on 6/29/11; stop 170 . Long KBX at 1.13 on 11/9/10. Long LODE at 2.85 on 1/21/11. Long UEXCF at 2.07 on 1/5/11. We will hold as our core position in NXG, CDE and KGC because in the longer term view these issues will head much higher. Holding CDE (average long at 27.7. Long cryxf at 1.82 on 2/5/08. KGC long at 6.07. Long NXG average of 2.26. For examples in how "Ord-Volume" works, visit www.ord-oracle.com.
http://www.decisionpoint.com/TAC/ORD.html
George.
2 days
1 year
The Ord Oracle By Tim Ord (08/03/11)_TY_George
* Wednesday, August 3, 2011
For 30 to 90 days horizons SPX: Flat
Monitoring purposes GOLD: Gold ETF GLD long at 147.14 on 6/29/11
Long Term Trend monitor purposes: Flat

We showed this chart on Monday, but today’s chart goes back to 2007 top. On Monday’s we said, “The TICK/VIX ratio (bottom window) reached level where previous lows have formed in the past and a bullish short term sign.”. Since than the TICK/VIX ratio has pushed lower and remains in bullish territory and still suggests a bounce in the market is coming. We have identified with red line previous buy signals by this indicator going back to 2007 top. What we don’t know is how much the SPY will bounce. The window above the SPY chart is the VIX/TICK ratio and when it reaches near .5 a top in the market is not far off. Notice over the last couple of days the VIX/TICK ratio has moved up and is getting closer to the .5 bearish level which suggests the upside in spy may not be that much. For right now the TICK/VIX ratio is in bullish territory and the VIX/TICK ratio is not in the bearish level and suggests short term the market should move higher.

Above is an intermediate term view of the SPY dating back to 1997. The middle window is the SPY/TRIN ratio with two moving averages where the red line is slower than the blue line. When the Blue line crosses below the red line a sell signal is generated, this occurred near the May high. What comes next after this bearish crossover is an attempt of the blue line to rally. If the Blue line rally attempt is feeble, then the sell signal will remain intact. If the blue line rallies above the red line (which occurred in late 2005) than things will become more positive for the market. Currently the SPY/TRIN ratio is on an intermediate term sell signal.

Above is the daily GDX. On July 13 GDX jumped the previous high of late May with a “Sign of Strength” (high volume close above the previous high) which confirmed the breakout. A gap formed on the “Sign of Strength” day and gaps normally get tested. Normally when a gap is tested on lighter volume (which this one was) than the gap range in general should hold as support. At the June low the GDX/GLD hit a two year low which means that gold stocks are as the cheapest level in the last two years. On the current low the GDX/GLD ratio is almost to the June low and implies gold stocks are still at great value. The bottom window is the Slow Stochastics which as turned up and suggest the short term trend has turned back up. The trend is up on Silver, Gold and GDX of which we are long all three.
Long BRD at 1.67 on 8/3/11. Long YNGFF .44 on 7/6/11. Long SLV at 34.39 on 7/5/11. Long EGI at 2.16, on 6/30/11. Long GDX at 57.01. Long GLD at 147.14 on 6/29/11. Long KBX at 1.13 on 11/9/10. Long LODE at 2.85 on 1/21/11. Long UEXCF at 2.07 on 1/5/11. We will hold as our core position in NXG, CDE and KGC because in the longer term view these issues will head much higher. Holding CDE (average long at 27.7. Long cryxf at 1.82 on 2/5/08. KGC long at 6.07. Long NXG average of 2.26. For examples in how "Ord-Volume" works, visit www.ord-oracle.com.
http://www.decisionpoint.com/TAC/ORD.html
George.
The Ord Oracle By Tim Ord (07/27/11)_TY_George
* Wednesday, July 27, 2011
This chart is Tim Ord's SPY chart for 07/27/2011 not shown in his Public Post.

For 30 to 90 days horizons SPX: Flat.
Monitoring purposes GOLD: Gold ETF GLD long at 147.14 on 6/29/11
Long Term Trend monitor purposes: Flat

Today the Spy tested the gap level of July 19 on higher volume and suggests the gap has no support and will move down to the next support which is the July 18 low near 129.50 on the SPY. If the 129.50 is tested on lighter volume and the Ticks close below -500 with the TRIN close above +2.00 a possible low could form there. As large as decline was today the TRIN relatively did not respond, this implies there was little fear. For most lows to form in the market is that fear is present and the TRIN and Ticks readings show that fear and is reason we look at the TRIN and TICK closes. Today’s ticks close came in minus 1158 and is at extreme and a bullish sign. We will remain on the sidelines for now.

Today is the third day down in a row and the 5 day EMA of the ticks have pushed into a two year low and a bullish sign. Most lows of this type have the 5 day EMA of the TRIN close near 1.75 or higher to confirm the low and today’s close came in at 1.14 which is not confirming the ticks bullish readings. Ideally the TRIN should jump short term to get the bullish setup. Today the NYSE McClellan Oscillator closed at -74.81 and did not produce a positive divergence but is pushed to negative extremes. Ideally we would like to see the positive divergence at the lows. We have identified previous positive divergence on the McClellan Oscillator with red lines. We will remain flat for now.

Above is the daily GDX. On July 13 GDX jumped the previous high of late May with a “Sign of Strength” (high volume close above the previous high) which confirmed the breakout. A gap formed on the “Sign of Strength” day and gaps normally get tested. If the test comes on lighter volume than the gap area should hold as support and is appears the gap will be tested on lighter volume and suggest the 58-57 range will hold as support. The trend is up on Silver, Gold and GDX of which we are long all three.
Long YNGFF .44 on 7/6/11. Long SLV at 34.39 on 7/5/11. Long EGI at 2.16, on 6/30/11. Long GDX at 57.01. Long GLD at 147.14 on 6/29/11. Long KBX at 1.13 on 11/9/10. Long LODE at 2.85 on 1/21/11. Long UEXCF at 2.07 on 1/5/11. We will hold as our core position in NXG, CDE and KGC because in the longer term view these issues will head much higher. Holding CDE (average long at 27.7. Long KRY at 1.82 on 2/5/08. KGC long at 6.07. Long NXG average of 2.26. For examples in how "Ord-Volume" works, visit www.ord-oracle.com.
http://www.decisionpoint.com/TAC/ORD.html
George.
The Ord Oracle By Tim Ord (07/20/11)_TY_George
* Wednesday, July 20, 2011
For 30 to 90 days horizons SPX: Flat.
Monitoring purposes GOLD: Gold ETF GLD long at 147.14 on 6/29/11
Long Term Trend monitor purposes: Flat

Above is the daily SPY with the Bollinger bands calibrated for the weekly time frame. The weekly mid Bollinger band defines the trend of the market which is going sideways. The last three day rally showed decreasing volume and suggests upside momentum is weakening or that traders are waiting on the decision on the Debt ceiling by our government decision makers. There is a gap above the SPY near 133 which is resistance and gap below near 131 whish is support which is our best guess for a pull back. The ticks and TRIN did not say much today and no new information there. We will remain on the sidelines for now.

The last several days the VIX/TRIN ratio (Bottom window) has not lined up for a low. However, its now approaching the level where the mid June low formed which is near .05. This indicator is not perfect as a false signal was given in late January. Not all indicator work all the time but looking back several years this indicator has a good record. This indicator implies that the “backing and filling” for the last several days may not be complete. The Bollinger bands on the SPY chart above is calibrated for the weekly time frame and we use the weekly mid Bollinger band to define the trend of the market. It’s a little hard to see but the weekly mid Bollinger band is trending sideways and suggests the trend is sideways for now. We will remain flat for now.

Above is a review of the intermediate term signal for GDX buy signal which occurred early July. The top window is the weekly RSI of the GDX/GLD ratio. A close below 30 on the weekly time frame sets up the bullish signal which occurred on 7/1/11. The bottom window is the slow Stochastics %K (60) of the GDX/GLD ratio. A bullish intermediate term signal is produced when the Slow Stochastics closes above 20 which was triggered in early July. This type of signal is rare in that it has appeared only three times before since the 2000 bottom (which was one of the signals). When this signal is triggered it last a minimum of 6 months to as long at one year. Therefore we are expecting the current rally to last in February 2012 to as late as July 2012. The trend is up on Silver, Gold and GDX of which we are long all three.
Long YNGFF .44 on 7/6/11. Long SLV at 34.39 on 7/5/11. Long EGI at 2.16, on 6/30/11. Long GDX at 57.01. Long GLD at 147.14 on 6/29/11. Long KBX at 1.13 on 11/9/10. Long LODE at 2.85 on 1/21/11. Long UEXCF at 2.07 on 1/5/11. We will hold as our core position in NXG, CDE and KGC because in the longer term view these issues will head much higher. Holding CDE (average long at 27.7. Long KRY at 1.82 on 2/5/08. KGC long at 6.07. Long NXG average of 2.26. For examples in how "Ord-Volume" works, visit www.ord-oracle.com.
http://www.decisionpoint.com/TAC/ORD.html
George.
The Ord Oracle By Tim Ord (07/13/11)_TY_George
* Wednesday, July 13, 2011
For 30 to 90 days horizons SPX: Flat.
Monitoring purposes GOLD: Gold ETF GLD long at 147.14 on 6/29/11
Long Term Trend monitor purposes: Flat
Above is the daily SPX with the Bollinger bands calibrated for the weekly time frame and right now the SPX is setting near the mid Bollinger ban support level. Below the SPX chart is the 5 day average of the ticks. Bottoms normally form in the SPX when the 5day ticks reach near -250 and the current reading is 89 (see red arrows). The window below the ticks is the 5 day TRIN. When the 5 day TRIN reaches near 1.75 and above, a bottom in the market is not far off and today’s reading came in at 1.78. What we are looking for, for short term bullish signal is for the tick to respond more negatively and push the 5 day ticks nearer to -250 to show that traders have exited the market which is usually the condition that help form lows in the market. Market may bottom here but at the moment we don’t have the ticks at an ideal level. Market tried to rally today but closed off from the highs and may suggest yesterday’s low may be tested. Staying flat for now.

The VIX/TRIN ratio (Bottom window) is not lining up for a low here. Normally readings above .07 can produce short term tops in the SPX and today’s reading is coming in over .08. This indicator is not perfect as a false signal was given in late January, however in general it does a good job and suggests that we wait a bit longer. We will remain flat for now.

Slow Stochastics closes above 20 in Late June and triggers bullish sign. The Bullish Percent index has a bullish crossover of its 8 day moving average in early July and bullish sign. The GDX/GLD ratio closes above red downtrend line and bullish sign. Today GDX jumped above the previous high of late May near 57.50 with a Sign of Strength and confirms the uptrend. Today’s gap up should now be support on any pull back which comes in near the 57.50 range. The trend is up on Silver, Gold and GDX of which we are long all three.
Long YNGFF .44 on 7/6/11. Long SLV at 34.39 on 7/5/11. Long EGI at 2.16, on 6/30/11. Long GDX at 57.01. Long GLD at 147.14 on 6/29/11. Long KBX at 1.13 on 11/9/10. Long LODE at 2.85 on 1/21/11. Long UEXCF at 2.07 on 1/5/11. We will hold as our core position in NXG, CDE and KGC because in the longer term view these issues will head much higher. Holding CDE (average long at 27.7. Long KRY at 1.82 on 2/5/08. KGC long at 6.07. Long NXG average of 2.26. For examples in how "Ord-Volume" works, visit www.ord-oracle.com.
http://www.decisionpoint.com/TAC/ORD.html
George.
The Ord Oracle By Tim Ord (07/06/11)_TY_George
* Wednesday, July 6, 2011
For 30 to 90 days horizons SPX: Flat.
Monitoring purposes GOLD: Gold ETF GLD long at 147.14 on 6/29/11
Long Term Trend monitor purposes: Flat

Above is the daily SPY with the Bollinger bands calibrated for the weekly timeframe. Last week the SPY pushed through the mid Bollinger band and turned it up which is a bullish sign. The mid Bollinger Band may act as support on any pull back which comes in near 131 range. The bottom window is the Chaikin Oscillator and readings above 200m have created pull backs in the SPY before like the February and May highs. We are looking for a pull back short term that may find support near 131 range. A lot of the time the TRIN will reach above 2.00 when Support is approached and will be looking for that as evidence as a low is nearing. Because the weekly Mid Bollinger band has turned up it puts the S&P back into an uptrend. Looking for a more consolidation short term.

The Trin/Tick ratio reached extreme level of .01 last week which is rare. Previous times it has reached this level the market stalled and consolidated. The Bollinger band on the hourly S&P chart is calibrated for the weekly timeframe. It’s a little hard to tell but the SPY did close above the mid Bollinger band and suggests the trend has turned back up. The Mid Bollinger band may act as support on a pull back which comes in near 131.5 on the SPY and 1315 area on the SPX. Normally the TRIN will rise to +2.00 or higher at support levels and one of the things we will be looking for. We will remain flat for now.

Above is the GDX chart with its McClellan Summation index and a 20 day EMA. Yesterday the GDX Summation index closed above the 20 day EMA and triggered a buy signal by this method and supports the other buy signals we have mentioned in our report over the last several days. These other buy signals are the Bullish Percent index for the Gold Miners which had a bullish crossover; the Slow Stochastics %K (144) which has reached extreme oversold below 20 and has turned up; the GDX/GLD ratio with a close above the downtrend line and triggered a bullish sign. On the GDX chart above, the price has been hovering near Neckline support for the last couple of months and appears that support level will hold which came in near 53. Today we bought YNGFF at .44 (Yukon Nevada Gold). Long YNGFF .44 on 7/6/11. Long SLV at 34.39 on 7/5/11. Long EGI at 2.16, on 6/30/11. Long GDX at 57.01. Long GLD at 147.14 on 6/29/11. Long KBX at 1.13 on 11/9/10. Long LODE at 2.85 on 1/21/11. Long UEXCF at 2.07 on 1/5/11. We will hold as our core position in NXG, CDE and KGC because in the longer term view these issues will head much higher. Holding CDE (average long at 27.7. Long KRY at 1.82 on 2/5/08. KGC long at 6.07. Long NXG average of 2.26. For examples in how "Ord-Volume" works, visit www.ord-oracle.com.
http://www.decisionpoint.com/TAC/ORD.html
George.
The Ord Oracle By Tim Ord (06/29/11)_TY_George
* Wednesday, June 29, 2011
For 30 to 90 days horizons SPX: Flat.
Monitoring purposes GOLD: Gold ETF GLD long at 147.14 on 6/29/11
Long Term Trend monitor purposes: Flat

Above is the weekly SPX with the weekly Bollinger bands dating back to late 2005. In general the weekly mid Bollinger bands does a good job finding the direction of the market and right now its trending down. The weekly mid Bollinger band can act as resistance (like in July 2006 and July 2010). Right now the SPX is bumping up against the weekly mid Bollinger band and could find resistance. This weekend is the fourth of July Holiday and a lot of the time volume drops off going into a holiday as traders take off early. When volume drops off in a rising market it tends to form “Rising Wedges” and vice versa for a declining market. “Rising Wedges” have downside target to where they began and if the current pattern is a “Rising Wedge” than a pull back to 1260 range is possible. We ultimately would like to see the May high tested as that would turn the weekly Mid Bollinger bands at least sideway if not up and keep the bigger trend bullish. Since volume likely will be dropping into Friday and the SPX is bumping into resistance we will stay flat for now.

The weekly Mid Bollinger band is heading lower and is the first resistance area on the S&P which is being bumped against now. The 20 day moving average of the ticks are remaining in oversold level and not running up with the S&P’s. The low in October 08 and June 2010 had similar ticks setups that lead to double lows in the S&P and supports the possibility of a “Rising Wedge” pattern we noted above. Likely the volume will drop tomorrow and Friday as traders leave early for the July 4 holiday. We are still expecting a bounce to relieve the oversold tick readings but a pull back to 1260 is possible first. We will remain flat for now.

Above is the daily GDX chart which presents a shorter term view. The bottom window up is the Bullish Percent index for the Gold Miners and it appears a bullish crossover buy signal was triggered yesterday. With today’s rally in GDX the Bullish percent index (which updates later tonight) will exceed today’s bullish crossover. The next window up is the Slow Stochastics %K (144) which has reached extreme oversold below 20 and a close above 20 would be a bullish sign. Next window up is the GDX/GLD ratio with a close above the blue downtrend line and triggered a bullish sign. To indicators above have triggered bullish signs and the third (slow Stochastics) is very near triggering a bullish signal. On the GDX chart, the price has been hovering near Neckline support for the last couple of months and appears that support level will hold. Long GDX at 57.01. Long GLD at 147.14 on 6/29/11. Sold CGR at 2.18 on 3/10/11= gain 75%. Long CGR at 1.24 on 5/11/09. Long MNEAF 2.80 on 3/3/11 (sold 2.95 gain 5%). Long on US Silver (ussif) at .62 on 2/17/11(sold 4/18/11 at .74 for 19% gain). We are long GLD at 134.43 (stop 145). The smaller gold stocks should outperform the larger gold stocks. Long LODE at 2.85 on 1/21/11. Long UEXCF at 2.07 on 1/5/11. Sold AVARF on 12/13/10 at 4.06 for 61.1% gain; Long AVARF at 2.52 on 4/26/10. Sold VGZ at 2.93 for 39% gain. We are long MFN at 9.83 on 11/11/10 (sold 16.25 for 65% gain). Long KBX at 1.13 on 11/9/10. Sold RDNAF at .57 on 1/19/11 for 27% gain; Long RDNAF at .45 on 10/29/10. Long IROG at .52 on 5/10/10. Long PMU at .20 on 4/6/10( sold 10% gain). We will hold as our core position in NXG, CDE and KGC because in the longer term view these issues will head much higher. Holding CDE (average long at 27.7. Long KRY at 1.82 on 2/5/08. KGC long at 6.07. Long NXG average of 2.26. For examples in how "Ord-Volume" works, visit www.ord-oracle.com.
http://www.decisionpoint.com/TAC/ORD.html
George.
The Ord Oracle By Tim Ord (06/23/11) TY George
* Thursday, June 23, 2011
For 30 to 90 days horizons for SPX: Flat.
Monitoring purposes Gold: Gold ETF GLD long at 134.43 on 12/17/10, stopped at 145 for 7.4% gain.
Long Term Trend monitor purposes: Flat

The Bollinger bands for the SPY are calibrated for a weekly timeframe in the chart above. In general when the weekly mid Bollinger band is trend down (currently weekly mid Bollinger band is trending down) then the ticks reach to a more oversold lower level both on the 50 day EMA and the 20 day MA (blue horizontal lines). When the ticks reach this lower level than a bounce is likely, even in a down market (as defined by the weekly mid Bollinger band). The weekly mid Bollinger band will be the first resistance level which comes in near 1320. It would be unusual for the decline to continue with the ticks already in extreme territory and still suggests some sort of low is forming here. Monday did have a 90% up day which is when 90% of the volume went to the up stocks and is what you normally see at the beginning of a rally. We would have expected the 1280 range to hold as support and to our surprise it did, the SPX closed at 1283.50, however our stop at 1270 was hit and we are back on the sidelines.

The intermediate term stick indicator remains in bullish territory and suggests a low is forming here. Today’s big volume suggests a possible “Selling Climax” occurred and similar to the day back in late January (see chart). When Volume jumps over 30% compared to the days around it, its suggests a “Selling Climax” day and a bullish sign short term. The Equity Put/Call ratio is still in bullish territory and the news surrounding FOMC meeting may have had its effect on the market short term. Today’s TRIN closed at 1.36 which is on the side of bullish neutral and not giving a lot of information. We will see how tomorrow trades but the bigger picture remains bullish.

GLD may have formed a “Rising Wedge” pattern over the last couple of months. Rising Wedge pattern have targets back to where the pattern began and in this case a move back near 144 range. Today’s decline on GLD looks like a “Break away” gap and suggest the decline will continue. If gold continues the pull back and GDX hold stead over the next couple of weeks or so then the GDX/GLD ratio will start to rising and suggests a strong move in GDX may be beginning. We will be watching this condition closely. We are long GDX on 5/10/11 at 57.01.
Sold CGR at 2.18 on 3/10/11= gain 75%. Long CGR at 1.24 on 5/11/09. Long MNEAF 2.80 on 3/3/11(sold 2.95 gain 5). Long on US Silver (ussif) at .62 on 2/17/11 (sold 4/18/11 at .74 for 19% gain). We are long GLD at 134.43(stopped 145 for 7.4% gain). The smaller gold stocks should outperform the larger gold stocks. Long LODE at 2.85 on 1/21/11. Long UEXCF at 2.07 on 1/5/11. Sold AVARF on 12/13/10 at 4.06 for 61.1% gain; Long AVARF at 2.52 on 4/26/10. Sold VGZ at 2.93 for 39% gain. We are long MFN at 9.83 on 11/11/10(sold 16.25 for 65% gain). Long KBX at 1.13 on 11/9/10. Sold RDNAF at .57 on 1/19/11 for 27% gain; Long RDNAF at .45 on 10/29/10. Long IROG at .52 on 5/10/10. Long PMU at .20 on 4/6/10 (sold 10% gain). We will hold as our core position in NXG, CDE and KGC because in the longer term view these issues will head much higher. Holding CDE (average long at 27.7. Long KRY at 1.82 on 2/5/08. KGC long at 6.07. Long NXG average of 2.26. For examples in how "Ord-Volume" works, visit www.ord-oracle.com.
http://www.decisionpoint.com/TAC/ORD.html
George.
The Ord Oracle By Tim Ord (06/15/11) TY George
* Wednesday, June 15, 2011
For 30 to 90 days horizons SPX: FLAT
Monitoring purposes GOLD: Gold ETF GLD long at 134.43 on 12/17/10, stopped at 145 for 7.4% gain.
Long Term Trend monitor purposes: Flat

On Last Wednesday report we said, “The one we pay attention to is the 20 day EMA (second window from Bottom). When the weekly mid Bollinger Band is trending down (Red arrows on SPY chart) then the ticks reach more to an oversold level near 75 before a rally starts. We have identified with red arrows when the weekly mid Bollinger band is trending down and when the ticks bottomed out (again near 75). Over the last couple of days the mid weekly Bollinger band has turned down and suggests the 20 day EMA of the ticks may reach near 75 level before a bounce in the market may start.” Today the 20 day EMA of the ticks reached 17 and in the area where previous lows have formed in the past when the Mid Bollinger Band is trending down. We have observed in the past that it is common that signals in the market are either triggered on Tuesday or Friday’s. Tomorrow or Friday could be an important time for a signal. For now we will stay flat.

We are getting a response from the VIX which is the first response since the decline began. Today the VIX closed outside of the Bollinger band and shows the market is in an exhaustion mode. A close back inside of the Bollinger Band would be a bullish sign and will have to wait for tomorrow to see if that happens. The 5 day average of Equity put/call ratio has reached the level last recorded at the May 2010 low. The 5 day average of the ticks also reached at the level last seen at the May 2010 low and suggests an intermediate term low is forming. Staying flat for now.

The biggest rallies in GDX occurred when the weekly RSI of the GDX/GLD ratio was below 30 (this condition occurred at the 2000 and 2008 bottoms). Right now the RSI sets at 31.90 which is near the bullish level and suggest an intermediate rally is not far off. RSI Readings of 30 and below have produced the strongest rally. The bottom window is the Slow Stochastics %K (60) %D(3). When the Slow Stochastics closes above 20 a bullish signal will be triggered. Current reading on Stochastics is 11.19 and very oversold and suggest there is little downside from current levels on GDX. This potential bullish signal could develop this month. The intermediate picture is nearing a bullish signal. Long GDX at 57.01.
Sold CGR at 2.18 on 3/10/11= gain 75%. Long CGR at 1.24 on 5/11/09. Long MNEAF 2.80 on 3/3/11 (sold 2.95 gain 5%). Long on US Silver (ussif) at .62 on 2/17/11(sold 4/18/11 at .74 for 19% gain). We are long GLD at 134.43 (stop 145). The smaller gold stocks should outperform the larger gold stocks. Long LODE at 2.85 on 1/21/11. Long UEXCF at 2.07 on 1/5/11. Sold AVARF on 12/13/10 at 4.06 for 61.1% gain; Long AVARF at 2.52 on 4/26/10. Sold VGZ at 2.93 for 39% gain. We are long MFN at 9.83 on 11/11/10 (sold 16.25 for 65% gain). Long KBX at 1.13 on 11/9/10. Sold RDNAF at .57 on 1/19/11 for 27% gain; Long RDNAF at .45 on 10/29/10. Long IROG at .52 on 5/10/10. Long PMU at .20 on 4/6/10( sold 10% gain). We will hold as our core position in NXG, CDE and KGC because in the longer term view these issues will head much higher. Holding CDE (average long at 27.7. Long KRY at 1.82 on 2/5/08. KGC long at 6.07. Long NXG average of 2.26. For examples in how "Ord-Volume" works, visit www.ord-oracle.com.
http://www.decisionpoint.com/TAC/ORD.html
George.
"The Ord Oracle" By Tim Ord (06/08/11) TY George
* Wednesday, June 8, 2011
For 30 to 90 days horizons SPX: FLAT
Monitoring purposes GOLD: Gold ETF GLD long at 134.43 on 12/17/10, stopped at 145 for 7.4% gain.
Long Term Trend monitor purposes: Flat

Above is our moving average tick chart. The one we pay attention to is the 20 day EMA (third window from Bottom). When the weekly mid Bollinger Band is trending down (Red arrows on SPY chart) then the ticks reach more to an oversold level near 75 before a rally starts. We have identified with blue arrows when the weekly mid Bollinger band is trending down and when the ticks bottomed out (again near 75). Over the last couple of days the mid weekly Bollinger band has turned down and suggests the 20 day EMA of the ticks may reach near 75 level before a bounce in the market may start. Current close today came in at 91.76 and nearing the bullish level. Also the market is at the lower Bollinger band which has provided support in the past. The Character off the market has changed since the mid Bollinger band has turned down and suggests the rules for a trading range or down market are in force.

Top window is the hourly SPY with the weekly Bollinger bands, second window down is hourly TICK/TRIN ratio and third window down is hour TRIN/TICK ratio. The TICK/TRIN ratio has been good at picking lows and the TRIN/TICK ratio has been good and picking highs. Readings near .006 and higher for the TRIN/TICK ratio have shown that a high is near and over the last couple of months this ratio has been in that level and warning the uptrend may be coming to an end. Over the last few days the TRIN/TICK ratio has backed of the bearish level and suggests the market may attempt a rally. We like to trade with the trend of the market which for us is the direction of the mid weekly Bollinger band which recently has turned down. Resistance now is the weekly mid Bollinger band near 1315 range and the market may find resistance there and could develop a sell signal near that level. The TICK/TRIN has not turned up which would be a bullish sign. Staying flat for now.

On Monday’s report we said, “In our opinion the most bullish development would be for GDX decline short term and which would push the RSI of the GDX/GLD ratio to 30 or below.” We are getting that decline right now. The biggest rallies in GDX occurred when the weekly RSI of the GDX/GLD ratio was below 30 (this condition occurred at the 2000 and 2008 bottoms). Right now the RSI sets at 31.57 which is interring the bullish level and suggest an intermediate rally is not far off. RSI Readings of 30 and below have produced the strongest rally. The bottom window is the Slow Stochastics %K (60) %D(3). When the Slow Stochastics closes above 20 a bullish signal will be triggered. This potential bullish signal could develop this month. The intermediate picture is nearing a bullish signal. Long GDX at 57.01.
Sold CGR at 2.18 on 3/10/11= gain 75%. Long CGR at 1.24 on 5/11/09. Long MNEAF 2.80 on 3/3/11 (sold 2.95 gain 5%). Long on US Silver (ussif) at .62 on 2/17/11(sold 4/18/11 at .74 for 19% gain). We are long GLD at 134.43 (stop 145). The smaller gold stocks should outperform the larger gold stocks. Long LODE at 2.85 on 1/21/11. Long UEXCF at 2.07 on 1/5/11. Sold AVARF on 12/13/10 at 4.06 for 61.1% gain; Long AVARF at 2.52 on 4/26/10. Sold VGZ at 2.93 for 39% gain. We are long MFN at 9.83 on 11/11/10 (sold 16.25 for 65% gain). Long KBX at 1.13 on 11/9/10. Sold RDNAF at .57 on 1/19/11 for 27% gain; Long RDNAF at .45 on 10/29/10. Long IROG at .52 on 5/10/10. Long PMU at .20 on 4/6/10( sold 10% gain). We will hold as our core position in NXG, CDE and KGC because in the longer term view these issues will head much higher. Holding CDE (average long at 27.7. Long KRY at 1.82 on 2/5/08. KGC long at 6.07. Long NXG average of 2.26. For examples in how "Ord-Volume" works, visit www.ord-oracle.com.
http://www.decisionpoint.com/TAC/ORD.html
George.
"The Ord Oracle" By Tim Ord (06/01/11) TY George
* Wednesday, June 1, 2011
For 30 to 90 days horizons SPX: Long SPX on 5/24/11 at 1321.39 stopped 1329 = gain .6%.
Monitoring purposes GOLD: Gold ETF GLD long at 134.43 on 12/17/10, stopped at 145 for 7.4% gain.
Long Term Trend monitor purposes: Flat

According to www.CBOE.com, the ticks closed at -536 and the TRIN closed at 4.52 and suggests the market is making a low. The odds favor a low is near when both the Ticks close < -500 and the Trin Close > 2.50 on the same day. The low in the market usually will appear on the same day as these readings occur (today) or as late as two days later (Friday). We noticed yesterday trading tested the minor previous high of mid May on higher volume and suggests at some point that high will be exceeded and a bullish sign. We may be going long tomorrow and if we do will send out an intraday message. On our previous trade, we were long at 1321.39 with a stop at 1329 which was hit today for a .56% gain.

Above is the daily GDX chart. Bottom window is the Slow Stochastic which has turned up from oversold level below 20 and a bullish sign. Next window up is the bullish percent index which had a bullish crossover triggering a buy signal for this indicator. Next window up is the GDX/GLD ratio which reached .38 and shows gold stocks are cheap relative to gold and also a bullish sign. The last low in GDX found support at the Neckline of a Head and Shoulders bottom near 53 which is our worst case scenario. However there could be a small Head and Shoulders pattern forming where the Head is the May low and the Right Shoulder could be forming now and find support near 56. We will monitor possibility near term.

Above is the weekly GLD dating back to late 2001. The red lines above the GLD chart is when the weekly RSI reached above 70 and the blue line when the weekly RSI fell back near 50 after reaching above 70 first. Since the low back in 2000 on GLD, after the weekly RSI of GLD reached above 70, it fell back to the 50 range to signal the next low. The weekly RSI currently is 68.43 and we would expect the RSI to fall back near 50 again before the next rally phase begins again. Since the low in 2008, GLD has found support at the weekly 34 moving average which currently comes in near 140 range and if the 140 range is achieved and the weekly RSI is near 50 then would expect a respected low to form. GDX could test the recent low near 53 again but then rally to new highs after. Long GDX at 57.01.
Sold CGR at 2.18 on 3/10/11= gain 75%. Long CGR at 1.24 on 5/11/09. Long MNEAF 2.80 on 3/3/11 (sold 2.95 gain 5%). Long on US Silver (ussif) at .62 on 2/17/11(sold 4/18/11 at .74 for 19% gain). We are long GLD at 134.43 (stop 145). The smaller gold stocks should outperform the larger gold stocks. Long LODE at 2.85 on 1/21/11. Long UEXCF at 2.07 on 1/5/11. Sold AVARF on 12/13/10 at 4.06 for 61.1% gain; Long AVARF at 2.52 on 4/26/10. Sold VGZ at 2.93 for 39% gain. We are long MFN at 9.83 on 11/11/10 (sold 16.25 for 65% gain). Long KBX at 1.13 on 11/9/10. Sold RDNAF at .57 on 1/19/11 for 27% gain; Long RDNAF at .45 on 10/29/10. Long IROG at .52 on 5/10/10. Long PMU at .20 on 4/6/10( sold 10% gain). We will hold as our core position in NXG, CDE and KGC because in the longer term view these issues will head much higher. Holding CDE (average long at 27.7. Long KRY at 1.82 on 2/5/08. KGC long at 6.07. Long NXG average of 2.26. For examples in how "Ord-Volume" works, visit www.ord-oracle.com.
http://www.decisionpoint.com/TAC/ORD.html
George.
The Ord Oracle By Tim Ord (05/25/11) TY George
* Wednesday, May 25, 2011
For 30 to 90 days horizons SPX: Long SPX on 5/24/11 at 1321.39 stop 1300.
Monitoring purposes GOLD: Gold ETF GLD long at 134.43 on 12/17/10, stopped at 145 for 7.4% gain.
Long Term Trend monitor purposes: Flat

Monday the TRIN closed at 2.36 (2.50 > is bullish) and Ticks closed at -423 and bullish and along with the 5 day average of the Equity put/Call ratio above .65 suggested a bullish sign near term. Today’s Advance/ Decline line showed near twice as many stocks advance as decline and has turned up the NYSE McClellan Oscillator which is also bullish. We are long yesterday on the SPX at 1321.39 and putting a top at 1300.

The above chart is the of Commitments of Traders for Gold report updated May 20, 2011. Over the last twelve months when the Commercials has reached near this level then Gold was not far from a low. This more evidence that gold and gold stocks are nearing a low.

Above is the weekly GDX/GLD ratio with GDX in foreground dating back to late 1999. The weekly RSI of the GDX/GLD ratio is in the upper window. When the RSI of this ratio falls to near 30 an important low in GDX was near. Form observation, it appears when the RSI of this ratio falls below 30 then a very powerful rally is beginning which occurred in late 2000 and again in late 2008. The recent low in the RSI hit near 34 but it would be more bullish for the intermediate term for gold stocks if GDX would push lower in the next couple of weeks and push the RSI down closer to 30 as that has produced stronger rallies as when the RSI stayed near mid 30’s. Its rare (happen 5 times in the last 11 years) for the RSI of this ratio to get near 30 and all have lead to worthwhile rallies. The bottom window is the weekly Slow stochastics (60) period of the GDX/GLD ratio. Current reading is 12.65 and in the oversold level below 20 and also suggests GDX is near an important low for the intermediate term. Over the last 11 years Slow Stochastics as been this low four other times and once it closed above 20 an intermediate term rally began. Sentiment readings are also bullish here and suggest GDX is near an important level. Seasonality wise May and June show modest weakness and GDX could back and fill a few weeks before moving higher. The recent pull back in GDX near Neckline support at 53 held and we would like to see that tested again as the weekly RSI of GDX/GLD ratio could push closer to 30 and create a more bullish signal. An intermediate term rally in GDX is nor far from beginning (could be triggered in June) that should take us to new highs. Long GDX at 57.01.
Sold CGR at 2.18 on 3/10/11= gain 75%. Long CGR at 1.24 on 5/11/09. Long MNEAF 2.80 on 3/3/11 (sold 2.95 gain 5%). Long on US Silver (ussif) at .62 on 2/17/11(sold 4/18/11 at .74 for 19% gain). We are long GLD at 134.43 (stop 145). The smaller gold stocks should outperform the larger gold stocks. Long LODE at 2.85 on 1/21/11. Long UEXCF at 2.07 on 1/5/11. Sold AVARF on 12/13/10 at 4.06 for 61.1% gain; Long AVARF at 2.52 on 4/26/10. Sold VGZ at 2.93 for 39% gain. We are long MFN at 9.83 on 11/11/10 (sold 16.25 for 65% gain). Long KBX at 1.13 on 11/9/10. Sold RDNAF at .57 on 1/19/11 for 27% gain; Long RDNAF at .45 on 10/29/10. Long IROG at .52 on 5/10/10. Long PMU at .20 on 4/6/10( sold 10% gain). We will hold as our core position in NXG, CDE and KGC because in the longer term view these issues will head much higher. Holding CDE (average long at 27.7. Long KRY at 1.82 on 2/5/08. KGC long at 6.07. Long NXG average of 2.26. For examples in how "Ord-Volume" works, visit www.ord-oracle.com.
http://www.decisionpoint.com/TAC/ORD.html
George.
The Ord Oracle By Tim Ord (05/18/11) TY George
* Wednesday, May 18, 2011
For 30 to 90 days horizons SPX: Neutral
Monitoring purposes GOLD: Gold ETF GLD long at 134.43 on 12/17/10, stopped at 145 for 7.4% gain.
Long Term Trend monitor purposes: Flat

Above is the SPY with the 5 day average of the equity Put/Call ratio in the top window. Previous lows have formed when this ratio reached above .65 and today’s high reached .76 and a short term bullish sign. Yesterday the gap on 4/20 was tested on higher volume and suggests at some point yesterday’s low will be at least tested again. If the test of yesterday’s low comes on lighter volume then that would be a bullish sign and if on higher volume then that would be bearish sign. Yesterday’s gap test on higher volume suggests the market may start backing and filling in the weeks to come. Last Wednesday the TRIN closed at 2.25 and normally the low in the market is seen at latest two days later and suggested the low should have been Friday. However, Option Expiration week can push these indicators off a day or so and the low may have come yesterday. The higher the TRIN close above 2.50 the stronger the rally thereafter. Last Wednesday TRIN reading of 2.25 suggests a weaker then normally rally. This is option expiration week which normally has a bullish bias and likely to hold up the rest of the week.

The above chart is the NYSE with the Cumulative NYSE McClellan Summation index which helps to identify the larger trend. We have marked with red arrows when the Cumulative NYSE McClellan Summation index Crossed below it 25 period moving average which generates and intermediate term sell signal. According to this indicator, the trend remains up. This indicator has a lag both on the buy and sells so the signal for a high will come after the top has been seen. Notice over the last couple of months the market is showing more choppiness similar to late 2009 where a reaction took place. There is an old adage that says “Sell in May and go away”. Also the last buy signal we got last week was not as strong as the March and April buy signals as the TRIN did not reach above 2.50 at the low. The higher the TRIN close above 2.50 the more bullish the signal and the last signal came with a TRIN close of 2.25. Right now the trend is up but it appears the uptrend is weakening.

Above is the GDX/GLD ratio with GDX behind this ratio dating back to late 1999 with the RSI of this ratio in the upper window. When the RSI of this ratio falls to near 30 an important low in GDX was near. It also appears that RSI readings nearer to 30 and below produced stronger rallies in GDX. For this examples look at the late 2000 RSI and late 2008 RSI as both where below 30 and after very strong GDX rallies where produced. GDX is also near support at the Neckline of a Head and Shoulders bottom with the RSI near 30 and the GDX/GLD ratio at previous support levels suggesting GDX may be near an important level. Its rare (happen 5 times in the last 11 years) for the RSI of this ratio to get near 30 and its happening again right now. Sentiment readings are also bullish here and suggest GDX is near an important level. Seasonality wise May and June show modest weakness and GDX could back and fill a few weeks before moving higher. Long GDX at 57.01.
Sold CGR at 2.18 on 3/10/11= gain 75%. Long CGR at 1.24 on 5/11/09. Long MNEAF 2.80 on 3/3/11 (sold 2.95 gain 5%). Long on US Silver (ussif) at .62 on 2/17/11(sold 4/18/11 at .74 for 19% gain). We are long GLD at 134.43 (stop 145). The smaller gold stocks should outperform the larger gold stocks. Long LODE at 2.85 on 1/21/11. Long UEXCF at 2.07 on 1/5/11. Sold AVARF on 12/13/10 at 4.06 for 61.1% gain; Long AVARF at 2.52 on 4/26/10. Sold VGZ at 2.93 for 39% gain. We are long MFN at 9.83 on 11/11/10 (sold 16.25 for 65% gain). Long KBX at 1.13 on 11/9/10. Sold RDNAF at .57 on 1/19/11 for 27% gain; Long RDNAF at .45 on 10/29/10. Long IROG at .52 on 5/10/10. Long PMU at .20 on 4/6/10( sold 10% gain). We will hold as our core position in NXG, CDE and KGC because in the longer term view these issues will head much higher. Holding CDE (average long at 27.7. Long KRY at 1.82 on 2/5/08. KGC long at 6.07. Long NXG average of 2.26. For examples in how "Ord-Volume" works, visit www.ord-oracle.com.
http://www.decisionpoint.com/TAC/ORD.html
George.
The Ord Oracle By Tim Ord (05/11/11) TY George
* Wednesday, May 11, 2011
For 30 to 90 days horizons SPX: Long 1312.62 on 4/19/11, Sold 5/5/11 at 1335.10 = 1.7% gain.
Monitoring purposes GOLD: Gold ETF GLD long at 134.43 on 12/17/10, stopped at 145 for 7.4% gain.
Long Term Trend monitor purposes: Flat

Signs for a low are developing. Today’s TRIN closed at 2.25 and on the bullish side, however, closing TRIN reading >3.00 would have been much more bullish. The ticks closed at -64 and negative ticks on the close are bullish as 78% of the time the ticks close in the positive. However, a minus 300 tick close or less would have triggered a bullish signal with a TRIN close of 2.25. There are bullish signs here and we will see if more evidence develop tomorrow. We are staying neutral on the SPX.

Above is the weekly GDX chart dating back 4 years. On previous reports we pointed out that there where significant support near 57 which is where a 2 ½ year old trend line lies up from January 2009 and 54 which is where a 3 year old Neckline of a Head and Shoulders bottom lies. The longer a trend line stays in force the more power the trend line has. Therefore this is significant support in both of these trend lines. Also notice the GDX/GLD ratio, previous important lows have formed when the GDX/GLD ratio reached near .39 (current ratio is at .37 which is the lowest level seen in over 2 years and suggests gold stocks are at the cheapest level seen in over 2 years). The July 2009, January 2010 and the present all had GDX/GLD ratios at .39 and another reason that GDX may find support at current levels. It appears a “Selling Climax” appeared lasts week and suggested a sold out market. The Rydex Precious Metals fund shows the Cumulative Net Cash Flow at a 2 year low and a bullish sign. Bottoms are scarily and this one is no exception. What may occur over the next several weeks is that Gold may correct down to 1400 – 1350 range and gold stocks hold firm if not rally some.

Above is the daily GDX chart. When both the Chaikin Oscillator reaches near -75m and the GDX/GLD ratio reaches below .40 than a low in GDX is near. There are two important support areas that have over 2 year old trend lines which are 57 and then 53 ranges. It appears a “Selling Climax” appeared on 5/5 as volume was huge and today’s decline seen much less volume and suggests downside energy is weakening. Normally is best to buy things cheap and oversold and sell when they become expensive and overbought and the GDX/GLD ratio suggest gold stocks are cheap (Cheapest in the last 2 years) and the Chaikin Oscillator implies the market is oversold. We are long GDX on 5/10/11 at 57.01 and it obvious today would have been better buy. We would expect a bounce back up to the top of the trading range near 64 and possibly more.
Sold CGR at 2.18 on 3/10/11= gain 75%. Long CGR at 1.24 on 5/11/09. Long MNEAF 2.80 on 3/3/11 (sold 2.95 gain 5%). Long on US Silver (ussif) at .62 on 2/17/11(sold 4/18/11 at .74 for 19% gain). We are long GLD at 134.43 (stop 145). The smaller gold stocks should outperform the larger gold stocks. Long LODE at 2.85 on 1/21/11. Long UEXCF at 2.07 on 1/5/11. Sold AVARF on 12/13/10 at 4.06 for 61.1% gain; Long AVARF at 2.52 on 4/26/10. Sold VGZ at 2.93 for 39% gain. We are long MFN at 9.83 on 11/11/10 (sold 16.25 for 65% gain). Long KBX at 1.13 on 11/9/10. Sold RDNAF at .57 on 1/19/11 for 27% gain; Long RDNAF at .45 on 10/29/10. Long IROG at .52 on 5/10/10. Long PMU at .20 on 4/6/10( sold 10% gain). We will hold as our core position in NXG, CDE and KGC because in the longer term view these issues will head much higher. Holding CDE (average long at 27.7. Long KRY at 1.82 on 2/5/08. KGC long at 6.07. Long NXG average of 2.26. For examples in how "Ord-Volume" works, visit www.ord-oracle.com.
http://www.decisionpoint.com/TAC/ORD.html
George.
The Ord Oracle By Tim Ord (05/04/11) TY George
* Wednesday, May 4, 2011
For 30 to 90 days horizons SPX: Long 1312.62 on 4/19/11, stop 1329.
Monitoring purposes GOLD: Gold ETF GLD long at 134.43 on 12/17/10, Stop 145
Long Term Trend monitor purposes: Flat

On Monday’s report we said, “The SPX has closed above the Bollinger bands the last couple of days which can produce pull backs in the market. The last time this has occurred came at the November high (see chart).” At the high for Monday, neither the ticks nor the TRIN produced any bearish signs to help identify a pull back. Never the less, the market has pulled back and first support comes in near 1340 which was touched today. Today’s close did not produce bullish signs for the ticks nor the TRIN so the 1340 range is in question for support and may back and fill a bit longer. We do expect at some point another rally to at least test Monday’s high near 1370. We are long the SPY at 1312.62 (stop 1329)

Above are the daily tick’s readings with 5 day moving average (bottom window); 20 day moving average (next window up) and 50 day moving average which are the focus today. At previous highs in the S&P the 50 day MA of the ticks reached above +300 before a worth while decline began. At the minor high in the beginning of April the 50 day AM of the ticks reached near 250 and had a modest pull back to mid April before starting another rally to new highs. On the recent rally to new highs on the S&P the 50 day MA of the ticks reached near 250 before pulling back again on current consolidation. Bullish signal are triggered when the ticks reach below +180 and suggest there may be not much downside on the S&P before another rally begin. First support on the S&P comes in near 1340 range which is touched today. Normally markets don’t make a spike high but are tested at least once before forming so type of top. Therefore it’s likely another rally will begin soon to tests Monday’s high is not exceed it. The weekly mid Bollinger Bands are trending higher and suggests the trend is still up. We are long the SPX at 1312.62 with a stop at 1329.

On Monday’s report we said, “Gold is extended when the weekly RSI is in the 80 range and the current reading is 78.87. In the 2009 high when the weekly RSI reached near 80, Gold consolidated for three months. The second time the weekly RSI reached near 80, gold virtually traded sideways for four months then started the next rebound. Seasonality wise May and June are usually down months for gold and July a modest plus month with August and September the strongest months in the 12 month timeframe. Therefore a consolidation starting this month in gold is likely but gold may stay high and work a little higher into mid month.” For near term, gold may test the recent high in the coming days then start a multi week consolidation that may test the blue trend line (1400) or possibly pull back to previous wave four low near 1350. It doesn’t appears that GDX will pull back much at all as the GDX/Gold ratio is at levels where previous lows have formed (near .038) and major support lines come in at 57 (already touched) and then 54. Also the Cumulative Net Cash Flow for the Rydex Precious metals fund closed at 117 and reading below 150 are bullish, suggesting there is little downside from here. To help find the next low in gold (probably in June or July) the weekly RSI near 50 should find support. Sold CGR at 2.18 on 3/10/11= gain 75%. Long CGR at 1.24 on 5/11/09. Long MNEAF 2.80 on 3/3/11 (sold 2.95 gain 5%). Long on US Silver (ussif) at .62 on 2/17/11(sold 4/18/11 at .74 for 19% gain). We are long GLD at 134.43 (stop 145). The smaller gold stocks should outperform the larger gold stocks. Long LODE at 2.85 on 1/21/11. Long UEXCF at 2.07 on 1/5/11. Sold AVARF on 12/13/10 at 4.06 for 61.1% gain; Long AVARF at 2.52 on 4/26/10. Sold VGZ at 2.93 for 39% gain. We are long MFN at 9.83 on 11/11/10 (sold 16.25 for 65% gain). Long KBX at 1.13 on 11/9/10. Sold RDNAF at .57 on 1/19/11 for 27% gain; Long RDNAF at .45 on 10/29/10. Long IROG at .52 on 5/10/10. Long PMU at .20 on 4/6/10( sold 10% gain). We will hold as our core position in NXG, CDE and KGC because in the longer term view these issues will head much higher. Holding CDE (average long at 27.7. Long KRY at 1.82 on 2/5/08. KGC long at 6.07. Long NXG average of 2.26. For examples in how "Ord-Volume" works, visit www.ord-oracle.com.
http://www.decisionpoint.com/TAC/ORD.html
George.
The Ord Oracle By Tim Ord (04/27/11) TY George
* Wednesday, April 27, 2011
For 30 to 90 days horizons SPX: Long 1312.62 on 4/19/11, stop 1329.
Monitoring purposes GOLD: Gold ETF GLD long at 134.43 on 12/17/10, Stop 139
Long Term Trend monitor purposes: Flat

The second window from the bottom is the Trin/Tick ratio and next window up is the Tick/Trin ratio. The Tick/Trin ratio does a good job finding lows in the market and the Trin/Tick ratio does a good job finding highs. Today the Trin/Tick ratio reached into and area where highs in the SPY have formed in the past. Sometimes these high signals can take a while to complete and think that is a possibility here. Notice that the Tick/Trin ratio is giving a bullish signal and implies the current rally has further to go and usually the market doesn’t turn down until the Trick/Trin ratio turns down. We have been saying that the May timeframe may be an important month for a turn in the market and the Trin/Tick ratio suggests a correction in the market may come in May. We are long the SPY at 1312.62 (stop 1329)

Above is a trading method used for longer term signals. What it is, is the Cumulative of the NYA McClellan Summation index with a 25 period moving average. It lags the market both on the buy and sell side but catches the trend well. The dip in March did not change this indicator and remains in an uptrend trend. The Bollinger bands around the SPY is on the weekly scale and the mid Bollinger band also is trend higher and suggests the trend is up.

A Smaller Head and Shoulder pattern formed where the Head is the January low. The Neckline of the H&D was jumped in early April and over the last couple of weeks GDX has been bouncing on this Neckline. Over the last couple of days the GDX/GLD ratio reached into the .41 area where previous lows have been found in GDX and give support that the Neckline near 60 range may hold. Major support comes in the blue rising trend line that is over 2 year gold and this trend line has major support near 57 and rising. The longer the trend line has been enforce the strong the support becomes. This potential Head and Shoulders pattern has an upside target near 69. We remains bullish on gold stocks for now. Sold CGR at 2.18 on 3/10/11= gain 75%. Long CGR at 1.24 on 5/11/09. Long MNEAF 2.80 on 3/3/11 (stop 2.80). Long on US Silver (ussif) at .62 on 2/17/11(sold 4/18/11 at .74 for 19% gain). We are long GLD at 134.43. The smaller gold stocks should outperform the larger gold stocks. Long LODE at 2.85 on 1/21/11. Long UEXCF at 2.07 on 1/5/11. Sold AVARF on 12/13/10 at 4.06 for 61.1% gain; Long AVARF at 2.52 on 4/26/10. Sold VGZ at 2.93 for 39% gain. We are long MFN at 9.83 on 11/11/10. Long KBX at 1.13 on 11/9/10. Sold RDNAF at .57 on 1/19/11 for 27% gain; Long RDNAF at .45 on 10/29/10. Long IROG at .52 on 5/10/10. Long PMU at .20 on 4/6/10( sold 10% gain). We will hold as our core position in NXG, CDE and KGC because in the longer term view these issues will head much higher. Holding CDE (average long at 27.7. Long KRY at 1.82 on 2/5/08. KGC long at 6.07. Long NXG average of 2.26. For examples in how "Ord-Volume" works, visit www.ord-oracle.com.
http://www.decisionpoint.com/TAC/ORD.html
George.
The Ord Oracle By Tim Ord (04/20/11) TY George
* Wednesday, April 20, 2011
For 30 to 90 days horizons SPX: Long 1312.62 on 4/19/11.
Monitoring purposes GOLD: Gold ETF GLD long at 134.43 on 12/17/10, Stop 139
Long Term Trend monitor purposes: Flat

Our stop on SPX was hit at 1300 and produced a gain of 2.06% from a buy signal generated on 3/17. Yesterday another bullish signal was triggered on SPX and we are long from yesterday’s close at 1312.62. The third window up from the bottom is the 50 day EMA of the tick close. Readings below +200 and turn up triggered a bullish signal that can last several weeks and sometimes months and it has turned up from the oversold level. Going back 16 months on this chart you will notice that tops in the S&P do not usually occur until the 50 EMA of the ticks reach +300. This condition also held true in the bear decline of 2007 and 2008. It is also worth noting that a possible Head and Shoulder bottom may be forming on the SPY where the head came in at the March low. This potential Head and Shoulders pattern has an upside target near 1430 and is something to watch for.

Above is the weekly SPY chart and shows a longer term view. The potential Head and Shoulders bottom form where the head is the March 2011 low has an upside target near 143 range. The 2007 high comes in near 145 and could provide stiff resistance. Therefore the market could become precarious from 143 to 145 ranges. We are also watching the Trin/Spy ratio which is showing a negative divergence.

The pattern that appears to have formed on GLD (EFT for Gold) is a Head and Shoulders bottom where the Head is the January low near 128. This Head and Shoulders pattern has an upside target near 154. Strong support comes in near 141 which is the Neckline of this Head and Shoulder pattern. On Monday’s report we showed that the Central Gold Trust just a few days ago was selling at a discount to Gold and this in turn is a bullish sentiment sign for gold. We remain bullish both on GLD and GDX and this rally could extend into May.
Sold CGR at 2.18 on 3/10/11= gain 75%. Long CGR at 1.24 on 5/11/09. Long MNEAF 2.80 on 3/3/11. Long on US Silver (ussif) at .62 on 2/17/11(sold 4/18/11 at .74 for 19% gain). We are long GLD at 134.43. The smaller gold stocks should outperform the larger gold stocks. Long LODE at 2.85 on 1/21/11. Long UEXCF at 2.07 on 1/5/11. Sold AVARF on 12/13/10 at 4.06 for 61.1% gain; Long AVARF at 2.52 on 4/26/10. Sold VGZ at 2.93 for 39% gain. We are long MFN at 9.83 on 11/11/10. Long KBX at 1.13 on 11/9/10. Sold RDNAF at .57 on 1/19/11 for 27% gain; Long RDNAF at .45 on 10/29/10. Long IROG at .52 on 5/10/10. Long PMU at .20 on 4/6/10. We will hold as our core position in NXG, CDE and KGC because in the longer term view these issues will head much higher. Holding CDE (average long at 27.7. Long KRY at 1.82 on 2/5/08. KGC long at 6.07. Long NXG average of 2.26. For examples in how "Ord-Volume" works, visit www.ord-oracle.com.
The Ord Oracle By Tim Ord (04/14/11) TY George
* Thursday, April 14, 2011
For 30 to 90 days horizons SPX: Long 1273.72 on 3/17/11, stop at 1300.
Monitoring purposes GOLD: Gold ETF GLD long at 134.43 on 12/17/10
Long Term Trend monitor purposes: Flat

This chart dates back to late 2009 and is longer term view of the SPY. Over the last 1 ½ years worthwhile lows have been found in the market when the 50 day EMA of the ticks reach below 180. The current reading is 155.56. We have identified previous lows in the SPY with red arrows when the 50 day EMA of the ticks reaches below 180. According to the ticks readings it does not suggests a worthwhile decline is beginning here but rather the market is near support. Also its worth noting that a decline usually do not begin until the 50 day EMA of the ticks reaches above +300 and that has not happen from the rally that started from mid March. Also it’s worth noting that this week is option expiration week which normally has a bullish bias. Long SPX at 1273.72 and stop at 1300.00.

Above is a short term view of the SPY using the hourly ticks. Over the last 9 months, lows have been found in the SPY when the hourly ticks reached near 400 range. Today’s hourly ticks readings hit below 300 which is an extreme level with just a modest pull back so far in the SPY over the last four days. The Bollinger bands are rising on the SPY and suggest the trend is still up and with the ticks hitting extreme, this condition suggests there is support nearby. We are not getting evidence from our longer term indicators that suggest a worthwhile top is forming here and our shorter term ticks readings are suggesting an oversold level at present, so we are holding our SPY (1273.72) and leaving our stop at 1300.

The Cumulative Net Cash Flow for the Rydex Precious Metal fund remains in bullish territory (below 150) and suggests no worthwhile decline is beginning here. Above is the daily GDX chart. The rising blue trend line is over 2 years old and strong support and currently comes in near 57 and rising. There is also a red trend line which is 3 years old which is the Neckline of a large Head and Shoulder bottom and also strong support and comes in near 54. This Large Head and Shoulders pattern has an upside target near 92 and is our longer term target. A smaller Head and Shoulder bottom formed where the Head is the Late January low. Last week, GDX jumped through the 61 level Neckline and which is now support and is being tested now. This Smaller Head and Shoulders pattern has an upside target near 69 which could be reached in the next 30 days. Since the Cumulative next cash flow for the Rydex Precious metal fund remains in bullish territory, we will expect in general for GDX to continue to move higher and attempt to hit the 69 target. Sold CGR at 2.18 on 3/10/11= gain 75%. Long CGR at 1.24 on 5/11/09. Long MNEAF 2.80 on 3/3/11. Long on US Silver (ussif) at .62 on 2/17/11. We are long GLD at 134.43. The smaller gold stocks should outperform the larger gold stocks. Long LODE at 2.85 on 1/21/11. Long UEXCF at 2.07 on 1/5/11. Sold AVARF on 12/13/10 at 4.06 for 61.1% gain; Long AVARF at 2.52 on 4/26/10. Sold VGZ at 2.93 for 39% gain. We are long MFN at 9.83 on 11/11/10. Long KBX at 1.13 on 11/9/10. Sold RDNAF at .57 on 1/19/11 for 27% gain; Long RDNAF at .45 on 10/29/10. Long IROG at .52 on 5/10/10. Long PMU at .20 on 4/6/10. We will hold as our core position in NXG, CDE and KGC because in the longer term view these issues will head much higher. Holding CDE (average long at 27.7. Long KRY at 1.82 on 2/5/08. KGC long at 6.07. Long NXG average of 2.26. For examples in how "Ord-Volume" works, visit www.ord-oracle.com.
http://www.decisionpoint.com/TAC/ORD.html
George.
The Ord Oracle By Tim Ord (04/06/11) TY George
* Wednesday, April 6, 2011
For 30 to 90 days horizons SPX: Long 1273.72 on 3/17/11, stop at 1300.
Monitoring purposes GOLD: Gold ETF GLD long at 134.43 on 12/17/10
Long Term Trend monitor purposes: Flat

This chart dates back to late 2008. The bottom window is the 20 day moving average of the ticks. It can be seen over the last two years that no tops formed when the 20 day MA of the ticks where less then 350 (current reading is +210). When the ticks do reach +350 and higher is the time to be aware that a top can form but does not say a top will form. We have marked with red arrows when the 20 day MA of the ticks reached > +350. Therefore it suggests that a top is not likely until the 20 day MA of this ticks reach +350. There are cycles for a high that come in late April and Early May and if the 20 day MA of the ticks surge in that timeframe, we will come more defensive. Short term trend is up for now. Long SPX at 1273.72 and stop at 1300.00

The top window is the TRIN/SPY ratio that is calibrated to help identify longer term turns points in the market. First notice that the larger separation in the red and blue lines suggests a larger reversal in the market. The current separation in the red and blue lines suggests a decent pull back is coming. To signal a top by the TRIN/SPY ratio either both lines need to turn up (currently the Blue line trending down and red trending up so no signal) or red line needs to cross blue line and so far there is still a separation. The TRIN/SPY is showing a divergence (wide separation in blue and red lines) but no signal has been triggered by this indicator and implies the trend is still up.

The Cumulative Cash Flow for the Rydex Precious metals fund remain in the bullish level below 150 and suggest no worthwhile decline will appear here. Above is the daily GDX chart. It appears a Head and Shoulders pattern formed where the Head is the January low near 52. Yesterday, GDX jumped through the 60 level Neckline with a “Sign of Strength” and suggests support now comes in near the 60 level. This Smaller Head and Shoulders pattern has an upside target near 69. Since the Cumulative next cash flow for the Rydex Precious metal fund remains in bullish territory, we will expect in general for GDX to continue to move higher. When Cumulative Net Cash flow reaches 225 and higher then gold stocks are becoming extended and a level to watch for a potential pull back. The longer term view for GDX is bullish in that the large Head and Shoulders bottom on GDX where the “Head” formed at the 10/09 low has and upside target near 92. The bigger trend remains up. The GDXJ should outperform GDX on the rally phases. Sold CGR at 2.18 on 3/10/11= gain 75%. Long CGR at 1.24 on 5/11/09. Long MNEAF 2.80 on 3/3/11. Long on US Silver (ussif) at .62 on 2/17/11. Long LODE at 2.85 on 1/21/11. Long UEXCF at 2.07 on 1/5/11. Gold ETF GLD long at 134.43 on 12/17/10. Sold AVARF on 12/13/10 at 4.06 for 61.1% gain; Long AVARF at 2.52 on 4/26/10. long MFN at 9.83 on 11/11/10. Long KBX at 1.13 on 11/9/10. Long IROG at .52 on 5/10/10. Long PMU at .20 on 4/6/10. We will hold as our core position in NXG, CDE and KGC because in the longer term view these issues will head much higher. Holding CDE (average long at 27.7. Long KRY at 1.82 on 2/5/08. We long KGC on average price at 6.07. Long NXG average of 2.26. For examples in how "Ord-Volume" works, visit www.ord-oracle.com.
http://www.decisionpoint.com/TAC/ORD.html
George.
The Ord Oracle By Tim Ord (03/30/11) TY George
* Wednesday, March 30, 2011
For 30 to 90 days horizons SPX: Long 1273.72 on 3/17/11, stop at 1300.
Monitoring purposes GOLD: Gold ETF GLD long at 134.43 on 12/17/10
Long Term Trend monitor purposes: Flat

The second window from the bottom is the 50 day EMA of the ticks. This chart dates back to late 2008. The 50 day EMA does a good job finding lows in the SPX in that when this indicator is below 200 a bottom is not far off. We have identified these instances which blue arrows. Right now the ticks are standing at 168.31 and suggest the rally should continue. Continuing with this study it can be seen over the last two years that no tops formed when the 50 day EMA of the ticks where less then 300. When the ticks do reach 300 is the time to be aware that a top can form but does not say a top will form. We have marked with red arrows when the 50 day EMA of the ticks reached 300. Therefore it suggests that a top is not likely near term (50 day EMA of ticks stand at 168) according to the 50 day EMA of the ticks. Trend remains up. Long SPX at 1273.72 and stop at 1300.00

Above is a short term view of the SPY using the 20 day moving average of the ticks instead of the 50 day EMA. The short term view also suggest the current rally in the SPX should continue. No worthwhile tops formed over the last couple of years when the 20 day MA of the ticks was below 400 (marked with red arrows). The current reading of the 20 day MA of the ticks is coming in at 120 which is closer to a buy level (see blue arrows above). If and when the 20 day MA of the ticks gets above 400 will be a “look out” for a possible high. We are long the SPX on 3/17/11 close at 1273.72 and with a stop at 1300.

The Cumulative Cash Flow for the Rydex Precious metals fund remain in the bullish level below 150 and suggest no worthwhile decline will appear here and that the current rally in GDX may continue. The large Head and Shoulders bottom on GDX where the “Head” formed at the 10/09 low has and upside target near 92. GDX is near two major support lines, the blue one is over 2 years old and the red one is over 3 years old. The longer in time a trend is in force the strong the support that trend line has. Therefore there is very strong support near the 55 regions and very little downside from current levels. Over the last several months it appears another Head and Shoulder pattern may be forming where the Head is the January low. This smaller H&D has an upside target near 69 and could be reached in the next couple of months or so. Downside is limited and upside has a lot of potential. The bigger trend remains up. The GDXJ should outperform GDX on the rally phases. Sold CGR at 2.18 on 3/10/11= gain 75%. Long CGR at 1.24 on 5/11/09. Long MNEAF 2.80 on 3/3/11. Long on US Silver (ussif) at .62 on 2/17/11. Long LODE at 2.85 on 1/21/11. Long UEXCF at 2.07 on 1/5/11. Gold ETF GLD long at 134.43 on 12/17/10. Sold AVARF on 12/13/10 at 4.06 for 61.1% gain; Long AVARF at 2.52 on 4/26/10. long MFN at 9.83 on 11/11/10. Long KBX at 1.13 on 11/9/10. Long IROG at .52 on 5/10/10. Long PMU at .20 on 4/6/10. We will hold as our core position in NXG, CDE and KGC because in the longer term view these issues will head much higher. Holding CDE (average long at 27.7. Long KRY at 1.82 on 2/5/08. We long KGC on average price at 6.07. Long NXG average of 2.26. For examples in how "Ord-Volume" works, visit www.ord-oracle.com.
http://www.decisionpoint.com/TAC/ORD.html
George.
The Ord Oracle By Tim Ord (03/23/11) TY George
* Wednesday, March 23, 2011
For 30 to 90 days horizons SPX: Long 1273.72 on 3/17/11, stop at 1274.
Monitoring purposes GOLD: Gold ETF GLD long at 134.43 on 12/17/10
Long Term Trend monitor purposes: Flat

This chart and the chart on page two have been updated and it appears these two charts are giving important clues what to expect in the SPX. Above is the Rydex Cash Flow ratio for the SPX. The Rydex Cash Flow ratio is a sentiment indicator which shows where the Rydex Trader is positioning his funds. When this ratio climbs above .95 then the Rydex trader is leaning on the bearish side and bullish for the market. Since the March 2009 low in the SPX, lows formed in the market when Cash Flow ratio reached above .95 and currently the ratio stands at .96. The base building lows in SPX from June to August of 2010 produced extreme Cash flow ratios for an extended time and suggested extended rally was coming, of which it did. To the right is a small window which shows more clearly the current situation. We view the rising in price in the Ratio (scale is inverted) with the rally in the market as a bullish sign in that the Rydex trader is becoming more bearish as the market rallies and suggest the current rally in the SPX may continue.

This chart was updated from yesterday also as it appears to be giving important clues in the market. The bottom window is the 20 day moving average of the ticks. The ticks have turned up from an oversold level below 100 and suggest a rally is beginning. Next window up is the 50 day moving average of the ticks and it also has reached an oversold level and in an area where previous lows have formed. There could be some backing and filling near term but it appears by the ticks readings a worthwhile low did form last week. There is a chance that the SPY could test last week low and make a double bottom and where the ticks make a double bottoms as well, like the July 2009 low and the June/July low of 2010. A danger for a high on the SPX could come when the 20 MA of the ticks reach 400 or more. The trend remains up for now. We are long the SPX on 3/17/11 close at 1273.72 and with a stop at 1274.

The Cumulative Cash Flow for the Rydex Precious metals fund remain in the bullish level below 150 and suggest the current rally in GDX will continue. When Cumulative Cash flow reaches near 225 or higher will be the time to be more for the “look out” for a high. The bigger trend remains up. The GDXJ should outperform GDX on the rally phases. Sold CGR at 2.18 on 3/10/11= gain 75%. Long CGR at 1.24 on 5/11/09. Long MNEAF 2.80 on 3/3/11. Long on US Silver (ussif) at .62 on 2/17/11. Long LODE at 2.85 on 1/21/11. Long UEXCF at 2.07 on 1/5/11. Gold ETF GLD long at 134.43 on 12/17/10. Sold AVARF on 12/13/10 at 4.06 for 61.1% gain; Long AVARF at 2.52 on 4/26/10. long MFN at 9.83 on 11/11/10. Long KBX at 1.13 on 11/9/10. Long IROG at .52 on 5/10/10. Long PMU at .20 on 4/6/10. We will hold as our core position in NXG, CDE and KGC because in the longer term view these issues will head much higher. Holding CDE (average long at 27.7. Long KRY at 1.82 on 2/5/08. We long KGC on average price at 6.07. Long NXG average of 2.26. For examples in how "Ord-Volume" works, visit www.ord-oracle.com.
http://www.decisionpoint.com/TAC/ORD.html
The Ord Oracle By Tim Ord (03/16/11) TY George
* Wednesday, March 16, 2011
For 30 to 90 days horizons SPX: neutral.
Monitoring purposes GOLD: Gold ETF GLD long at 134.43 on 12/17/10
Long Term Trend monitor purposes: Flat

Above is a longer term perspective of the SPY. The SPY/TRIN ratio tracks up and down with the SPY and the mover average of this ratio give bullish and bearish crossovers. In general the TRIN is below 1.00 in an uptrend and above 1.00 in a downtrend and the SPY/TRIN ratio helps to identity this visually. As of today the longer term trend is still up. The top window is the MACD of the SPY/TRIN ratio and a crossover of its moving average would generate a sell signal and thus far it has not done that.

Above is a shorter term picture for the SPY. On Monday’s report we said, “The best signals for a bottom come when the there is a grouping of TRINS > 2.5 and Tick Close lower then -500.” Today the TRIN closed at 3.06 and the ticks closed at -850 which suggest the SPY is making a low here. It’s rare for the TRIN to reach above 3.00 and when it has a bottom was in the making. Sometimes the extreme downtick close and extreme TRIN readings lead the low for a day or two but in most cases the low in the SPY is very near where these two indicators reached their extremes. Today’s volume was high and suggests today’s low could be tested before the bottom is complete. The top window is the Put/Call ratio for the equities and the 5 day average above .65 have also lead to bottoms and the current reading is .78. Market is making a bottom near current levels and suggest another rally is about to start. We would like to see a test of today’s low on lighter volume and that would complete the bullish signal.

A three year Neckline which is major support comes in near 54 and the Major uptrend line( two year old) which is also major support comes in near 55, so downside may be limited to 54, 55 range. The GDX/GLD ratio has been supporting GDX near .41 and that ratio is there now. Cumulative Net Cash flow for the Rydex Precious metals fund came in at 1.25.57 today, reading below 150 have been bullish for the market. The pattern that may be forming since December could be a Head and Shoulders bottom where the Right Shoulder is forming now. GDX is at support and trend remains up. The GDXJ should outperform GDX on the rally phases. Sold CGR at 2.18 on 3/10/11= gain 75%. Long CGR at 1.24 on 5/11/09. Long MNEAF 2.80 on 3/3/11. Long on US Silver (ussif) at .62 on 2/17/11. Long LODE at 2.85 on 1/21/11. Long UEXCF at 2.07 on 1/5/11. Sold DNN 3/15/11 at 2.25 29.6% loss; Long DNN on 12/17/10 at 3.20. Gold ETF GLD long at 134.43 on 12/17/10. Sold CXZ on 3/16/11 at 1.15 for 24% loss; Long CXZ at 1.52 on 12/14/10. Sold AVARF on 12/13/10 at 4.06 for 61.1% gain; Long AVARF at 2.52 on 4/26/10. long MFN at 9.83 on 11/11/10. Long KBX at 1.13 on 11/9/10. Sold RDNAF at .57 on 1/19/11 for 27% gain; Long RDNAF at .45 on 10/29/10. Long IROG at .52 on 5/10/10. Long PMU at .20 on 4/6/10. We will hold as our core position in NXG, CDE and KGC because in the longer term view these issues will head much higher. Holding CDE (average long at 27.7. Long KRY at 1.82 on 2/5/08. We long KGC on average price at 6.07. Long NXG average of 2.26. For examples in how "Ord-Volume" works, visit www.ord-oracle.com.
http://www.decisionpoint.com/TAC/ORD.html
George.
The Ord Oracle By Tim Ord (03/09/11) TY George
* Wednesday, March 9, 2011
For 30 to 90 days horizons SPX: back to neutral.
Monitoring purposes GOLD: Gold ETF GLD long at 134.43 on 12/17/10
Long Term Trend monitor purposes: Flat

Above is an intermediate term view of the SPY. When there has been a wide separation of the blue and red line a large reversal in the market occurred. When both the red and blue lines start to trend from down to up then the market is expected to reverse. Right now both the red and blue lines have turned sideways pushing the potential bearish signal down the road. The next chart of the following page shows a potential bullish signal developing near term that could see the rally extend another month or so once the current consolidation phase is complete. The SPY/TRIN ratio in the bottom window, turns up would add to the bullish short term picture.

Above is a shorter term picture. The TRIN/TICK ratio above is nearing the level where previous bottoms have formed in the past view years. The TRIN/TICK ratio hasn’t touched the bullish level yet which is above .010 but is very close in doing so and if hit would imply another rally phase in the market will begin that could last a month or more. Normally a bullish signal will be triggered by this indicator when it hits above .010 and when it turns down will trigger the bullish signal. We have drawn red arrows to previous bullish signals by this indicator.

Above is the Cumulative Net Cash Flow for the Rydex Precious Metal fund. Over the last two years the uptrend in gold stocks continued when Cumulative Net Cash Flow was 150 and below. The current reading is 129.01 and therefore in general the current rally in gold stocks should continue. When the Cumulative Net Cash reaches above 225 will be a clue to start looking for the next high. Trend remains up. GDXJ should outperform GDX on the rally phases. Long MNEAF 2.80 on 3/3/11. Long on US Silver (ussif) at .62 on 2/17/11. Long LODE at 2.85 on 1/21/11. Long UEXCF at 2.07 on 1/5/11. Long DNN on 12/17/10 at 3.20. Gold ETF GLD long at 134.43 on 12/17/10. Long CXZ at 1.52 on 12/14/10. Sold AVARF on 12/13/10 at 4.06 for 61.1% gain; Long AVARF at 2.52 on 4/26/10. long MFN at 9.83 on 11/11/10. Long KBX at 1.13 on 11/9/10. Sold RDNAF at .57 on 1/19/11 for 27% gain; Long RDNAF at .45 on 10/29/10. Long CGR at 1.24 on 5/11/09. Long IROG at .52 on 5/10/10. Long PMU at .20 on 4/6/10. We will hold as our core position in NXG, CDE and KGC because in the longer term view these issues will head much higher. Holding CDE (average long at 27.7. Long KRY at 1.82 on 2/5/08. We long KGC on average price at 6.07. Long NXG average of 2.26. For examples in how "Ord-Volume" works, visit www.ord-oracle.com.
http://www.decisionpoint.com/TAC/ORD.html
George.
The Ord Oracle By Tim Ord (03/02/11) TY George
* Wednesday, March 2, 2011
For 30 to 90 days horizons SPX: back to neutral.
Monitoring purposes GOLD: Gold ETF GLD long at 134.43 on 12/17/10
Long Term Trend monitor purposes: Flat

The weekly chart above shows stock in the SPX above it’s 50 day moving average. The SPX has moved higher since October but stocks above its moving average has gradually decreased and shows leadership is weakening. Right now there are 61.8% stocks above their moving average. This chart shows a gradually weakening of the uptrend and a bearish intermediate term sign.

Above is a shorter term picture. Three out of 5 days the tick readings exceed -500 imply market is entering into a low of which happen going into last Thursday’s low. Last Thursday’s low had high volume and a lot of the time a high volume low is tested. Today’s trading did not touch last Thursday’s low so the jury is still out. Yesterday did produce a TRIN close of 2.58 which is bullish but more reliable signals are generated when it closes above 3.00. However it another 2.50 or higher reading comes in again as last Thursday’s low is tested then that would create a bullish signal also. The bottom window is the Chaikin Oscillator and readings below 50m are bullish. The short term picture leans on the bullish side and an ideal situation would be for a test of previous low with either < minus 500 tick close or 2.50 > TRIN close. We are back to neutral for now and let’s see if we get this setup. I might add that the mid Bollinger band is rising and suggests the short term trend is still up.

The above chart shows a bit of unusual occurrence; when the Rydex Precious metal fund moved higher then normally the Net Cash Flow will also move higher. Notice in the lower right hand corner that Cash flow has moved lower over the last couple of days with the Rydex Precious metals moving higher. We take this as a bullish sign sentiment wise and would conclude that gold stocks in general will move higher. When Net Cash Flow reaches near 225 will be the time to watch for a potential ending of the rally. GDXJ should outperform GDX on the next rally phase. Long on US Silver (ussif) at .62 on 2/17/11. Long LODE at 2.85 on 1/21/11. Long UEXCF at 2.07 on 1/5/11. Long DNN on 12/17/10 at 3.20. Gold ETF GLD long at 134.43 on 12/17/10. Long CXZ at 1.52 on 12/14/10. Sold AVARF on 12/13/10 at 4.06 for 61.1% gain; Long AVARF at 2.52 on 4/26/10. We are long MFN at 9.83 on 11/11/10. Long KBX at 1.13 on 11/9/10. Sold RDNAF at .57 on 1/19/11 for 27% gain; Long RDNAF at .45 on 10/29/10. Long CGR at 1.24 on 5/11/09. Long IROG at .52 on 5/10/10. Long PMU at .20 on 4/6/10. We will hold as our core position in NXG, CDE and KGC because in the longer term view these issues will head much higher. Holding CDE (average long at 27.7. Long KRY at 1.82 on 2/5/08. We long KGC on average price at 6.07. Long NXG average of 2.26. For examples in how "Ord-Volume" works, visit www.ord-oracle.com.
http://www.decisionpoint.com/TAC/ORD.html
George.
The Ord Oracle By Tim Ord (02/23/11) TY George
* Wednesday, February 23, 2011
For 30 to 90 days horizons SPX: neutral
Monitoring purposes GOLD: Gold ETF GLD long at 134.43 on 12/17/10
Long Term Trend monitor purposes: Flat

Some times insight can be gathered from other markets about the status of the SPY. Above is the daily QQQQ. The TRINQ closed over 3.00 yesterday and previous times over the last 10 months when this has occurred QQQQ made a low the day of the +3.00 reading and as late as two days later. Excluding the early May 2010 low the price low was near the price of the day the TRINQ closed above 3.00. Yesterday the TRINQ closed over 3.00 and suggests a low will either be today or tomorrow and the price low should be near current levels. If the Character of the market hasn’t changed then the QQQQ is near support here and if the QQQQ is near support then SPY should also be near support. If tomorrow the QQQQ is flat to up then in general the market should start to work higher. If the QQQQ closes below today’s low then it would imply that there is a Character change in the market and a bearish intermediate term sign. Lets see what the market brings tomorrow. The bottom window is the 5 day average of the TICKQ which has found lows when this indicator fell below -200. Right now this indicator is not saying much. We don’t see a safe trade here and will remains neutral on the SPX. Market may hold up into the March April timeframe.

In early February the Cash Flow for the Rydex Precious Metals fund hit the lowest level in over two years and we view this event as a bullish sentiment sign. In other words investors are not shoveling money into gold funds right now which shows investors are not bullish on gold stocks which sentiment wise is bullish for gold stocks. When Cash Flow reaches 225 and above will be the time to be more careful.

Above is the weekly GDX chart. The weekly charts carry more weight then the daily charts and right now the weekly charts remain bullish for GDX. The weekly Slow Stochastics turned in late January and remains in an uptrend. The weekly Bullish Percent index also turned up in late January and remains in an uptrend. When the weekly mid Bollinger Band is trending up then the weekly RSI should find support near 50 and then turn up in a bullish market and that is what happened on the current GDX market. In September 2010 the GDX broke above the Neckline of a Head and Shoulders bottom which has a measured target for this H&D near 92 which is about 70% higher then current levels. In January GDX pull back to Neckline and the trend line up from the March 09 lows near 54 and found strong support. On a short term timeframe support now lies near 57 and we don’t expect 54 range will be seen for a long while. There are cycles for a low coming in late this month and there could be backing and filling until then but in general the rally should brake to new highs starting in March. GDXJ should outperform GDX on the next rally phase. Long on US Silver (ussif) at .62 on 2/17/11. Long LODE at 2.85 on 1/21/11. Long UEXCF at 2.07 on 1/5/11. Long DNN on 12/17/10 at 3.20. Gold ETF GLD long at 134.43 on 12/17/10. Long CXZ at 1.52 on 12/14/10. Sold AVARF on 12/13/10 at 4.06 for 61.1% gain; Long AVARF at 2.52 on 4/26/10. We are long MFN at 9.83 on 11/11/10. Long KBX at 1.13 on 11/9/10. Sold RDNAF at .57 on 1/19/11 for 27% gain; Long RDNAF at .45 on 10/29/10. Long CGR at 1.24 on 5/11/09. Long IROG at .52 on 5/10/10. Long PMU at .20 on 4/6/10. We will hold as our core position in NXG, CDE and KGC because in the longer term view these issues will head much higher. Holding CDE (average long at 27.7. Long KRY at 1.82 on 2/5/08. We long KGC on average price at 6.07. Long NXG average of 2.26. For examples in how "Ord-Volume" works, visit www.ord-oracle.com.
http://www.decisionpoint.com/TAC/ORD.html
The Ord Oracle By Tim Ord (02/16/2011) TY George
* Wednesday, February 16, 2011
For 30 to 90 days horizons SPX: neutral
Monitoring purposes GOLD: Gold ETF GLD long at 134.43 on 12/17/10
Long Term Trend monitor purposes: Flat

Above is the short term view of the TICK/TRIN ratio over the last couple of years updated to tonight’s close. Since the March 2009 low the TICK/TRIN ratio topped out in advance of the SPY. The TICK/TRIN ratio did not help pick out the exact high but did warn that a high was coming. Right now the TICK/TRIN ratio is rising and suggests in general the SPY should move higher near term. There could be a couple of day pull back in the SPY but then should reverse back up. Yesterday’s downticks close of -703 was a bullish short term sign. The previous time the downtick readings where this high came on January 28 which also marked a low. Bottom window is the Tick index on a 60 minute timeframe. Normally the market will rise when the Ticks are in an uptrend line like now and a bullish short term sign. The QE2 (Quantitative Easing) may be having a buoyant affect on the market that could last a while longer. The market may push modestly higher near term. We don’t see a safe trade here and will remains neutral on the SPX. Market may hold up into the March April timeframe.

The Cash Flow for the Rydex Precious Metals fund hit the lowest level in over two years and we view this event as contrary and a bullish sentiment sign. In other words investors are not shoveling money into gold funds right now which shows investors are not bullish on gold stocks which sentiment wise is bullish for gold stocks.

Above is the weekly chart Global Gold index ($SPTGD) which is representative of the XAU for Canada. A huge Head and Shoulders bottom dating back top 2006 appears to be forming where the October 2008 low was the Head. Over the last couple of weeks the Slow Stochastics reached a rare oversold level below 20 and has a bullish turn up. The weekly Chaikin Oscillator also a seldom seen reading below -200m and has a bullish turn up. Both of these indicators only hit these oversold levels about once a year and at intermediate term lows. This potential Head and Shoulder bottoms has an upside target near 700 which is about a 70% rise from current levels. Also a “Sign of Strength” should be seen through the Neckline (Around 435) to confirm the bullish H&D. This potential “Sign of Strength” would imply a “Surge” in gold stocks prices is coming. GDXJ should outperform GDX on the next rally phase. Long LODE at 2.85 on 1/21/11. Long UEXCF at 2.07 on 1/5/11. Long DNN on 12/17/10 at 3.20. Gold ETF GLD long at 134.43 on 12/17/10. Long CXZ at 1.52 on 12/14/10. Sold AVARF on 12/13/10 at 4.06 for 61.1% gain; Long AVARF at 2.52 on 4/26/10. We are long MFN at 9.83 on 11/11/10. Long KBX at 1.13 on 11/9/10. Sold RDNAF at .57 on 1/19/11 for 27% gain; Long RDNAF at .45 on 10/29/10. Long CGR at 1.24 on 5/11/09. Long IROG at .52 on 5/10/10. Long PMU at .20 on 4/6/10. We will hold as our core position in NXG, CDE and KGC because in the longer term view these issues will head much higher. Holding CDE (average long at 27.7. Long KRY at 1.82 on 2/5/08. We long KGC on average price at 6.07. Long NXG average of 2.26. For examples in how "Ord-Volume" works, visit www.ord-oracle.com.
http://www.decisionpoint.com/TAC/ORD.html
George.
The Ord Oracle By Tim Ord (02/09/11) TY George
* Wednesday, February 9, 2011
For 30 to 90 days horizons SPX: neutral
Monitoring purposes GOLD: Gold ETF GLD long at 134.43 on 12/17/10
Long Term Trend monitor purposes: Flat

Above is our shorter term measure of what the expected out come may materialize. The bottom window is our hourly tick indicator and over the last few days it has pushed higher which is a short term bullish sign for the market. Next window up is the TRIN/TICK ratio which is staying neutral and not giving much information right now. A swing down to minus .01 on this ratio would be bearish and a swing up to plus .01 would be bearish. Next window up is the TICK/TRIN ratio which as been very good picking out lows in the SPY. For a bullish signal this would need to fall to 70 and right now its near 170. Normally the TICK/TRIN ratio will turn down first before the market turns down (see next chart below) We are staying neutral.

Above is the short term view of the TICK/TRIN ratio over the last couple of years. Since the March 2009 low the TICK/TRIN ratio topped out way in advance of the SPY. The TICK/TRIN ratio did not help pick out the exact high but did warn that a high was coming. Right now the TICK/TRIN ratio is rising and suggests in general the SPY should move higher near term. Therefore there could be a couple of day pull back in the SPY but then should reverse back up. Downtick closing exceeding -300 will help signal the next low in the pull back. The QE2 (Quantitative Easing) may be having a buoyant affect on the market that could last a while longer. The market may push modestly higher near term but most of the rally has been seen. We don’t see a safe trade here and will remains neutral on the SPX. Market may hold up into the March April timeframe.

Above is the weekly chart of GDX. GDX has hit two trend line supports, first is the one up from January 09 low and the other is the Neckline of the Head and Shoulders bottom. The weekly Chaikin Oscillator has turned up from the oversold level where previous lows have formed. The Slow Stochastics has turned up from where significant lows have formed in the past. Second window up is he Bullish Percent index which also has turned up. GDX did find support in the 54 range and may be starting another up-leg. The Head and Shoulders pattern on GDX has an upside target near 92 which is about 70% higher then current levels. GDXJ should outperform GDX on the next rally phase. Long LODE at 2.85 on 1/21/11. Long UEXCF at 2.07 on 1/5/11. Long DNN on 12/17/10 at 3.20. Gold ETF GLD long at 134.43 on 12/17/10. Long CXZ at 1.52 on 12/14/10. Sold AVARF on 12/13/10 at 4.06 for 61.1% gain; Long AVARF at 2.52 on 4/26/10. We are long MFN at 9.83 on 11/11/10. Long KBX at 1.13 on 11/9/10. Sold RDNAF at .57 on 1/19/11 for 27% gain; Long RDNAF at .45 on 10/29/10. Long CGR at 1.24 on 5/11/09. Long IROG at .52 on 5/10/10. Long PMU at .20 on 4/6/10. We will hold as our core position in NXG, CDE and KGC because in the longer term view these issues will head much higher. Holding CDE (average long at 27.7. Long KRY at 1.82 on 2/5/08. We long KGC on average price at 6.07. Long NXG average of 2.26. For examples in how "Ord-Volume" works, visit www.ord-oracle.com.
http://www.decisionpoint.com/TAC/ORD.html
George.
The Ord Oracle By Tim Ord 02/02/11 TY_George
* Wednesday, February 2, 2011
For 30 to 90 days horizons SPX: neutral
Monitoring purposes GOLD:Gold ETF GLD long at 134.43 on 12/17/10
Long Term Trend monitor purposes: Flat

Above is a longer term view of what may be expected in the coming weeks for the SPY. In late December 2010 the SPY/TRIN ratio hit into the 150 area where previous market highs have formed. At the 2000 top the SPY/TRIN ratio made a double top at the 150 level that lasted about 4 months before turning down through the red line triggering a sell signal. The MACD (top window) turned up through its moving average and also triggered a sell signal at the same time. At the 2007 top the SPY/TRIN ratio stayed above 150 for nearly 6 months before turning down and closing below the red line triggering a sell signal. The MACD of the SPY/TRIN ratio had a bearish crossover at the same time. Currently the SPY/TRIN ratio has hit into the overbought level above 150 but neither the MACD of the ratio or the ratio itself has had a bearish crossover and suggests the longer term trend is still up but overbought. It may take a couple of more months for a potential bearish signal to be triggered. The SPY/TRIN ratio measures the ARMS index against the SPY. In general the ARMS index consistently stays above 1.00 in a falling market and stays below 1.00 in a rising market and the SPY/TRIN ratio helps to identify this graphically. The MACD of the SPY/TRIN ratio helps to smooth out the wiggles. The previous major crossovers of the MACD at the 2000 and 2007 tops where timely. The current SPY/TRIN ratio suggests more time is need before a signal will be generated or if at all. We are expecting little upside from current levels because this ratio has hit into overbought levels. We are staying neutral for now but a signal form this ratio could develop in March or April.

Above is the weekly chart of GDX. GDX is hitting two trend line supports, first is the one up from January 09 low and the other is the Neckline of the Head and Shoulders bottom. The weekly Chaikin Oscillator is in an area where previous lows have formed in the past and has turned up. The Bottom window is the Slow Stochastics and it has reached levels where significant lows have formed and has started to turn up. Second window up is he Bullish Percent index which also appears to be turning up. In general GDX should find support in this range and start another up-leg. The Head and Shoulders pattern on GDX has an upside target near 92 which is about 70% higher then current levels. GDXJ should outperform GDX on the next rally phase.

Above is the weekly chart of GLD which is the etf for Gold. Last week GLD hit the support line connecting the lows from October 2008. Also last week the weekly Chaikin Oscillator appears to be turning up and suggests GLD is also turning up. There are four sentiment readings suggesting gold is making a low near current levels and they are the COT which is at bullish levels, the Premium on Central Gold Trust (GTU) was selling at a discount, The Cash flow for the Rydex Precious Metals fund is at an area where previous lows have formed and Public opinion for Gold is at bullish levels. Another up-leg should start soon that may take GOLD to new highs.
Long LODE at 2.85 on 1/21/11. Long UEXCF at 2.07 on 1/5/11. Long DNN on 12/17/10 at 3.20. Gold ETF GLD long at 134.43 on 12/17/10. Long CXZ at 1.52 on 12/14/10. Sold AVARF on 12/13/10 at 4.06 for 61.1% gain; Long AVARF at 2.52 on 4/26/10. We are long MFN at 9.83 on 11/11/10. Long KBX at 1.13 on 11/9/10. Sold RDNAF at .57 on 1/19/11 for 27% gain; Long RDNAF at .45 on 10/29/10. Long CGR at 1.24 on 5/11/09. Long IROG at .52 on 5/10/10. Long PMU at .20 on 4/6/10. We will hold as our core position in NXG, CDE and KGC because in the longer term view these issues will head much higher. Holding CDE (average long at 27.7. Long KRY at 1.82 on 2/5/08. We long KGC on average price at 6.07. Long NXG average of 2.26. For examples in how "Ord-Volume" works, visit www.ord-oracle.com.
http://www.decisionpoint.com/TAC/ORD.html
George.
The Ord Oracle By Tim_Ord 01/26/11 TY_George
* Wednesday, January 26, 2011
For 30 to 90 days horizons SPX: neutral
Monitoring purposes GOLD: Gold ETF GLD long at 134.43 on 12/17/10
Long Term Trend monitor purposes: Flat

Above is an intermediate term view of SPY dating back to mid 1998 with the 100 day moving average of the TRIN in the upper window. At previous intermediate term tops the 100 MA of the TRIN produced a divergence where the SPY maked a higher highs and the 100 MA TRIN will made a higher low. To produce this negative divergence the SPY will first have a pull back then another rally to test the previous high. So far the SPY is unable to have even a minor pull back and it most cases the market doesn’t make a “spike” high. Most everyone seems to be looking for a high near current levels and that may happen but if there is pull back near term there should be another rally back up to test the high. We have indicators that suggest the market is extended but that in itself is not a sell signal. The QE2 (Quantitative Easing) may be having a buoyant affect on the market that could last a while longer. Most likely there will be a reaction at some point but market should rally back. The next reaction could start the topping process. We are staying neutral for now on the SPX.

Above are the Cash Flow and assets levels for the RYDEX Precious metals fund. The bottom window is the Cash Flow and its showing its at levels where previous lows have formed in the Rydex Precious metals fund. The next window up is the Assets levels in this fund and its close to the level where previous lows have formed. Referring back to Monday’s report, we showed the chart of the Commitment of Traders report (COT) which showed that commercials where less short now then they where at last July low. With sentiment at extremes (bullish for GLD and GDX) it would appear another strong leg up is about to begin that should hit new highs.

We have underlined the top portion on this chart and are worth a read. The bottom window shows that Central Gold Trust is selling at a discount to Gold over the last couple of weeks and a bullish sentiment reading for gold. Sentiment is bullish at three different levels and suggests gold and gold stocks are not far from a low. GDX and GLD could back and fill a couple of more days but both issues appear to be at the lows.
Long LODE at 2.85 on 1/21/11. Long UEXCF at 2.07 on 1/5/11. Long DNN on 12/17/10 at 3.20. Gold ETF GLD long at 134.43 on 12/17/10. Long CXZ at 1.52 on 12/14/10. Sold AVARF on 12/13/10 at 4.06 for 61.1% gain; Long AVARF at 2.52 on 4/26/10. We are long MFN at 9.83 on 11/11/10. Long KBX at 1.13 on 11/9/10. Sold RDNAF at .57 on 1/19/11 for 27% gain; Long RDNAF at .45 on 10/29/10. Long CGR at 1.24 on 5/11/09. Long IROG at .52 on 5/10/10. Long PMU at .20 on 4/6/10. We will hold as our core position in NXG, CDE and KGC because in the longer term view these issues will head much higher. Holding CDE (average long at 27.7. Long KRY at 1.82 on 2/5/08. We long KGC on average price at 6.07. Long NXG average of 2.26. For examples in how "Ord-Volume" works, visit www.ord-oracle.com.
http://www.decisionpoint.com/TAC/ORD.html
George.
GLD live chart with Tom Ord's thoughts
see replied to msg
for a copy of Tom Ords 01/20/2011 charts
The Ord Oracle By Tim Ord 01/20/11 TY George
* Thursday, January 20, 2011
For 30 to 90 days horizons for SPX: Flat
Monitoring purposes Gold: Gold ETF GLD long at 134.43 on 12/17/10
Long Term Trend monitor purposes: Flat

Above is an intermediate term view of the SPY. The second window from the top is the intermediate term view of the SPY/TRIN ratio and it also has reached levels where the market made little headway. The top window is the MACD of the SPY/TRIN ratio and when it turns up and crosses its moving average it will imply the market has seen its high. So far it has not crossed it moving average and may take several more weeks to complete this task. The 2000 and 2007 tops took several weeks to complete and most likely the current potential high may also take several weeks. The market may push modestly higher near term but most of the rally has been seen. Market may hold up into the March timeframe.

The above chart is the weekly etf for Gold (GLD). Important lows are found when the weekly mid Bollinger band is trending up and the weekly RSI reaches near 50 range. Current weekly RSI reading is 53.69. The bottom window is the weekly Chaikin Oscillator. Important lows are found when the weekly Chaikin Oscillator reaches near -50m and we are nearing that level now. In Elliott wave terms the labeling in red on GLD represents an extension of the wave five and currently it appears leg (4) of larger wave 5 is completing now. Once leg (4) is complete another rally up to new highs is possible in leg (5) of 5. The intermediate term trend is still up but the short term trend is sideways to down until later this month possibly ending in late January or early February. Uranium stocks are showing strength on the monthly charts, of which UEXCF; DNN and CXZ are Uranium stocks we own. We are watching URRE if it gets near support at the 2.25 range. The smaller gold stocks should outperform the larger gold stocks. Long UEXCF at 2.07 on 1/5/11. Long DNN on 12/17/10 at 3.20. Long CXZ at 1.52 on 12/14/10. Sold AVARF on 12/13/10 at 4.06 for 61.1% gain; Long AVARF at 2.52 on 4/26/10. Sold VGZ at 2.93 for 39% gain. We are long MFN at 9.83 on 11/11/10. Long KBX at 1.13 on 11/9/10. Sold RDNAF at .57 on 1/19/11 for 27% gain; Long RDNAF at .45 on 10/29/10. Long CGR at 1.24 on 5/11/09. Long IROG at .52 on 5/10/10. Long PMU at .20 on 4/6/10. We will hold as our core position in NXG, CDE and KGC because in the longer term view these issues will head much higher. Holding CDE (average long at 27.7. Long KRY at 1.82 on 2/5/08. KGC long at 6.07. Long NXG average of 2.26. For examples in how "Ord-Volume" works, visit www.ord-oracle.com.
http://www.decisionpoint.com/TAC/ORD.html
George.
The Ord Oracle By Tim Ord 01/12/11 TY George
* Wednesday, January 12, 2011
For 30 to 90 days horizons SPX: neutral
Monitoring purposes GOLD: Gold ETF GLD long at 134.43 on 12/17/10
Long Term Trend monitor purposes: Flat

The second window from the bottom is a longer term tick index readings where intermediate term oversold and overbought levels can be found. At previous highs in the SPY this intermediate term tick index readings show that no worthwhile declines have occurred when the tick index was less then +300. Right now the current tick index reading is coming in near 239. When the ticks get above +300 is where a worthwhile decline can occur in the SPY. For now the worst case for a pull back is the November high near 122 on SPY (1220 on SPX). Next week is Option Expiration week which usually has a bullish bias. Intermediate term trend is still up. An important turn in the market may show up in March probably not much higher then current levels. Staying neutral for now on the SPX.

Above is a longer term view of SPY dating back to mid 2008. When the blue and RED line of the SPY/TRIN ratio has a big separation (like now) it suggests than an intermediate term move is not far off. For a top to be signaled by this indicator both the red and blue line needs to turn up. Both the blue and Red lines are still trending down and suggests the intermediate term trend is still up but with the wide separation the uptrend is nearing an end. Market could hold up into March.

Above is a short term view GDX. GDX tested support of the November low and has held short term as the Chaikin Oscillator and Money Flow are oversold. Therefore there could be a bounce that could last several days but later this month we will look for a re-test of the 57 level and possible the 54 major support. The market may back and fill into late January before a strong rally will start in GDX. Bull market in GDX is not over (minimum upside target is 93 which is the GDX Head and Shoulders target) and major support lies near 54 of which GDX is not far from. Long UEXCF at 2.07 on 1/5/11. Long DNN on 12/17/10 at 3.20. Gold ETF GLD long at 134.43 on 12/17/10. Long CXZ at 1.52 on 12/14/10. Sold AVARF on 12/13/10 at 4.06 for 61.1% gain; Long AVARF at 2.52 on 4/26/10. We are long MFN at 9.83 on 11/11/10. Long KBX at 1.13 on 11/9/10. Long RDNAF at .45 on 10/29/10. Long CGR at 1.24 on 5/11/09. Long IROG at .52 on 5/10/10. Long PMU at .20 on 4/6/10. We will hold as our core position in NXG, CDE and KGC because in the longer term view these issues will head much higher. Holding CDE (average long at 27.7. Long KRY at 1.82 on 2/5/08. We long KGC on average price at 6.07. Long NXG average of 2.26. For examples in how "Ord-Volume" works, visit www.ord-oracle.com.
http://www.decisionpoint.com/TAC/ORD.html
20 stocks \\
are my Buy List for 2011:
Abbott Laboratories (ABT)
AFLAC (AFL)
Becton, Dickinson & Co. (BDX)
Bed Bath & Beyond (BBBY)
Deluxe Corp. (DLX)
Fiserv (FISV)
Ford Motor Company (F)
Gilead Sciences (GILD)
Johnson & Johnson (JNJ)
Jos. A Bank Clothiers (JOSB)
JPMorgan Chase (JPM)
Leucadia National (LUK)
Medtronic (MDT)
Moog (MOG-A)
Nicholas Financial (NICK)
Oracle (ORCL)
Reynolds American (RAI)
Stryker (SYK)
Sysco (SYY)
Wright Express (WXS)
The five new stocks are Abbott Laboratories (ABT), Deluxe Corp. (DLX), Ford (F), Oracle (ORCL) and JPMorgan Chase (JPM).
The five stocks I’m deleting are Baxter International (BAX), Eaton Vance (EV), Eli Lilly (LLY), Intel (INTC) and SEI Investments (SEIC).
This change doesn’t mean I think the old stocks are about to collapse. I simply believe the new stocks are better opportunities.
The new Buy List goes into effect at the start of trading on Monday, January 3, 2011 which is the first trading day of the new year.
I will track the Buy List as if it is a $1 million portfolio with 20 equally-weighted positions of $50,000 each based on the closing price on December 31, 2010.
My normal rule is that I can’t make any changes to the Buy List during the entire year.
The biggest stock is Johnson & Johnson with a market cap of $171 billion. The smallest is Nicholas Financial with a market cap of just $120 million. Combined, the 20 stocks are worth $820 billion.
Twelve of the 20 stocks pay a dividend, and if no stock raises or lowers its dividend for the next twelve months, the dividend yield for the entire Buy List will be 1.56%. The Buy List is trading at just 11.6 times next year’s earnings.
Posted by Eddy on December 17th, 2010 at 11:03 am
2011ish
1) Looking back on 2010, what were your best and worst calls?
Thanks for including me again. Last year’s participation was a good exercise for me, and I was impressed by the contributions from my roundtable colleagues. You are providing a great service with this.
Concerning my own calls, I was accurate on the overall market, technology stocks, cyclical stocks, and oil. I was wrong on health care (especially biotech) and gold.
I had a good year, but as usual, it could have been better.
2) What surprised you the most and least about financial markets in 2010?
The biggest surprise is the continuing high correlation in the moves of nearly all stocks and sectors and the inverse correlation with the dollar. This is a very atypical condition and it has persisted for quite a long time.
The least surprising has been the ongoing skepticism in the face of improved economic conditions. There is an active business in building the wall of worry as high as possible. As various concerns have been addressed, the bearish “construction crew” finds new bricks. This is a wonderful environment for the long-term investor.
3) What is the one thing that you think has contributed the most to the market rally we’ve seen off the March 2009 lows?
This should be obvious, but few see it. The March 2009 lows reflected a depression-like scenario and an instant evaluation of the Obama Administration. Current market levels are still only back to where they were before the Lehman failure and the ensuing credit freeze.
I have referred to this as the initial target. It has taken a long time to get back to the pre-Lehman level of pessimism!
4) What will be the biggest surprise of 2011?
I think I have a unique answer for this one.
The biggest surprise will be an increase in the P/E multiple, even though interest rates move higher. I have done some research on this, and it actually reflects a type of mean reversion, getting to where multiples normally are. The current depressed multiple (based upon forward earnings) reflects intense skepticism about both current and future earnings.
People will be surprised to see what is actually a return to normalcy – a stronger dollar, solid earnings growth, economic improvement, and a higher market multiple. See my post on this here.
This is fun. I can make a unique prediction simply by suggesting that things will get back to a strong historical pattern.
5) How long will the current bull market continue?
I do not know the answer to this, nor does anyone else. The ingredients for improvement are present. An economic shock could change things, especially if it is not handled effectively by policymakers. If economic growth remains at modest levels, the margin for error is smaller. In the modern era we have gone five or six years between recessions, so that is a good starting point.
6) What are the various indicators that you follow closely telling you right now about where the stock market is headed in the near term (next couple of months)?
I write an (almost) weekly column that helps readers sort through the avalanche of data and events. I discuss only what is really important. I highlight things that I expect to be the focus of discussion in the coming week. It has been pretty accurate over the last year. I also change and report my short-term posture as it switches from bearish to neutral to bullish.
I actively track 55 ETFs using our proprietary methods that assign a rating to each. This has a three-week time horizon. Right now the indicators are fairly bullish, so that is my best guess for your two-month question. The opinion could change next week. :)
My method – long term forecast and three-week forecast – does a good job of capturing the interests of both traders and investors. To summarize, it is too difficult to give a brief answer. I suggest that readers check out my weekly commentary and decide for themselves. Here is a recent example.
7) Many of you noted that cloud computing would be a popular area of the market in 2010, which turned out to be correct. What areas of the market or themes will gain more popularity in 2011?
I think that health care and the graying of America remain as important themes. It has not worked very well in recent times and the catalyst is a bit vague. I have a couple of stocks that have done well and others on my watch list.
8) What do you believe is the contrarian call on equities right now? The economy? Is investor sentiment currently misplaced?
The answer depends upon one’s time frame. Given the recent rally, sentiment is fairly bullish, but without a sign of topping. If you look longer term, it is decisively bearish. Most sentiment indicators are pretty weak. I like following the long-term Wall of Worry from The Pragmatic Capitalist. I also think that the big discount in the forward P/E multiple is a good gauge of sentiment. The high levels of sidelined cash are another major indicator.
It is popular to act like all of the economic forecasts are wrong. This is especially true of people who have never built a forecasting model. Checking out the “guru grades” at The CXO Advisory would be a real eye-opener for most people.
9) There has been a lot of commentary about the US entering into a “lost decade” similar to Japan in the 90s. What is your take on this?
This is a typical example of starting with a viewpoint, looking at hundreds of countries over many decades, and finding an example to “prove” your point. A careful comparison shows many important differences—starting with how assets are carried on bank balance sheets.
10) In what ways have you had to change your investment strategies over the past couple of years?
I have made major changes. It is important to recognize what people need and want, so that is what I have done. I have new and more diversified strategies. It is natural for people to have a strong reaction to 2008, especially so soon after some lost heavily in 2000-01. The challenge is to help people meet their needs, whether creating or preserving wealth, in an environment that has a heightened awareness of risk.
To this end I have added dividend and covered call strategies for investors seeking income, while highlighting that the reckless pursuit of yield is dangerous. I have also added a technically based program for dynamic asset allocation.
Each investor is different. I think it is wrong to take a single solution and tout it as the answer for everyone.
11) What sectors do you believe will perform the best and worst in 2011?
Energy is trading at attractive valuations, despite high oil prices. I expect natural gas to do well. Technology will be strong, with some opportunities for stock picking. I continue to like cyclical stocks since most still underestimate economic growth.
12) Financials have been lagging the market for much of 2010. Do you expect this to continue into 2011? Can the market rally without the Financials?
The market has rallied without financials and that could continue. My only major holding is Goldman Sachs, which has done very well.
I believe that financials will do better, partly dependent on the exact nature of regulations from Dodd-Frank. I have a shopping list including recommendations from a wise bank owner and investor from my Wisconsin days.
13) What’s in store for the US economy in 2011?
I have no special ability to do macro-economic forecasting. The difference between me and most pundits is that I recognize that fact. Most non-economists use a seat-of-the-pants indicator, a chain of anecdotes, or a plausible-sounding story. None of these people have an economic forecasting track record.
Economic forecasters see another year of modest growth, probably about 3%. This will be very wrong if there is an economic shock. A prominent bearish forecaster just came out with his ideas for 2011 and noted that no one predicted negative growth in 2011. Homer Simpson would have a word for that.
Most realistic forecasts recognize that a recession could happen, but it is very unlikely. It would not be anyone’s base case for the year. Stating that no economist predicts one is not the same as saying there is no chance of a recession. Conflating the two merely shows a lack of understanding. Nonetheless, the fans of this guy will cite his comments as evidence that economists cannot forecast.
It would be interesting if critics had to post their own record along with their criticism. It is not enough that someone won a contest ten years ago or “called the crash” for multiple years before and since it occurred.
What is the single best thing that most investors could do to help themselves? Quit pretending that they can predict the economy. The second best thing would be to recognize that they cannot identify the right economic experts.
A strong investment program does not go “all in” or “all out” based upon someone’s market call.
14) The consensus seems to think that the employment picture will get better in 2011, albeit slowly. Do you agree or disagree with this call?
Employment was one of my most accurate predictions last year – modest job gains, little change in the rate. It is something that I follow very closely, including independent research. The employment picture is getting better and will continue to do so, but the pace of job growth is aggravating.
15) What are the biggest problems that could emerge in the coming year that could derail the recovery, and how likely are they to occur?
If something derails the economic recovery next year, I think it is not among the popular current worries. An anticipated Black Swan is an oxymoron.
16) Are Ben Bernanke and the Fed helping or hurting the recovery?
The single most popular thing to write about is to criticize Bernanke. The constant drumbeat has convinced most of the Internet readership. Everyone seems to think that it makes them seem smart to attack someone who actually has done research, served in various government positions, and had the responsibility to make decisions under the toughest circumstances. The fact that he was the choice of two Presidents of different parties and philosophies says a lot.
One thing that the individual investor can do to improve performance right away is to ignore the Fed criticism. I recommend reading Bob McTeer, the former Dallas Fed President. He is quite conservative in his politics but also very pragmatic.
As I frequently write, investors should join me as political agnostics – willing to profit no matter who is in power. Put the politics aside. The entire Fed controversy is a sideshow. I spend much more time thinking about what the fed WILL do than trying to write about what they SHOULD do. You will make more money if you do the same.
17) When will the Fed begin to raise rates, and will this be too early, late, or just about right? (We asked this question last year as well, and rates have yet to change!)
The Fed was slow to cut rates, even though the move was faster than at any prior time in history. While I disagree with the Fed Chair that he can be 100% certain of when to raise rates, the current priorities seem about right. I do not expect QE III since I see economic improvement. If history is a guide, the Fed will be a bit slow in raising rates. That is a (very) long term problem.
18) After a bounce off the lows, home prices and sales have begun to dip again. What is the reason for this and what’s in store for real estate in 2011?
The reason is the confounding effects of the foreclosure process, making it difficult to get real price signals. The market is difficult to forecast and linked to employment. There are signs of a bottom. If and when we get a true bounce in housing, it will be a very good signal for stocks.
19) Will the Dollar (US Dollar Index) be up or down in 2011 and why? Is there a serious threat to the Dollar as the world’s reserve currency?
As long as there is a current accounts deficit, there will be pressure on the dollar vis-à-vis trading partners. Given this year’s decline, we might expect a period of stability. Higher interest rates will also help.
20) What are your current thoughts on gold – bubble, just the beginning, or fairly valued?
I do not know of a way of getting a “fair value” for gold. This year gold prices benefited from a weak dollar, the fear of deflation trade, and the fear of hyperinflation. It seems like all three of these are at extremes, but there is a profitable market in selling fear. The commissions and margins are much better than for those of us who provide investment advice over a range of asset classes for a flat fee.
21) Oil doesn’t get nearly the attention it got back in 2006-2008, and it seems to be losing steam as an asset class that investors want to be in even though it has slightly outperformed stocks in 2010. What is your take on oil as an asset class in 2011?
There are good bargains in energy stocks. It might be OK to invest in oil as a commodity, but not through an ETF. You need to have a futures account and you had better know what you are doing. I like drillers and natural gas.
22) Which alternative energy sources do you expect to gain the most market share over the next decade, and what are some of the best ways to invest in these areas?
I cannot predict over the upcoming decade, and I do not favor alternative energy in the near term.
23) What is your take on the automobile sector in both the US and abroad? Will the new GM stock be up or down in 2011? What is your favorite auto play?
N/A
24) How will the new Congress impact the stock market and the economy in 2011?
On issues where each party has a major objective – like the Bush tax policy extensions – it will be easy to find compromise. I am less confident of progress on budget policy and earmarks. There will be a compromise, but it could be a painful battle. I do not expect successful repeals of Obama policies. The House GOP majority may well be able to restrict funding and use investigations and committees to influence regulations. It is something to watch very closely. Dodd/Frank will be weakened.
25) What is your take on the political environment in the country right now and what changes, if any, need to occur to make it better? Will politics play a larger or smaller role in the year ahead?
N/A
26) Is the country finally serious about the deficit problem and ready to take steps to reduce it, or are we just seeing more posturing?
The deficit problem will be helped most by an improving economy and higher tax receipts. Trying to put the deficit question first actually makes things worse. In addition, there is no current consensus for any of the steps that are needed – mostly delaying the retirement age, cutting back on tax breaks, and reducing other favorite programs.
Solving the problem starts with some bipartisanship and building popular acceptance. Right now the polls show that people will not accept an increase in the retirement age to 68, even if phased in over decades. Wow!
27) What are the biggest global threats to the stock market right now, and how much of a threat are they?
There is always a terrorist or crazy dictator threat, but there is no good way to invest with this in mind. The threat has been there for many years. In the 1980s there was a cold war threat, where most people expected to see nuclear war in their lifetime. If you really believe in this sort of argument, you are not reading Bespoke anyway.
28) Which countries/regions are you the most bullish or bearish on at the moment?
On a long-term basis it is important to have some BRIC exposure. Meanwhile, US stocks have some catching up to do.
29) China’s stock market has underperformed most of the world in 2010. Will we see outperformance or underperformance from China in 2011? How do you expect other emerging markets to perform in 2011?
On a long-term basis, China is obviously an area of growth. This is something where the long-term investor should probably just buy a position and put it away.
30) Will the following be up or down (positive or negative) in 2011? Where noted, what are your 2011 year-end price targets? The price targets are meant to obtain a “wisdom of crowds” consensus number from all Roundtable participants.
-S&P 500 (up or down and year-end price target) Up, 1460
-Long-Term US Treasuries (up or down) Down
-Corporate Bonds (up or down) Down
-Junk Bonds (up or down) Slightly Down
-Gold (up or down and year-end price target) Flat
-Oil (up or down and year-end price target) Up, 100
-Dollar (up or down) Flat
-Average US Home Prices (up or down) Slightly Up
-China’s stock market (up or down) Up
31) Please provide readers with any stocks that you really like right now and for 2011 and beyond (and why).
I have some energy plays including Noble Energy (NE) and some natural gas holdings. The realization will come that more people will have health insurance and more will consume health services. I expect improvements in several sectors, including insurance, devices, and drugs. The “graying” theme will start to play out in the next year or two. I like ResMed (RMD), unnoticed by many despite the growing profits from sleep apnea. It is a growth stock in a growth sector. So is Apple (AAPL), which is a great buy at current levels. (Among my many criteria is an expected double within three years).
32) As one of the most popular financial content providers out there, what advice would you give someone looking to get into this arena, and how has the industry changed since you started doing what you do? Where do you see our industry going with the ever-changing way that individuals and investors get their information?
N/A
33) What are the websites, magazines, newspapers, books, apps that you use the most and would recommend others to use?
I constantly cite favorite sources, including many on my blogroll. The average investor cannot possibly keep up with everything. There is just too much information. Even if you read everything, you need a lot of background knowledge and skill to reach the right conclusions. I know that most readers do not click through to supporting links, the first step in evaluating the evidence behind an argument.
I love intelligent clients, who read and think for themselves. The smarter they are, the more they realize what they cannot do themselves. :)
Most sources provide opinions, without doing any real independent research.
I try hard to find the best sources and include my own research. I like certain specific indicators and I write about them weekly. The ECRI index is good. I also like EDMP.com, which provides a good source of stock data including a long earnings history and a sound analytic method. Seeking Alpha does a great job with transcripts of conference calls. There are a few top economic sources that focus on facts and data rather than opinion. I especially like Econbrowser, Calculated Risk, and Mark Thoma’s Economist’s View.
I have my own list of blogs that I read regularly, including the research and incomparable charts from Bespoke Investment Group. I carefully follow the reading recommendations from Abnormal Returns. Tadas Viskanta has a very good sense of what is important, and highlights a wide range of viewpoints. I like Charles Kirk for many reasons, including his take on technical analysis (a winning style) and his interesting links.
Readers of investment and economic blogs should make sure to include a variety of viewpoints. My approach meets this requirement, but it is only possible for someone who has the time to spend and knows what to look for.
As far as mainstream media goes, there has been a decline in true journalism. The economy seems to have forced MSM to compete with the blogs for page views. Since the winning formula on the Internet favors certain types of articles, some of the great journalism has been lost.
34) Do you have any other advice that you would like to share with readers heading into next year?
In the absence of anything really terrible, or anything spectacularly good, we will find ourselves one year from now looking at S&P 2011 earnings of over $90 and 2012 projections of about $100. As long as interest rates (ten-year note) are in the 4% range or so, we could get a multiple of between 14 and 15. For this reason I think we could see a better than average market gain of 20%. If we get any real traction on employment or housing, it could be much better.
Bearish trade on the semiconductors
http://finance.yahoo.com/news/Bearish-trade-semiconductors-optmonster-2014433977.html?x=0&.v=17
30 = -6300
29 9500-6300= +3200
28 19000-6300=+12700
27 27500-6300=+21200
Companies:Adobe Systems IncorporatedApplied Materials, Inc.Intel Corporation.Related Quotes
Symbol Price Change
ADBE 28.79 +0.27
AMAT 13.61 +0.23
INTC 21.46 +0.16
MSFT 27.90 -0.08
ORCL 31.46 +1.19
{"s" : "adbe,amat,intc,msft,orcl,smh,txn","k" : "a00,a50,b00,b60,c10,g00,h00,l10,p20,t10,v00","o" : "","j" : ""} David Russell (david.russell@optionmonster.com), On Friday December 17, 2010, 11:30 am EST
Semiconductors have had a nice run, but one investor is looking for a pullback.
optionMONSTER's Depth Charge tracking system detected the purchase of 5,700 February 30 puts on the Semiconductors HOLDRS (AMEX:SMH) exchange-traded fund for $0.50. The same number of February 27 puts was sold simultaneously for $0.15. Volume was above open interest in both strikes.
The SMH is up 0.37 percent to $32.64 in morning trading but has been falling since hitting a key resistance level from May 2008 six days ago. The fund, whose holdings include Texas Instruments, Intel, and Applied Materials, has rallied 23 percent in the last three months, more than twice the performance of the broader technology sector.
Today's option strategy, known as a bearish put spread, cost $0.35 to implement and will earn a maximum profit of about 750 percent if SMH closes at or below $27 on expiration. That would mark a return to levels where it traded in late September.
Interestingly, we have recently been seeing strength in software companies such as Oracle , Microsoft , Adobe , and BMC Software . Some investors may be looking to shift money from chipmakers to software companies, which haven't rallied as much.
Overall option volume in SMH is 4 times greater than average so far today, with puts outnumbering calls by 7 to 1.
(Chart courtesy of tradeMONSTER )

FREE TRADING COURSE
Good day! I'd like to invite you to check out a free trading course put together by former floor trader Adam Hewison. In it he covers:
(1) The importance of psychology in price movement
(2) How to spot mega trends
(3) Understanding of technical price objectives
(4) How to picture price objectives
(5) How to trade with moving averages
(6) How to use point and figure trading techniques
(7) How to use the RSI indicator
(8) How to correctly use stochastics in your trading
(9) How to use the ADX indicator to capture trends
(10) How to capitalize on natural market cycles.
Plus, you will you will learn all about fibonacci retracements, MACD, Bollinger Bands and much more.
To access your copy right away, go to:
http://www.ino.com/info/447/CD3633/&dp=0&l=0&campaignid=
g
FYI. Potential for imminent pullback indicated by the 5 day TRIN/ARMS data. Included blog reference indicating the infrequent occurances and criteria from the comments data shown below.
http://position-sizing.blogspot.com/2010/12/arms-index-overbought-warning.html
Friday, December 3, 2010
ARMS Index Overbought Warning
The 5-day ARMS Index ($TRIN) closed at 0.6 today. This is the lowest 5-day reading since 2003. Ultra low readings (which suggest the market is way overbought) usually occur early in rallies coming out of deep bottoms. It's very rare to see such a low ARMS reading at a top -- in this case, a triple top vs. the April and November highs.
High Plains Trader said... I notice that you're taking the average of the last five days for your reading of 0.6. If you take the raw reading, which is:
sum of advancers
-------------
sum of decliners
divided by
sum of adv volume
---------------
sum of dec volume
= you get a reading of 0.72.
A reading below 0.75 has happened 90 times at swing highs (which I defined by looking at SPX at 20-day highs combined with the low TRIN readings) since 1990.
Most recent occurrences were:
11-Mar-10
27-Aug-09
07-Aug-09
18 & 19-Sep-07
21-May-07
I think if you look at those dates on your charts you'll notice some good places to sell, however the selling pressure across all 90 occurrences was primarily contained to the first 10 days, on average.
Chi2_ALERT= PAL_in_Jeopardy as_PALL_dropped_to_68_seeChart
click on replied to msg
where i sold PAL
Gold~Silver~Pd~HUI~XAU~US$~€uro~Crude~ULGas_(#####)

Live Charts ~ Bookmark this page –
Refresh anytime during the day.
PoG

PoS

Pd

HUI (1-day) AMEX GOLD BUGS INDEX (ASE)
HUI (5-day) AMEX GOLD BUGS INDEX (ASE)
XAU (1-day) PHLX GOLD AND SILVER SECTOR IND (XPH)
XAU (5-day) PHLX GOLD AND SILVER SECTOR IND (XPH)
€uro
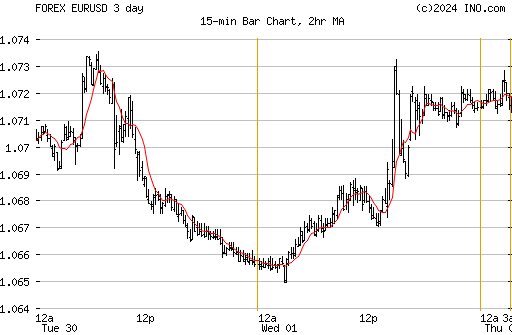
3day $US:
$USD d/w/m updates End Of Day
Crude (Dec)

Crude (Jan 2011)

Crude (Feb 2011)

Crude (Mar)

Crude (Apr)

Crude (May)

UnLeaded Gasoline updates End Of Day
In Honor of BOB3
Thoughts for Lateral Thinking...
... or Even Sometimes for Vertical Thinking.
Out-of-the-Box ...
... or Sometimes In-the-Box.
: Far From the Maddening Crowds
| Volume | |
| Day Range: | |
| Bid Price | |
| Ask Price | |
| Last Trade Time: |


