 News
News  Market Data
  Discover
Support: 888-992-3836
Copyright © 2023 InvestorsHub Inc.


Register for free to join our community of investors and share your ideas. You will also get access to streaming quotes, interactive charts, trades, portfolio, live options flow and more tools.
Folks, thanks for following but I am closing the board due to differences with ihub.
Be well and good trading!
MG
MiamiGent
Sep 4th, 1:42 pm
NYC Shake Shak shysters have a like mm on this.
I will rise to the challenge!
But for now, having my ass handed to me :)
MiamiGent
Bearish
$SHAK Not convinced MM done manipulating..
View original message
CNBC
The Dow, a day after losing 285 points and breaking a three-session winning streak, was set to advance about 200 points at the Wednesday open on Wall Street. Tuesday concern over new U.S. and China tariffs abated today as Hong Kong conceded to a key demand of pro-democracy protesters. (CNBC)
* Year-end targets for S&P 500 are all over the place from down 5% to up 11% (CNBC)
Hong stocks soared nearly 4% overnight, on word the city's leader planned to formally withdraw a contentious extradition bill that's sparked months of sometimes violent demonstrations. Early Wednesday, the measure was officially abandoned. (CNBC)
* Trump was so angry after China's trade retaliation last month that he wanted to double tariffs (CNBC)
The U.S. government releases July trade imbalance figures at 8:30 a.m. ET. The Fed, at 2 p.m. ET, releases its latest Beige Book region-by-region look at economy. American Eagle (AEO), Michaels (MIK), and Vera Bradley (VRA) issue earnings this morning. Quarterly results from Cloudera (CLDR) and Slack (WORK) are out after the bell. (CNBC)
* Weekly mortgage refinances fall further, despite lower interest rates (CNBC)
* Uber and Lyft close at record lows as investors lose faith in the ride-hailing firms (CNBC)
IN THE NEWS TODAY
Hurricane Dorian was on the move along the U.S. coastline this morning, drenching the east coast of central Florida and taking aim at the Carolinas. The slow-moving storm devastated parts of the Bahamas where it killed at least seven people. (NBC News)
* Satellite photos show much of the Bahamas underwater after Dorian (CNBC)
The NRA slams Walmart (WMT) over plans to end sales of handgun ammunition and discourage openly carrying guns in states where it's allowed. Walmart's moves follow recent deadly mass shootings at two of its Texas locations. (CNBC)
* Kroger joins Walmart in asking shoppers not to openly carry guns in stores (CNBC)
Amazon (AMZN) is testing a biometric payment system that charges users by scanning their hands, according to the New York Post. Amazon would reportedly introduce the technology at some of its Whole Foods stores by the beginning of 2020.
Apple (AAPL) plans to introduce a cheap new iPhone next spring to address declining market share, according to Japan's Nikkei news service. The phone, reportedly a successor to the iPhone SE, comes as the U.S. tech giant saw two straight quarters of shipment declines.
WeWork co-founder and CEO Adam Neumann has returned around $5.9 million worth of stock to the company, which he had originally received in exchange for the "we" trademarks, according to an amended IPO registration. (Axios)
STOCKS TO WATCH
Tyson Foods (TSN) cut its full-year earnings forecast to $5.30 to $5.70 per share, compared to estimates of $5.94. The poultry and beef producer cites the impact of a recent fire at a key factory as well as commodity market volatility.
Hedge fund Starboard Value disclosed a 7.5% stake in Box (BOX), calling shares "undervalued." Starboard, now the second largest shareholder behind Vanguard, said it may talk to the cloud service provider about exploring a potential sale.
Realty Income (O) announced the acquisition of 454 single-tenant properties from CIM Real Estate for about $1.25 billion in cash. The real estate investment trust also raised its outlook.
CONTRIBUTORS
Matthew J. Belvedere
@Matt_Belvedere
Peter Schacknow
@peterschack
Making Money, Moving Money: The World's Financial Services Exports
By: Howmuch | September 3, 2019
International trade has been in the news lately, with a growing standoff between not just the United States and China, but even the U.S. and Europe. The focus of these headlines is usually on trade in agriculture and physical goods, but trade in financial services matters too, and has its own looming issues.

• Total global exports in financial services was $489.8 billion in 2018, up 5.6% from the prior year.
• The United States and United Kingdom together make up 40% of the world’s financial services exports.
• U.S. exports of financial services was at a record-high $113 billion.
• The United Kingdom’s access to European Union financial markets after Brexit is uncertain.
In this post we look at the World Trade Organization (WTO)’s 2018 report on financial services exports. To find the data on the WTO dashboard, make sure to set “Type of trade” to “Trade in commercial services” and “Commodity/sector” to “financial services.” Each country is drawn to scale on the map based on the size of its financial services exports. A darker shade of green also indicates more financial exports.
Top 10 Biggest Exporters of Financial Services
1. United States: $113.04 B (23.51%)
2. United Kingdom: $83.08 B (17.28%)
3. Luxembourg: $64.29 B (13.37%)
4. Singapore: $27.15 B (5.65%)
5. Germany: $24.40 B (5.07%)
6. Hong Kong, China: $23.73 B (4.93%)
7. Switzerland: $21.79 B (4.53%)
8. Ireland: $17.88 B (3.72%)
9. Japan: $11.47 B (2.39%)
10. France: $9.54 B (1.98%)
Together, the U.S. and the European Union (EU) make up almost exactly half of the world’s financial services exports. It’s an impressive statistic, but one that’s about to be made less so: the European Union figure includes the United Kingdom (UK), which at some point will be leaving the EU. Traditionally a banking and finance powerhouse, the UK makes up over 17% of the planet’s financial services exports. Recently, the UK financial sector has benefitted from easy exposure to European markets as part of the so-called European single market. With Brexit, the exact trading status between the UK and EU remains unclear, but the consensus is that this will negatively impact the UK financial sector. The consulting firm PricewaterhouseCoopers suggests that the UK financial market will lose between 7 and 12 billion British pounds due to Brexit in 2020.
The UK isn’t the only financial market bracing for hits in 2019: the yield curve for US Treasury bonds recently inverted -- a traditional harbinger for recession. On top of that, the amount of negative-yielding debt now equals nearly a third of tradeable bonds worldwide, according to J.P. Morgan. These signs of a global slowdown are likely to accompany a reduced demand in financial services.
On what terms will the UK leave the EU, and how will this affect its access to financial markets? Is the U.S. economy headed for recession? What would that mean for financial exports? Let us know your thoughts in the comments.
Read Full Story »»»
 • DiscoverGold
CNBC
U.S. stock futures were indicating a sharply lower Tuesday open on Wall Street, following the implementation over the long holiday weekend of the first batch in a new round of U.S. tariffs on Chinese imports. (CNBC)
* Wall Street braces for September, historically the worst month of the year (CNBC)
The Dow, S&P 500 and Nasdaq last week all broke their four-week losing streaks, closing out a wild August with the worst monthly performance since May, the only other down month in 2019. (CNBC)
* Bond yields tick lower as yields on the 10-year and 2-year remain inverted (CNBC)
The British pound hit near three-year low Tuesday as Prime Minister Boris Johnson warns members of his own party not to undermine the U.K.'s position in talks with the EU. (CNBC)
(CNBC)
On the U.S. economic calendar, at 10 a.m. ET, the ISM releases its August manufacturing index and the government issues July construction spending figures. No major companies report earnings today. (CNBC)
IN THE NEWS TODAY
Hurricane Dorian, one of the most powerful Atlantic hurricanes on record, showed some signs of weakening early Tuesday as it remained stalled over Grand Bahama. At least five people in the Abaco Islands were killed. (CNBC)
* Dorian's wrath causes cancellation of more than 1,400 flights (CNBC)
Dorian could swamp parts of Florida's east coast by tonight. It's expected to be felt in Georgia and South Carolina tomorrow, and North Carolina and southeast Virginia on Thursday into Friday. (Weather Channel)
* UBS estimates that Dorian could cost insurers $25 billion (Reuters)
Royal Caribbean (RCL), Norwegian Cruise Line (NCLH) and Carnival (CCL) could see an estimated impact of 5 cents per share from Hurricane Dorian for the current quarter, according to Nomura Instinet.
Boeing (BA) faces new delays in returning the 737 Max to service, according to the Wall Street Journal. International regulators are said to be upset over what they perceive as a lack of information from Boeing on its proposed software fixes.
Apple (AAPL) is getting ready to launch a new sleep monitoring feature for the Apple Watch called "Time in Bed tracking," according to 9to5Mac. Apple bought sleep tracking company Beddit in 2017.
SmileDirectClub, in an updated IPO filing, said it's planning to offer stock at $19 to $22 per share, valuing the maker of teeth-straightening devices at about $8 billion at the midpoint of the range.
STOCKS TO WATCH
RBC Capital Markets raised its price target on Amazon (AMZN) by 15% to $2,600 per share, reiterating its outperform rating on the stock. The move reflects an expected boost from Amazon's new "Prime One-Day Shipping" initiative.
Spark Therapeutics (ONCE) and Switzerland's Roche announced another extension of Roche's $4.3 billion takeover bid for the U.S.-based gene therapy company. The extension to Oct. 1 was given to provide more time for regulatory reviews.
Las Vegas Sands (LVS), Wynn Resorts (WYNN) and other casino operators that operate in Macau may be negatively impacted by news of a bigger than expected 8.6% August decline in gaming revenue.
CONTRIBUTORS
Matthew J. Belvedere
@Matt_Belvedere
Peter Schacknow
@peterschack
DP WEEKLY WRAP: Seriously Suspecting September Seasonality
By: Carl Swenlin | August 30, 2019
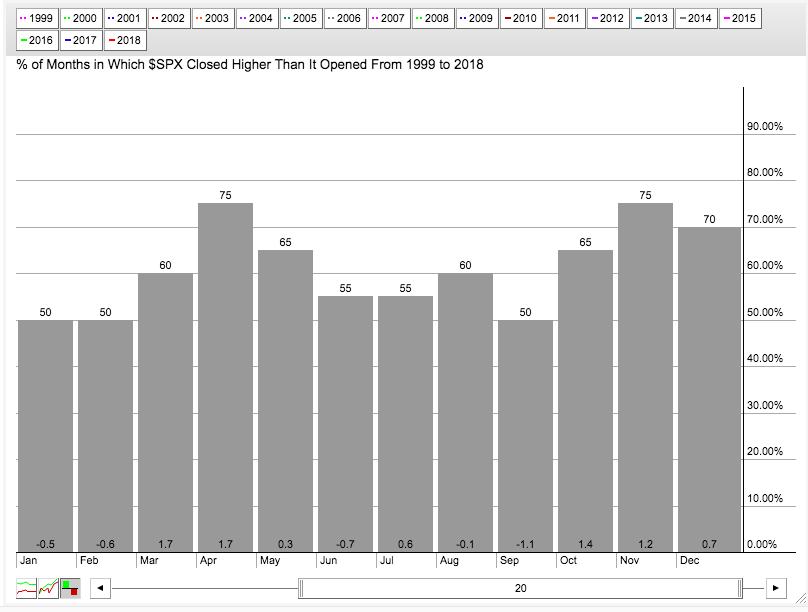
The month of September has a reputation for being a bad month for the stock market. After the October 1987 Crash, the month of October carried a bad rep for years, but more recently we are told that it's really September we have to watch out for. On the old decisionpoint.com website I used to keep a set of charts going back to the 1920s that tracked the two annual six-month seasonality periods -- favorable November through April and unfavorable May through October. The theory seemed to work statistically, but taken year to year, I found it more useful to just rely on traditional price chart analysis. Below is a chart available on the StockCharts.com Member Dashboard showing the monthly seasonality for the 20 years going back to 1999. Note that it is a binary measurement, showing the percentage of times that the market closed higher in a given month. We can see that September closed higher fifty percent of the time, but the average change was a -1.1% decline, making September the worst performing month in the 20-year period. All things considered, I don't find this very helpful. Maybe the best idea is to keep seasonality tendencies tucked in the back of our minds, while we base our actual decisions primarily upon what we see on the charts.
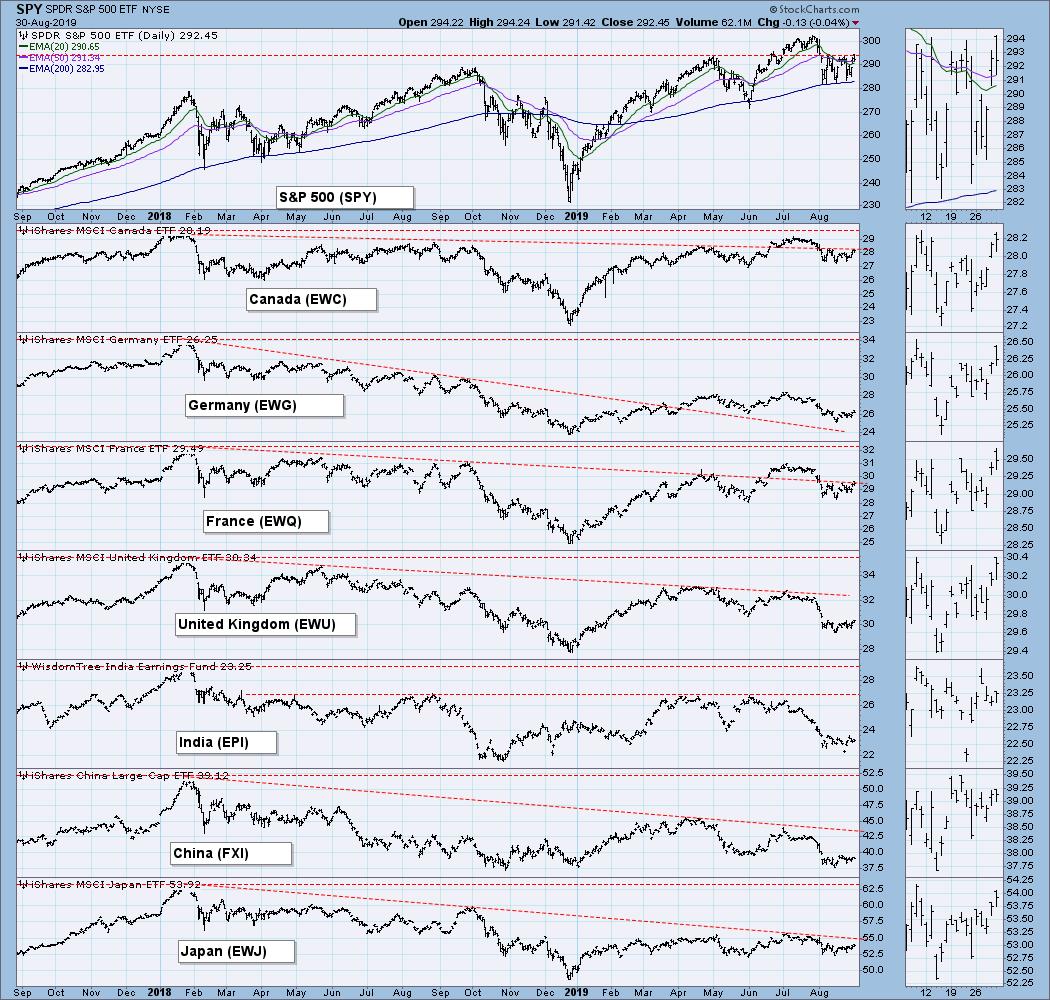
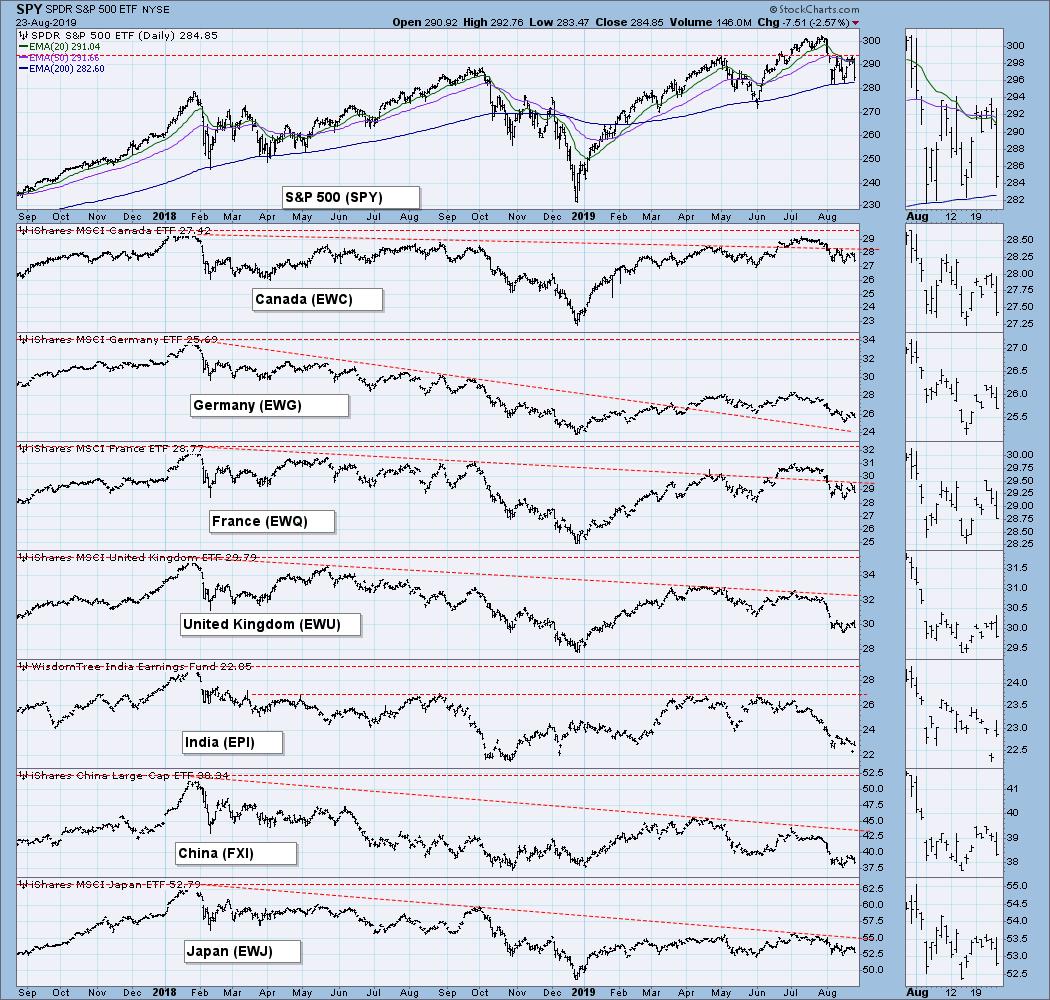
GLOBAL MARKETS
These charts are included in this report because I think, for background, we need to be generally aware of what these indexes are doing, but on a deeper level, I don’t really care enough to get into a tedious analysis of them. Look at the charts, get a general impression, and move on. A picture is worth a thousand words. Look at the picture and think.
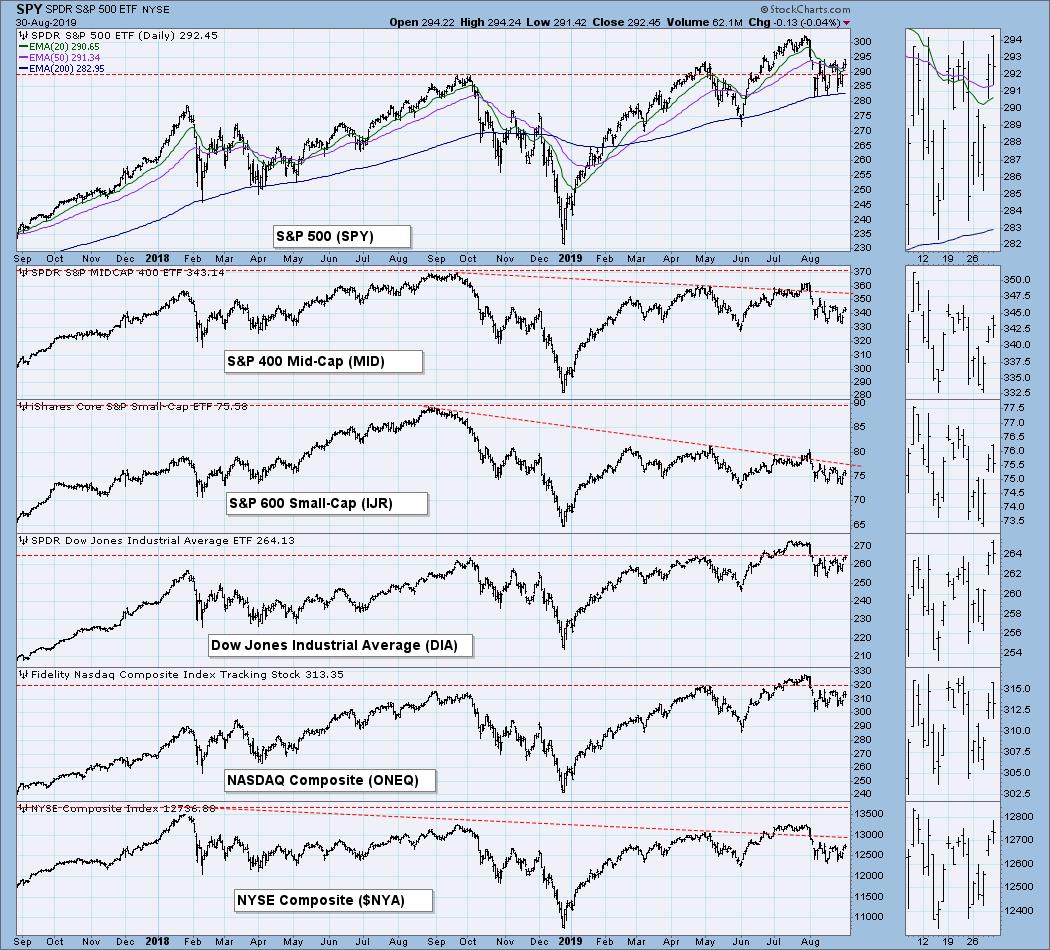
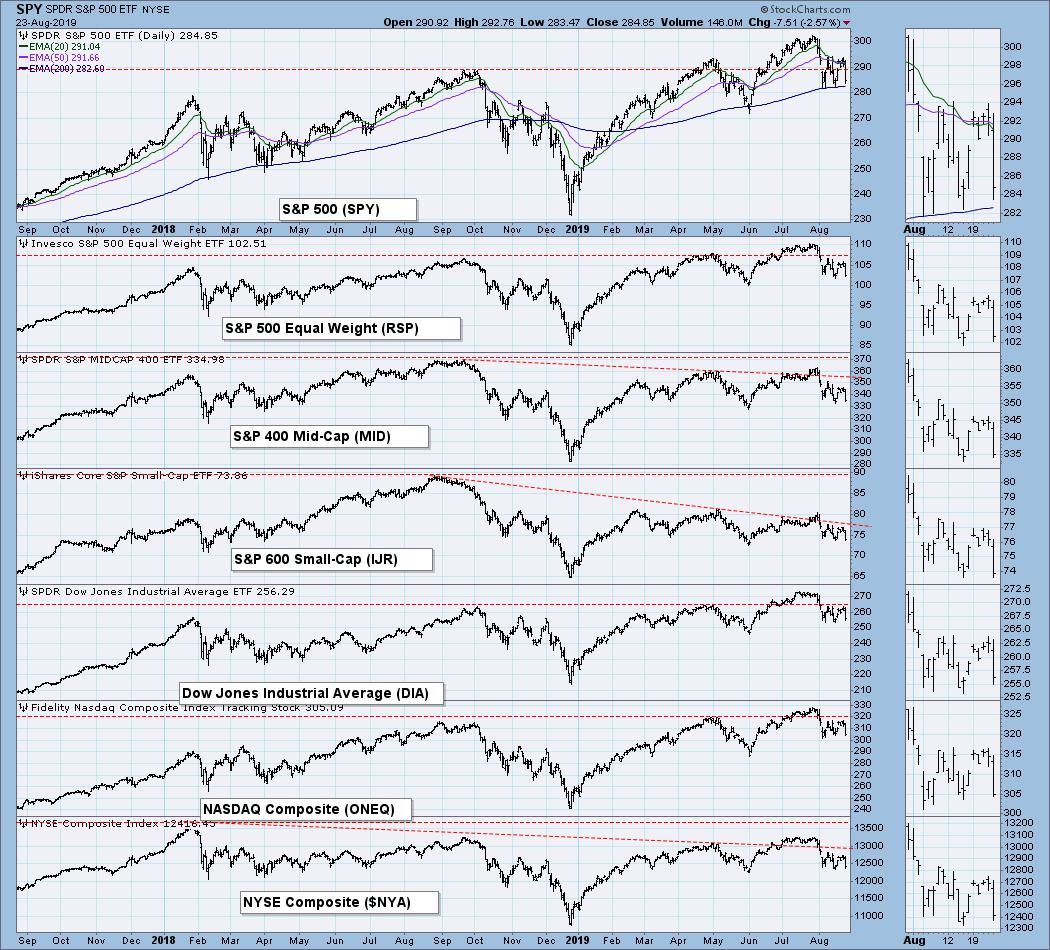
BROAD MARKET INDEXES
Smaller-cap indexes are lagging behind.
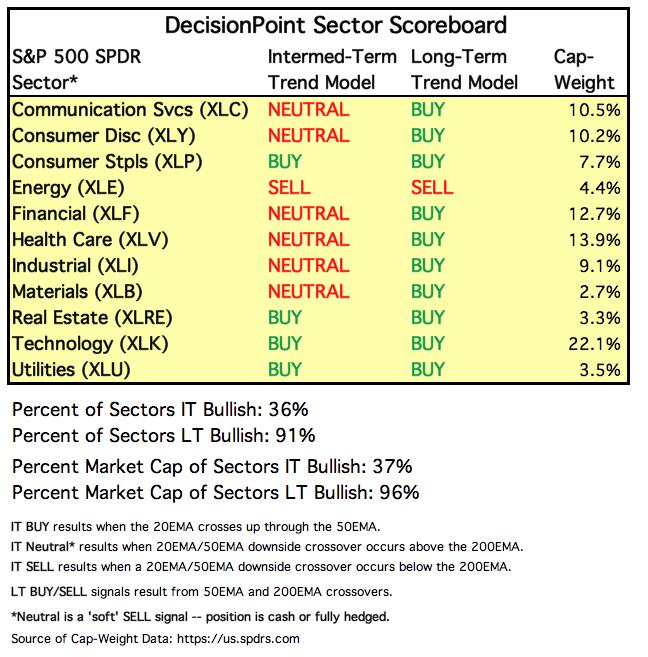
SECTORS
Each S&P 500 Index component stock is assigned to one, and only one, of 11 major sectors. This is a snapshot of the Intermediate-Term and Long-Term Trend Model signal status for those sectors.
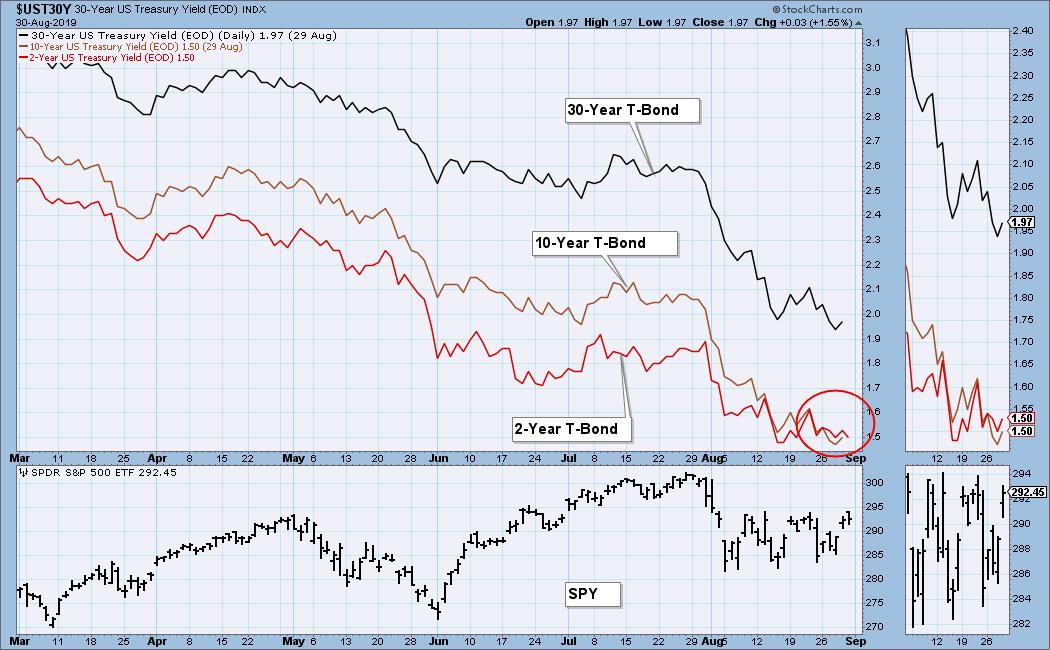
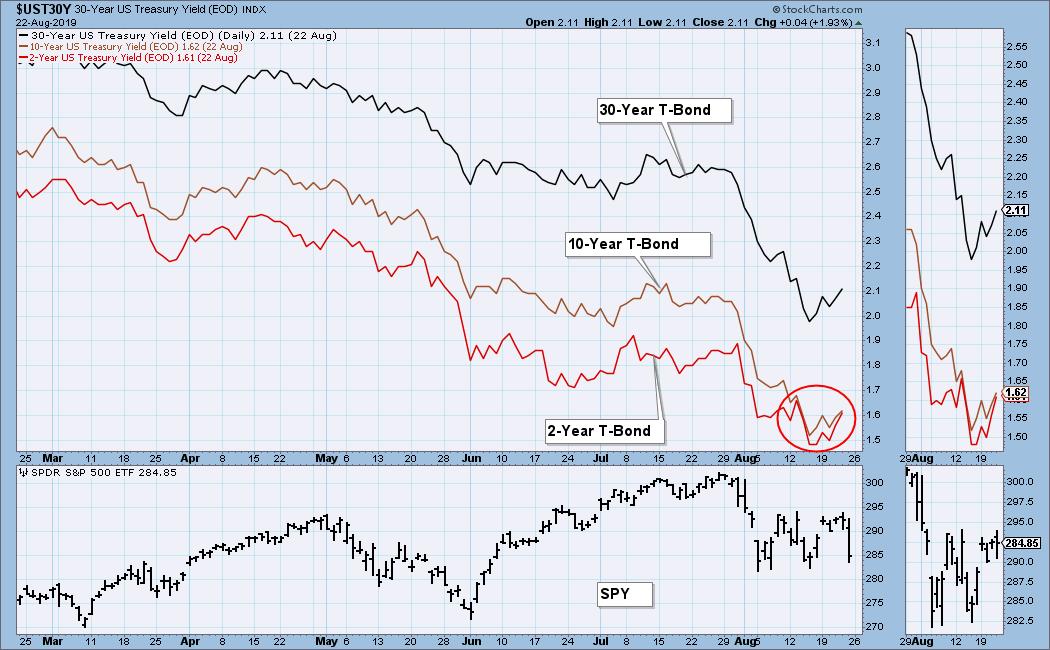
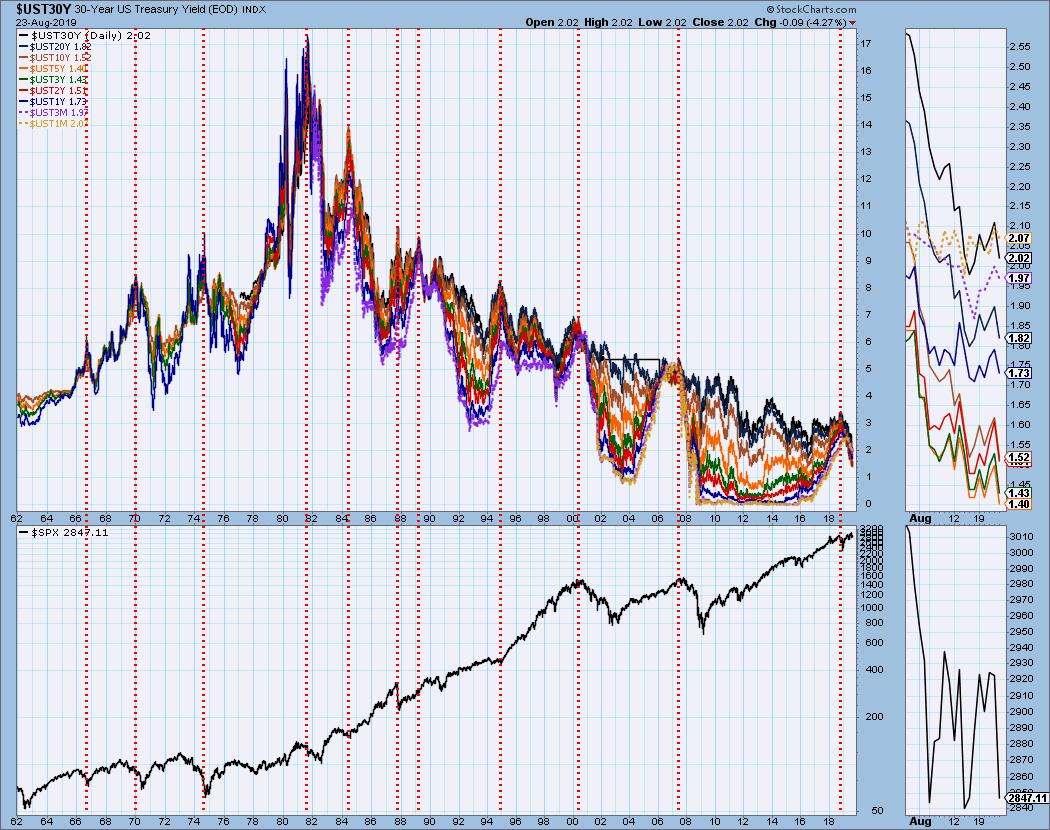
INTEREST RATES
In normal circumstances, the longer money is borrowed the higher the interest rate that must be paid. When rates are inverted, the reverse is true. It is generally believed that rate inversions result from "a flight to safety." On the chart below shows the inversion of the 10-Year T-Bond and the 2-Year T-Bond, traditionally the inversion most talked about.
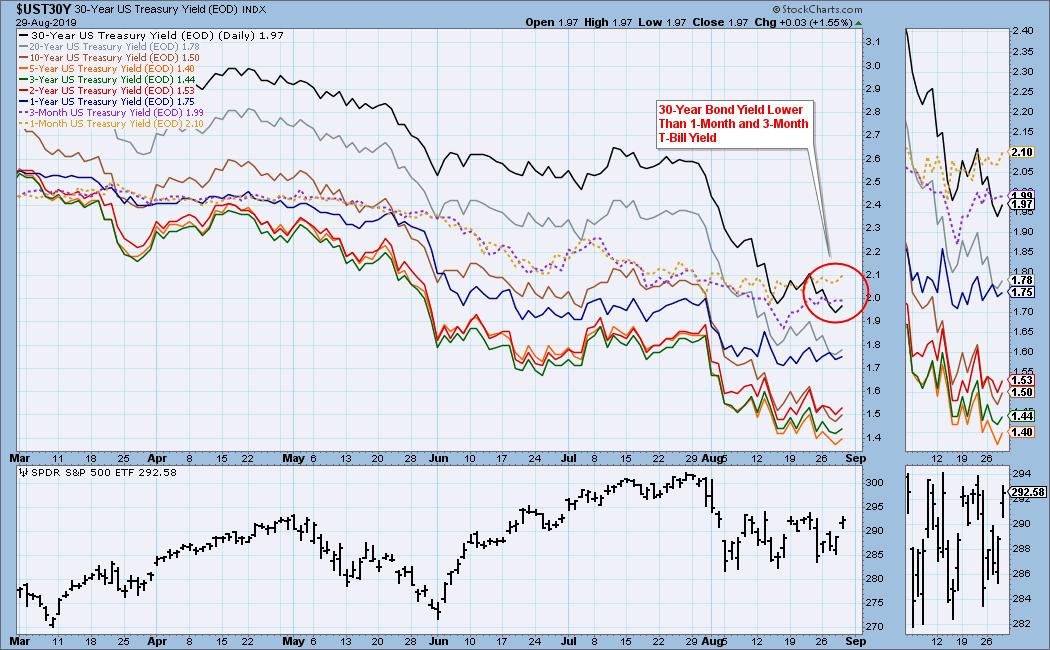
The following is our interest rate array chart. Note that the 1-Month and 3-Month T-Bills have a higher yield than the 30-Year T-Bond.
STOCKS
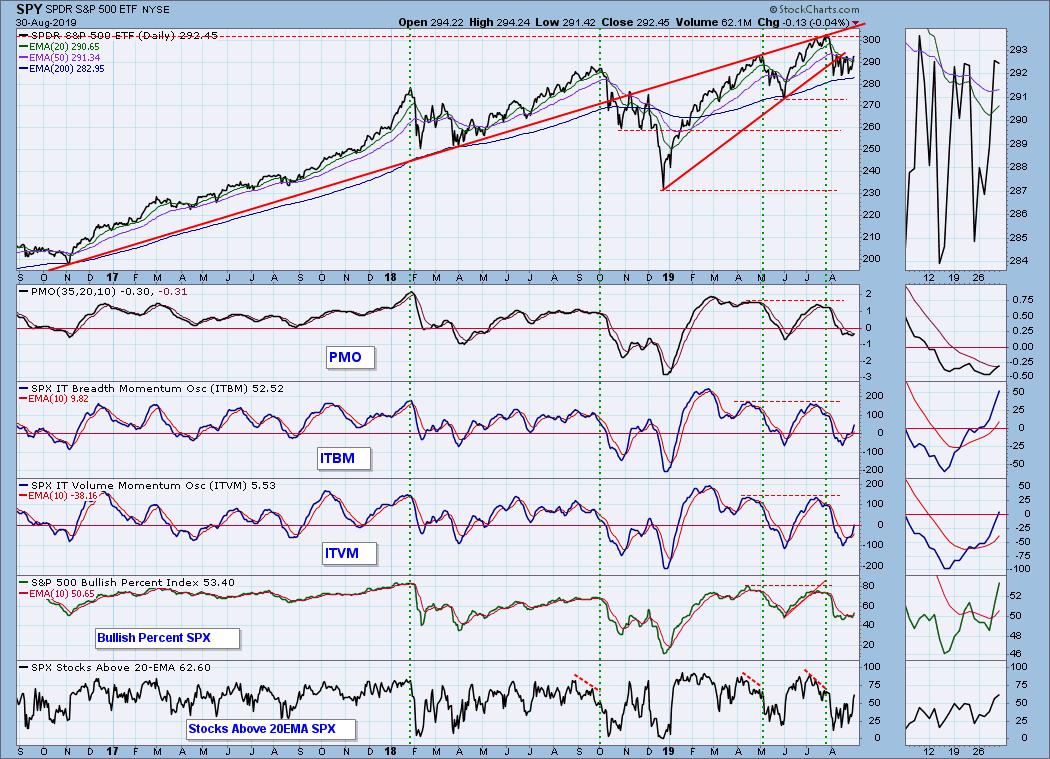
IT Trend Model: NEUTRAL as of 8/15/2019
LT Trend Model: BUY as of 2/26/2019
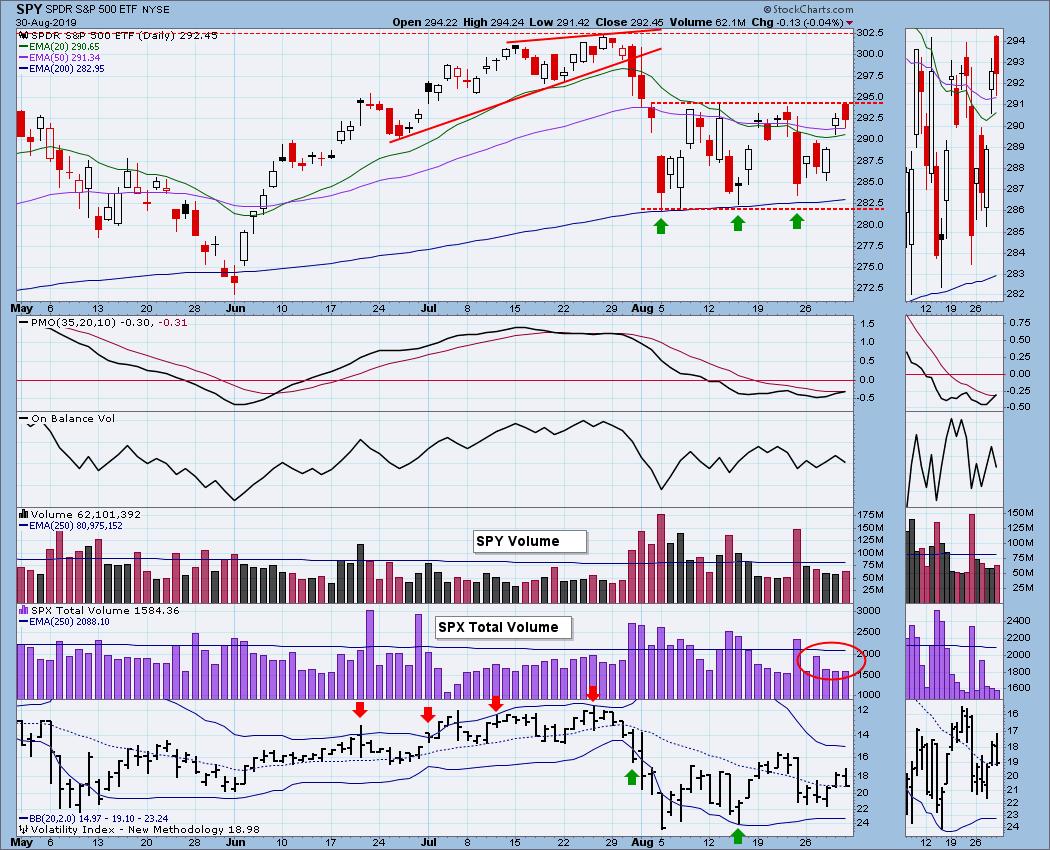
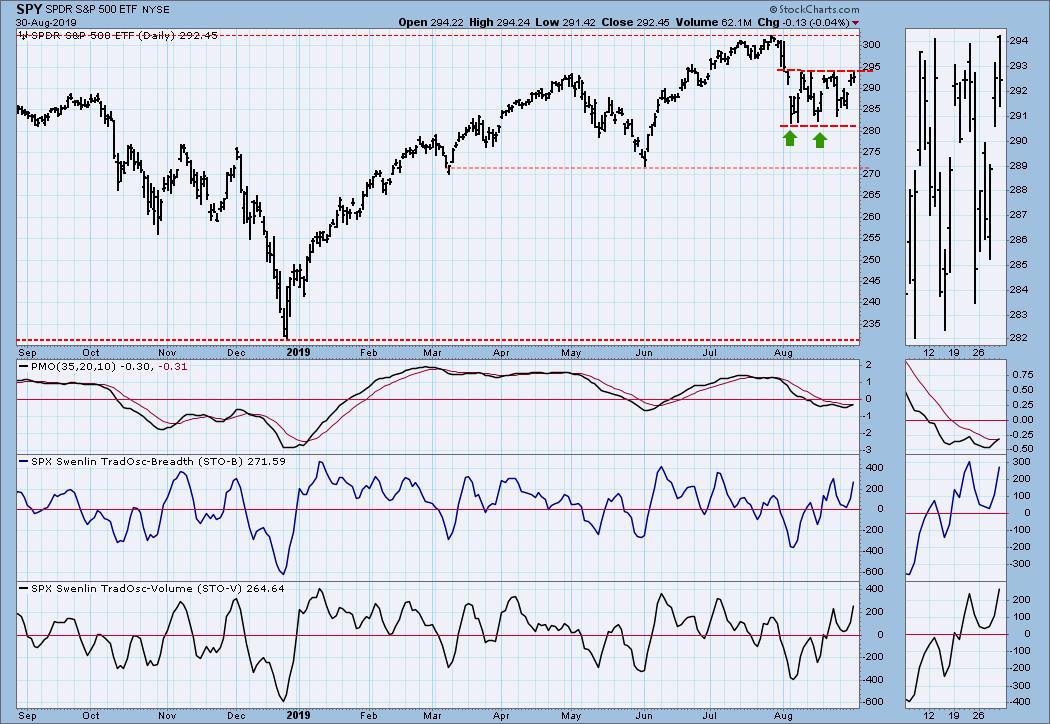
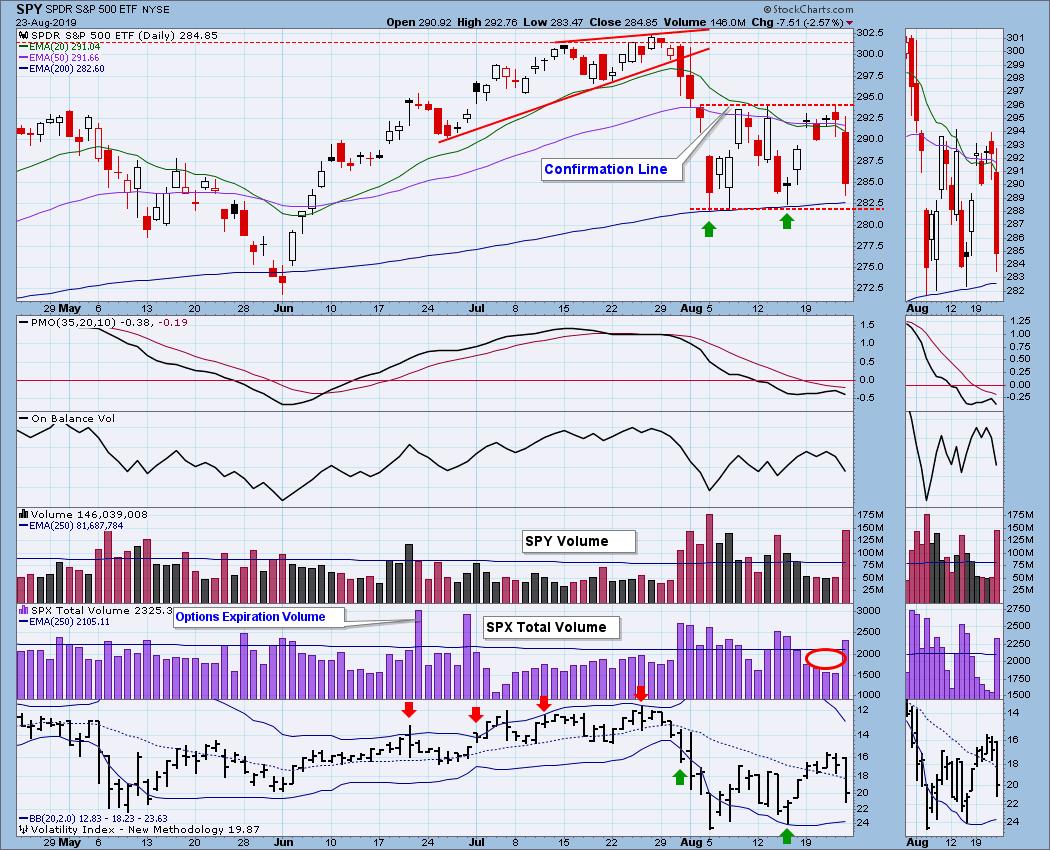
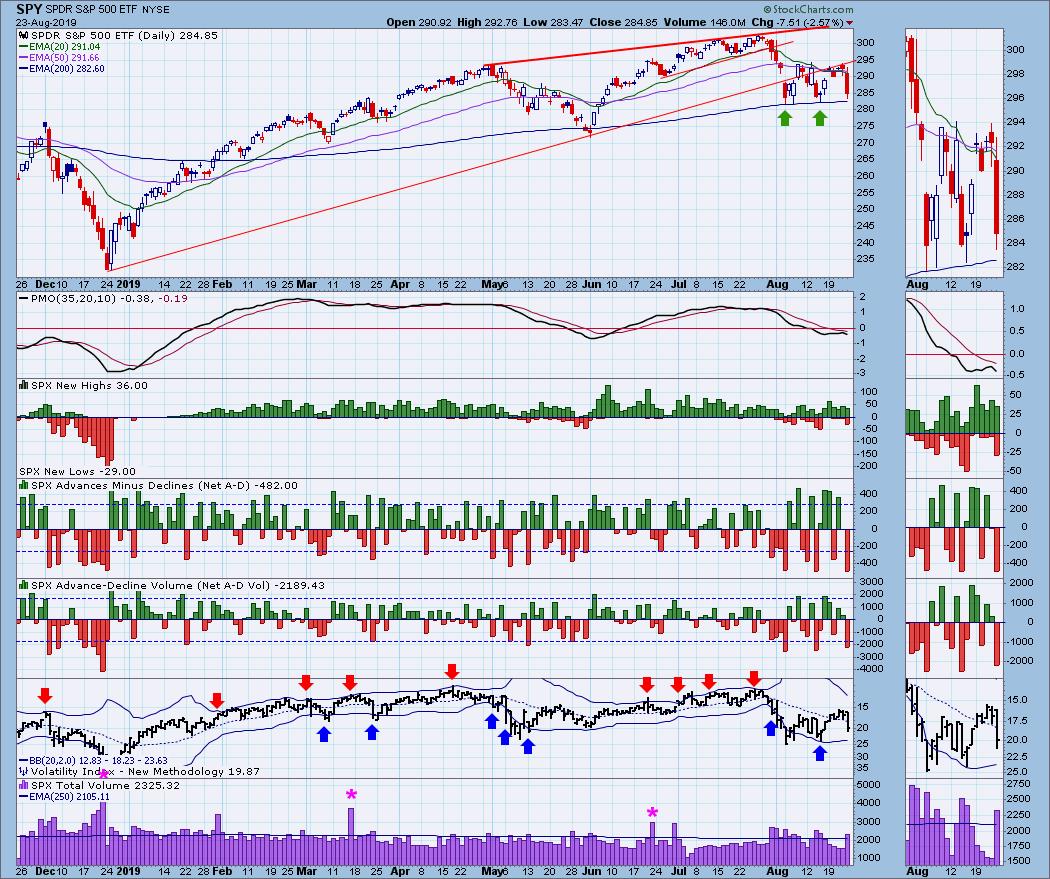
SPY Daily Chart: Except for the first trading day, price in the month of August has been locked in 4.2% trading range, where it went nowhere in an interesting fashion. There were an abundance of big up days and big down days. While the market didn't break down from the trading range, it also couldn't manage to break out of it either. Since this continuation pattern has formed subsequent to the breakdown from the July price top, we must assume that the ultimate resolution should be downward.
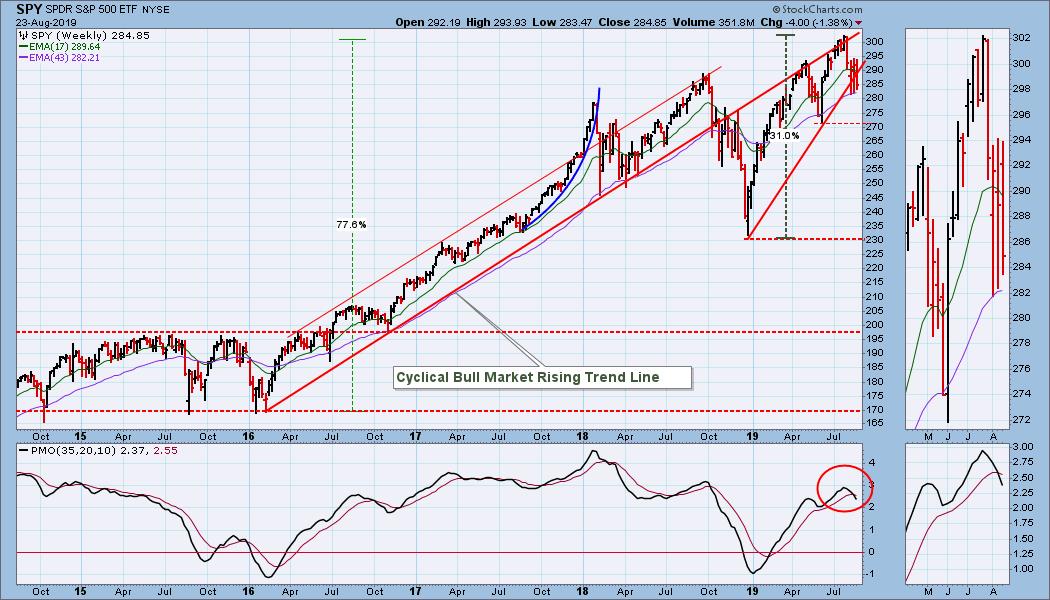
SPY Weekly Chart: The weekly PMO slowed its descent because of the price advance this week, but it is still below the signal line and falling, a very negative configuration.

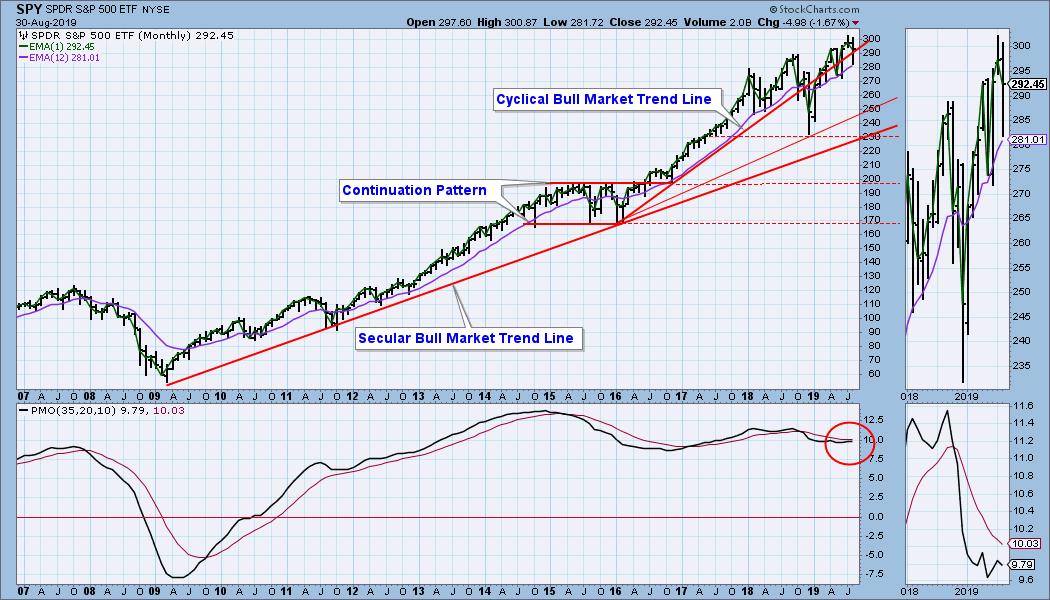
SPY Monthly Chart: The monthly PMO is also below the signal line and falling. We note that there have been a number of PMO direction changes this year, so the most recent is not necessarily decisive.
Climactic Market Indicators: There have been a large number of net breadth and net volume climaxes this month, but none of them have initiated a durable change of direction. The Bollinger Bands are beginning to squeeze the VIX, which means to me that we will see a resolution of the market's trading range sooner than later.
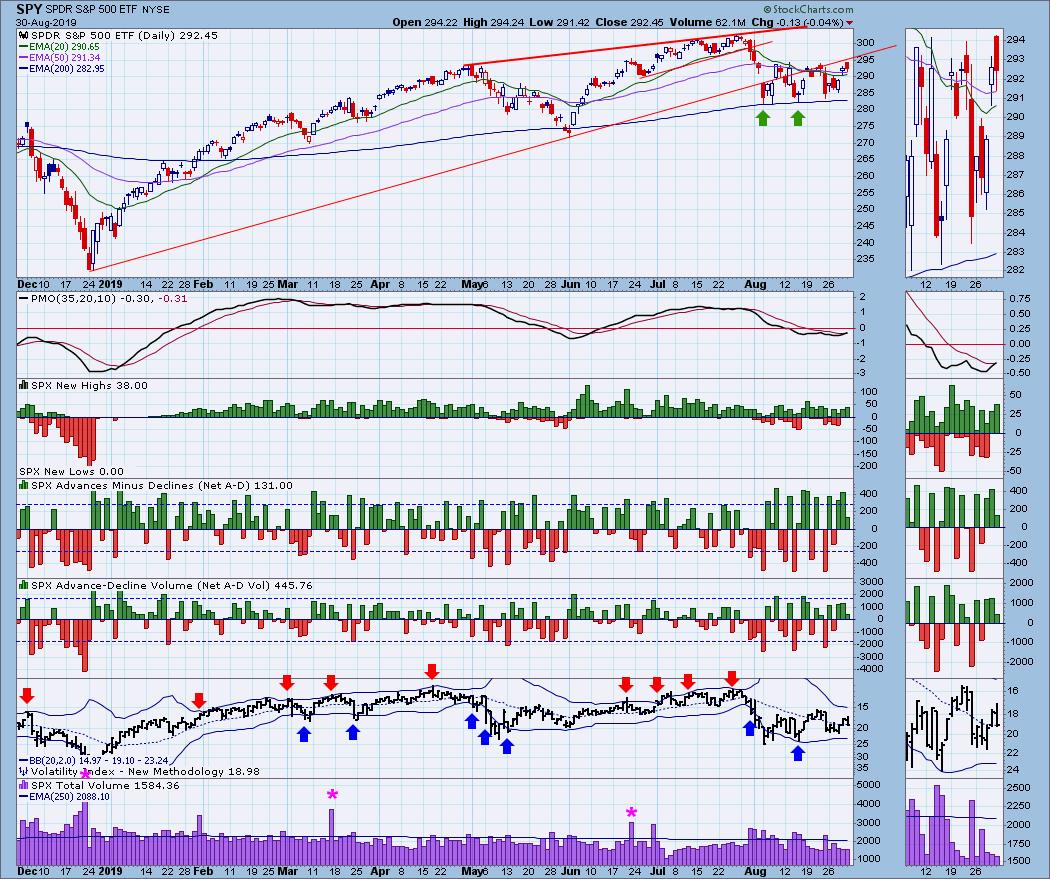
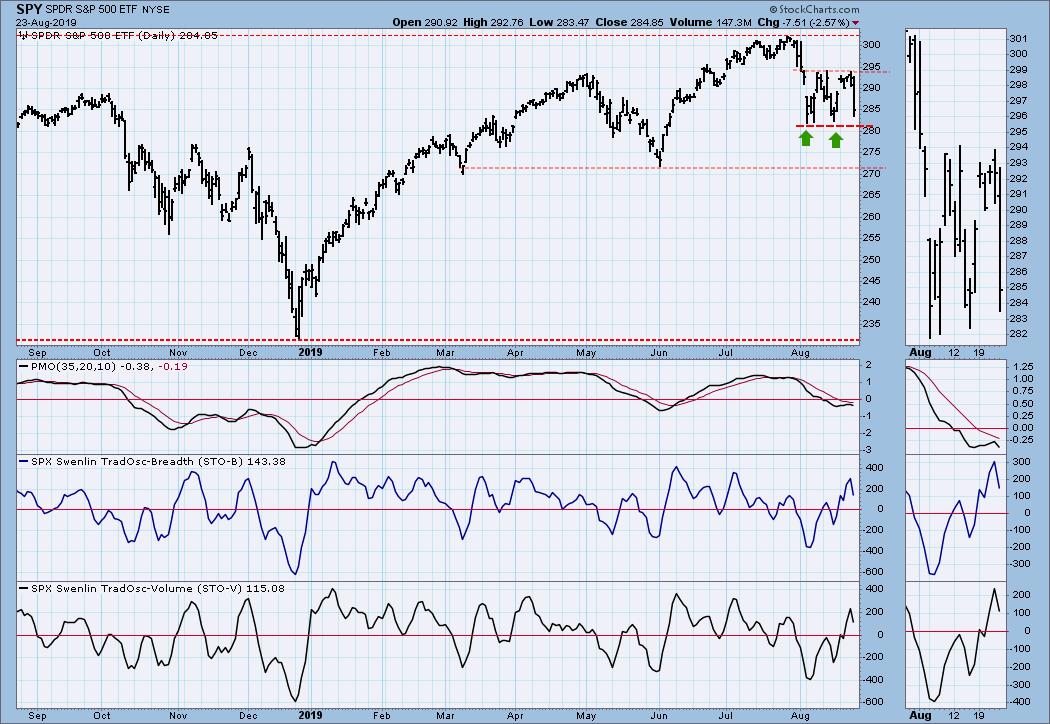
Short-Term Market Indicators: The STO-B and STO-V are oversold again, so we should expect some weakness in this time frame.
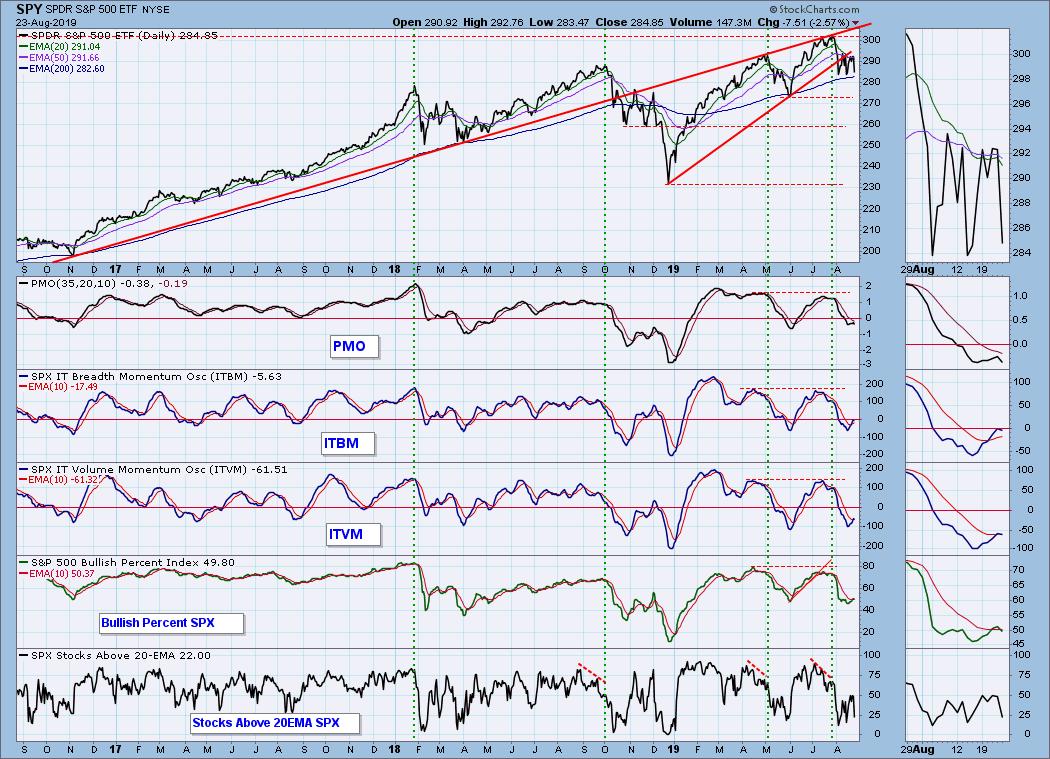
Intermediate-Term Market Indicators: These indicators are all rising, but they are also in the neutral zone. Being neither overbought or oversold, they do not, by themselves, favor any particular resolution in this time frame.
CONCLUSION: For all my skepticism regarding seasonality, it may be relevant to the current setup. The market broke down this month and entered a consolidation, aka continuation pattern. This configuration sends a message that lower prices can be expected. September's negative seasonality aligns perfectly with this expectation, and it could exacerbate the negative outcome.
Read Full Story »»»
• DiscoverGold
Click on "In reply to", for Authors past commentaries
Ribbon of Highway
MiamiGent
Saturday, 08/31/19 01:11:12 PM
Re: Trueheart post# 602646
Good morning TH and thanks for asking.
For 26 years I lived on a high floor of the tallest residential building south of Atlanta, in Miami. When the hurricanes came, the building would sway.
I remember being on my knees beside the bed, the first time. There was no utility in doing so. It was just instinctual
When I began my ministry full time, about 4 years ago, I sold my condo home. I would be on the road 80% of the time if I did it right, so I made myself uncomfortable. No place to go nest. Go out and do it!
The hotels were disappointing for a variety of reasons and I needed an occasional break from my RV so I've been renting the first floor of a beautiful, large southern cracker home in Miami from a long time acquaintance. Think a Hemingway home with all the wood trim and floors, heavy yard plantings and cats.
We could not be more unlike in some ways- she an ultra liberal Bronx Jewish studio 54 era single women, me a devout Irish catholic conservative from Boston. She lives upstairs and somehow we've got along for years.
I'm her foil. She'll say, "yeah, your Trumpy……"- fill in the blank, something awful. Or, "your Fox News...".
I've mastered the art of changing her train of thought
It's a solid wood frame home with a stone foundation and plenty of canopy. She has an Evangelical Columbian caretaker who lives in a buildling out back who puts up the storm shutters, etc for her.
Now that I am living this life, I love getting rid of things. There's a real joy in being free of encumberences, riding the ribbons of highway across our beautiful country.
Dow Jones Industrials Index (DJIA) - Knee Jerk Low »» Monthly Summary Analysis
By: Marty Armstrong | August 31, 2019
THE ANALYSIS PER THE CLOSE OF Fri. Aug. 30, 2019: Dow Jones Industrials closed today at 2640328 and is trading up about 13% for the year from last year's closing of 2332746. This price action here in September is reflecting that this is within the scope of a bearish reactionary move on the monthly level thus far.
Up to now, the market remains bullish on the short-term levels of our indicators while the long-term trend is neutral and our cyclical strength is bearish.
During this year, we have exceeded last year's high thereby making a new historical major high to date and we have been in a bull market for a reasonable period of 10 years.
Meanwhile, our technical resistance stands at 2818645 and it will require a closing above this level to signal a breakout of the upside is unfolding. Nevertheless, our technical support lies at 1881635 which is still holding at this time. At this moment, the market remains between these two projections leaving it neutral on a technical basis.
A possible change in trend appears due come November in Dow Jones Industrials so be focused. The last cyclical event was a high established back during July. Normally, this implies that the next turning point should be a low. However, the market has been neutral for right now, so caution is advisable. Watch the short-term trading levels for a hint of the next directional move into that target time frame. Last month produced a low at 2533960 but closed on the positive side and we need to penetrate that level on a monthly closing basis to suggest perhaps a further decline.
Critical support still underlies this market at 2606258 and a break of that level on a monthly closing basis would warn that a sustainable decline ahead becomes possible. Immediately, the market is trading within last month's trading range in a neutral position. Overall on a broader basis, looking at the monthly level on our models, this market is currently in a rising trend. We see here the trend has been moving up for the past 8 months. The previous low of 2171253 made during December 2018 on the Monthly level. The previous high made during July on the Monthly level at 2739868 remains significant technically and only exceeding that level on a closing basis would suggest a reversal in the immediate trend. However, we still remain below key resistance 2669596 on a closing basis.
• DiscoverGold Stay Away from These Stocks in September
By: Schaeffer's Investment Research | August 30, 2019
• One oil stock, in particular, tends to have a rough month
• MPC stock has averaged the steepest loss of all eligible SPX components
We recently outlined the 25 best stocks to own in September, historically, with Southwest Airlines (LUV) enjoying some of the best returns over the past decade. Today, however, we're taking a look at the stocks that tend to slide in September, with oil-and-gas concern Marathon Petroleum Corp (NYSE:MPC) logging the steepest average loss of all eligible S&P 500 Index (SPX) stocks.
Below are the 25 worst stocks to own in September, looking back 10 years, courtesy of Schaeffer's Senior Quantitative Analyst Rocky White. As you can see, MPC has averaged a monthly loss of 5.28%, and has ended September higher just a quarter of the time.

Marathon Petroleum stock has spent 2019 in a channel of lower highs and lows, with rally attempts stalling around its 120-day moving average. The security touched an annual low of $43.96 earlier this month, and was last seen trading around $49.09. Another 5.28% drop from current levels would put MPC around $46.50 heading into October.

Despite dropping more than 40% over the past year, MPC remains beloved among analysts. In fact, the security has racked up 13 "buy" or better endorsements, compared to just one "hold" and not a single "sell." Meanwhile, the consensus 12-month price target of $77.88 represents a steep 58% premium to current levels. Should MPC extend its downward slump amid seasonal headwinds, a flood of downgrades and price-target reductions could exacerbate selling pressure on the shares.
Options buyers also remain enamored of Marathon Petroleum. The equity sports a 10-day call/put volume ratio of 4.43 on the International Securities Exchange (ISE), Cboe Options Exchange (CBOE), and NASDAQ OMX PHLX (PHLX), meaning traders have bought to open more than four MPC calls for every put in the past two weeks. This ratio is higher than 68% of all other readings from the past year, pointing to a slightly healthier-than-usual appetite for bullish option bets during the past two weeks. An exodus of option bulls could also weigh on the oil stock.
Read Full Story »»»
• DiscoverGold
A Dynamic Stock?
By: Greg Schnell | August 30, 2019
One of the industry groups that hit a new high this month was the Aerospace and Defence industry group ($DJUSAE). That chart looks beautiful.
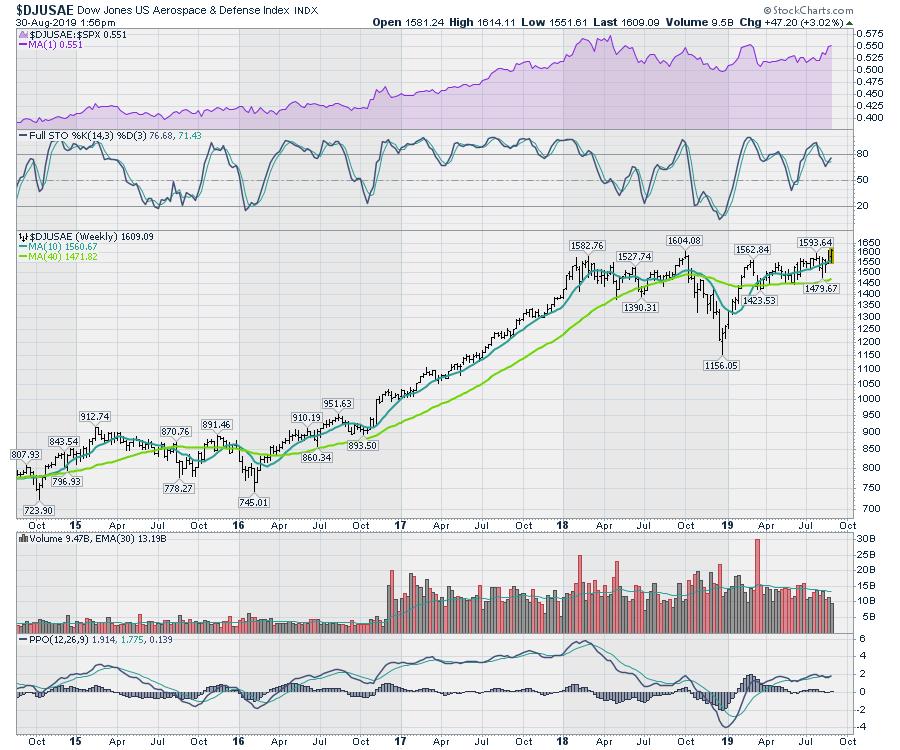
Looking through the charts in that industry group, Northrop Grumman (NOC) has been roaring higher. But another chart setting up nicely right now is General Dynamics (GD). The chart made new 2019 highs this week!
The SCTR is trying to get up into the top 25%, showing strength compared to the other big performers in the large-cap space. The relative strength to the S&P 500 broke the down trend in late July. The stock wobbled in August, but now looks set to move up.
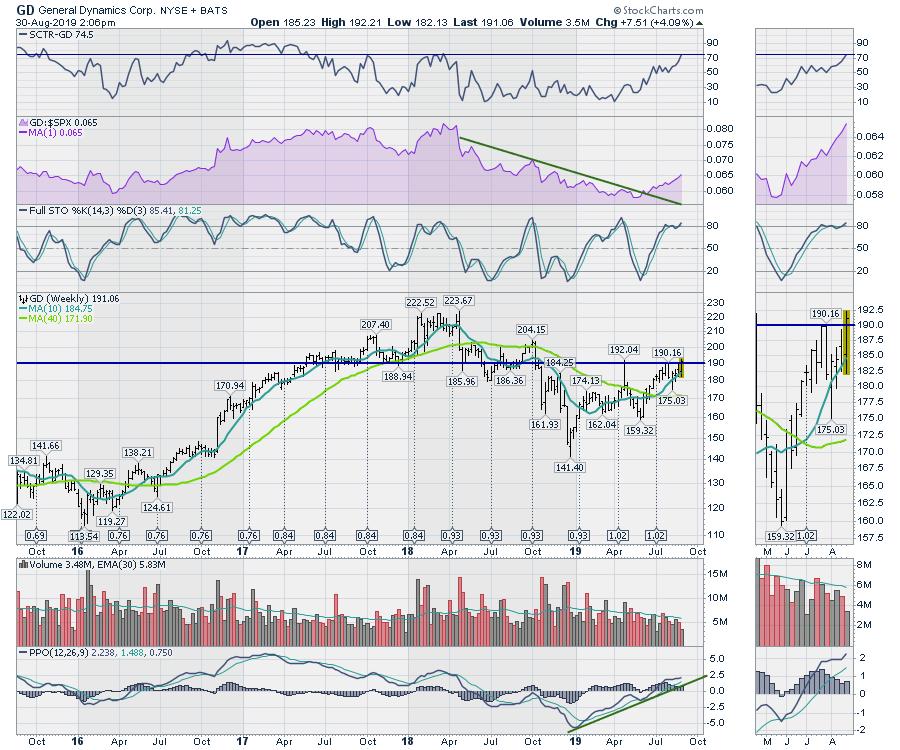
With the NYSE Advance-Decline Line hitting fresh cumulative highs here, it looks like this market still wants to move to the upside. I'll have more information on the Canadian Technician weekend market review.
Good trading,
Greg Schnell, CMT, MFTA
Read Full Story »»»
• DiscoverGold
Signal Says to Ditch This Shipping Dud Before Things Get Worse
By: Schaeffer's Investment Research | August 30, 2019
• FedEx has struggled over the past 12 months
• The shipping name is approaching the historically bearish 70-day trendline
Shipping giant FedEx Corporation (NYSE:FDX) is trading 1.3% higher at $159.46 today, a rarity for the stock, as its long-term performance has a grim history. The stock has shed 35% over the past 12 months, touched a three-year bottom of $147.82 on Wednesday, and is now seeing pressure from a historically bearish trendline. Below, we will explore data from Schaeffer's Senior Quantitative Analyst Rocky White that reveals why FedEx stock may be eyeing its next leg lower.
Specifically, the security just rose to within one standard deviation of its 70-day moving average, after a lengthy stretch below the trendline. This signal has flashed four times in the past few years, per White, resulting in an average 15-day loss of 10.9%, with not a single one of the returns positive. A similar plunge would put FDX back near $142 -- a more than three-year low.

Call buying has been a favorite of options traders. Data from the International Securities Exchange (ISE), Cboe Options Exchange (CBOE), and NASDAQ OMX PHLX (PHLX) shows FDX with a 50-day call/put volume ratio of 1.65, which ranks in the 75th annual percentile. This indicates nearly two calls have been purchased for every put during the last two weeks on the equity, leaving plenty of room for put traders to enter the ring.
Analyst downgrades are also looking inevitable on the shipping stock. Ten of 17 brokerage firms sport a "buy" or better rating on FDX, while its average 12-month price target of $187.84 is sporting an almost 17.95% premium to current trading levels.
Read Full Story »»»
• DiscoverGold
2 Reasons to Like Costco Stock Next Month
By: Schaeffer's Investment Research | August 29, 2019
• COST could finally topple $300 in September
• COST stock typically outperforms during Labor Day week and the month of September
Costco Wholesale Corporation (NASDAQ:COST) has been in focus this week, after the company's grand opening in Shanghai, China, drew frenzied crowds -- so big, in fact, the retailer had to shutter the store early on Tuesday. COST stock is trading around $296.15, at last check, a chip-shot from its Aug. 28 record high of $299.95. What's more, shares of the bulk retailer could hit that elusive $300 mark in September, if past is precedent.
For starters, Costco stock is one of the 25 best S&P 500 (SPX) stocks to own during Labor Day week, looking back 10 years. Stocks had to have at least eight years' worth of returns to make the list, which was cultivated by Schaeffer's Senior Quantitative Analyst Rocky White. COST has generated a healthy average return of 1.4%, and has ended the week higher 80% of the time.
If that's not enough, then there's the stock's penchant for big gains in the entire month of September. According to White, COST is also one of the 25 best stocks to own in September, looking back 10 years. The stock has ended the month higher 90% of the time, averaging a healthy one-month gain of 4.1% -- good for fourth best on the list. A 4% pop by the end of September would put Costco stock around $308 -- uncharted territory.
The security is no stranger to upside moves, though, having added 45% year-to-date, with pullbacks this summer contained by its ascending 50-day moving average. And, after enjoying its best single-session percentage gain since March on Tuesday -- when the aforementioned Shanghai store opened -- COST is now pacing for its fourth straight win.

Options traders are expecting more short-term upside, at least. At last check, 23,000 calls have already changed hands -- double the normal amount, and volume pacing for the 97th percentile of its annual range. Sure enough, there is activity around the weekly 9/6 300-strike call, with buyers expecting COST to top $300 by the close next Friday, Sept. 6, when the options expire.
This call bias is nothing new, though. At the International Securities Exchange (ISE), Cboe Options Exchange (CBOE), and NASDAQ OMX PHLX (PHLX), Costco's 10-day call/put volume ratio of 2.73 not only indicates bought calls have more than doubled puts in the last two weeks, but the ratio ranks in the 100th annual percentile, meaning calls have been bought to open over puts at a highly accelerated clip.
Read Full Story »»»
• DiscoverGold
Lipper US Equity Fund Outflows -$7.3 Billion; Taxable Bond Fund Inflows $5 Billion
By: Thomson Reuters | August 28, 2019
FUND FLOW REPORTS FOR THE WEEK ENDED 08/28
For the week ended 08/28/2019 ExETFs - All Equity funds report net outflows totaling -$4.981 billion, with Domestic Equity funds reporting net outflows of -$3.061 billion and Non-Domestic Equity funds reporting net outflows of -$1.920 billion...ExETFs - Emerging Markets Equity funds report net outflows of -$0.487 billion...Net inflows are reported for All Taxable Bond funds of $5.020 billion, bringing the rate of inflows for the $3.052 trillion sector to $2.625 billion/week...International & Global Debt funds posted net inflows of $0.179 billion...Net inflows of $3.475 billion were reported for Corp-Investment Grade funds while High Yield funds reported net inflows of $0.689 billion...Money Market funds reported net outflows of -$16.235 billion...ExETFs - Municipal Bond funds report net inflows of $1.245 billion.
Read Full Story »»»
• DiscoverGold
CNBC
August will likely conclude as just the second negative month of 2019, but a month-end rally is set to continue today as U.S. stock futures showed strong gains. The Thursday close for the Dow was the highest since Aug. 8, and the two-day gains for the Dow and S&P 500 are their largest since early June. Both have slashed their August deficits to about 1.9%, and the Dow, S&P 500, and Nasdaq are all set to break a string of four consecutive weekly losses. (CNBC)
On today's economic calendar, the government releases July personal income and consumer spending at 8:30 a.m. ET. The Chicago purchasing managers index is out at 9:45 a.m. ET, along with the University of Michigan's final August consumer sentiment index at 10 a.m. ET. Campbell Soup (CPB) and Big Lots (BIG) are out with quarterly earnings this morning, with no reports scheduled after today's closing bell. (CNBC)
Shares of Ulta Beauty (ULTA) were losing about a quarter of their value in premarket trading, after the cosmetics retailer lower its forward earnings guidance. Ulta's quarterly same-store sales increased less than expected. Earnings also missed estimates. Revenue was essentially in line. (CNBC)
The opening hour of CNBC's "Squawk on the Street" is now a podcast. Listen to market moving news and interviews on the go. And just a reminder that today is still a full market day, ahead of the long weekend. We'll be back in your inbox Tuesday morning after Labor Day with the day's news.
IN THE NEWS TODAY
Hurricane Dorian is expected to strengthen into a dangerous Category 4 storm in the coming days as it heads toward Florida's Atlantic coast. No evacuations were ordered as of this morning, but many are expected as the storm's path becomes clearer before it makes landfall on Labor Day or early Tuesday. The entire state of Florida is under a declaration of emergency. (Reuters)
* Airlines brace for Dorian as storm threatens to snarl Labor Day weekend travel (CNBC)
The U.S. and China are giving signs that they will resume trade talks as the two economic superpowers discussed the next round of in-person negotiations in September, ahead of Sunday's looming deadline for new U.S. tariffs on additional China imports. (Reuters)
Electric vehicle maker Tesla (TSLA) raised prices for some vehicles in China as the yuan trades at its weakest levels in more than a decade. The U.S.-China trade frictions and a tit-for-tat tariff war between the countries has prompted Tesla, which currently imports all the cars it sells in China, to adjust its prices multiple times over the past year. (Reuters)
Huawei will launch a new flagship phone next month which may not come with Google apps, a source told CNBC, as the Chinese firm faces being blocked from accessing the search giant's software. Huawei is pushing ahead with the launch despite being on a U.S. blacklist known as the Entity List that restricts U.S. firms from doing business with Huawei.
* US prosecutors probe Huawei on new allegations of technology theft (WSJ)
* Chinese ride-hailing giant Didi plans to launch a robotaxi service in Shanghai (CNBC)
Disney (DIS) announced it has sold its stake in the YES Network to an investor group including Amazon (AMZN). The investor group, which also includes the Yankees and Sinclair Broadcast Group (SBGI), acquired the 80% stake of the YES Network that was not already held by the Yankees. (CNBC)
The Federal Trade Commission is reportedly investigating whether e-cigarette maker Juul used deceptive marketing and targeted minors. Regulators have criticized Juul for fueling a teen vaping "epidemic," scrutinizing the company's early advertising campaigns that used young models and bright colors that positioned Juul as a lifestyle brand. (CNBC)
* Juul faces heightened scrutiny, Illinois and DC launch probes (AP)
STOCKS TO WATCH
Dell Technologies (DELL) reported adjusted quarterly profit well above the consensus estimates, along with strong revenue. Dell also said it is successfully mitigating the impact of tariffs imposed by the U.S. and China.
General Electric (GE) won a partial dismissal of a shareholder lawsuit that had accused it of fraudulent accounting. The judge did give shareholders permission to amend their complaint.
Workday (WDAY) reported better-than-expected adjusted quarterly profit, while the maker of human resources and financial software also saw revenue come in above forecasts. Workday saw subscription revenue jump 34% during the quarter, and gave a strong forecast for current quarter subscription revenue.
Groupon (GRPN) is being targeted by activist investors, according to the Wall Street Journal. The paper said those investors are hoping to persuade management to buy back stock, enter a strategic partnership, or sell the company
CONTRIBUTORS
Jessica Bursztynsky
@jbursz
Peter Schacknow
@peterschack
Money managers Reduced their exposure to the US Equity markets since last week...
• DiscoverGold
NAAIM Exposure Index
* August 28, 2019 
The NAAIM Number
59.99
Last Quarter Average
77.30
»»» Read More…
Click on "In reply to", to see The NAAIM Number from prior weeks
CNBC
Falling yields and the U.S.-China trade dispute haven't disappeared, but concern over them apparently has, at least temporarily. U.S. stock futures were pointing to a strong open on Wall Street, following gains yesterday, after China said it wished to resolve its protracted trade dispute with the world's largest economy with a "calm" attitude. The Wednesday advance put the Dow on track for its strongest weekly gain in 10 weeks, and the Dow, S&P 500, and Nasdaq are all on pace to break a string of four consecutive losing weeks. (CNBC)
* Why record low bond yields could keep heading lower as market fears 'disaster scenario' (CNBC)
* Chip industry is facing 'major uncertainty' as global tensions rise (CNBC)
On today's economic calendar, the government releases its second reading of second-quarter GDP at 8:30 a.m. ET. At the same time, the Labor Department is out with its weekly look at initial jobless claims.The National Association of Realtors issues its July report on pending home sales at 10 a.m. ET. (CNBC)
Retailers Best Buy (BBY), Abercrombie & Fitch (ANF), Dollar General (DG), and Dollar Tree (DLTR) are out with quarterly earnings this morning, along with poultry producer Sanderson Farms (SAFM). This afternoon, Ambarella (AMBA), American Outdoor Brands (AOBC), Dell Technologies (DELL), Ulta Beauty (ULTA), and Workday (WDAY) release quarterly numbers after today's closing bell. (CNBC)
IN THE NEWS TODAY
China sent a fresh batch of troops into Hong Kong today, and its military issued a statement saying its Hong Kong Garrison will "resolutely follow" the central government's instructions. It came as the Asian financial center continues to grapple with weeks of pro-democracy protests, that sometimes turned violent. (CNBC)
* With Hong Kong in turmoil, questions grow over refusal to offer concessions (Washington Post)
Hurricane Dorian took aim at the Florida coast early today. Dorian sideswiped the Caribbean sparing Puerto Rico and the Virgin Islands with only limited damage. However, with the storm strengthening, the Bahamas and Turks and Caicos Islands lay in its path. (Reuters)
The Trump administration is reportedly set to announce today it's rolling back regulation of methane emissions, a major contributor to climate change. The EPA is looking to eliminate requirements to inspect for and repair methane leaks from wells, pipelines and storage facilities. (NY Times)
* How Amazon's shipping empire is challenging UPS and FedEx (WSJ)
Apparel retailer Forever 21 is considering filing for bankruptcy as efforts to restructure its debt run dry. It could not be immediately determined whether the company has begun to raise a so-called debtor-in-possession loan that would fund a potential bankruptcy, and it is still possible the company is able to avoid a filing. (CNBC)
Walt Disney's (DIS) projections for its Disney+ streaming service may have been too modest, after 43% of households responding to a UBS survey said they intended to subscribe to the service. Disney's own projections have predicting 20% to 30% of households would subscribe by 2024. (Yahoo Finance)
Elon Musk, who runs Tesla and SpaceX, said that computers are getting smarter than humans in more and more spheres and that the trend will continue. "We will be far, far surpassed in every single way. I guarantee it," said Musk, who has repeatedly warned about the dangers of artificial intelligence. (CNBC)
STOCKS TO WATCH
Williams-Sonoma (WSM) reported better-than-expected adjusted quarterly earnings and revenue. Comparable store sales were up 6.5%, nearly double the 3.3% consensus estimate of analysts surveyed by Refinitiv. The company also raised its full-year guidance.
PVH (PVH) beat estimates with adjusted quarterly earnings and revenue. However, the company behind clothing brands like Calvin Klein also cut its full year profit forecast for the second time this year, with results coming under pressure from the U.S.-China trade dispute and unrest in Hong Kong.
Guess (GES) exceeded Wall Street forecasts with its adjusted quarterly profit and revenue. The company credits stronger sales and improved expense management, among other factors.
WATERCOOLER
If you're planning a getaway for Labor Day weekend, brace yourself for some heavy traffic. Today from 4 p.m. to 6 p.m. will be the worst day and time to hit the road as people look to get a head start on the long weekend. Tomorrow afternoon, especially from 1 p.m. to 4 p.m., for those on their way out of town, and Monday morning, 7 a.m. to 10 a.m., when people start return trips, will also be congested. (USA Today)
CONTRIBUTORS
Jessica Bursztynsky
@jbursz
Peter Schacknow
@peterschack
Disney Streaming Survey Surprise Sparks Bullish Options Trading
By: Schaeffer's Investment Research | August 29, 2019
• Results from UBS suggested more households than expected plan to subscribe to Disney+
• One speculator sees more upside ahead for the Dow stock
The shares of Walt Disney Co (NYSE:DIS) are trading higher today following positive results from a recent survey regarding the entertainment powerhouse's Disney+ streaming service. Specifically, the projections for the number of U.S. households that plan to subscribe to Disney+ looks to be more than double what the company previously expected, per a recent UBS survey.
Disney projected 20% to 30% of broadband households would sign up for Disney+ by 2024, while the survey indicated up to 43% of consumers intend to subscribe. In response, DIS is up 0.9% at $137.80, at last check.
DIS has charged up the charts in 2019, so far having added 26%, with recent support emerging at the 120-day moving average. The shares saw an impressive streaming-related bull gap back in April, which paved the way to the stock's July 29 record high of $147.15.
At least one options trader today is betting on even more upside for the Dow stock in the near term. Amid accelerated activity -- the 20,000 calls on the tape so far is 1.5 times what's typically seen at this point -- a 1,000-contract block of weekly 9/13 140-strike calls was bought to open for $140,000 (number of contracts * $1.40 premium paid * 100 shares per contract).
This is the most the call buyer stands to lose, should DIS settle below $140 at the close on Friday, Sept. 13. Profit, meanwhile, will accumulate on a move above breakeven at $141.40 (strike plus premium paid).
Read Full Story »»»
• DiscoverGold
CNBC
U.S. stock futures have moved in a narrow range between gains and losses this morning, following a Tuesday session that saw stocks give up a chunk of their Monday gains as bond yields fell. The Dow has now fallen in two of the past three sessions, with the S&P 500 and Nasdaq lower in three of the past four trading days. Utilities have been the biggest trend-bucker of the month, with the S&P 500 Utilities sector by far the strongest sector performer of the month, and the Dow Jones Utilities currently at a record high. (CNBC)
* Key yield curve inverts even further as 30-year yield hits new record low (CNBC)
* Yuan hit an 11-year low this week.
On today's U.S. economic calendar, the Mortgage Bankers Association is out with its weekly look at mortgage applications at 7 a.m. ET, while the Energy Department issues its weekly report on oil and gasoline inventories at 10:30 a.m. ET. (CNBC)
Luxury goods retailer Tiffany (TIF), spirits maker Brown-Forman (BF.B), clothing retailer Chico's FAS (CHS), and watch maker Movado Group (MOV) are out with quarterly earnings this morning. H&R Block (HRB), Box (BOX), Five Below (FIVE), Guess (GES), Okta (OKTA), PVH (PVH), and Williams-Sonoma (WSM) issue quarterly reports after today's closing bell.
IN THE NEWS TODAY
Purdue Pharma and its owners, the Sackler family, are offering to settle more than 2,000 lawsuits against the company for up to $12 billion. Lawsuits against the company and the Sackler family say they are responsible for starting and sustaining the opioid crisis. The potential deal was discussed by Purdue's lawyers at a meeting, NBC News reported.
Chinese spies reportedly have been using LinkedIn, the only major American social media platform not blocked in China, to seek out potential new foreign recruits. LinkedIn is ideal for espionage recruitment because it's a platform where millions of people are looking for jobs. (CNBC)
Alphabet's Google (GOOGL) is shifting its Pixel smartphone production to Vietnam from China starting this year as it builds a cheap supply chain in Southeast Asia, the Nikkei business daily reported today. The move comes as labor costs are rising in China along with added pressure from spiraling tariffs due to the ongoing China-U.S. trade tensions. (CNBC)
* Google is facing another EU antitrust probe (CNBC)
* Google shut down the product it acquired with ex-cloud leader (CNBC)
* Facebook tightens rules for US political advertisers ahead of 2020 election (CNBC)
* Puerto Rico braces for storm Dorian, one of first tests since 2017 (Reuters)
* Trump pushes to allow new logging in Alaska's Tongass National Forest (Washington Post)
Peloton, best known for at-home fitness equipment and accompanying streaming fitness services, revealed growing sales but widening losses ahead of its IPO, in documents filed with regulators. The fitness company expects to raise $500 million in its offering. (CNBC)
SpaceX flew its prototype rocket many times higher and longer than ever before in a test, pushing the company one step closer to its dream of sending humans and cargo to Mars. The company is building the enormous rocket to achieve its goal of transporting up to 100 people in the space flights. (CNBC)
STOCKS TO WATCH
Toyota Motor (TM) said it would form a capital alliance with fellow Japanese automaker Suzuki, to help accelerate technological development. Toyota will take a 4.9% stake in Suzuki as part of the deal, while Suzuki will receive around 0.2% or Toyota's outstanding shares.
Intel (INTC) and its private equity partners may list cybersecurity company McAfee this fall at a valuation of at least $8 billion, according to a Bloomberg report.
Hershey (HSY) is buying nutrition bar maker ONE Brands in a deal worth about $325 million, complementing its existing Oatmega nutrition bar business. Hershey expects to complete the deal by the fourth quarter of this year.
Papa John's (PZZA) was upgraded to "buy" from "hold" at Stifel Nicolaus, which points to the naming of former Arby's President Rob Lynch as its new Chief Executive Officer. Stifel also raised its price target on the pizza chain's stock to $60 per share from $42.
WATERCOOLER
Popeyes Louisiana Kitchen said it has sold out of its inventory of its new chicken sandwich. But the sandwich, launched Aug. 12, will back soon and for good. Popeyes have been selling out of it after a Twitter feud between Chick-fil-A. Popeyes' parent company Canada's Restaurant Brands also owns Burger King and Tim Hortons. (CNBC)
CONTRIBUTORS
Jessica Bursztynsky
@jbursz
Peter Schacknow
@peterschack
Daily Market Watch »» Stock Indices Daily Trend
By: Marty Armstrong | August 28, 2019
• Dow Jones Industrials Index Cash (DJIA) » NEUTRAL
• NASDAQ (COMP) » Still Under Pressure
• S&P 500 (SPX) » Still Under Pressure
• Russell 2000 » Outside Reversal To Dowside
• US Dollar Index (Cash) (DX) » New Pattern Forming
• NY Gold Nearest Futures » Holding
• NY Silver COMEX Futures » Pressing Higher
• NY Crude Oil Futures (CL) » CAUTION ADVISED
• DiscoverGold
TOP NEWS
Stocks erase gains as bond-market recession indicator, trade worries worsen
Key yield curve inverts to worst level since 2007, 30-year rate under 2%
China insists it is unaware of calls to Trump and says tariffs are 'extreme pressure' and 'not constructive at all'
The US is about to send a lot more oil into an already oversupplied world market
Purdue Pharma offers $10 billion - $12 billion to settle opioid claims
Roku is growing even faster than Netflix did at the same point, analyst says
Philip Morris International, Altria confirm they are in talks to reunit
CNBC PRO
CNBC
EDITOR'S NOTE
Stocks erased some earlier gains Tuesday thanks to a worsening recession indicator from the bond market — the 10-year yield hitting its lowest level against the 2-year rate since 2007.
But there’s now a new type of “inversion” that might be a good sign for equity bulls. For the first time since the financial crisis, stocks are earning more for investors than key long-term Treasury notes. The U.S. 30-year yield dropped below the S&P 500's dividend yield on Tuesday. It’s the first time since March 2009 — when the world was deep into a recession — that has happened, according to data from Bespoke Investment Group.
An inversion of any type might sound ominous, but this one is likely a good thing for stocks. For an investor aiming to hold something for the long term, equities are looking relatively attractive, according to Bespoke co-founder Paul Hickey.
“The takeaway is, if you can get an annual yield from a company that’s going to pay you more than the 30-year Treasury and the company has a history of raising its dividend, for the long term, it’s a better alternative than a Treasury,” Hickey said.
JJ Kinahan, chief market strategist at TD Ameritrade, also says the hunt for yield might help support stocks — at least in the near term. Investors will continue to seek out more “safe stocks” — particularly those in the S&P 500 that offer an attractive dividend but have less perceived downside risk in a trade-related sell-off.
Kate Rooney | CNBC Markets Reporter
@Kr00ney
CNBC
U.S. stock futures were pointing to a higher Tuesday open on Wall Street. The Dow, S&P 500, and Nasdaq rebounded with strong gains Monday. But those gains were less than half the losses posted last Friday. Both the Dow and S&P 500 were down about 3.5% for August, and now seem all but certain to post their second losing month of the year. The same is true for the Nasdaq, which was down nearly 4% this month. (CNBC)
* Wall Street sees elevated recession risk, market woes after US and China stoke trade fears (CNBC)
On today's economic calendar, the S&P/Case-Shiller Index is out at 9 a.m. ET. The Conference Board issues its August consumer confidence index at 10 a.m. ET. Meanwhile, J.M. Smucker (SJM) is one of the few companies scheduled to issue quarterly earnings this morning. Autodesk (ADSK) and Hewlett Packard Enterprise (HPE) are out with their numbers after today's closing bell. (CNBC)
* Starbucks CEO sees no signs of a looming recession: 'We're firing on all cylinders' (CNBC)
IN THE NEWS TODAY
China's foreign ministry reiterated on Tuesday that it had not heard of any recent telephone call between the United States and China on trade, and said it hopes Washington can stop its wrong actions and create conditions for talks. President Donald Trump on Monday predicted a trade deal with China. (Reuters)
An Oklahoma judge ruled against Johnson & Johnson (JNJ) in the state's opioid case, forcing the company to pay $572 million. It was the first ruling in the U.S. holding a drugmaker accountable for helping fuel the epidemic. J&J said the decision in the case is "flawed." (CNBC)
* Shares of pharma companies soar after Johnson & Johnson sees smaller-than-expected opioid fine (CNBC)
Kurt Zumwalt, Amazon's (AMZN) global treasurer, has departed after 15 years of helping manage the company's cash and overseeing investments and debt financing. His departure comes as Amazon heads into another heavy investment cycle, while facing growing concerns around the trade war and regulatory scrutiny. (CNBC)
STOCKS TO WATCH
AstraZeneca (AZN) was granted fast track approval status by the Food and Drug Administration, as it attempts to get the popular diabetes drug Farxiga approved for use in preventing heart and kidney failure for patients with chronic kidney disease.
Taiwan Semiconductor (TSM) was sued by contract chipmaker GlobalFoundries for patent infringement. GlobalFoundries is seeking to stop Taiwan Semi's customers, which include Apple (AAPL), from importing affected products to the U.S. and Germany.
Papa John's (PZZA) will name Arby's President Rob Lynch as its new chief executive officer, according to a Bloomberg report. The change could be announced as early as today.
Facebook (FB) is developing a new messaging app called "Threads," according to technology website The Verge. The app is designed to promote constant contact between users and their closest friends. It's seen as a threat to Snap's (SNAP) SnapChat.
CONTRIBUTORS
Jessica Bursztynsky
@jbursz
Peter Schacknow
@peterschack
DVA A good short that took a bit to turn the corner but now has broken through all support
https://stockcharts.com/h-sc/ui?s=DVA
Big Pharma Sees a Rising Tide in Short Interest
By: 24/7 Wall St. | August 27, 2019
Pharmaceutical companies usually are involved in a lengthy process of getting their drug candidates to market through clinical trials. There is a fair amount of risk involved, should a study come back negative or a candidate not be approved. Conversely, if a drug gains FDA approval or passes a clinical trial, there can be big upside.
The White House has promised reforms in the health care sector, such as changing the bidding process for drugs and shortening the FDA approval process. It is yet to be seen how much headway it actually can make with these reforms.
Keep in mind that short sellers betting against big pharma are taking on an added risk. They have to pay out the ongoing high dividends on top of the cost of borrowing the shares.
The August 15 short interest data have been compared with the previous figures, and short interest in most of these selected pharmaceutical stocks increased.
Short interest in Pfizer Inc. (NYSE: PFE) decreased to 55.23 million shares from the previous 67.95 million. The stock was trading at $34.84 Tuesday morning, within a 52-week range of $33.97 to $46.47.
The number of Merck & Co. Inc. (NYSE: MRK) shares short increased to 21.83 million from 18.78 million in the previous period. Its shares were trading at $85.88, in a 52-week range of $66.10 to $87.25.
Bristol-Myers Squibb Co. (NYSE: BMY) saw its short interest grow to 134.25 million shares from the previous reading of 124.02 million. Shares traded at $48.11, in a 52-week trading range of $42.48 to $63.69.
The number of shares short in AbbVie Inc. (NYSE: ABBV) climbed to 51.01 million from the previous 45.90 million. The stock was trading at $66.46, and its 52-week range is $62.66 to $98.70.
Eli Lilly and Co.’s (NYSE: LLY) short interest increased to 16.68 million shares from the previous 11.46 million. The stock was trading at $111.78. The 52-week range is $103.66 to $132.13.
Teva Pharmaceutical Industries Ltd.’s (NYSE: TEVA) short interest was 71.38 million, up from the previous level of 56.92 million. Shares were trading at $7.42, in a 52-week range of $6.07 to $25.13.
Read Full Story »»»
• DiscoverGold
$SHAK To all who followed my recommendation to short SHAK, I have an important announcement.
I have determined the fix is in on this stock and you may want to close your short position promptly.
It will be hard to win here.
Keep all you records of you have a loss.
MG
SHAK $99.43 is a short but you have to have the ability to hold as the crooked market maker has a grip on the small share structure (tiny float) and can hold it up, even goose it higher until insiders are finished unloading (which they are like banshees) or the SEC steps in.
Dilution looks very possible after that with a $170M shelf in place and a pressing need for money.
Ridiculous 195 P/E for a no moat hamburger joint already backpedling on earnings and margin.
MG
A Volatile, But Sound, Month
By: SentimenTrader | August 26, 2019
Quite A Month
We seem to be on track for another whipsaw, as markets try to recover from conflicting messages over the weekend, following a rocky end to the week.
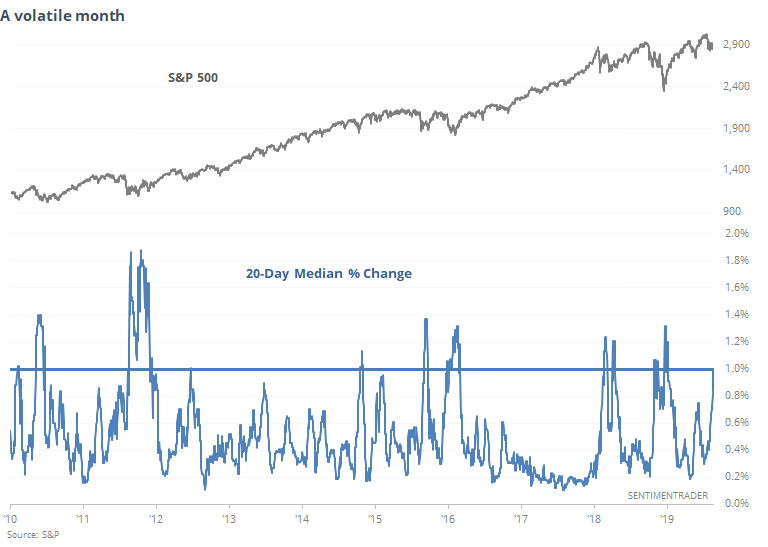
Except for the 1930s, this kind of volatility so soon after stocks were sitting at a multi-year high led to almost universally positive returns going forward, and didn't roll over into a bear market at least for the next few months.
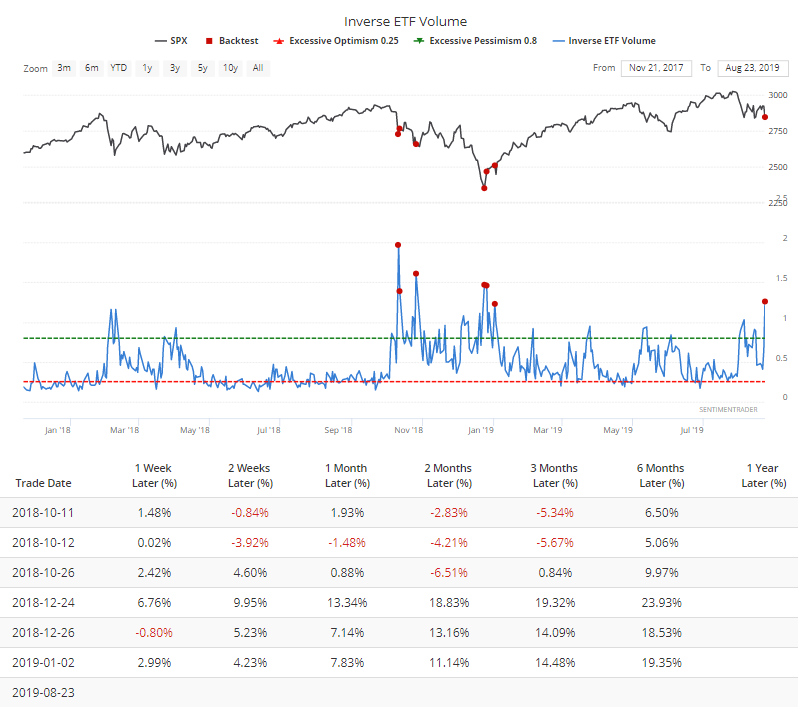
Extreme Anxiety
More of our indicators registered severe pessimism on Friday. Among them, investors rushed into inverse ETFs on Friday to protect against any potential downside this week. They accounted for more than 1.2% of total NYSE volume, one of the largest amounts in history. The others all triggered last October or December (or right away in January).
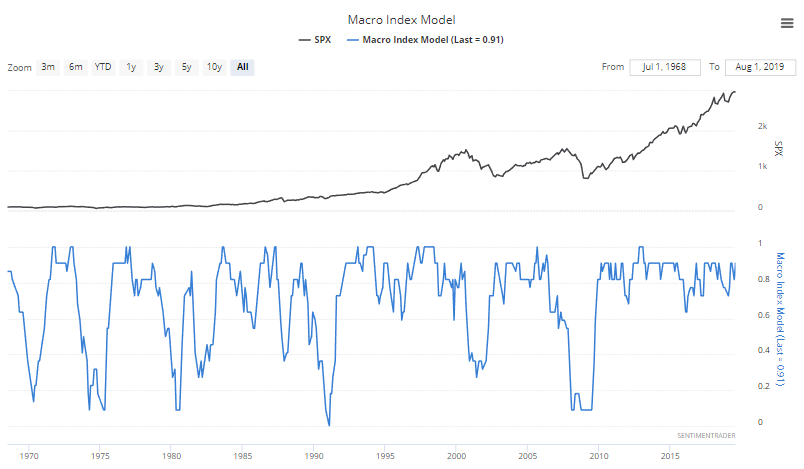
Fundamentally Sound
The economy and the stock market move in the same direction in the long term. Hence, leading economic indicators are also long term leading indicators for the stock market.
1. Leading economic indicators sometimes deteriorate significantly BEFORE a bear market begins, e.g. 2006-2007.
2. Leading economic indicators sometimes deteriorate significantly AFTER a bear market begins (e.g. 1969, 1973, 2000).
But for the cases in which leading indicators deteriorated AFTER a bear market began, the bear markets' worst parts (e.g. 2001, 1974) occurred after the leading indicators deteriorated significantly. Let's look at these leading indicators.
Here is our Macro Index, which aggregates 11 leading indicators. Overall, there is no significant U.S. economic deterioration right now. Instead of predicting the future, macro tells us how to react and trade day-by-day depending on what's happening right now.
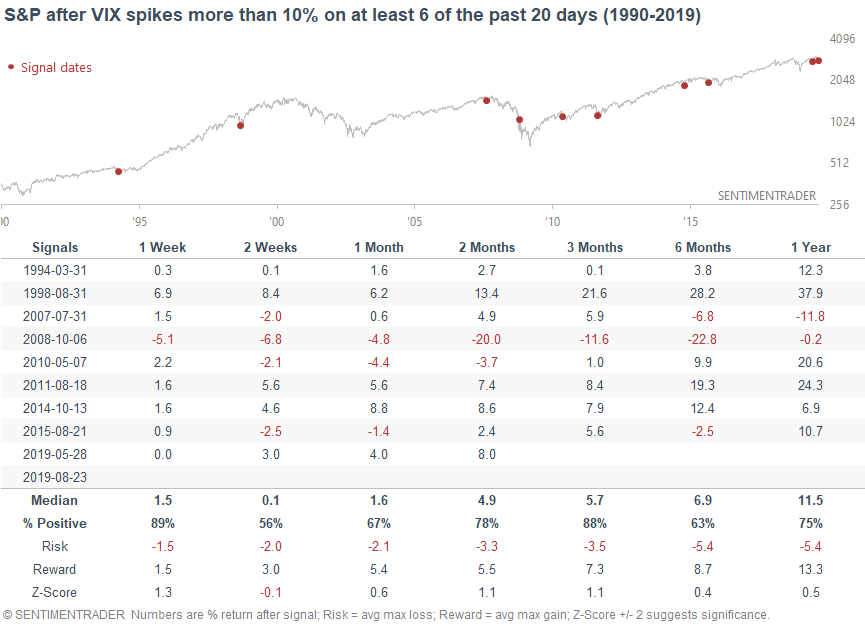
Volatility
The stock market seems to panic once every few days. 6 of the past 20 days (4 weeks) have seen daily VIX spikes > 10%.
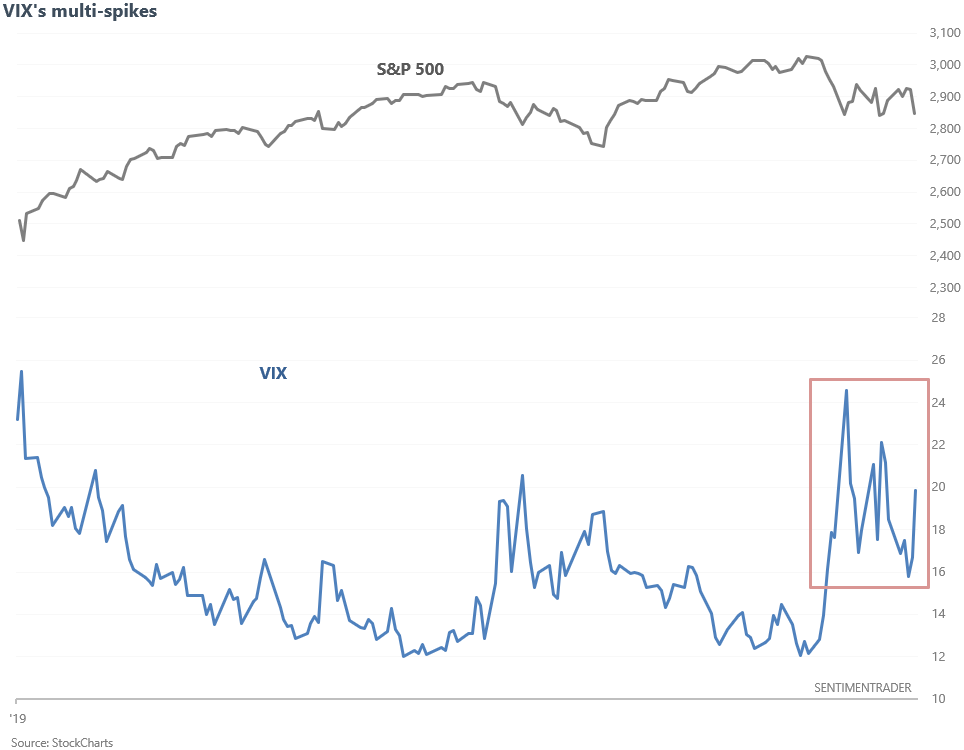
When this happened in the past, the S&P usually did well over the next 3 months. The one big exception was October 2008, which occurred during the middle of a mega-crash.
Read Full Story »»»
• DiscoverGold
CNBC
Following comments by President Donald Trump that China called and wants to return to the negotiating table on trade, U.S. stock futures erased early sharp losses and indicated a strong Wall Street open. Markets have been buffeted about on varying trade headlines for weeks, with a Friday announcement of retaliation against China sending the Dow lower by more than 600 points. (CNBC)
* Mnuchin: If China agreed to a fair relationship, we'd sign that deal 'in a second' (CNBC)
Friday's losses erased what had been a weekly gain for stocks, and the Dow, S&P 500, and Nasdaq have now each posted 4 straight weekly losses. That's also made August all but certain to be a losing month for Wall Street, although the losses are not quite as sharp as they were in May the only other month in 2019 to see declines for the Dow, S&P 500, and Nasdaq. (CNBC)
On today's economic calendar, the government is out with July durable goods orders at 8:30 a.m. ET this morning. No major companies are expected to report earnings today. (CNBC)
IN THE NEWS TODAY
Trump said today that the U.S. is close to reaching a compromise over France's digital tax. The proposed agreement would see France repay tech companies the difference between the amount collected under its current digital tax model and the amount owed by firms under a new system. (CNBC)
U.S. electric vehicle maker Tesla (TSLA) will raise prices in China on Friday, earlier than planned, and is considering increasing prices again in December should Chinese tariffs on U.S.-made cars take effect, Reuters reported. It currently imports all the cars it sells in China and has had to adjust prices multiple times over the past year due to tariff changes.
Chinese artificial intelligence firm Megvii has filed for a public listing in Hong Kong. The company is backed by e-commerce giant Alibaba and state-owned enterprises such as Bank of China Group Investment, the bank's private equity arm. Megvii sells AI products from facial recognition technology to algorithms designed for traffic management. (CNBC)
Target (TGT) announced it's opening dozens of permanent Disney (DIS) stores within its own stores over the next year, as it invests in more unique ways to lure customers inside. This Oct. 4, ahead of the holiday season, 25 Disney stores will open at certain Target stores across the country, in cities including Philadelphia, Denver and Chicago. (CNBC)
STOCKS TO WATCH
Mallinckrodt (MNK) is under scrutiny for its role in the opioid crisis, according to a Wall Street Journal report. The paper notes that the bulk of the attention surrounding opioids has focused on OxyContin maker Purdue Pharma, but that other drug makers like Mallinckrodt are drawing more focus as more legal documents become public.
Raytheon (RTN) won a $534 million Army contract for infrared viewers used by military tanks to select targets.
3M (MMM) shares are not at bargain levels despite a 16% year-to-date drop in the shares, according to an article in Barron's. The paper said potential environmental liabilities threaten to erode 3M's valuation further.
Cree (CREE) was downgraded to "underweight" from "neutral" at Piper Jaffray, following the lighting products maker's last quarterly results and weaker-than-expected outlook. The firm also cut its price target for the stock to $38 per share from $57.
CONTRIBUTORS
Jessica Bursztynsky
@jbursz
Peter Schacknow
@peterschack
SHAK closed $2.16 a share lower than my Short alert, Friday at around $100.01. Then fell another .25 for good measure in After Hour Session.
Set to lose a lot more ground, Monday with the futures presently very red- Russell 20000 is off 2.89%, Naz off 2.87%
DP WEEKLY WRAP: Inversion Aversion; Failed Double Bottom
By: Carl Swenlin | August 23, 2019
The oft-referenced "yield curve" refers to the relationship between the yield of the 10-Year T-Bond and the 2-Year T-Bond. Logically, the longer-term instrument should have the higher yield, but this week the 2-Year yield popped slightly above the 10-Year yield on a few occasions intraday. As could be expected, media outlets became immediately obsessed with these inversions, and started watching them with the intensity they would give The Kentucky Derby. Puh-lease! The inversion is not like a light switch that will immediately plunge the financial world into total darkness. Rather it is a sign that there is a problem that will work against the welfare of the market in general. The fact that these rates are so close together is as much a concern as an actual inversion.
Let's look across the spectrum from the 1-Month T-Bill to the 30-Year T-Bond. It's hard to see, but all instruments shorter that the 5-Year T-Bond have a higher yield. More amazing, the 1-Month Bill has a higher yield that the mighty 30-Year Bond.
GLOBAL MARKETS
BROAD MARKET INDEXES
SECTORS
Each S&P 500 Index component stock is assigned to one, and only one, of 11 major sectors. This is a snapshot of the Intermediate-Term and Long-Term Trend Model signal status for those sectors.

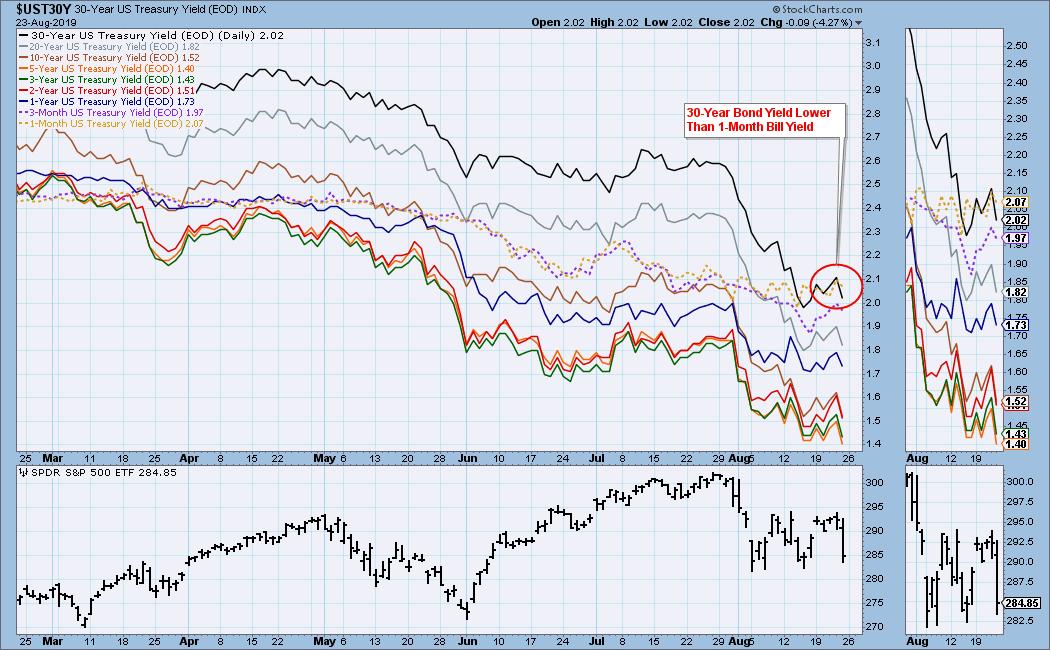
INTEREST RATES
Because some interest rates are currently inverted, I will be including a chart so we can monitor the situation. In normal circumstances the longer money is borrowed the higher the interest rate that must be paid. When rates are inverted, the reverse is true. It is generally believed that rate inversions result from "a flight to safety." On the chart below, the one-month and three month T-Bills (dotted lines) pay a higher interest rate than the one year through the 20-year T-Bonds. This is a serious problem for the stock market.
STOCKS
IT Trend Model: NEUTRAL as of 8/15/2019
LT Trend Model: BUY as of 2/26/2019
SPY Daily Chart: Last Friday the market (SPY) was strongly coming off a double bottom. On Monday price gapped up, continuing the advance, but that ended it. SPY spent the rest of the week stalled below the confirmation line on low volume, and on Friday, thanks to Fed and trade news, it headed sharply back toward the bottom of the trading range on high volume. The daily PMO turned down below the signal line, a very negative configuration.
SPY Weekly Chart: It was quiet in the middle of the week but dramatic on the first and last day. Still, the net change was about -1.4%. The weekly PMO has dropped well below the signal line, giving a very negative long-term sign.
Climactic Market Indicators: Climactic activity has abounded for nearly three weeks, but the readings were reversing almost daily, and it was hard to get a fix on what the readings meant. Friday was a climax day, and at this point I am calling it an initiation climax, meaning that I think price will go lower.
Short-Term Market Indicators: The STO-B and STO-V managed to make it to overbought levels by Thursday, so the Friday price reversal was not a total surprise.
Intermediate-Term Market Indicators: While these indicators appeared to have found a bottom last week, it now seems possible that they will reach more oversold readings before the negativity is exhausted.
CONCLUSION: The market is coming down off a short-term overbought condition, and it will take several days to swing down to oversold conditions. This could cause price to break below the bottom of the August trading range. Intermediate-term indicators turned down on Friday, but they are bull-market-oversold, and still offer hope that the trading range will hold. I think the tie-breaker for me is the weekly PMO, which is below the signal line and falling. That forecasts lower prices ahead.
Read Full Story »»»
• DiscoverGold
Click on "In reply to", for Authors past commentaries
Dow Jones Industrials Index (DJIA) - WARNING Sharp Collapse from Key High »» Monthly Summary Analysis
By: Marty Armstrong | August 24, 2019
WE SEE THE ANALYTICAL SITUATION AS OF THE CLOSE OF Thu. Aug. 22, 2019: Dow Jones Industrials closed today at 2625224 and is trading up about 12% for the year from last year's closing of 2332746. The Dow Jones Industrials has continued to make new historical highs over the course of the rally from 2017 moving into 2019. Distinctly, we have elected all four intermediate Yearly Bullish Reversals to date from this 1974 reaction low.
This market still remains in a broader bullish posture warranting a classification as a Bull Market. Nonetheless, the Weekly level on the indicating models shows inherent weakness with signs of overhead resistance at this point in time. However, the last reversal to be elected on the Weekly level was a Bullish the week of August 12th. Up to this moment in time, this market has been rising for 9 years going into 2019 suggesting that this has been a bull market trend which has been confirmed by electing all of our model's long-term Bullish Reversals from the key low. As we stand right now, this market has made a new high exceeding the previous year's high reaching thus far 2739868 while it is still trading above last year's high of 2695181.
Up to this moment in time, the market remains bullish on the short-term levels of our indicators while the long-term trend is neutral and our cyclical strength is bearish.
This market on the monthly level has been making new highs since the last low established 1 month ago, which is a turn to the upside for now. We did elect four Bullish Reversals which implies we have had a broad change in trend on this level. That notwithsatnding, we do have a near-term shift in trend. Meanwhile, our technical resistance stands at 2821098 and it will require a closing above this level to signal a breakout of the upside is unfolding. Nevertheless, our technical support lies at 2630519 which the market is now trading beneath illustrating technical weakness.
A possible change in trend appears due come October in Dow Jones Industrials so be focused. The last cyclical event was a high established back during July. Normally, this implies that the next turning point should be a low. However, the market has been neutral for right now, so caution is advisable. Watch the short-term trading levels for a hint of the next directional move into that target time frame. Last month produced a high at 2739868 but closed on the weak side and so far, we have broken beneath last month's low 2661621 closing yesterday at 2625224. We now need to close beneath 2661621 on a monthly basis to imply a technical reversal of trend to the downside for now. Since we are trading below that level, caution is advisable.
Critical support still underlies this market at 2606258 and a break of that level on a monthly closing basis would warn that a sustainable decline ahead becomes possible. Nevertheless, the market is trading below last month's low warning of weakness at this time. On a broader perspective, this market remains in an uptrend posture on all our indicators looking at the monthly level. We see here the trend has been moving up for the past 7 months. The previous low of 2171253 made during December 2018 on the Monthly level has held and only a break of 2468057 on a closing basis would warn of a technical near-term change in trend. The previous high made during July on the Monthly level at 2739868 remains significant technically and only exceeding that level on a closing basis would suggest a reversal in the immediate trend. However, we still remain below key resistance 2669596 on a closing basis.
• DiscoverGold CNBC
U.S. stock futures were pointing to a higher open ahead of the Friday trading session, but the key event of the day takes place 30 minutes after the opening bell. That's when Fed Chairman Jerome Powell addresses the central bank's economic summit in Jackson Hole, Wyoming. The Dow, S&P 500 and Nasdaq are all on pace to end their three-week losing streaks. The Dow has also been higher in five of the past six trading days, while the S&P 500 and Nasdaq have been lower in two of the past three sessions. (CNBC)
* Fed's Powell will find it hard not to rock markets with his comments (CNBC)
* Economist who first linked yield curve inversions to recessions sees a 'pretty high' chance of downturn (CNBC)
The only report on Friday's economic calendar comes at 10 a.m. ET, when the government releases new home sales for July. Meanwhile, retailers Foot Locker (FL) and Buckle (BKE) are out with quarterly earnings this morning, along with restaurant chain Red Robin Gourmet Burgers (RRGB). No profit reports are scheduled for release after today's closing bell. (CNBC)
IN THE NEWS TODAY
China will soon unveil a plan to impose retaliatory tariffs on certain U.S. products, the editor-in-chief of China's Global Times newspaper said today. Global Times is a tabloid published by the ruling Communist Party's People's Daily. (Reuters)
* Pompeo says the US message on Huawei is clear. Trump's words say otherwise (CNBC)
Huawei announced the commercial availability of an AI chip today, pitting it against major American giants like Qualcomm and Nvidia, as it looks to defy continued U.S. pressure and prove it can still bring out core technology. The chip, called the Ascend 910, was first unveiled in October last year and is aimed at data centers. (CNBC)
* Huawei says impact of U.S. trade restrictions less than feared (Reuters)
U.S. toy maker Hasbro (HAS) will buy Entertainment One for about $4 billion in cash, adding the independent studio with preschool brand Peppa Pig. The deal provides the Nerf and Power Rangers toymaker with new exposure. It has been tying up with movie studios such as Paramount Pictures and Disney to boost sales of toys linked to big movie franchises. (Reuters)
VMWare (VMW) shares were off about 5% in premarket trading. VMWare announced the acquisition of Pivotal Software (PVTL) and Carbon Black (CBLK) in separate deals. Dell Technologies (DELL) is a controlling stakeholder in both VMWare and Pivotal. Separately, VMWare best estimates with quarterly earnings and revenue. (Reuters)
Investors are rushing to get a piece of privately held Impossible Foods before it goes public, according to the Wall Street Journal. Brokers handling transactions in the secondary market told the Journal that investors are jostling to get a piece of the maker of plant-based meats, with some deals that value the company as much as $5 billion. (CNBC)
Walmart (WMT) and Tesla (TSLA) are seeking to resolve issues surrounding Tesla solar energy systems sold at Walmart stores. Earlier this week, Walmart sued Tesla for "widespread negligence" involving repeated fires involving those systems. (Reuters)
STOCKS TO WATCH
Gap (GPS) came in 10 cents ahead of consensus with adjusted quarterly profit of 63 cents per share, with revenue in line with forecasts. However, the apparel retailer's comparable store sales fell by 4%, and its traditionally strong Old Navy brand saw a comparable store sales decline of 5%. The stock was lower in the premarket.
Ross Stores (ROST) reported earnings-per-share and revenue that came in slightly above forecasts. However, the company also said it sees a slight impact on its third and fourth-quarter earnings from the 10% tariff on goods sourced from China. The stock was under some pressure this morning.
Salesforce (CRM) shares were up about 7% in premarket trading after the company beat Wall Street estimates with its latest financial report. The business software company also gave an upbeat full-year guidance.
HP Incorporated (HPQ) beat analyst estimates with quarterly profit, with the computer and printer maker's revenue essentially in line. HP also announced that CEO Dion Weisler will step down in November due to family-related reasons. Enrique Lores, head of HP's imaging and printing unit, will take over. The stock was off 8% in the premarket.
CONTRIBUTORS
Jessica Bursztynsky
@jbursz
Peter Schacknow
@peterschack
SHAK Dropping fast- down $1.91 from HOD
SHAK $100.01 Is a short but you have to have the ability to hold as the market maker has a grip on the small share structure (tiny float) and can hold it up, even goose it higher until insiders are finished unloading ( which they are like banshees).
Dilution looks very possible after that with a $170M shelf in place and a pressing need for money.
Ridiculous 200 P/E for an already declining hamburger joint.
MG
737 Buzz Draws Options Bulls to Booming Boeing
By: Julius de Kempenaer | August 22, 2019
• Reports suggest the blue chip is ready to ramp up 737 MAX production by early next year
• BA is set to snap a lengthy weekly losing streak
Boeing Co (NYSE:BA) stock is at the top of the Dow today, up 4.4% at $354.93, after Reuters reported the company is planning to resume manufacturing its grounded 737 MAX jets in February 2020 at a monthly rate of 52 planes -- building to a record 57 units per month by June -- though this depends on regulators clearing the aircraft to fly. Additionally, unconfirmed buzz is swirling the U.S. Federal Aviation Administration (FAA) is planning on testing how less-experienced pilots handle new software on the 737 MAX airliners.
The upside has sparked heavier-than-usual activity in BA's options pits. With about an hour left in today's trading, roughly 122,000 calls and 61,000 puts are on the tape, double what's typically seen at this point. The weekly 8/23 series is hot, with the 350-strike, 355-strike, and 360-strike calls Boeing's three most active options. It looks like traders are buying to open these short-term calls, betting on more upside for the Dow stock through expiration at the close tomorrow, Aug. 23.
More broadly speaking, near-term options traders are more put-heavy than usual toward Boeing, per the stock's Schaeffer's put/call open interest ratio (SOIR) of 1.12, which registers in the 90th annual percentile. The September 300 put is home to peak open interest of nearly 10,400 contracts, and data from the major options exchanges confirms buy-to-open activity here.
Today's pop has BA stock set to close above its 50-day moving average for the first time since a late-July post-earnings slide. The shares are also on track to snap a four-week losing streak -- their longest since mid-2018 -- and are now up 10% year-to-date.

Read Full Story »»»
• DiscoverGold
Money managers Increased their exposure to the US Equity markets since last week...
• DiscoverGold
NAAIM Exposure Index
* August 21, 2019
The NAAIM Number
70.18
Last Quarter Average
77.30
»»» Read More…
Click on "In reply to", to see The NAAIM Number from prior weeks
U.S. stock futures were pointing to a narrowly mixed open on Wall Street following Wednesday's strong gains, the fourth in five sessions for the Dow and S&P 500 and the third in four days for the Nasdaq. Late Wednesday, the yield on the 10-year Treasury fell below that of the 2-year for the second time in a week, sending a possible recession signal. Despite growing concern over the global economy, the Dow, S&P 500, and Nasdaq are on pace for a positive week after losing ground in each of the past three weeks. (CNBC)
* Inversion signals Fed may be too slow to cut rates, risks recession (CNBC)
Fed officials who voted to lower interest rates three weeks ago agreed that the move shouldn't be viewed as part of a "pre-set course" for future cuts. Fed minutes from the July meeting also said "most participants" saw the cut "as part of a recalibration" in response to changing conditions. Meanwhile, the Fed's annual economic policy symposium opens today in Jackson Hole, Wyoming. (CNBC)
On today's economic calendar, the Labor Department is out with its weekly report on initial jobless claims at 8:30 a.m. ET. The Conference Board's Index of leading economic indicators for July follows at 10 a.m. ET. (CNBC)
BJ's Wholesale Club (BJ), Dick's Sporting Goods (DKS), and Hormel Foods (HRL) issue quarterly earnings this morning. This afternoon, Gap (GPS), HP Inc. (HPQ), Intuit (INTU), Ross Stores (ROST), Salesforce (CRM), and VMware (VMW) issue their numbers after today's closing bell. (CNBC)
Nordstrom (JWN) late Wednesday beat estimates with quarterly earnings, although revenue missed. Nordstrom's bottom line got a boost from lower expenses and inventory reductions. The stock was up about 9% in the premarket this morning, after advancing 5.5% on Wednesday with the rest of the retail sector. (CNBC)
Enjoying the CNBC Morning Squawk newsletter? Tell us how we're doing and what we can do better by filling out this simple survey.
IN THE NEWS TODAY
China said today it hopes the U.S. will stop its wrong tariff action, adding that any new tariffs would lead to escalation. Washington said early this month it would impose duties on $300 billion of Chinese goods from Sept. 1, which would effectively extend its tariffs to all of China's exports to the United States. (Reuters)
* Trade war with Europe would be larger and more damaging than China (CNBC)
* China 'will not sit idly by' over US arms sale to Taiwan (AP)
STOCKS TO WATCH
Lingerie maker Victoria's Secret dragged on parent company L Brands's (LB) second-quarter earnings, which topped analysts' expectations on profit while falling short on sales.
Mylan (MYL) was sued by Danish drug maker Novo Nordisk (NVO) for alleged patent infringement, in an attempt to stop Mylan from marketing a generic version of Novo's diabetes drug Victoza.
Wayfair (W) was upgraded to "buy" from "hold" at Stifel Nicolaus in a valuation call for the online home furnishings retailer's stock, with a price target of $150 per share.
CONTRIBUTORS
Jessica Bursztynsky
@jbursz
Peter Schacknow
@peterschack
CNBC
U.S. stock futures were pointing to a strong Wall Street open following Tuesday's losses, the first in four sessions for the Dow and S&P 500 and the first in three days for the Nasdaq. However, the Dow, S&P 500 and Nasdaq are still holding on to double-digit percentage gains for 2019. Energy and financials have been the worst-performing sectors during a weaker August for the stock market. (CNBC)
Retailers Target (TGT) and Lowe's (LOW) are out with quarterly earnings this morning along with chip maker Analog Devices (ADI). This afternoon, L Brands (LB), Nordstrom (JWN), Pure Storage (PSTG), and Splunk (SPLK) are out with their numbers after the bell. (CNBC)
* Lowe's stock surges after beating second-quarter earnings and revenue estimates (CNBC)
* Targets shares pop after earnings unexpectedly jump 17% and retailer hikes outlook (CNBC)
On today's economic calendar, the Fed issues minutes from its July meeting at 2 p.m. ET, at which central bankers lowered interest rates. Meanwhile, the National Association of Realtors releases July existing home sales at 10 a.m. ET. The Energy Department is out with its usual Wednesday assessment of oil and gasoline inventories at 10:30 a.m. ET.
IN THE NEWS TODAY
President Donald Trump told reporters he was "thinking about" cutting payroll taxes, less than a day after the White House denied that a payroll tax cut was under consideration. Trump added he has "been thinking about payroll taxes for a long time" and he cautioned that "whether or not we do something now, it's not being done because of recession." (CNBC)
(MG Note: LOL) Trump said he's postponing a scheduled meeting with Denmark's prime minister because of her lack of interest in discussing a possible purchase of Greenland. Trump was due to visit Copenhagen in early September to meet with Mette Frederiksen and Prime Minister Kim Kielsen of Greenland, which is an autonomous Danish territory. (CNBC)
Japan and the U.S. will seek to narrow gaps on trade when their top negotiators meet today, but hopes for a deal in September are fading as both sides fail to make concessions on agriculture and automobiles. The two-day talks in Washington D.C. will be their second meeting this month. (Reuters)
Walmart (WMT) is suing Elon Musk's electric vehicle and clean energy company after Tesla (TSLA) solar panels atop seven of the retailer's stores allegedly caught fire. Tesla and Walmart have been partners on clean energy initiatives for years, and more than 240 Walmart stores have Tesla solar systems installed. (CNBC)
* Walmart shines light on Musk's thorny SolarCity deal (CNBC)
Huawei is facing a "life or death crisis" amid continued pressure from the U.S. government, its founder and CEO told employees, as he laid out a strategy for the Chinese telecommunications giant going forward. In a memo to employees of Huawei's networking division, Ren Zhengfei described the company's current situation as a "battle." (CNBC)
Alibaba (BABA) is delaying a planned $15 billion Hong Kong initial public offering, Reuters reported. The decision by the China e-commerce giant comes amid the growing political unrest in Hong Kong, an Asian financial hub.
Scientists are working to develop a vaccine to help guard the world's pork supply as a deadly virus ravages Asia's pig herds, killing millions of pigs. Farmers have long contained its spread by quarantining and killing infected animals, but the disease's devastating march into East Asia is intensifying the search for another solution. (AP)
STOCKS TO WATCH
Urban Outfitters (URBN) reported better-than-expected quarterly profits. However, both revenue and comparable store sales did fall below Wall Street forecasts as digital sales growth did not offset declines at the company's Urban Outfitters, Anthropologie, and Free People stores.
Toll Brothers (TOL) beat quarterly profit and revenue with its quarterly earnings. Toll Brothers did see a decline in orders, pointing at possible weaker demand for new homes, but pointed to lower mortgage rates and strong employment as positive factors going forward.
Cardinal Health (CAH) said its business could be impacted by ongoing opioid-related lawsuits. Cardinal and other wholesale pharmaceutical distributors have been named in about 2,500 lawsuits and Cardinal said it expects to be named as a defendant in additional lawsuits.
Cree (CREE) reported strong adjusted quarterly profit and revenue in its past quarter. However, it gave a weaker than expected current quarter forecast, pointing to softness in the LED market and the U.S. ban on doing business with China's Huawei.
CONTRIBUTORS
Jessica Bursztynsky
@jbursz
Peter Schacknow
@peterschack
Margin Debt and the Market: Up 0.98% in July
By: Jill Mislinski | August 20, 2019
Note: The NYSE has suspended its NYSE Member Firm margin data as of December 2017. We have replaced our Margin Debt data with FINRA data, which includes data for all firms, not just NYSE member firms.
Let's examine the numbers and study the relationship between margin debt and the market, using the S&P 500 as the surrogate for the latter.
The first chart shows the two series in real terms — adjusted for inflation to today's dollar using the Consumer Price Index as the deflator. At the 1997 start date, we were well into the Boomer Bull Market that began in 1982 and approaching the start of the Tech Bubble that shaped investor sentiment during the second half of the decade. The astonishing surge in leverage in late 1999 peaked in March 2000, the same month that the S&P 500 hit its all-time daily high, although the highest monthly close for that year was five months later in August. A similar surge began in 2006, peaking in July 2007, three months before the market peak.
Debt hit a trough in February 2009, a month before the March market bottom. It then began another major cycle of increases.
The Latest Margin Data
FINRA has released new data for margin debt, now available through July. The latest debt level is up 0.98% month-over-month.

At the suggestion of Mark Schofield, Managing Director at Strategic Value Capital Management, LLC, we've created the same chart with margin debt inverted so that we see the relationship between the two as a divergence.

The next chart shows the percentage growth of the two data series from the same 1997 starting date, again based on real (inflation-adjusted) data. We've added markers to show the precise monthly values and added callouts to show the month. Margin debt grew at a rate comparable to the market from 1997 to late summer of 2000 before soaring into the stratosphere. The two synchronized in their rate of contraction in early 2001. But with recovery after the Tech Crash, margin debt gradually returned to a growth rate closer to its former self in the second half of the 1990s rather than the more restrained real growth of the S&P 500. But by September of 2006, margin again went ballistic. It finally peaked in the summer of 2007, about three months before the market.

NYSE Investor Credit
Lance Roberts of Real Investment Advice analyzes margin debt in the larger context that includes free cash accounts and credit balances in margin accounts. Essentially, he calculates the Credit Balance as the sum of Free Credit Cash Accounts and Credit Balances in Margin Accounts minus Margin Debt. The chart below illustrates the mathematics of Credit Balance with an overlay of the S&P 500. Note that the chart below is based on nominal data, not adjusted for inflation. Here, we have retained the NYSE data through November 2017 and switched to the FINRA data moving forward.
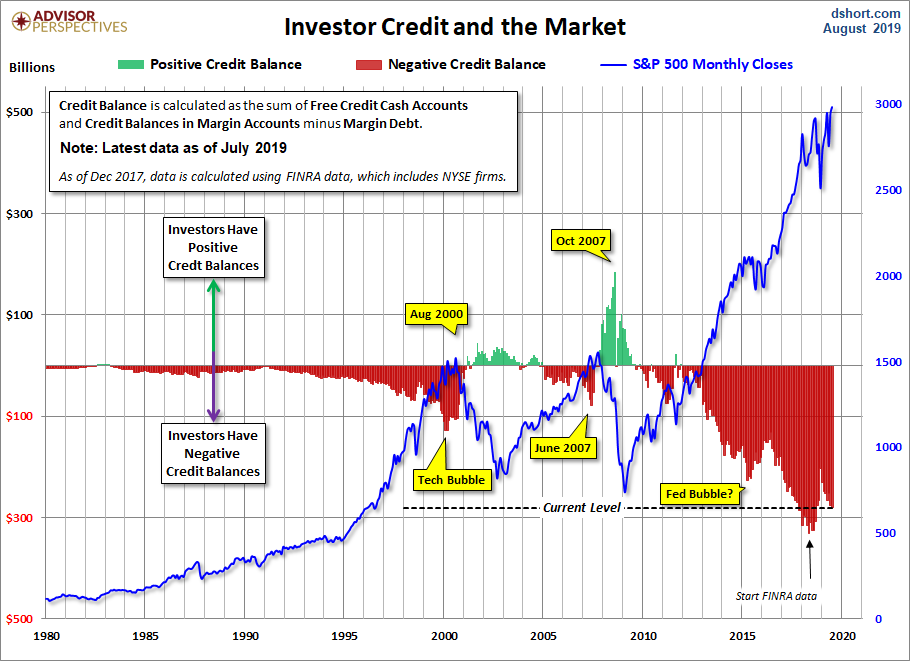
Here's a slightly closer look at the data, starting with 1997. Also, we've inverted the investor credit monthly data and used markers to pinpoint key turning points.
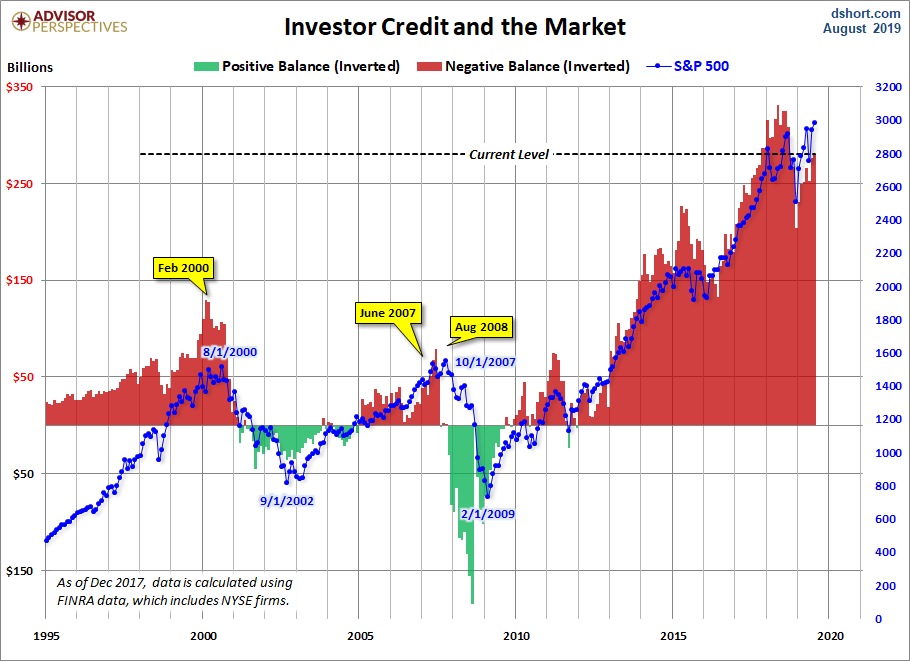
As we pointed out above, margin debt data is several weeks old when it is published. Thus, even though it may, in theory, be a leading indicator, a major shift in margin debt isn't immediately evident. Nevertheless, we see that the troughs in the monthly net credit balance preceded peaks in the monthly S&P 500 closes by six months in 2000 and four months in 2007. Before the December 24, 2018 correction of 19.78%, the previous S&P 500 correction greater than 15% was the 19.39% selloff in 2011 from April 29th to October 3rd. Investor Credit saw a negative extreme in March 2011.
Conclusions
There are too few peak/trough episodes in this overlay series to take the latest credit balance data as a leading indicator of a major selloff in U.S. equities. This has been an interesting indicator to watch and will certainly continue to bear close watching in the months ahead.
Read Full Story »»»
• DiscoverGold
CNBC (Late posting of 8/20/19 stock news- locked out of 'puter for while, sheesh)
U.S. stock futures were pointing to modest gains at the Wall Street open, as stocks look to continue a rally that has seen the Dow and S&P 500 rise for 3 straight days and the Nasdaq for 2 consecutive sessions. The averages have all erased most of the deficit incurred in last Wednesday's sell-off, although they still have deficits of 2% or more to make up for the month of August. The two-day gains for the Dow, S&P 500, and Nasdaq for last Friday and yesterday were the largest in more than 2 months, since June 4-5.
* Pimco's Ivascyn warns US-China trade breakthrough could trigger a 'powerful snapback' in yields (CNBC
On the corporate front, retailers Home Depot (HD), Kohl's (KSS), and TJX (TJX) will be out with quarterly earnings this morning, along with medical device maker Medtronic (MDT), while furniture maker La-Z-Boy (LZB), and apparel retailer Urban Outfitters (URBN) issue quarterly numbers after today's closing bell.
*Home Depot second-quarter sales miss and company cuts outlook amid worries tariffs could slow consumer spending (CNBC)
IN THE NEWS TODAY
The White House is reportedly considering whether to push for a payroll tax cut to stem a potential economic downturn. However, one administration official later pushed back on the report and said it is not a measure under consideration. President Donald Trump in recent days has lashed out over reports about growing recession fears. (CNBC)
Trump reportedly is backing away from potential support of gun background check legislation. Trump, immediately after two mass shootings that killed 31 people, said there's a potential to tighten background checks. (Washington Post)
China said today it had a right to put out its own views after Twitter and Facebook (FB) said they had dismantled a state-backed social media campaign originating in mainland China that sought to undermine protests in Hong Kong. Twitter and Facebook have come under fire over showing ads from state-controlled media that criticized the protesters. (Reuters & CNBC)
The U.S. government's decision to add more Huawei affiliates to a blacklist is "unjust" and "politically motivated" and will not help the country advance its technological leadership, Huawei said. U.S. Commerce Secretary Wilbur Ross announced it was extending a temporary reprieve for Huawei to continue doing business with American companies. (CNBC)
United States Steel (X) will temporarily lay off hundreds of workers at its Great Lakes facility in Michigan in coming weeks. In mid-June, the company said it would idle two blast furnaces at its Great lakes and Gary Works plants, citing lower steel prices and softening demand. (Reuters)
State attorneys general from more than a dozen states are reportedly preparing to launch an antitrust investigation of tech giants. The bipartisan group is expected to formally launch its investigation as soon as next month and will look at whether a handful of tech platforms use marketplace powers to decrease competition. (WSJ)
* Trump tweets without evidence that Google 'manipulated' votes in the 2016 election and 'should be sued' (CNBC)
Apple (AAPL) is reportedly planning to spend more than $6 billion on content for its Apple TV+ service. Apple previously said to expect its streaming service focusing on original content to launch in the fall, and a Financial Times report said Apple is looking to turn its service live in the next two months, before Disney+ launches on November 12. (CNBC)
STOCKS TO WATCH
Sarepta Therapeutics (SRPT) said the Food and Drug Administration did not approve its new treatment for Duchenne muscular dystrophy, pointing to safety concerns. Analysts had been projecting eventual annual sales for the treatment of nearly $400 million.
Viacom (VIAB) CEO Bob Bakish signed a new 4-year contract to run the combined ViacomCBS when the companies complete their planned merger, according to an SEC filing. Bakish will receive annual compensation of about $31 million, about 55% higher than he received in the most recent fiscal year.
J.C. Penney (JCP) chairman Ronald Tysoe bought 1 million of the retailer's shares last week at 59 cents per share, according to an SEC filing. That comes just a few days after the stock set a record low at 53 cents per share.
Hilton Grand Vacation (HGV) may be the target of a takeover bid by private equity firm Apollo Global (APO), according to a report in the New York Post. The paper said Apollo could bid up to $36 per share for the timeshare company.
Endo International (ENDP) and Allergan (AGN) are both near deals that would settle opioid-related charges and let both companies avoid going to trial in October, according to the Wall Street Journal.
Beyond Meat (BYND) was upgraded to "overweight" from "neutral" at JPMorgan Chase, which sees potential for the plant-based burger maker to acquire new customers as well as valuation following a secondary stock offering.
CONTRIBUTORS
Jessica Bursztynsky
@jbursz
Peter Schacknow
@peterschack
Options Bulls Bet on a Bounce for Cigna Stock, Despite Dip
By: Schaeffer's Investment Research | August 20, 2019
• Cigna stock is slightly lower on reports that it is selling its benefits insurance unit
• Options bulls are speculating on a bounce for Cigna by the end of the week
Healthcare concern Cigna Corp (NYSE:CI) is slightly lower today, down 0.5% to trade at $162.10 following a Reuters report that the firm plans on selling its group benefits insurance unit. The stock has been trending lower since a 9.2% surge in mid-July, with pressure from the 20-day moving average capping recent attempts to rally off the $160 region.

Despite this negative price action, over 10 calls have been bought for every put during the last 10 days on the International Securities Exchange (ISE), Cboe Options Exchange (CBOE), and NASDAQ OMX PHLX (PHLX). This ratio is higher than nearly all other readings from the past year, indicating an unusually healthy appetite for bullish bets of late.
Options players have kept up this bullish momentum in the wake of today's dip, with 2,603 calls exchanging hands so far -- slightly higher than what's typically seen at this point. It looks like most of this action is surrounding the weekly 8/23 165-strike call, with a chunk of these positions being bought to open. This means traders are expecting the equity to rebound past the $165 region by the time this contract expires at the end of this week.
Analysts have held out hope for the insurance issue too, with 16 calling CI a "buy" or better, compared to only two calling it a "hold," with not a single sell on the books. Plus, the consensus 12-month price target of $214.13 hasn't been touched since 2018.
On the other hand, short interest has been on the rise. These pessimistic positions have surged 11.7% in the last reporting period to 5.96 million shares sold short -- a yearly high for CI.
Read Full Story »»»
• DiscoverGold
A 14% Dividend Yield That Can Keep Growing With Over 25% Implied Upside
By: Wall St. | August 19, 2019
It’s no secret that investors love their dividends. Some statistics in the media have pointed to dividends accounting for half of total returns over time. While high dividend yields can be quite attractive to investors, there are some instances when dividends just look and feel too high. After all, if investors currently have to invest for almost 30 years to earn even 2% in a Treasury bond yield, then what does it say if a stock dividend yield is up at 8%, 10% or even higher?
It turns out that many dividends are unsustainably high. One group that has been able to keep paying consistently high dividends is the mortgage real estate investment trusts (REITs). These vehicles come with very high dividend yields, as they are generally leveraged owners of mortgage-backed securities and almost all of their income is redistributed to the shareholders.
New Residential Investment Corp. (NYSE: NRZ) is a residential credit mortgage REIT that invests in residential mortgages, but it operates through three segments: servicing and originations; residential mortgage-related securities and loans; and consumer-related loans. The stock has seen its share price knocked down handily since the start of May, but another leg lower during August has brought its 14% dividend yield into focus.
Wedbush Securities has an Outperform rating and an $18 per share target price in New Residential Investment. What matters here is that the current $2.00 annualized per share dividend payment now generates a yield of 14% because the share price has come down handily. The total return has been a drop of almost 1% so far in 2019, but the shares are down 21% from a year ago and down about 15% in the past 90 days or so.
While a 14% dividend yield sounds almost too good to be true, on top of an implied appreciation of over 26% to this price target, note that Wedbush is not even close to being the most aggressive firm when it comes to its price target. Another issue is that New Residential’s market cap of $5.9 billion is not insignificant.
According to Wedbush’s Henry Coffey, New Residential Investment comes with an attractive dividend that also is likely to still be a growing dividend ahead. His view is that the company is an ongoing evolution “in the early stages of building out a fully enabled operating platform with origination and servicing capabilities, as well as a demonstrated capacity to find creative ways to monetize the process.”
As for that $2.00 dividend, investors generally assume that REITs pay out 90% or more of their taxable net income as dividends as a pass-through entity. Coffey sees its core earnings in 2019, 2020 and 2021 at $2.10 $2.20 and $2.35 per share, respectively. Moreover, with an annualized dividend of $2.00 per share currently, he expects that the company will begin to move its dividend above the current $0.50 per quarter in 2020.
New Residential has paid its same quarterly $0.50 per share dividend since its payment in June of 2017, but it had been a rising dividend prior to that. Coffey’s price target of $18 is based on a projected yield payout to future investors of 11%, keeping true with the formula that as a price of a bond or security rises its effective yield for new investors comes down.
Wedbush’s notations in the earnings outlook did note that its forward quarterly estimates factor in the impact of two recent preferred offerings totaling $385 million in gross proceeds with coupons of 7.500% and 7.125%.
The base case of the mortgage and interest rate environment is for mortgage rates and interest rates to remain stable and where credit conditions lead to continued performance from portfolio assets and stable dividends. A more bullish scenario is one in which rising interest rates and improving credit conditions would drive book value and higher dividends. In Coffey’s downside scenario, there is a dramatic rise in mortgage prepayments or rapidly deteriorating mortgage credit conditions lead to losses in mortgage portfolios.
With shares trading near $14.20, New Residential Investment has a 52-week range of $13.86 to $18.75. The consensus analyst target price from Refinitiv is $18.78. The highest analyst price target listed is $21.00, from a 2018 Barclays call, but Raymond James most recently had a $20 target price, and Nomura/Instinet’s last seen target price was $18.50.
Read Full Story »»»
• DiscoverGold
CNBC
U.S. stock futures were pointing to a strong Monday open on Wall Street, after the Dow on Friday surged 307 points, or 1.2%, in its second straight positive session. Ahead of Monday trading, the Dow was about halfway to erasing Wednesday's 800-point plunge. (CNBC)
The Dow, S&P 500 and Nasdaq enter the new week riding three consecutive weekly losses. The Dow and Nasdaq were more than 5% below their all-time highs in July, while the S&P 500 was 4.6% off its record. However, each still has double-digit percentage gains for 2019. (CNBC)
Bond yields were higher this morning, after hitting multiyear lows last week, and the 10-year and 2-year briefly inverted, tripping a historically reliable recession signal. Over the weekend, President Donald Trump said he does not see a recession on the horizon. (CNBC)
* Trump trade advisor Navarro: 'Technically we did not have a yield curve inversion' (CNBC)
There are no economic reports out today. On Monday's earnings calendar, Estee Lauder (EL) is among the few companies set to release quarterly results before the bell. China-based Baidu (BIDU) and Iqiyi (IQ) report earnings this afternoon. (CNBC)
* Fed chief Powell delivers opening remarks at Jackson Hole this week (CNBC)
IN THE NEWS TODAY
The Commerce Department is expected to extend Chinese tech giant Huawei's licensing process for three months as a gesture of "good faith" ahead of September talks aimed at resolving the trade war between the two nations, said Trump economic advisor Larry Kudlow. (Reuters)
Shareholder value is no longer the main focus of some of America's top business leaders. The Business Roundtable, a group of chief executive officers from major U.S. corporations, issued a statement today with a new definition of the "purpose of a corporation." (CNBC)
* Ride-hailing firm Lyft's IPO lockup agreement is set to expire today (Barron's)
Mastercard (MA), a partner in Facebook's planned Libra digital coin, is said to be putting together its own crypto team. In a recruitment listing, the credit card giant said those hired will "monitor cryptocurrency ecosystem trends" and "develop new products and solutions." (New York Post)
Microsoft (MSFT) said it would use chipmaker Nvidia's (NVDA) so-called ray tracing technology to provide more realistic graphics for its "Minecraft" video game. Last week, Nvidia beat estimates with an earnings boost from new high-end gaming chips. (Reuters)
Amazon (AMZN) is raising seller fees by 3% for thousands of small and medium-sized businesses in France because of a new digital tax passed by the French government. The tax is aimed at leveling the playing field between big tech and local businesses. (CNBC)
Target (TGT) is starting a grocery brand, after years of rolling out private-label brands in apparel and home goods. Products from the new line Good & Gather hit Target stores beginning Sept. 15. (CNBC)
STOCKS TO WATCH
Palo Alto Networks (PANW) shares were set to make back some of Friday's 7.2% decline, which happened after reports which were later confirmed by the cybersecurity company that its executive vice president of worldwide sales was leaving.
TV station operator Tegna (TGNA) has been approached by private equity firm Apollo Global (APO) about a possible sale, according to the Wall Street Journal, but has rebuffed those efforts so far.
Private equity firm Mantle Ridge has taken a 20% stake in food services company Aramark (ARMK), according to an SEC filing. Earlier this year, Mantle Ridge was reportedly mulling a possible offer to buy Aramark.
PG&E (PCG) won a court decision that allows the utility to keep sole control of a planned bankruptcy exit. Two groups of creditors had wanted to put forth their own versions of chapter 11 exit proposals.
CONTRIBUTORS
Matthew J. Belvedere
@Matt_Belvedere
Peter Schacknow
@peterschack
Mitch On The Markets
Zacks
The Stock Market's New Bogeyman: The Yield Curve
The equity market continues its volatile streak, which as I wrote last week, I expected to be the case. Volatility and market corrections tend to come in spurts (often scary and sudden ones), and a few days and weeks can start to feel like a lifetime, in my opinion.
I know navigating the ups and downs in the short term can be difficult and present some emotional challenges, so I'd encourage readers to try and stay patient and focused on your longer-term objectives. I believe the U.S. and global economy will continue to expand in 2019 despite the headwinds, and I see the market fully recovering in time as well.
This week, global equity markets sold off sharply again when the yield on the 2-year U.S. Treasury ticked higher than the yield on the 10-year U.S. Treasury, creating a yield curve inversion that many see as a recession signal. The yield on the 30-year U.S. Treasury also fell to a record low, though it remains higher than yields on the shorter end of curve (meaning, ultimately, that the yield curve is actually more 'u-shaped' than inverted).
Recession concerns are not without merit. The U.K. and Germany recently reported slight GDP contractions in Q2, and the ongoing U.S. - China trade dispute continues to weigh on sentiment and new business investment. Even though the market got some good news earlier in the week with the Trump administration delaying implementation of new China tariffs until December,3 the market does not seem convinced that there's a visible end to this trade war.
In my opinion, we're seeing the classic signs of a market correction - not a bear market. The two most notable sell-off days recently have come from renewed fears over old, recycled stories. Last week it was China, the trade war, and the yuan, and this week it's the yield curve. But in my view, the market has been pricing in the trade war since last summer, and close market watchers know that the yield curve has technically been inverted since May - when the 3-month yield ticked higher than the 10-year yield. Even still, the headlines are treating these developments as if they're new and wildly shocking. They're neither.
I think there are three good reasons to keep calm now and not to get too wrapped up in the negative headlines about the yield curve.
1. Markets Tend to Keep Moving Higher Even After a Yield Curve Inversion
Since 1978, the S&P 500 has gone up an average of +13% from the time a yield curve first inverts to the beginning of a recession. The historical occurrence of this final push higher makes perfect sense in my view, since a yield curve inversion itself does not signal the beginning of a recession. The inversion has historically been a reliable leading indicator for recessions, which can occur up to two years later.4
2. Successful Long-Term Investors Don't Get Baited by Volatility Events
In my view, investors cannot secure the historically attractive long-term returns offered by stocks (~10% annualized return of the S&P 500 with dividends reinvested from 1970 through 2019) by getting in and out of the markets each time there's a volatility scare. The nature of stock market returns is that market movements are independent over almost all time periods. Thus, big down days, big down weeks, big down months, even big down years have no statistical ability to predict future returns.
Effectively, the market discounts almost all available macroeconomic information, so that over any future twelve-month period the market has roughly a 70% of moving up and a 30% chance of moving down - regardless of what has happened historically.
So, the correct course of action, in my view and historically speaking, is not to try to predict or time the market but to continue to bet on the base scenario that the market moves up over time. If you pursue this strategy you will be right 70% of the time over any given 12-month period. You will be hit by every single bear market, every single correction, and every single pullback, but ultimately, I strongly believe you will generate a higher rate of return over time than you could achieve by trying to time the market.
3. August is a Notoriously Low Volume Month, Which Can Result in Higher Volatility
Market swings tend to get a bit haywire when trading is slow and volumes are down, which is precisely what August tends to bring. In August 2011, the equity market fell sharply following Standard & Poor's downgrading of U.S. Treasury debt, and in August 2015 stocks sold off when China unexpectedly devalued its currency (sound familiar?). This particular August, stock and bond trading volumes have fallen off more than usual, which I would argue is contributing to the wild swings.5
Bottom Line for Investors
I would set the expectation that the current wave of bumpiness could last for a few more weeks and perhaps into the fall. At the end of the day, however, no one can know with certainty when conditions will stabilize.
We do have history as a reliable guide for navigating these kinds of market conditions, though, and two key insights should remain front-of-mind as we move forward:
1. Recoveries often happen just as quickly as the pullbacks.
2. Market corrections can almost always be viewed in hindsight as mere speedbumps in the long-term pursuit of your goals.
Remember, too, that equities remain attractive on a valuation basis relative to bonds, due to extremely low yields.
and sudden ones), and a few days and weeks can start to feel like a lifetime, in my opinion.
I know navigating the ups and downs in the short term can be difficult and present some emotional challenges, so I'd encourage readers to try and stay patient and focused on your longer-term objectives. I believe the U.S. and global economy will continue to expand in 2019 despite the headwinds, and I see the market fully recovering in time as well.
This week, global equity markets sold off sharply again when the yield on the 2-year U.S. Treasury ticked higher than the yield on the 10-year U.S. Treasury, creating a yield curve inversion that many see as a recession signal. The yield on the 30-year U.S. Treasury also fell to a record low, though it remains higher than yields on the shorter end of curve (meaning, ultimately, that the yield curve is actually more 'u-shaped' than inverted).
I was at the museum recently.
I asked a worker there if I was allowed to take pictures.
He said no, they had to stay on the walls.
DP WEEKLY WRAP: All That Drama for a Net Change of Less Than One Percent for the Week
By: Carl Swenlin | August 16, 2019
On the last trading day of July the market (SPY) resolved a rising wedge pattern with the expected breakdown, and that began what has turned out to be a very turbulent August. (Note how the volume for almost every day has exceeded the one-year average.) After an initial decline of almost -7%, the market has been chopping around in a four percent range, with this week giving us a +2% up day followed immediately by a -3% down day. For all that volatility, the market lost a mere -0.95% this week. Currently, we can see a short-term double bottom, which, if price can exceed this week's high, would imply a minimum rally to just above the July all-time high. But we're not there just yet.
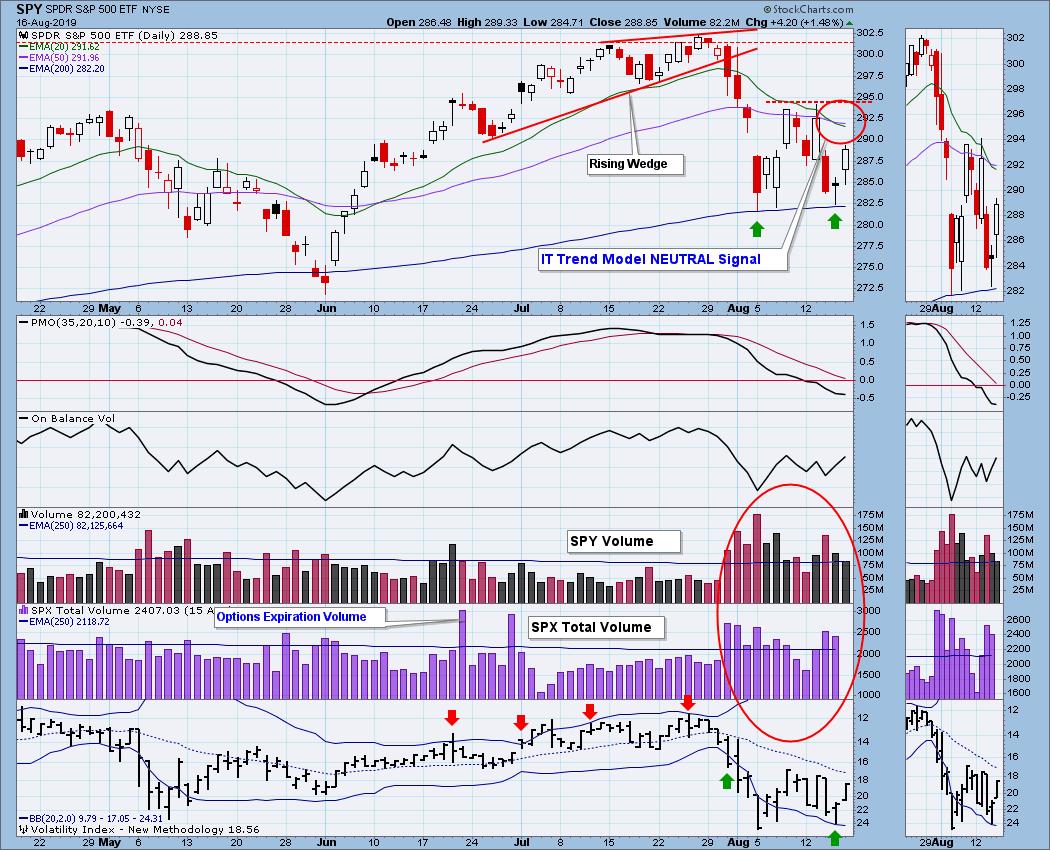
GLOBAL MARKETS
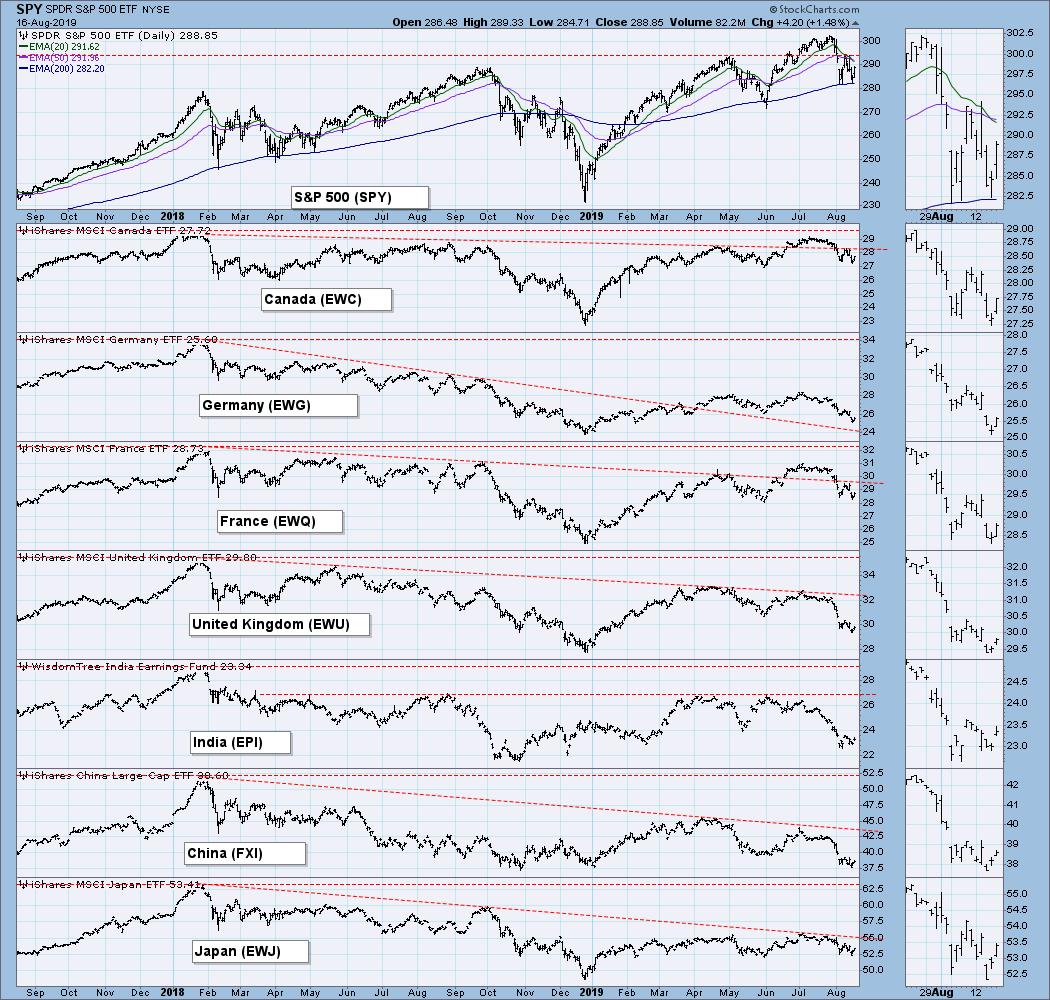
BROAD MARKET INDEXES
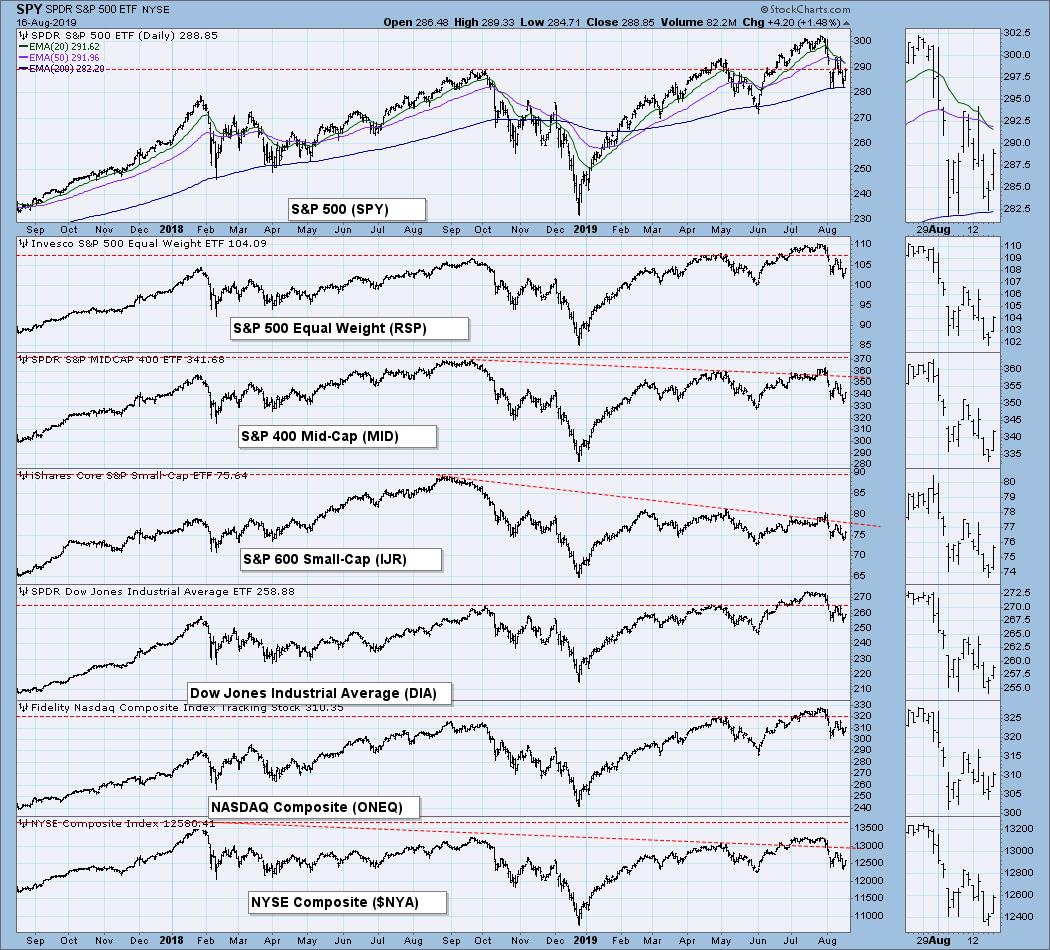
SECTORS
Each S&P 500 Index component stock is assigned to one, and only one, of 11 major sectors. This is a snapshot of the Intermediate-Term and Long-Term Trend Model signal status for those sectors.
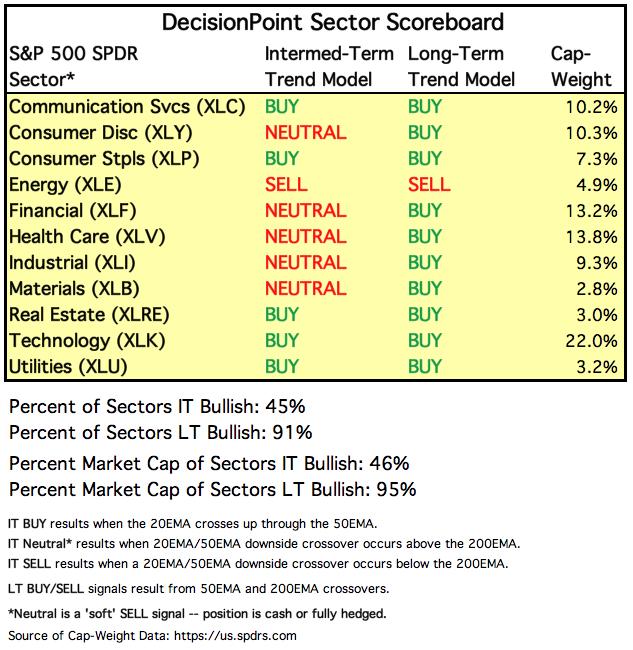
INTEREST RATES
There are some inversions. The 1-Month T-Bill yield is higher than everything, including the 30-Year Bond.
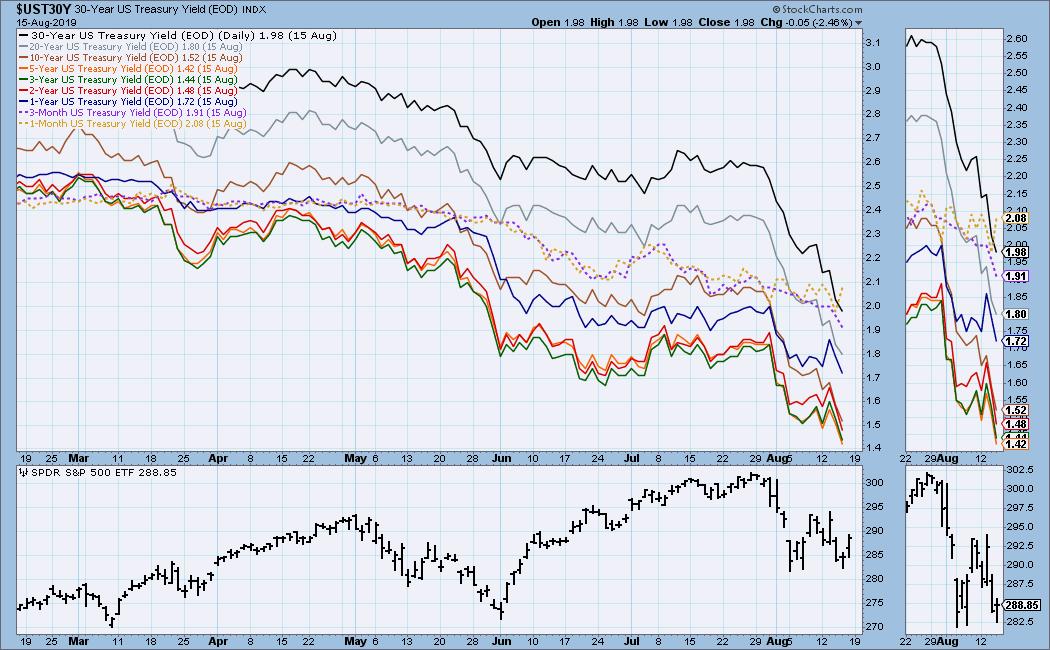
STOCKS
IT Trend Model: NEUTRAL as of 8/15/2019
LT Trend Model: BUY as of 2/26/2019
SPY Daily Chart: On Thursday the SPY 20EMA crossed down through the 50EMA, resulting in the IT Trend Model changing from BUY to NEUTRAL. With price largely moving sideways, it could be that we are in for another whipsaw like we saw in June. The rising wedge has resolved downward for the second time, and the double bottom may mean that the market is done with the decline.
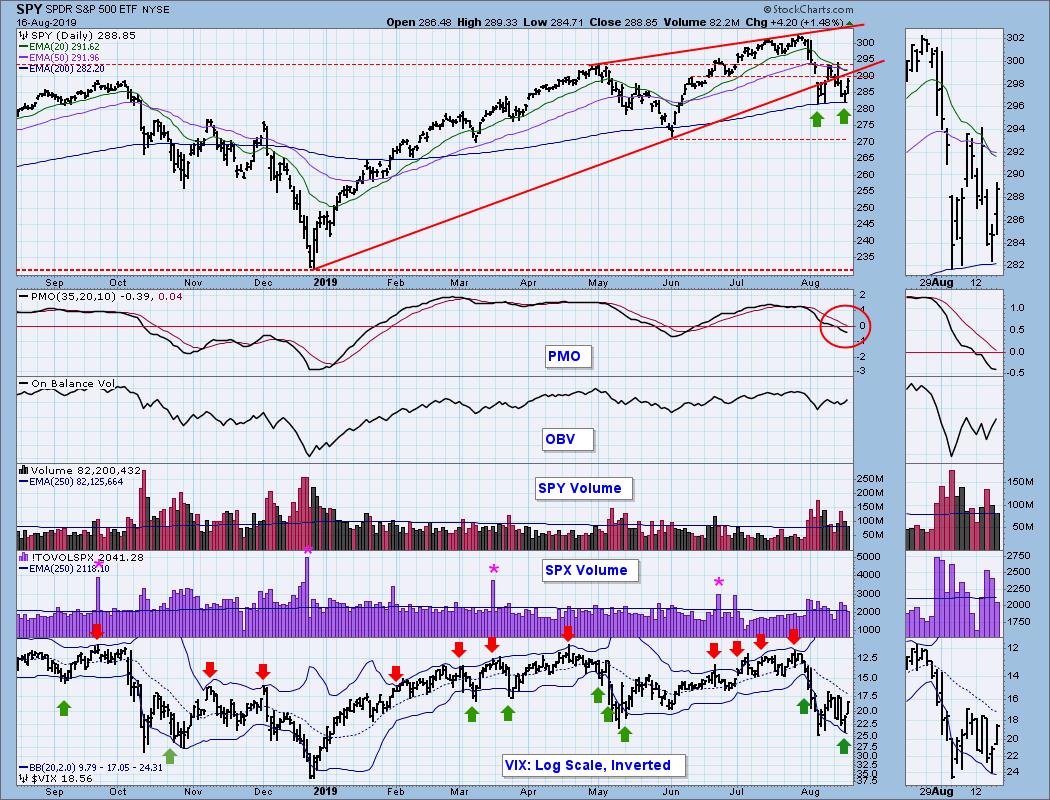
SPY Weekly Chart: The weekly PMO has crossed down through the signal line, which is bearish.
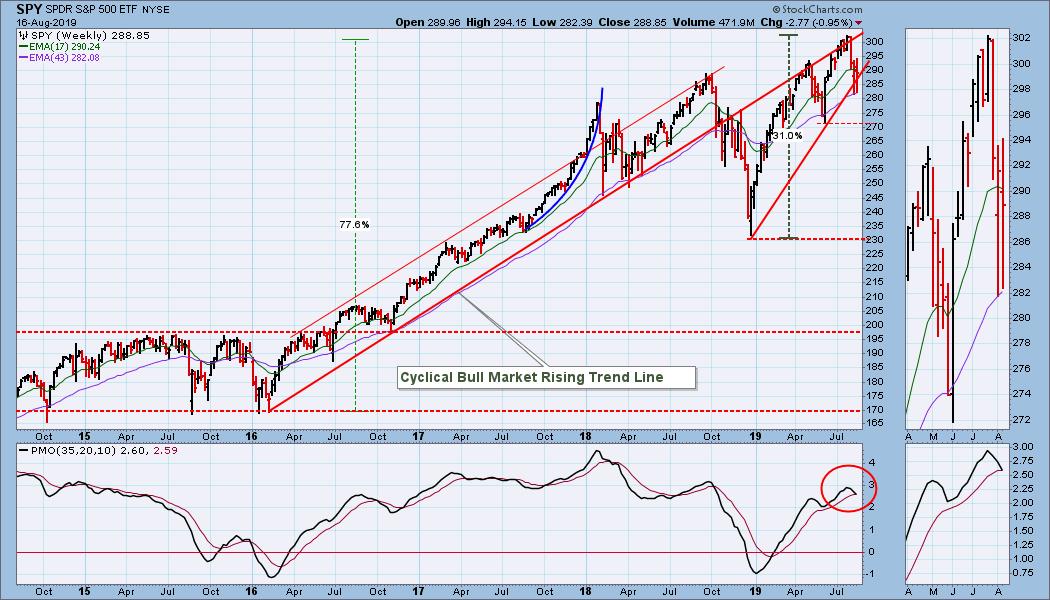
Climactic Market Indicators: In the last two weeks we have nine climax days in mixed directions. Unfortunately, that is too many climaxes in too short a time to make sense of. Friday was a climax day, based upon net advances-declines, and net A-D volume. (Total SPX volume is thinner than it should be for an options expiration day. It will be calculated a second time tonight, so that divergence could be erased.) Since the climax occurred off a double bottom of price, I'm calling it an initiation climax, which should be worth at least a couple days of upside next week.
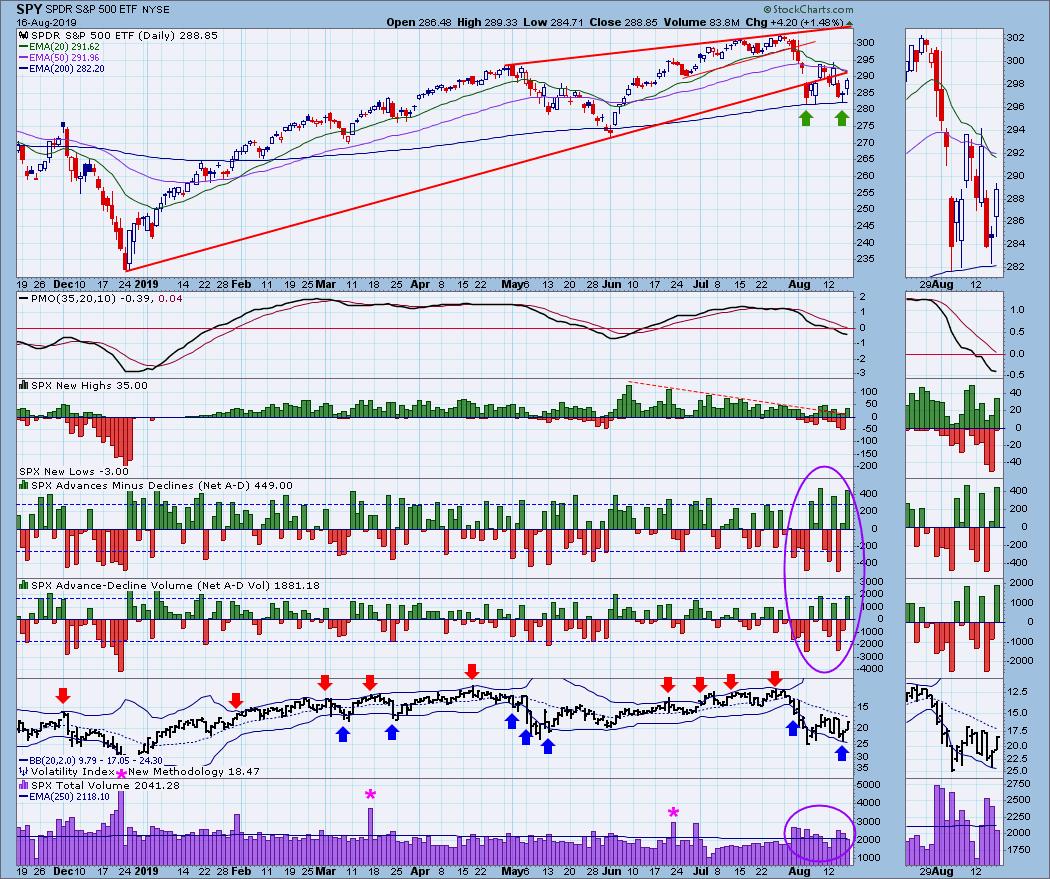
Short-Term Market Indicators: I have been looking for the STO-B and STO-V to double bottom in a manner similar to the double bottoms in May. I'll be keeping that thought for a few more days, but it's looking like we may have gotten the second bottom on Friday.
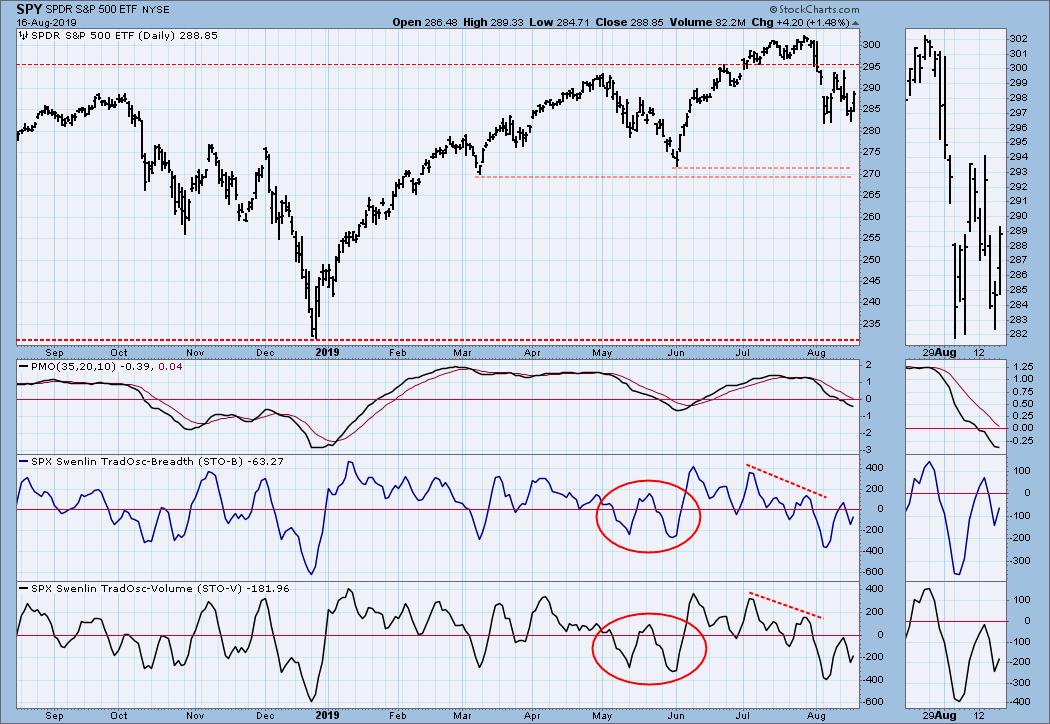
Intermediate-Term Market Indicators: These indicators are oversold if we're still in a bull market, and I have no concrete evidence that says we're not in a bull market.
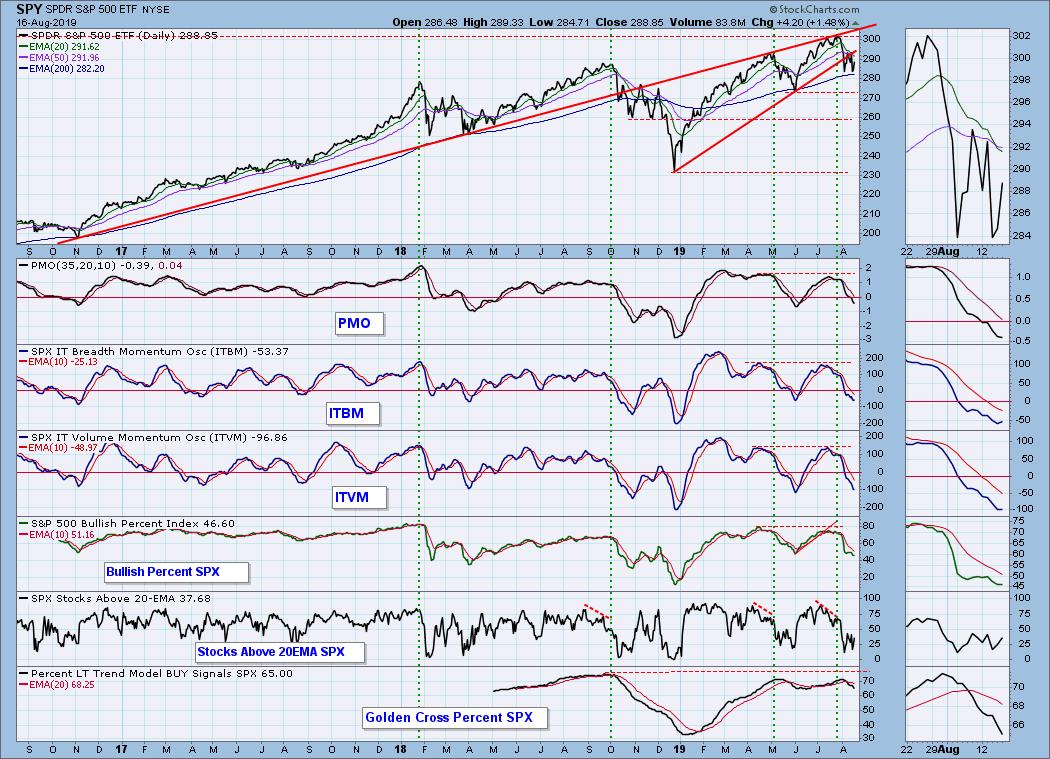
CONCLUSION: Oversold intermediate-term indicators, combined with what looks like a pretty solid short-term double bottom in price, make me think there is a good case for believing that the decline is over. Nevertheless, we should be alert for a continuation of the rapid direction changes we have experienced this month. If that panicky indecision is still present next week, I wouldn't be buying anything.
There was much ado about the inverted yield curve this week, but this is only relevant as an indicator of the fundamental condition of the economy. It is not a timing tool. Still, it is not a happy condition.
Read Full Story »»»
• DiscoverGold
Click on "In reply to", for Authors past commentaries
Dow Jones Industrials Index (DJIA) - Knee Jerk Reaction Low »» Monthly Summary Analysis
By: Marty Armstrong | August 17, 2019
OUR ANALYTICAL VIEWPOINT AS OF THE CLOSE OF Fri. Aug. 16, 2019: Dow Jones Industrials closed today at 2588601 and is trading up about 10% for the year from last year's closing of 2332746. As of now, this market has been rising for this month going into August reflecting that this has been only still a bullish reactionary trend. As we stand right now, this market has made a new low breaking beneath the previous month's low reaching thus far 2533960 while it even trading beneath last month's low of 2661621.
Up to now, the market remains neutral on the momentum indicator yet bearish on the short-term trend indicator while the long-term trend and cyclical strength are bearish.
During this year, we have exceeded last year's high thereby making a new historical major high to date and we have been in a bull market for a reasonable period of 10 years.
Meanwhile, our technical resistance stands at 2818645 and it will require a closing above this level to signal a breakout of the upside is unfolding. Nevertheless, our technical support lies at 1881635 which is still holding at this time. At this moment, the market remains between these two projections leaving it neutral on a technical basis.
Our timing models warn that a turning point is due come October in Dow Jones Industrials so we should remain focused. The last cyclical event was a high established back during July. Normally, this implies that the next turning point should be a low. However, the market has been neutral for right now, so caution is advisable. Watch the short-term trading levels for a hint of the next directional move into that target time frame. Last month produced a high at 2739868 but closed on the weak side and so far, we have broken beneath last month's low 2661621 closing yesterday at 2588601. We now need to close beneath 2661621 on a monthly basis to imply a technical reversal of trend to the downside for now. Since we are trading below that level, caution is advisable.
On a broader perspective, this market remains in an uptrend posture on all our indicators looking at the monthly level. We see here the trend has been moving up for the past 7 months. The previous low of 2171253 made during December 2018 on the Monthly level has held and only a break of 2468057 on a closing basis would warn of a technical near-term change in trend. The previous high made during July on the Monthly level at 2739868 remains significant technically and only exceeding that level on a closing basis would suggest a reversal in the immediate trend. However, we still remain below key resistance 2669596 on a closing basis.
Equity Put/Call Volume Ratio’s 21-Day MA
By: Tom McClellan | August 15, 2019
The stock market selloff since the last new all-time high on July 26 has brought the bears out, and they have been trading a lot of put options. Some trade those as an outright bearish bet, and some as a hedge on portfolio risk. Whatever the motivation for those trades, it is a sign of a bottoming condition for prices when we see persistently higher trading of put options versus call options.
This week’s chart looks at a 21-day moving average of the daily CBOE Equity Put/Call Volume Ratio. 21 trading days is roughly one month, and so it can make for a useful lookback period for this purpose. It smooths out the daily spikes, and allows us to see what the Put/Call numbers have been doing more broadly. When it gets to an extended level, either high or low, it says that prices should be at a meaningful turning point.
Other lookback periods can also be useful. I like to use a 5-day MA for this purpose also.
One problem is identifying where “high” and “low” reading thresholds are. The horizontal dashed lines are arbitrarily placed on the chart, using the LAR method ("Looks About Right"). And there can be some drift over time, as some periods see generally higher or lower numbers than other periods.
To grapple with that, years ago I did some tinkering and came up with this next indicator. It involves a lot more computations, but it is based on the same raw data. Its formula is as follows:
21MA(calls) – 21MA(puts)
-----------------------------------
[21MA(calls) + 21MA(puts)]
Next, I calculate a 50-day MA of that ratio. Finally, I measure how far that ratio is away from its 50MA to get the indicator you see here:
By first averaging the numbers of calls and puts separately, I allow for greater-volume days to not get washed out into just the daily ratios. By placing calls ahead of puts in the formula, instead of the normal Put/Call Ratio, I am flipping the orientation of the plot to better correlate with how prices behave. And by measuring the deviation from the 50MA, I am correcting for any drift over time in the normal levels of puts and calls, making for a nice clean oscillator with more well-defined boundaries of “normal” range behavior.
Interpretationally, the net result is the same in terms of showing us an extended condition right now. Once again, I have set the dashed horizontal lines using the LAR method, and that seems okay for this purpose. Someone else who might replicate this indicator could come up with a more scientific method of designating “high” and “low”, and I would not quibble with that.
The immediate message of this indicator now is that equity options traders have been a whole lot more interested in trading puts lately versus calls. That is a sign of trader pessimism, and when pessimism (or optimism) goes too far, it gives us a useful message.
Tom McClellan,
Editor
Read Full Story »»»
• DiscoverGold
|
Followers
|
61
|
Posters
|
|
|
Posts (Today)
|
0
|
Posts (Total)
|
20496
|
|
Created
|
06/02/11
|
Type
|
Free
|
| Moderator MiamiGent | |||
| Assistants DiscoverGold mathew633 dDT | |||
|
Posts Today
|
0
|
|
Posts (Total)
|
20496
|
|
Posters
|
|
|
Moderator
|
|
|
Assistants
|
| Volume | |
| Day Range: | |
| Bid Price | |
| Ask Price | |
| Last Trade Time: |


