


| Followers | 679 |
| Posts | 140823 |
| Boards Moderated | 36 |
| Alias Born | 03/10/2004 |
Sunday, September 01, 2019 9:18:24 AM
DP WEEKLY WRAP: Seriously Suspecting September Seasonality
By: Carl Swenlin | August 30, 2019
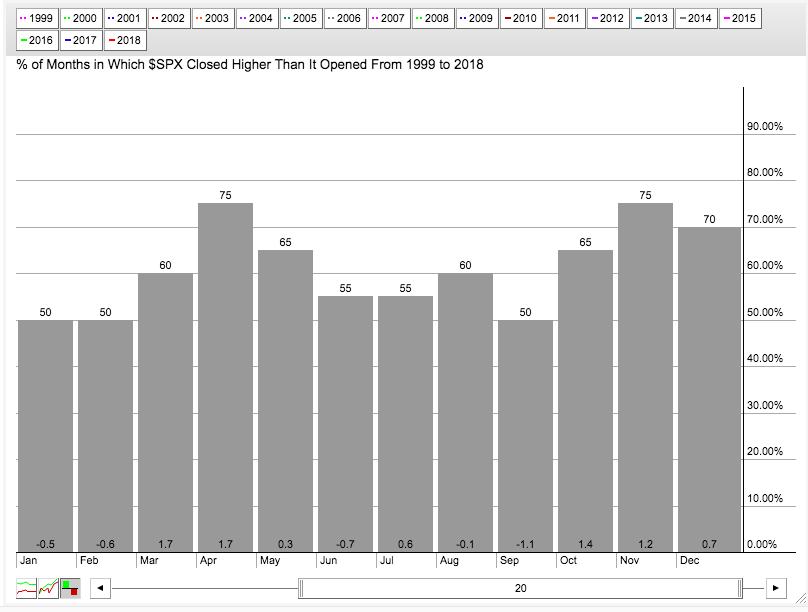
The month of September has a reputation for being a bad month for the stock market. After the October 1987 Crash, the month of October carried a bad rep for years, but more recently we are told that it's really September we have to watch out for. On the old decisionpoint.com website I used to keep a set of charts going back to the 1920s that tracked the two annual six-month seasonality periods -- favorable November through April and unfavorable May through October. The theory seemed to work statistically, but taken year to year, I found it more useful to just rely on traditional price chart analysis. Below is a chart available on the StockCharts.com Member Dashboard showing the monthly seasonality for the 20 years going back to 1999. Note that it is a binary measurement, showing the percentage of times that the market closed higher in a given month. We can see that September closed higher fifty percent of the time, but the average change was a -1.1% decline, making September the worst performing month in the 20-year period. All things considered, I don't find this very helpful. Maybe the best idea is to keep seasonality tendencies tucked in the back of our minds, while we base our actual decisions primarily upon what we see on the charts.
GLOBAL MARKETS
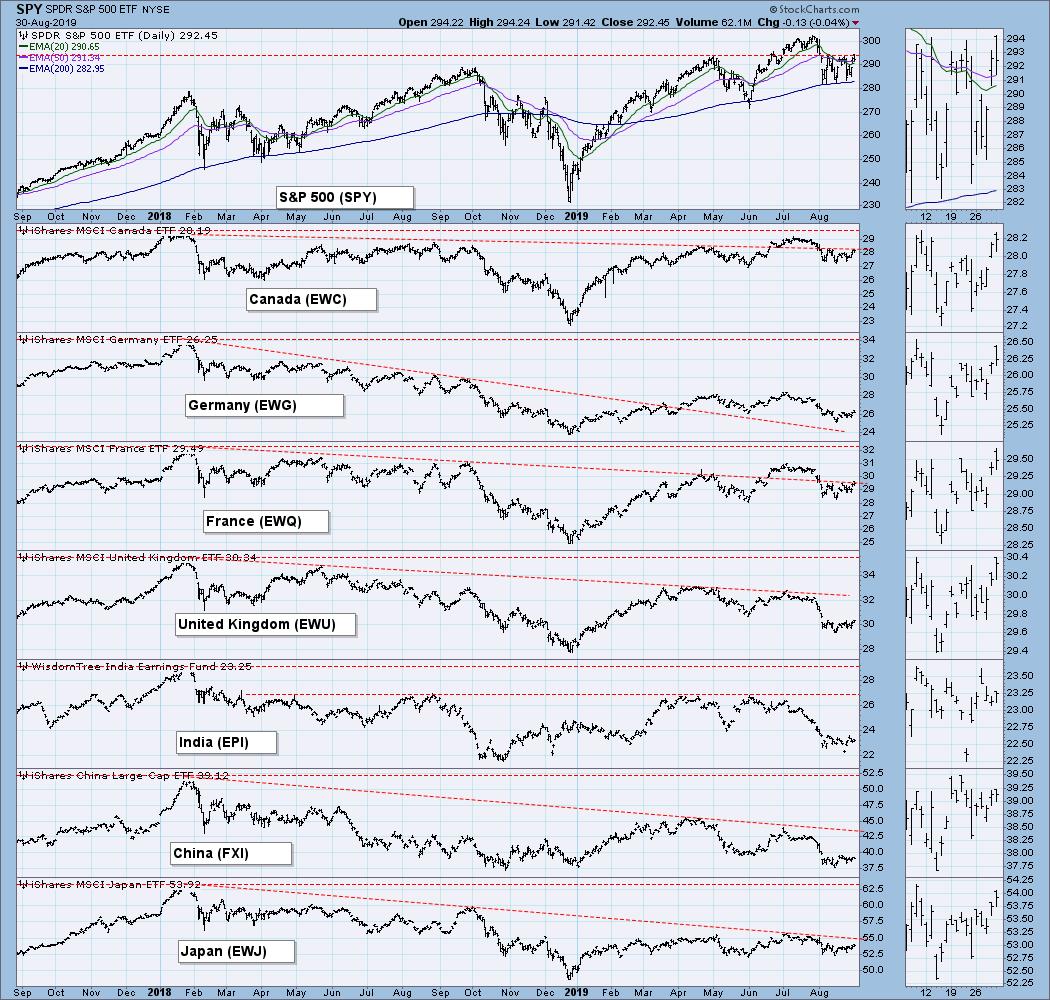
These charts are included in this report because I think, for background, we need to be generally aware of what these indexes are doing, but on a deeper level, I don’t really care enough to get into a tedious analysis of them. Look at the charts, get a general impression, and move on. A picture is worth a thousand words. Look at the picture and think.
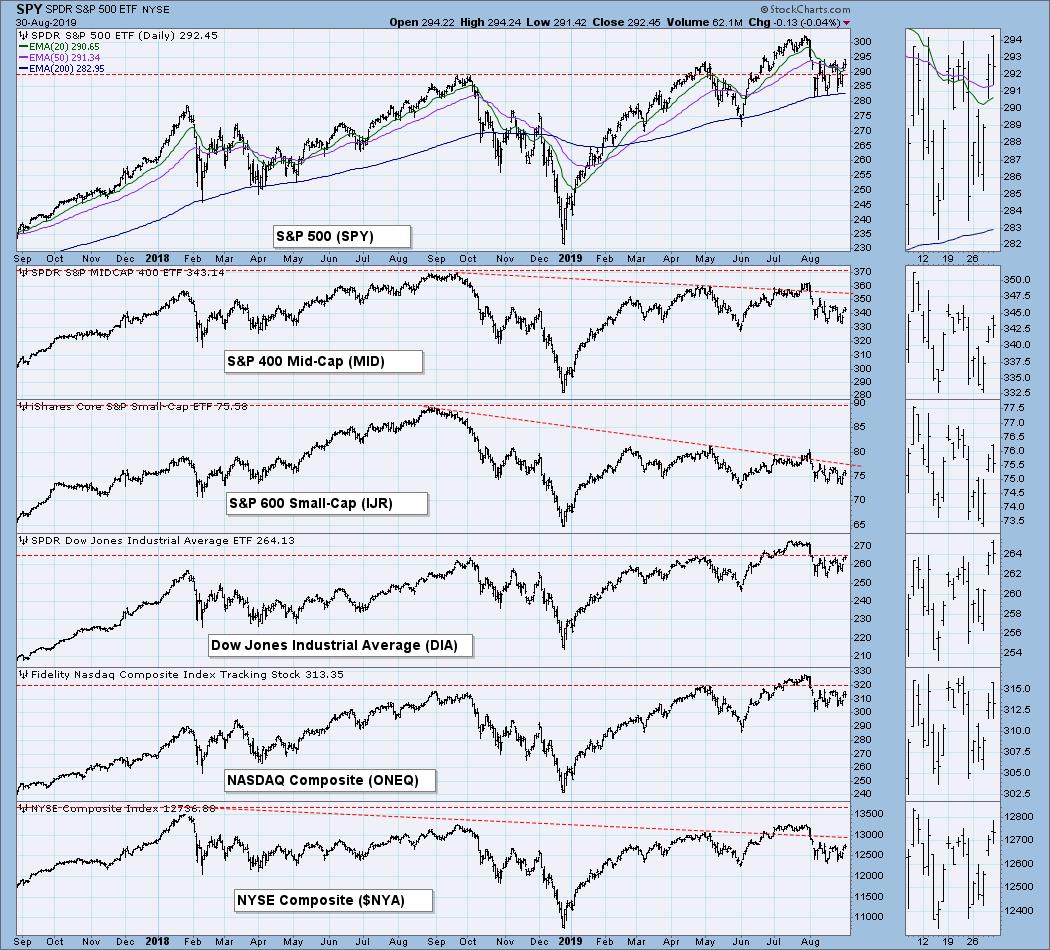
BROAD MARKET INDEXES
Smaller-cap indexes are lagging behind.
SECTORS
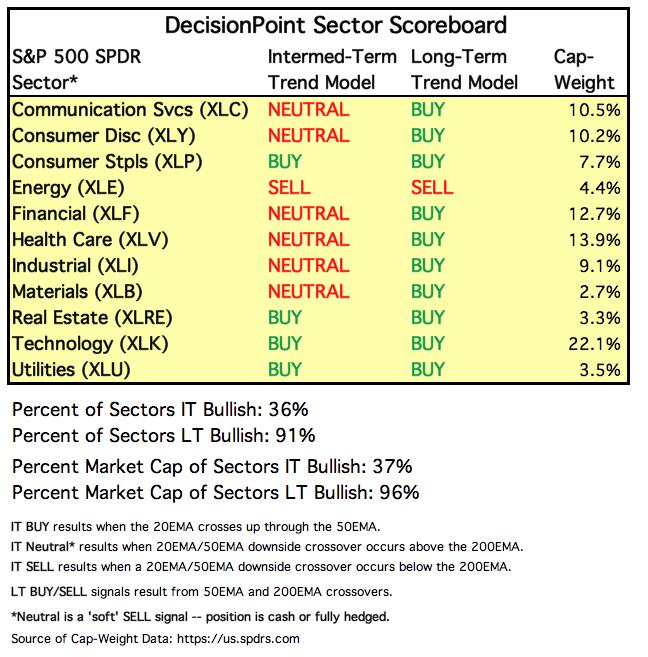
Each S&P 500 Index component stock is assigned to one, and only one, of 11 major sectors. This is a snapshot of the Intermediate-Term and Long-Term Trend Model signal status for those sectors.
INTEREST RATES
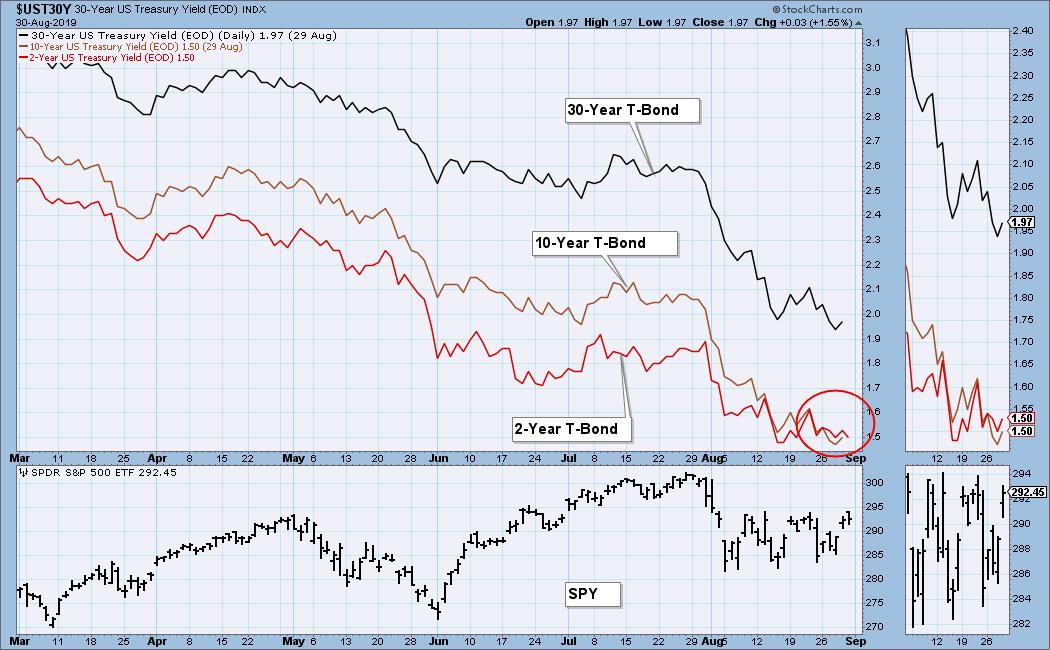
In normal circumstances, the longer money is borrowed the higher the interest rate that must be paid. When rates are inverted, the reverse is true. It is generally believed that rate inversions result from "a flight to safety." On the chart below shows the inversion of the 10-Year T-Bond and the 2-Year T-Bond, traditionally the inversion most talked about.
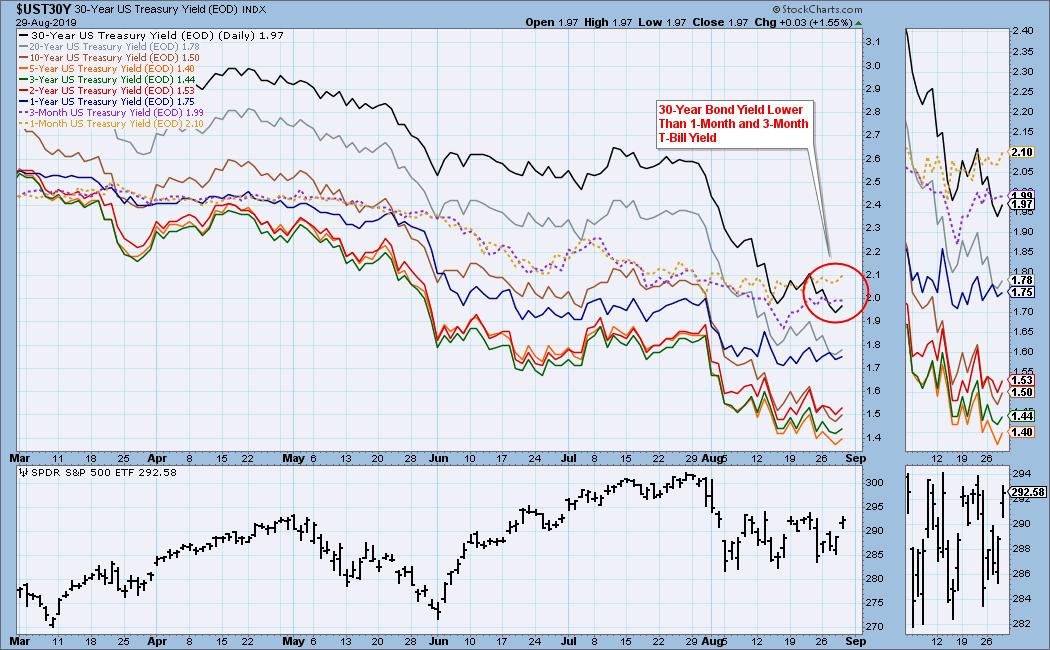
The following is our interest rate array chart. Note that the 1-Month and 3-Month T-Bills have a higher yield than the 30-Year T-Bond.
STOCKS
IT Trend Model: NEUTRAL as of 8/15/2019
LT Trend Model: BUY as of 2/26/2019
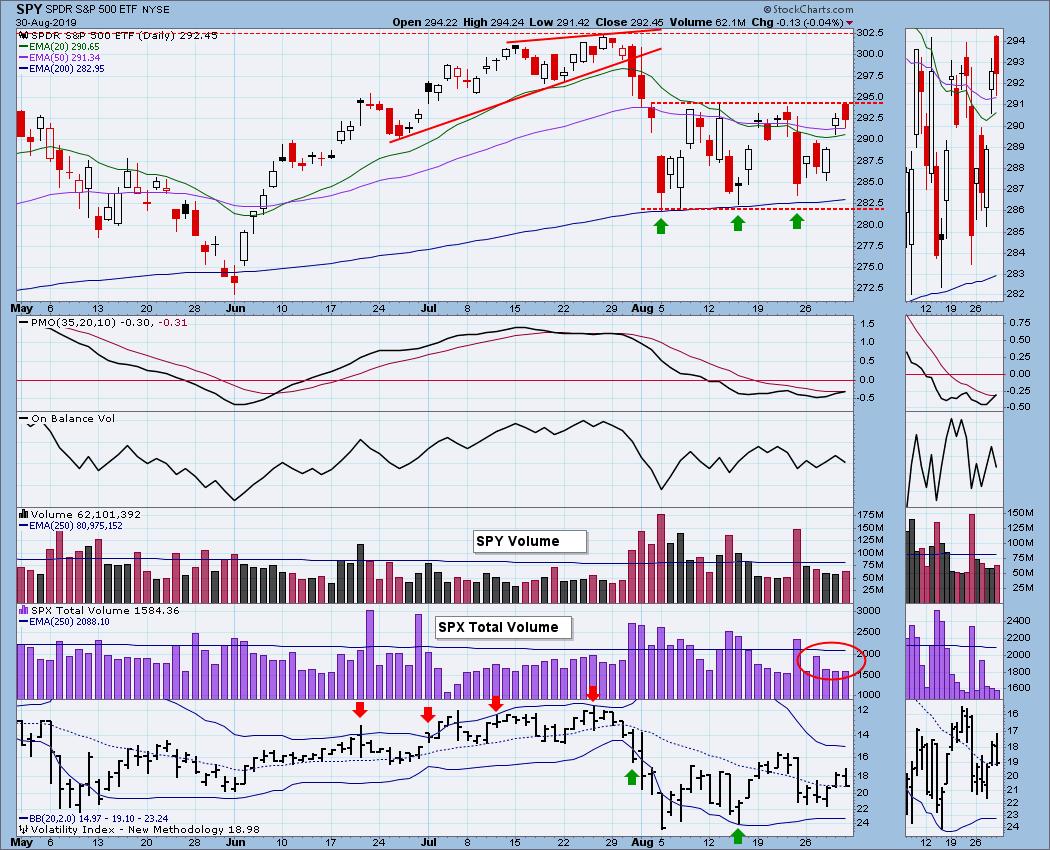
SPY Daily Chart: Except for the first trading day, price in the month of August has been locked in 4.2% trading range, where it went nowhere in an interesting fashion. There were an abundance of big up days and big down days. While the market didn't break down from the trading range, it also couldn't manage to break out of it either. Since this continuation pattern has formed subsequent to the breakdown from the July price top, we must assume that the ultimate resolution should be downward.
SPY Weekly Chart: The weekly PMO slowed its descent because of the price advance this week, but it is still below the signal line and falling, a very negative configuration.
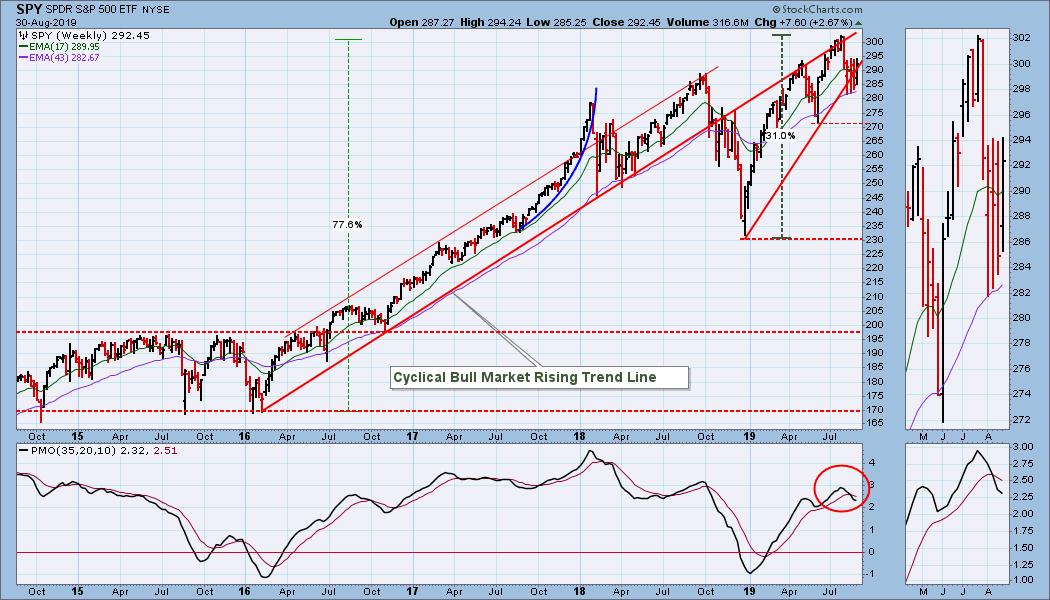
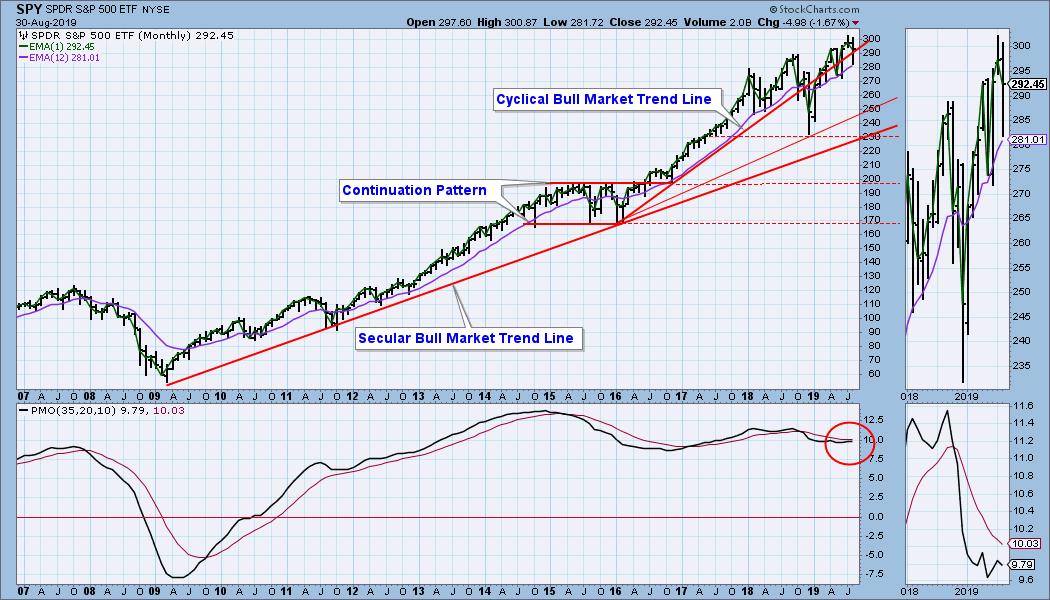
SPY Monthly Chart: The monthly PMO is also below the signal line and falling. We note that there have been a number of PMO direction changes this year, so the most recent is not necessarily decisive.
Climactic Market Indicators: There have been a large number of net breadth and net volume climaxes this month, but none of them have initiated a durable change of direction. The Bollinger Bands are beginning to squeeze the VIX, which means to me that we will see a resolution of the market's trading range sooner than later.
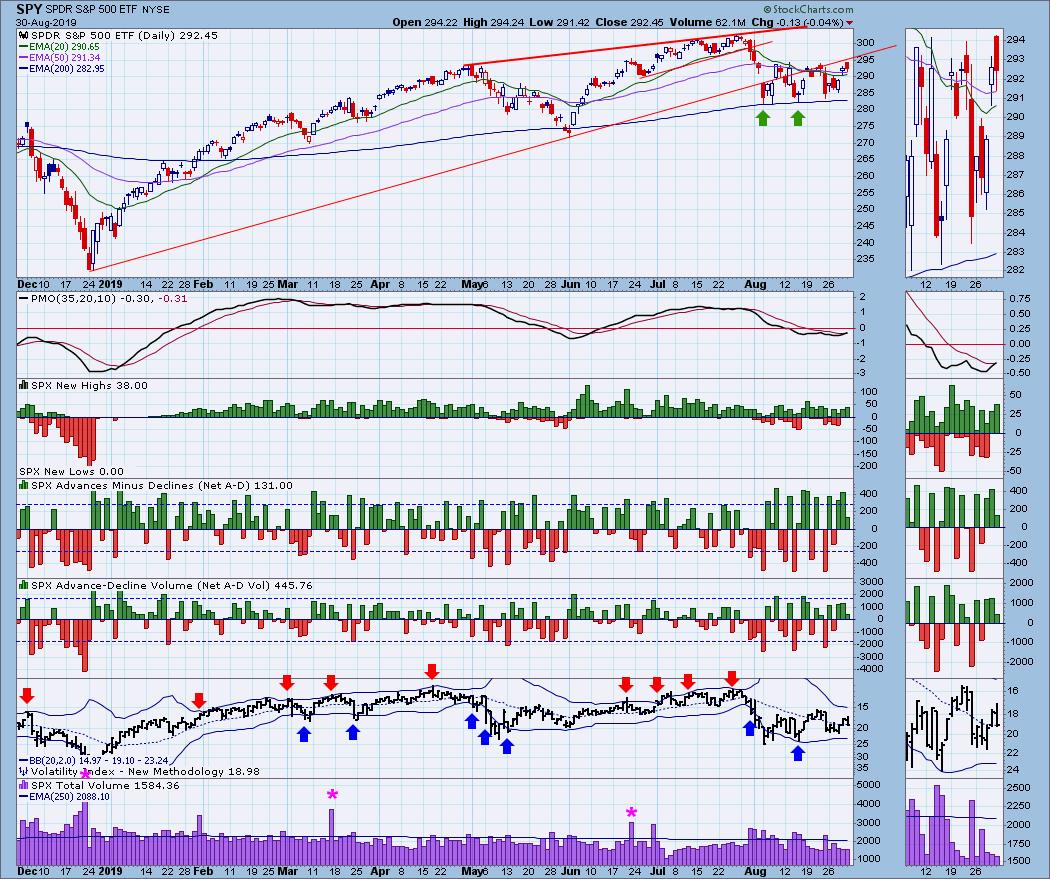
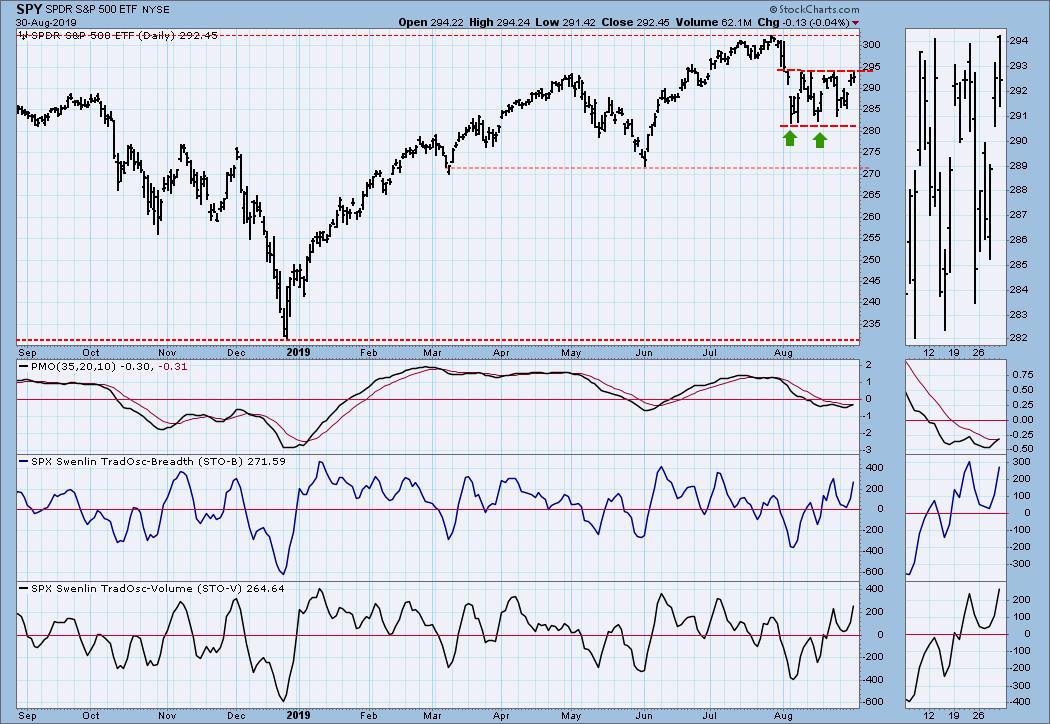
Short-Term Market Indicators: The STO-B and STO-V are oversold again, so we should expect some weakness in this time frame.
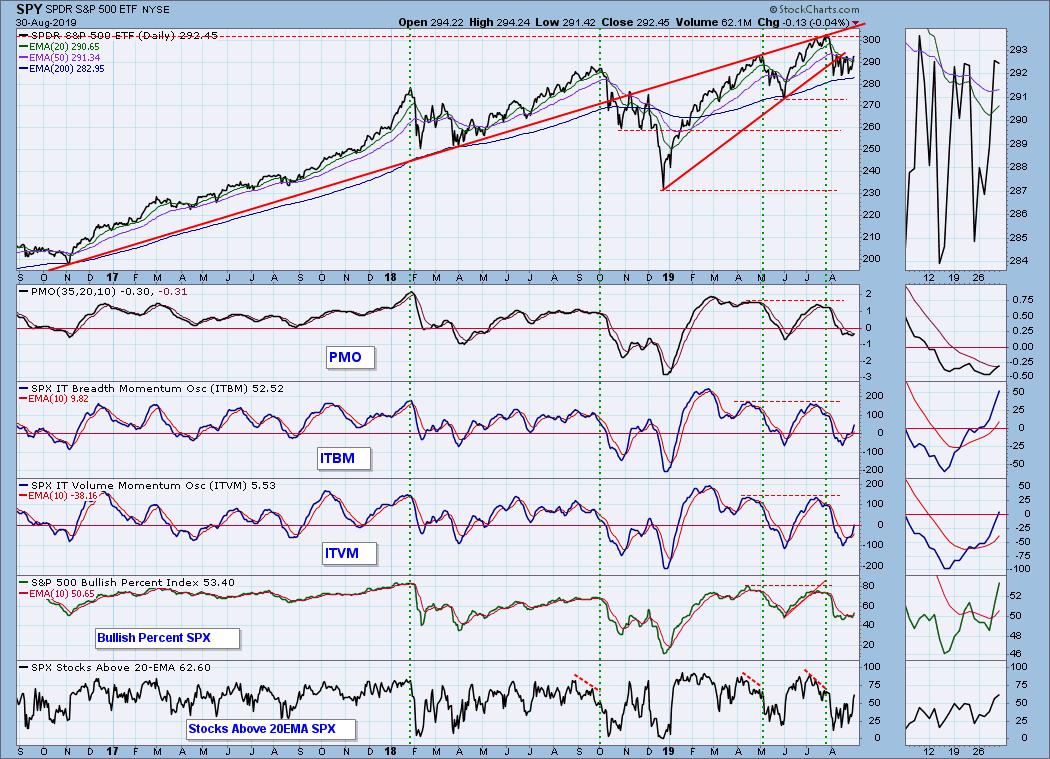
Intermediate-Term Market Indicators: These indicators are all rising, but they are also in the neutral zone. Being neither overbought or oversold, they do not, by themselves, favor any particular resolution in this time frame.
CONCLUSION: For all my skepticism regarding seasonality, it may be relevant to the current setup. The market broke down this month and entered a consolidation, aka continuation pattern. This configuration sends a message that lower prices can be expected. September's negative seasonality aligns perfectly with this expectation, and it could exacerbate the negative outcome.
Read Full Story »»»
 • DiscoverGold
Click on "In reply to", for Authors past commentaries
By: Carl Swenlin | August 30, 2019
The month of September has a reputation for being a bad month for the stock market. After the October 1987 Crash, the month of October carried a bad rep for years, but more recently we are told that it's really September we have to watch out for. On the old decisionpoint.com website I used to keep a set of charts going back to the 1920s that tracked the two annual six-month seasonality periods -- favorable November through April and unfavorable May through October. The theory seemed to work statistically, but taken year to year, I found it more useful to just rely on traditional price chart analysis. Below is a chart available on the StockCharts.com Member Dashboard showing the monthly seasonality for the 20 years going back to 1999. Note that it is a binary measurement, showing the percentage of times that the market closed higher in a given month. We can see that September closed higher fifty percent of the time, but the average change was a -1.1% decline, making September the worst performing month in the 20-year period. All things considered, I don't find this very helpful. Maybe the best idea is to keep seasonality tendencies tucked in the back of our minds, while we base our actual decisions primarily upon what we see on the charts.

GLOBAL MARKETS
These charts are included in this report because I think, for background, we need to be generally aware of what these indexes are doing, but on a deeper level, I don’t really care enough to get into a tedious analysis of them. Look at the charts, get a general impression, and move on. A picture is worth a thousand words. Look at the picture and think.

BROAD MARKET INDEXES
Smaller-cap indexes are lagging behind.

SECTORS
Each S&P 500 Index component stock is assigned to one, and only one, of 11 major sectors. This is a snapshot of the Intermediate-Term and Long-Term Trend Model signal status for those sectors.

INTEREST RATES
In normal circumstances, the longer money is borrowed the higher the interest rate that must be paid. When rates are inverted, the reverse is true. It is generally believed that rate inversions result from "a flight to safety." On the chart below shows the inversion of the 10-Year T-Bond and the 2-Year T-Bond, traditionally the inversion most talked about.

The following is our interest rate array chart. Note that the 1-Month and 3-Month T-Bills have a higher yield than the 30-Year T-Bond.

STOCKS
IT Trend Model: NEUTRAL as of 8/15/2019
LT Trend Model: BUY as of 2/26/2019
SPY Daily Chart: Except for the first trading day, price in the month of August has been locked in 4.2% trading range, where it went nowhere in an interesting fashion. There were an abundance of big up days and big down days. While the market didn't break down from the trading range, it also couldn't manage to break out of it either. Since this continuation pattern has formed subsequent to the breakdown from the July price top, we must assume that the ultimate resolution should be downward.

SPY Weekly Chart: The weekly PMO slowed its descent because of the price advance this week, but it is still below the signal line and falling, a very negative configuration.

SPY Monthly Chart: The monthly PMO is also below the signal line and falling. We note that there have been a number of PMO direction changes this year, so the most recent is not necessarily decisive.

Climactic Market Indicators: There have been a large number of net breadth and net volume climaxes this month, but none of them have initiated a durable change of direction. The Bollinger Bands are beginning to squeeze the VIX, which means to me that we will see a resolution of the market's trading range sooner than later.

Short-Term Market Indicators: The STO-B and STO-V are oversold again, so we should expect some weakness in this time frame.

Intermediate-Term Market Indicators: These indicators are all rising, but they are also in the neutral zone. Being neither overbought or oversold, they do not, by themselves, favor any particular resolution in this time frame.

CONCLUSION: For all my skepticism regarding seasonality, it may be relevant to the current setup. The market broke down this month and entered a consolidation, aka continuation pattern. This configuration sends a message that lower prices can be expected. September's negative seasonality aligns perfectly with this expectation, and it could exacerbate the negative outcome.
Read Full Story »»»
 • DiscoverGold
 Click on "In reply to", for Authors past commentaries
Information posted to this board is not meant to suggest any specific action, but to point out the technical signs that can help our readers make their own specific decisions. Your Due Dilegence is a must!
• DiscoverGold
Join the InvestorsHub Community
Register for free to join our community of investors and share your ideas. You will also get access to streaming quotes, interactive charts, trades, portfolio, live options flow and more tools.

