A Volatile, But Sound, Month By: SentimenTrader | August 26, 2019
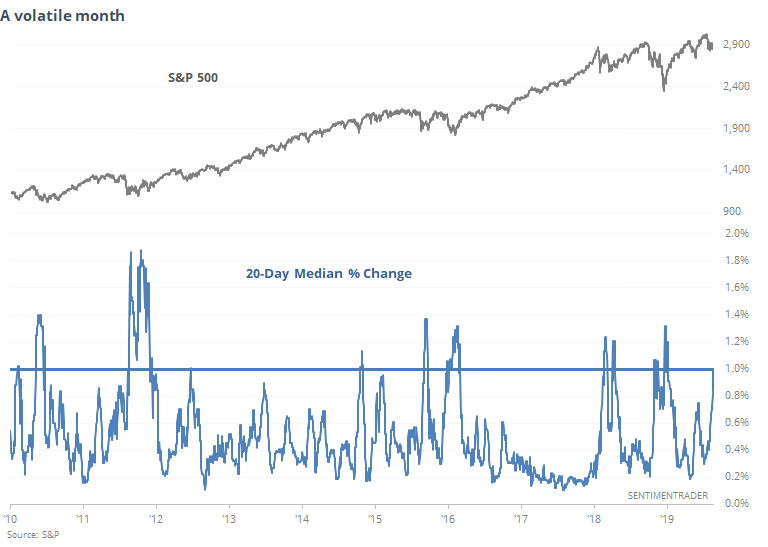
Quite A Month
We seem to be on track for another whipsaw, as markets try to recover from conflicting messages over the weekend, following a rocky end to the week.
Except for the 1930s, this kind of volatility so soon after stocks were sitting at a multi-year high led to almost universally positive returns going forward, and didn't roll over into a bear market at least for the next few months.
Extreme Anxiety
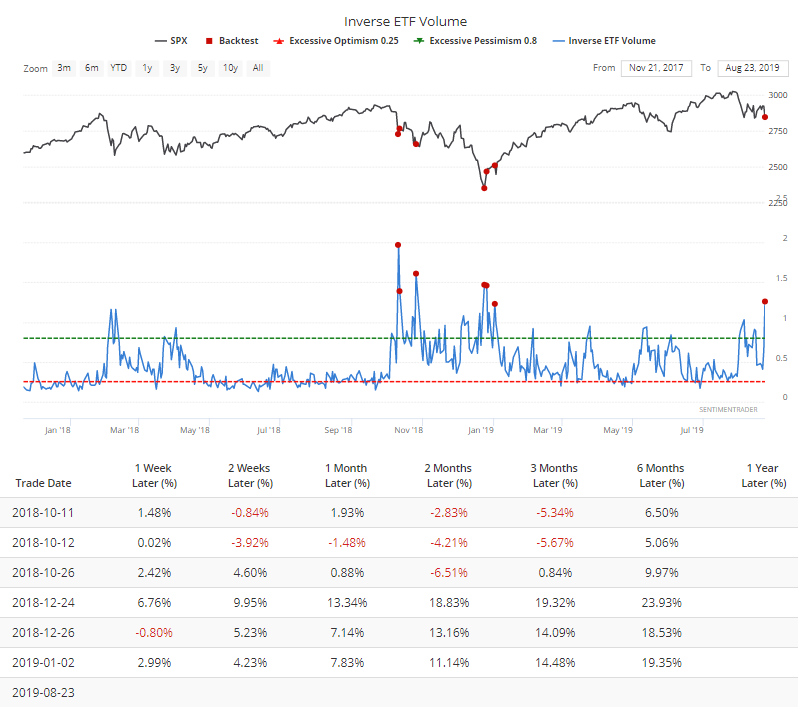
More of our indicators registered severe pessimism on Friday. Among them, investors rushed into inverse ETFs on Friday to protect against any potential downside this week. They accounted for more than 1.2% of total NYSE volume, one of the largest amounts in history. The others all triggered last October or December (or right away in January).
Fundamentally Sound
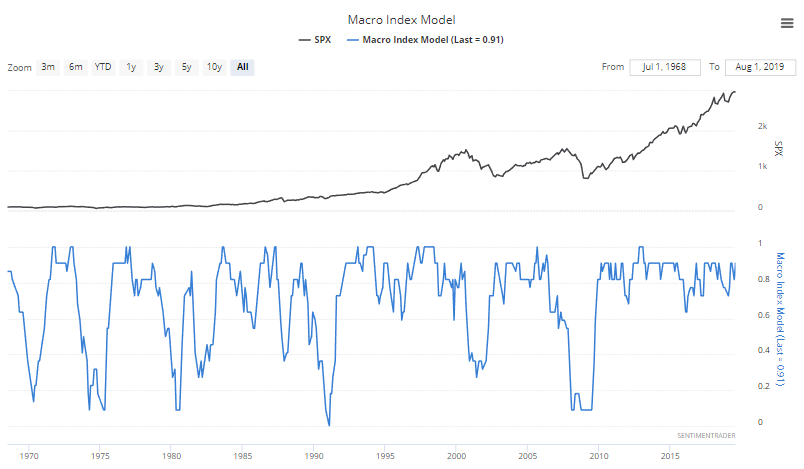
The economy and the stock market move in the same direction in the long term. Hence, leading economic indicators are also long term leading indicators for the stock market.
1. Leading economic indicators sometimes deteriorate significantly BEFORE a bear market begins, e.g. 2006-2007. 2. Leading economic indicators sometimes deteriorate significantly AFTER a bear market begins (e.g. 1969, 1973, 2000).
But for the cases in which leading indicators deteriorated AFTER a bear market began, the bear markets' worst parts (e.g. 2001, 1974) occurred after the leading indicators deteriorated significantly. Let's look at these leading indicators.
Here is our Macro Index, which aggregates 11 leading indicators. Overall, there is no significant U.S. economic deterioration right now. Instead of predicting the future, macro tells us how to react and trade day-by-day depending on what's happening right now.
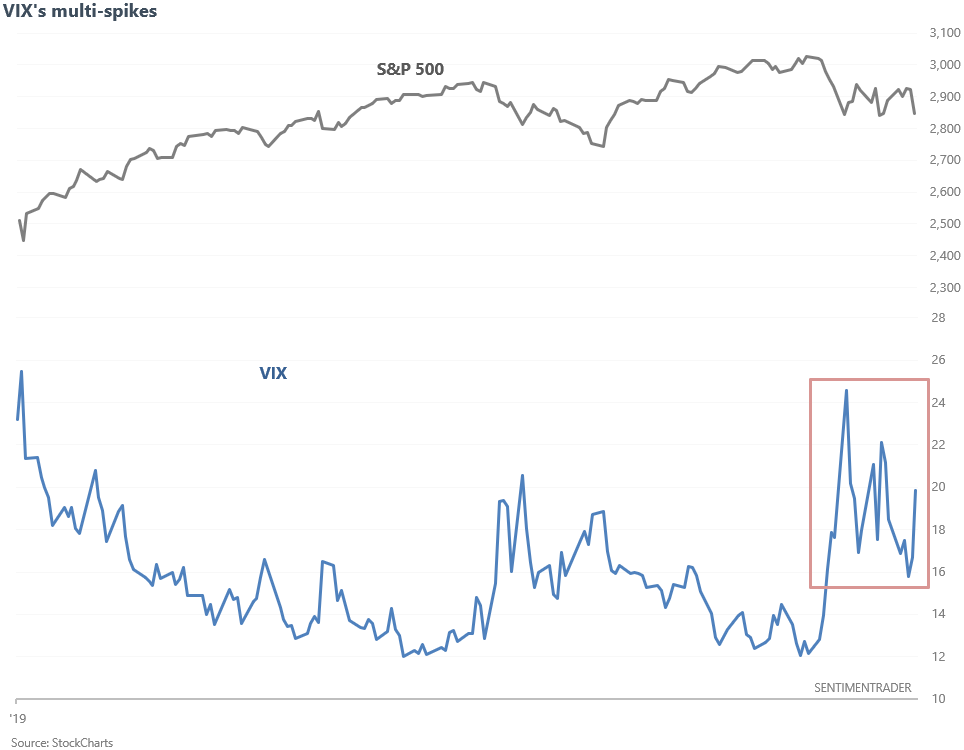
Volatility
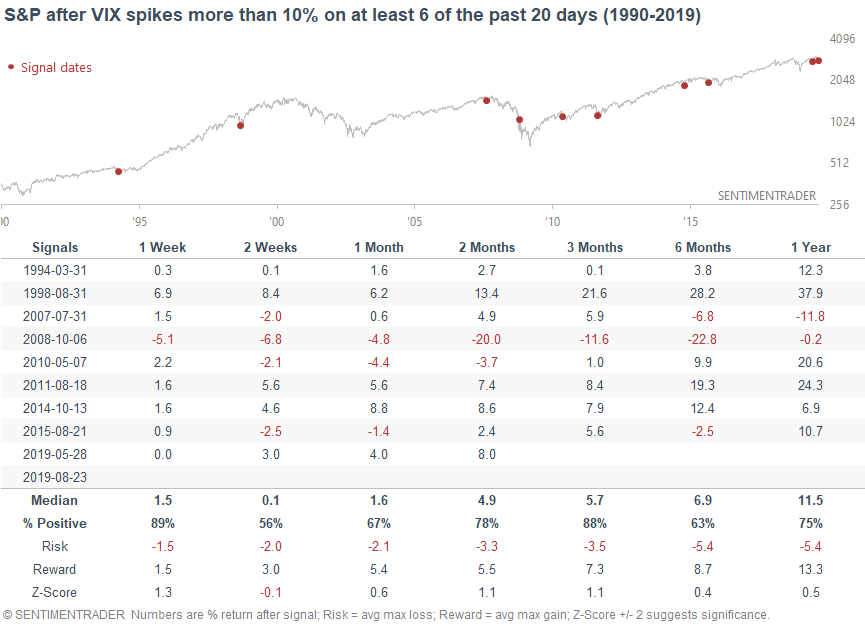
The stock market seems to panic once every few days. 6 of the past 20 days (4 weeks) have seen daily VIX spikes > 10%.
When this happened in the past, the S&P usually did well over the next 3 months. The one big exception was October 2008, which occurred during the middle of a mega-crash.
Information posted to this board is not meant to suggest any specific action, but to point out the technical signs that can help our readers make their own specific decisions. Your Due Dilegence is a must! • DiscoverGold
Register for free to join our community of investors and share your ideas. You will also get access to streaming quotes, interactive charts, trades, portfolio, live options flow and more tools.


 News
News  Market Data
  Discover