 News
News  Market Data
  Discover
Support: 888-992-3836
Copyright © 2023 InvestorsHub Inc.


Register for free to join our community of investors and share your ideas. You will also get access to streaming quotes, interactive charts, trades, portfolio, live options flow and more tools.
Looking at that TMC vrs GDP chart (reportedly Buffett's favorite metric for determining overall market valuations), the next recession should bring it back down from 140 toward the mean of 80. A recession is overdue and could come next year, even with the Fed now in dovish mode and trying engineer a soft landing. But that chart speaks volumes, and the fact that Buffett uses it also speaks volumes.
John Bogle said that his personal 'most bearish' asset allocation was 50/50 stocks to bonds (he would normally be 70% or 80% in stocks). Adjusting the asset allocation is about as close as Bogle would ever come to market timing, and because stocks have a much higher return over the long haul, avoiding stocks completely is a very bad idea. As we know, Bogle was strongly against market timing and trying to pick individual stocks.
>>> One of Warren Buffet's favorite metrics is flashing red — a sign that corporate profits are due for a hit
Fortune
by Shawn Tully
7-17-19
https://www.msn.com/en-us/money/savingandinvesting/one-of-warren-buffets-favorite-metrics-is-flashing-red-%e2%80%94-a-sign-that-corporate-profits-are-due-for-a-hit/ar-AAEtoGA?li=BBnb7Kz&ocid=mailsignout#page=2
Here's a crucial question for investors that the Wall Street crowd seldom addresses: Can corporate profits keep booming by growing faster than the economy? Is this the new normal, or will the GDP-gobbling trend reverse, as it always has in the past, turning today's record-shattering rally into a rout?
Shareholders beware. It's the unhinging of profits from the overall economy that has been propelling stock prices, and that dynamic is now in danger. Either the normal ebb and flow of markets will pull equity values back to their traditional share of GDP, or Congress is likely to do the job by attacking Big Tech and mandating that workers get a lot more of the bounty now flowing to shareholders. Either way, America's companies and its economy are one in the same. Over the long-term, they need to move in tandem. And if they stray too far apart, getting back to balance can pummel share prices.
The S&P 500's fantastic performance since late 2016 is all about earnings. Since the fourth quarter of that year, profits, based on the trailing twelves months of GAAP earnings, have jumped 41% to a blowout record of $134.39 per share. In that period, share prices have followed earnings like a postage stamp on a letter, rising precisely the same number to just over 3000. That's because investors are awarding shares a consistent P/E multiple in the 22 to 24 range.
But it's critical to assess whether or not a profit bubble has driven shares to unsustainably high prices.
To gauge if that's happened, let's examine one of the best measures of where stocks stand on the continuum from excessively cheap to dangerously expensive. It's the ratio of Total Market Cap (TMC), the value of all U.S. publicly traded companies, versus GDP, the value of all goods and services produced annually within our borders. Put simply, it shows the dollar size of the equity market as a share of the economy.

If the value of equities represents a far bigger than average share of national income, it probably means that epic earnings are devouring a much bigger share of national income than usual, leaving less for wages. That's certainly the case today. In the past, the gravitational force of competition for both goods and labor has always restored balance by curbing excessive profits, and in most cases, driving down stock prices.
The TMC to GDP ratio is a favorite yardstick of Warren Buffett, who's stated, that "it's probably the best measure of where valuations stand at any given moment." (We'll refer to the measure as the "cap ratio.")
Today, the value of all stocks to national income stands at 146.4. That's the second highest reading in the past half-century, exceeded only by the 148.5 posted at the peak of the dot.com bubble on March 30, 2000. The cap ratio has averaged around 80 over the past decade, so it now exceeds that benchmark by 80%.
The cap ratio has varied widely over the past five decades, but typically returns to that reading of 80 after spiking well above, and plunging far below, that mean. By definition, over each period the ratio starts and ends at 80, earnings simply grow with GDP. (We'll express GDP in 'nominal,' not inflation-adjusted terms.) Still, it's informative to study the careening course in between.
We'll start at the 80 mark reached at the start of 1971. The cap ratio fell as low as 35 in the deep 1982 recession, and generally stayed below 50 from 1976 to 1986. It didn't get back to 80 until the end of 1995, an interlude of 25 years. Over that period, the S&P 500 rose on average 7.3% a year, reflecting economic growth inflated by high inflation from the oil shock of the 1970s and early 1980s.
From that 80 reading at the end of 1995, through March 30 of 2000, the cap ratio went wild, jumping 86% to that record level of almost 150 at the height of the internet craze. Then, gravity took over, and by April of 2003, the "cap" had crashed back to 80. Over that 7-plus year period, the S&P 500 rose by a more or less normal 5.6%, half as fast as in the past half-decade, once again, tracking GDP.
From the 80 reading in early 2003, the ratio plunged to the low 50s during the 2009 financial crisis, and didn't hit 80 again until October of 2011. Over those seven-and-a-half years, the S&P gained just 3.1% annually, as cratering home prices hobbled the economy.
Since returning to a "normal" level in late 2011, the cap ratio soared hockey-stick style, hitting the current 146.2 while suffering only minor blips along the way. Over those 7 years and 9 months, GDP rose 35%, from $15.6 trillion to $21.1 trillion. Total market cap leaped from $12.6 trillion to $3.014 trillion, or 148%. The S&P 500 delivered annual gains of 11%, while national income rose less than half as fast, by 4%.
Put simply, companies cut back on workers, held down wages, feasted from low interest rates on their debt, and otherwise benefited from a perfect calm for profits. And those trends totally trumped mediocre economic growth.
Two additional measures are flashing red. I often interviewed Milton Friedman, the legendary economist, before his death in 2006. Friedman told me that "in the long term, earnings cannot remain above their historical average as a share of national income." The Nobel laureate also declared that although profit performance determines companies' values over lengthy periods, "markets in the short term are far from 'efficient,'" meaning that equity prices can vary significantly from the enterprises' underlying value.
Today, according to the St. Louis Federal Reserve, corporate profits account for 9.2% of GDP. That's one-third higher than the half-century average of 7%. Since profits normally "revert to the mean" a la Friedman, that gap is destined to shrink. Operating margins also look unsustainably high. According to S&P, the figure for the S&P 500 averaged 11.25% over the past four quarters, 25% above the average of 9% posted in the previous 30 quarters.
It's conceivable that our economy really has changed, as the break-up-tech crowd in Congress argues, and that internet is enabling tech giants to operate as monopolies. That's the position adopted by a number of influential economists, including former Treasury Secretary Larry Summers. Another possibility: Because they're so profitable, these players are prime targets by hungry startups that will eventually erode their profitability.
The best bet is that equity valuations return to a more normal share of national income. The past few years look like the kind of crazy uncoupling that happens every couple of decades, not a structural downshift from the world's most competitive market to a network of cartels.
The market hasn't failed to rein in runaway profits yet, and it won't fail this time.
<<<
Gold's role in asset allocation -
Trying to figure out where gold 'should' be trading is tough since central banks have routinely suppressed the price to make their own unbacked fiat currencies look better/less bad. And China has possibly been suppressing the gold price in order to continue accumulating on the cheap.
As Jim Rickards points out, gold itself isn't really good for very much except as money, or as a backing for money. Countries like China and Russia have been aggressively building up their gold reserves over the past decade for a reason. When the coming financial reset comes (SDR), having large gold reserves will give a country a strong place at the global 'dinner table'.
There's a good chance the SDR will need to be partially backed by gold, at least in the beginning. Rickards does the math, and to provide a 40% backing would put the gold price at approx $10,000/ounce. During the transition to the SDR, US paper assets like stocks/bonds will be hit big time. Rickards says the US standard of living could drop 60% overnight as the dollar loses its role as the world's reserve currency to the SDR. The dollar will become just another 'local' currency for use within the US.
Rickards recommends investors have 10% in physical gold as disaster insurance. You hope the gold doesn't do well since that means your paper investments are still doing OK. In a $1 mil portfolio with $100 K in gold (70 ounces), $200 K in cash, $350 K in stocks, $350 K in bonds, if the stocks and bonds dropped 50% and gold went to $10,000/oz, your portfolio would be worth $1.25 mil instead of the $600 K it would be worth without the gold.
So think of gold as portfolio insurance, a diversification tool. You don't want a huge position in gold, but 10% could save the day when the dollar system unravels, as it eventually will. The global finance 'oligarchy' have been preparing the way for the SDR for a long time. They know the US dollar won't be suitable as the world's reserve forever, and the SDR has many advantages.
>>> Sector investing using the business cycle
It may be possible to enhance returns over an intermediate time horizon.
FIDELITY VIEWPOINTS
5/31/2019
https://www.fidelity.com/viewpoints/investing-ideas/sector-investing-business-cycle?ccsource=email_weekly
Key takeaways
The business cycle can be a determinant of sector performance over the intermediate term.
The phases of the economy provide a framework for sector allocation.
For example, the consumer discretionary and industrials sectors tend to outperform in the early cycle.
Over the intermediate term, asset performance is often driven largely by cyclical factors tied to the state of the economy, such as corporate earnings, interest rates, and inflation. The business cycle, which encompasses the cyclical fluctuations in an economy over many months or a few years, can therefore be a critical determinant of equity market returns and the performance of equity sectors. This article demonstrates Fidelity’s business cycle approach to sector investing, and how it potentially can enhance returns over an intermediate time horizon.
Asset allocation framework
Fidelity’s Asset Allocation Research Team (AART) conducts economic, fundamental, and quantitative research to produce asset allocation recommendations for Fidelity’s portfolio managers and investment teams. Our framework begins with the premise that long-term historical averages provide a reasonable baseline for portfolio allocations. However, over shorter time horizons—30 years or less—asset price fluctuations are driven by a confluence of various short-, intermediate-, and long-term factors that may cause performance to deviate significantly from historical averages. For this reason, incorporating a framework that analyzes underlying factors and trends among the following 3 temporal segments can be an effective asset allocation approach: tactical (1–12 months), business cycle (1–10 years), and secular (10–30 years).
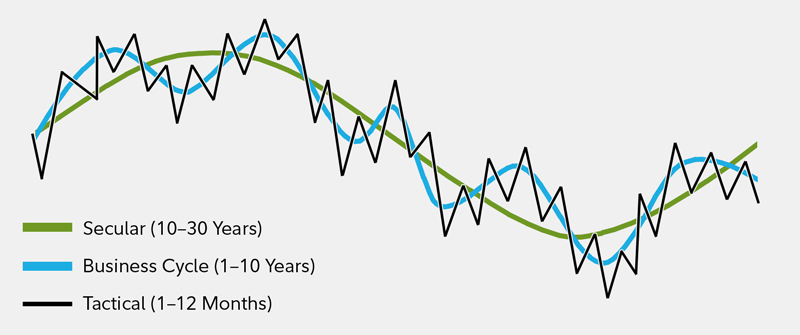
Asset performance is driven by a confluence of various short-, intermediate-, and long-term factors
This chart shows that asset performance is driven by a confluence of various short-, intermediate-, and long-term factors.
For illustrative purposes only. Source: Fidelity Investments, Asset Allocation Research Team (AART).
Understanding business cycle phases
Every business cycle is different in its own way, but certain patterns have tended to repeat themselves over time. Fluctuations in the business cycle are essentially distinct changes in the rate of growth in economic activity, particularly changes in 3 key cycles—the corporate profit cycle, the credit cycle, and the inventory cycle—as well as changes in the employment backdrop and monetary policy. While unforeseen macroeconomic events or shocks can sometimes disrupt a trend, changes in these key indicators historically have provided a relatively reliable guide to recognizing the different phases of an economic cycle. Our quantitatively backed, probabilistic approach helps in identifying, with a reasonable degree of confidence, the state of the business cycle at different points in time. Specifically, there are 4 distinct phases of a typical business cycle (see chart).
Early-cycle phase: Generally, a sharp recovery from recession, marked by an inflection from negative to positive growth in economic activity (e.g., gross domestic product, industrial production), then an accelerating growth rate. Credit conditions stop tightening amid easy monetary policy, creating a healthy environment for rapid margin expansion and profit growth. Business inventories are low, while sales growth improves significantly.
Mid-cycle phase: Typically the longest phase of the business cycle. The mid-cycle is characterized by a positive but more moderate rate of growth than that experienced during the early-cycle phase. Economic activity gathers momentum, credit growth becomes strong, and profitability is healthy against an accommodative—though increasingly neutral—monetary policy backdrop. Inventories and sales grow, reaching equilibrium relative to each other.
Late-cycle phase: Often coincides with peak economic activity, implying that the rate of growth remains positive but slows. A typical late-cycle phase may be characteristic as an overheating stage for the economy when capacity becomes constrained, which leads to rising inflationary pressures. While rates of inflation are not always high, rising inflationary pressures and a tight labor market tend to crimp profit margins and lead to tighter monetary policy.
Recession phase: Features a contraction in economic activity. Corporate profits decline and credit is scarce for all economic actors. Monetary policy becomes more accommodative and inventories gradually fall despite low sales levels, setting up for the next recovery.
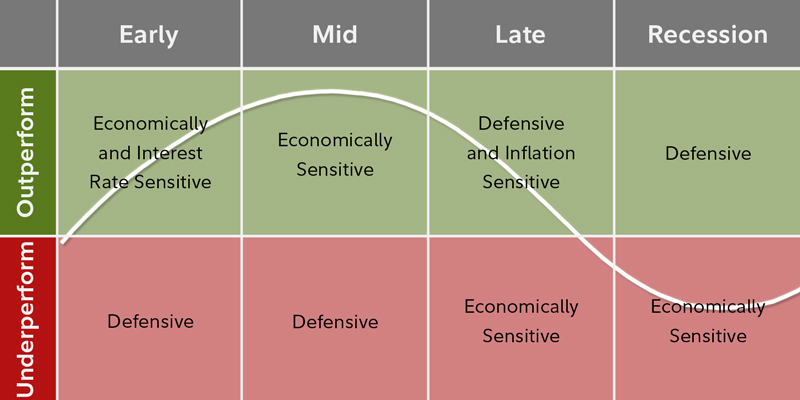
The performance of economically sensitive assets such as stocks tends to be the strongest during the early phase of the business cycle, when growth is rising at an accelerating rate, then moderates through the other phases until returns generally decline during the recession. In contrast, more defensive assets such as Treasury bonds typically experience the opposite pattern, enjoying their highest returns relative to stocks during a recession, and their worst performance during the early cycle.
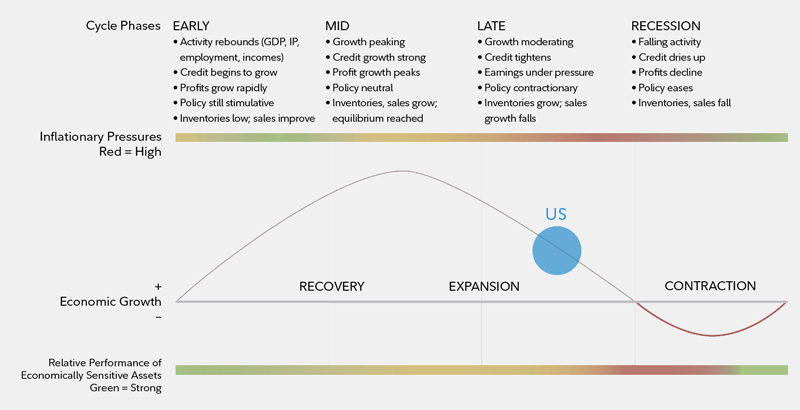
The business cycle has 4 distinct phases. The US is firmly in the late cycle as of 2019.
This graphic shows that the US is firmly in the late cycle as of 2019.
Note: The diagram above is a hypothetical illustration of the business cycle. There is not always a chronological, linear progression among the phases of the business cycle, and there have been cycles when the economy has skipped a phase or retraced an earlier one. Economically sensitive assets include stocks and high-yield corporate bonds, while less economically sensitive assets include Treasury bonds and cash. We use the classic definition of recession, involving an outright contraction in economic activity, for developed economies. Source: Fidelity Investments (AART), as of March 31, 2019.
Equity sector performance patterns
Historical analysis of the cycles since 1962 shows that the relative performance of equity market sectors has tended to rotate as the overall economy shifts from one stage of the business cycle to the next, with different sectors assuming performance leadership in different economic phases.1 Due to structural shifts in the economy, technological innovation, varying regulatory backdrops, and other factors, no one sector has behaved uniformly for every business cycle. While it is important to note outperformance, it is also helpful to recognize sectors with consistent underperformance. Knowing which sectors of the market to reduce exposure to can be just as useful as knowing which tend to have the most robust outperformance.
Early-cycle phase
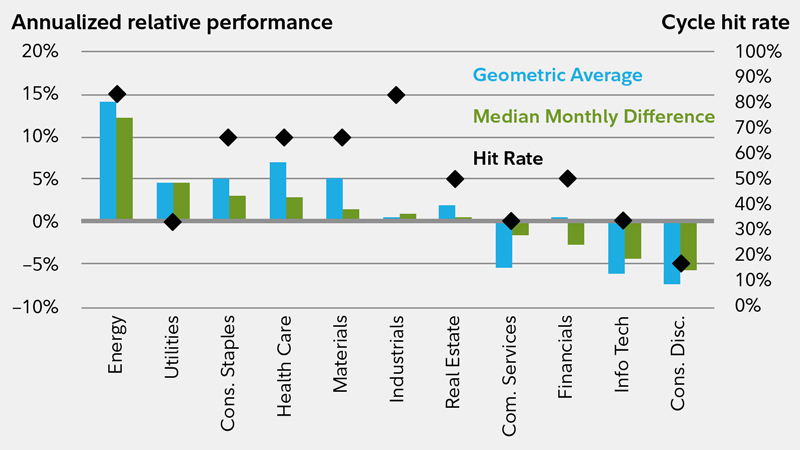
Historically, the early-cycle phase has featured the highest absolute performance. Since 1962, the broader stock market has produced an average total return of more than 20% per year during this phase, and its average length has been roughly one year. On a relative basis, sectors that typically benefit most from a backdrop of low interest rates and the first signs of economic improvement have tended to lead the broader market’s advance. Specifically, interest-rate-sensitive sectors—such as consumer discretionary, financials, and real estate—historically have outperformed the broader market (see chart). These sectors have performed well, due in part to industries within the sectors that typically benefit from increased borrowing, including diversified financials and consumer-linked industries such as autos and household durables in consumer discretionary.
Elsewhere, economically sensitive sectors—such as industrials and information technology—have been boosted by shifts from recession to recovery. For example, the industrials sector has some industries—such as transportation and capital goods—in which stock prices often have rallied in anticipation of economic recovery. Information technology and materials stocks typically have been aided by renewed expectations for consumer and corporate spending strength.
Laggards of the early-cycle phase include communication services and utilities, which generally are more defensive in nature due to fairly persistent demand across all stages of the cycle. Energy sector stocks also have lagged during the early phase, as inflationary pressures—and thus energy prices—tend to be lower during a recovery from recession. From a performance consistency perspective, consumer discretionary stocks have beaten the broader market in every early-cycle phase since 1962, while industrials also have exhibited impressive cycle hit rates. The financials and information technology sectors both have had healthy average and median relative performance, though their low hit rates are due in part to the diversity of their underlying industries. The communication services sector has historically underperformed in the early-cycle phase, but its evolving mix of industries provides less confidence in the persistence of this pattern moving forward.
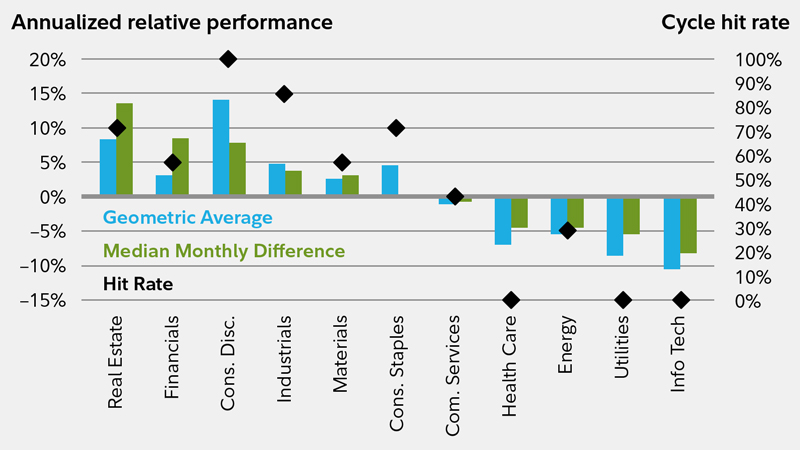
Sectors that have performed well in the early cycle are interest-rate sensitive and economically sensitive sectors
This chart shows sectors that have performed well in the early cycle.
Includes equity market returns from 1962 through 2016. Returns are represented by the top 3000 US stocks ranked by market capitalization. Sectors as defined by GICS. Source: Fidelity Investments (AART), as of March 31, 2019. Past performance is no guarantee of future results.
Mid-cycle phase
As the economy moves beyond its initial stage of recovery and as growth rates moderate, the leadership of interest-rate-sensitive sectors typically has tapered. At this point in the cycle, economically sensitive sectors still have performed well, but a shift has often taken place toward some industries that see a peak in demand for their products or services only after the expansion has become more firmly entrenched. Average annual stock market performance has tended to be fairly strong (roughly 15%), though not to the same degree as in the early-cycle phase. In addition, the average mid-cycle phase of the business cycle tends to be significantly longer than any other stage (roughly 3.5 years), and this phase is also when most stock market corrections have taken place. For this reason, sector leadership has rotated frequently, resulting in the smallest sector-performance differentiation of any business cycle phase. No sector has outperformed or underperformed the broader market more than 75% of the time, and the magnitude of the relative performance has been modest compared with the other 3 phases.
Information technology has been the best performer of all the sectors during this phase, having certain industries—such as semiconductors and hardware—that typically pick up momentum once companies gain more confidence in the stability of an economic recovery and are more willing to make capital expenditures (see chart). We also expect the new communication services sector to outperform during the mid-cycle phase, largely due to the strength of the media industry at this point in the cycle.
From an underperformance perspective, the materials and utilities sectors have lagged by the greatest magnitude. Due to the lack of clear sector leadership, the mid-cycle phase is a market environment in which investors may want to consider keeping their sector bets to a minimum while employing other approaches to generate additional active opportunities.
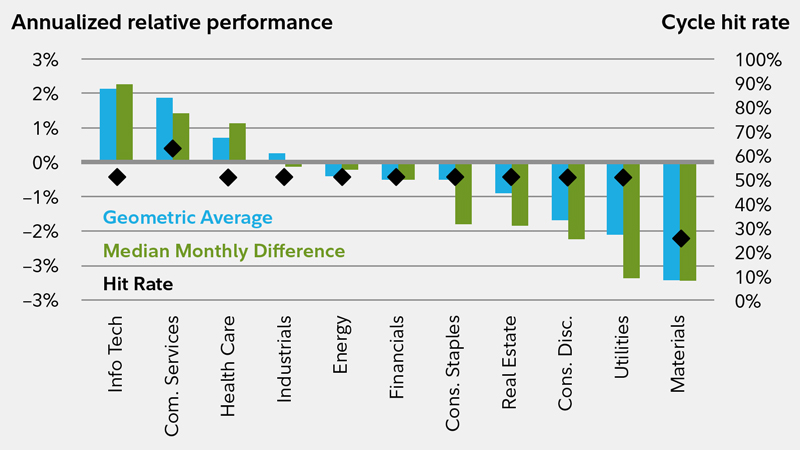
Sector leadership has rotated frequently in the mid-cycle phase, resulting in the smallest sector performance differentiation of any business cycle phase
This chart shows how sector leadership has rotated frequently in the mid-cycle phase.
Sectors as defined by GICS. Source: Fidelity Investments (AART), as of March 31, 2019. Past performance is no guarantee of future results.
Late-cycle phase
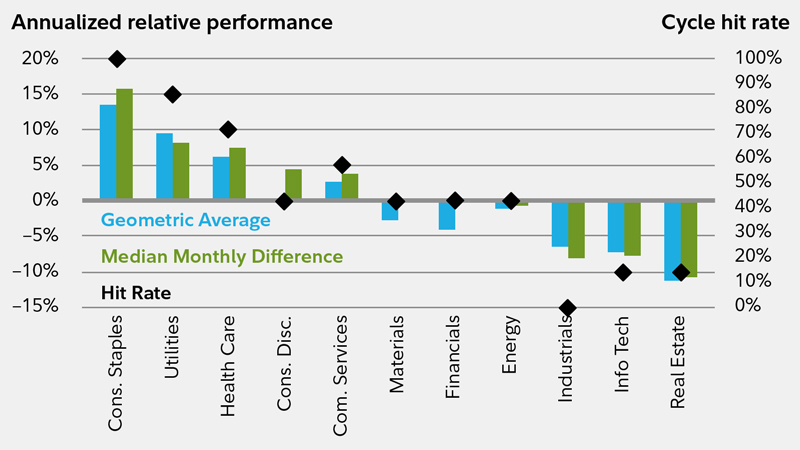
The late-cycle phase has had an average duration of roughly a year and a half, and overall stock market performance has averaged 6% on an annualized basis. As the economic recovery matures, the energy and materials sectors, whose fate is closely tied to the prices of raw materials, previously have done well as inflationary pressures build and the late-cycle economic expansion helps maintain solid demand (see next chart below).
Elsewhere, as investors begin to glimpse signs of an economic slowdown, defensive-oriented sectors—those in which revenues are tied more to basic needs and are less economically sensitive, particularly health care, but also consumer staples and utilities—generally have performed well. Looking across all 3 analytical measures, the energy sector has seen the most convincing patterns of outperformance in the late cycle, with high average and median relative performance along with a high cycle hit rate.
Information technology and consumer discretionary stocks have lagged most often, tending to suffer the most during this phase, as inflationary pressures crimp profit margins and investors move away from the most economically sensitive areas.
As the economic recovery matures, the materials and energy sectors have typically performed well, as have defensive-oriented sectors
This chart shows which sectors have performed well as the economic recovery matures.
Sectors as defined by GICS. Source: Fidelity Investments (AART), as of March 31, 2019. Past performance is no guarantee of future results.
Recession phase
The recession phase has historically been the shortest, lasting slightly less than a year on average—and the broader market has performed poorly during this phase (-15% average annual return). As economic growth stalls and contracts, sectors that are more economically sensitive fall out of favor, and those that are defensively oriented move to the front of the performance line. These less economically sensitive sectors, including consumer staples, utilities, and health care, are dominated by industries that produce items such as toothpaste, electricity, and prescription drugs, which consumers are less likely to cut back on during a recession (see next chart below). These sectors’ profits are likely to be more stable than those in other sectors in a contracting economy. The consumer staples sector has a perfect track record of outperforming the broader market throughout the entire recession phase, while utilities and health care are frequent outperformers. High-dividend yields provided by utility and telecom companies also have helped these sectors hold up relatively well during recessions. On the downside, economically and interest-rate-sensitive sectors— such as industrials, information technology, and real estate—typically have underperformed the broader market during this phase.
This chart shows that defensive-oriented sectors tend to outperform during the recession phase.
Sectors as defined by GICS. Source: Fidelity Investments (AART), as of March 31, 2019. Past performance is no guarantee of future results.
The merits of the business cycle approach
For those interested in a more active approach to managing their equity exposure, the business cycle approach offers considerable potential for taking advantage of relative sector-performance opportunities. As the probability of a shift in phase increases—for instance, from mid-cycle to late-cycle—such a strategy allows investors to adjust their exposure to sectors that have prominent performance patterns in the next phase of the cycle (see next chart below). Our views on these phase shifts are presented in recurring monthly updates on the business cycle.2 By its very nature, the business cycle focuses on an intermediate time horizon (i.e., cycle phases that rotate on average every few months to every few years). This may make it more practical for some investors to execute than shorter-term approaches.
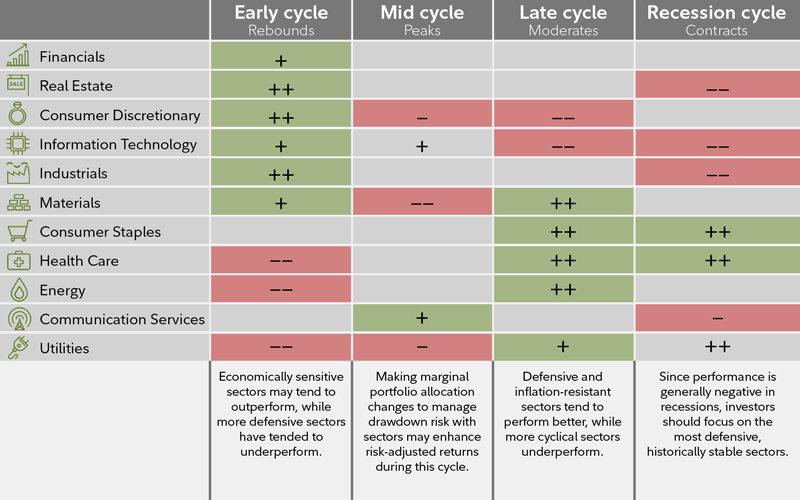
Looking at sectors throughout the business cycle
Note: The typical business cycle shown above is a hypothetical illustration. There is not always a chronological progression in this order, and in past cycles the economy has skipped a phase or retraced an earlier one.
Source for sector performance during business cycle: Fidelity Investments (AART). Unshaded (white) portions above suggest no clear pattern of over- or underperformance vs. broader market. Double +/– signs indicate that the sector is showing a consistent signal across all three metrics: full-phase average performance, median monthly difference, and cycle hit rate. A single +/– indicates a mixed or less consistent signal. Returns data from 1962 to 2016. Annualized returns are represented by the performance of the largest 3,000 US stocks measured by market capitalization, and sectors are defined by the Global Industry Classification Standard (GICS®). Past performance is no guarantee of future results. See below for important information.
Additional considerations for capturing alpha in sectors
Incorporating analysis and execution at the industry level may provide investors with greater opportunities to generate relative outperformance (“alpha”) in a business cycle approach. Industries within each sector can have significantly different fundamental performance drivers that may be masked by sector-level results, leading to significantly different industry-level price performance (see next chart below).
In addition, there are other strategies that can be incorporated to complement the business cycle approach and potentially capture additional alpha in equity sectors. Consider the following:
Macro-fundamental analysis: Macro-fundamental industry research can identify—independently of typical business cycle patterns—variables specific to the dynamics of each industry that may affect performance. For example, a significant change in the cost of key raw material inputs—such as oil prices for airlines—can drive a deviation in an industry's performance.
Bottom-up analysis: Company-specific analysis— through individual security selection—can identify unique traits in individual companies that may outweigh the impact of the typical business cycle pattern on that company’s future performance.
Global business cycle analysis: The US stock market has global exposure, which may warrant allocating toward or away from domestically focused sectors, depending on the phase of the US business cycle relative to the rest of the world. When the US business cycle is more favorable than the global cycle, sectors with more global exposure are likely to face greater headwinds to revenue growth, while more domestically linked sectors could fare relatively well.
Inflation overlay: The inflation backdrop can heavily influence some sectors’ profitability. Short-term inflation trends tend to ebb and flow with the movement of the business cycle, but longer-term inflation trends sometimes move independently of the business cycle.
Secular overlay: Long-term secular trends that are expected to unfold over multiple business cycles can warrant a permanently higher or lower allocation to a given sector than a pure business cycle approach would suggest.
This graphic shows that each industry within a sector has specific drivers that may affect performance.
Investment implications
Every business cycle is different, and so are the relative performance patterns among equity sectors. However, using a disciplined business cycle approach, it is possible to identify key phases in the economy and to use those signals in an effort to achieve active returns from sector allocation.
Analyzing relative sector performance
Certain metrics help evaluate the historical performance of each sector relative to the broader equity market (all data are annualized for comparison purposes):
Full-phase average performance: Calculates the (geometric) average performance of a sector in a particular phase of the business cycle, and subtracts the performance of the broader equity market. This method better captures the impact of compounding and performance that is experienced across full market cycles (i.e., longer holding periods). However, performance outliers carry greater weight and can skew results.
Median monthly difference: Calculates the difference in the monthly performance of a sector compared with the broader equity market, and then takes the midpoint of those observations. This measure is indifferent to when a return period begins during a phase, which makes it a good measure for investors who may miss significant portions of each business cycle phase. This method mutes the extreme performance differences of outliers, and also underemphasizes the impact of compounding returns.
Cycle hit rate: Calculates the frequency of a sector’s outperforming the broader equity market over each business cycle phase since 1962. This measure represents the consistency of sector performance relative to the broader market over different cycles, removing the possibility that outsized gains during one period in history influence overall averages. This method suffers somewhat from small sample sizes, with only 7 full cycles during the period, but persistent outperformance or underperformance still can be observed.
We updated our Business Cycle Sector Framework as a result of the September 2018 changes to the Global Industry Classification Standard (GICS) structure. This framework was last refreshed in 2016, following the elevation of real estate as the 11th GICS sector.
As of September 2018, the newly formed communication services sector combined the legacy telecommunication services sector with entertainment software, traditional media, and internet media companies. As a result, this new sector is more cyclical than its more-defensive predecessor, telecom, and we expect it to perform well in the mid cycle and underperform during recessions. Our assessment of communication services is more qualitative than that of the other sectors, given its evolving mix of industries.
Other sectors were also impacted by the shift in the GICS structure. Consumer discretionary lost some large internet media companies and gained online marketplaces. The departure of internet companies made the outlook for consumer discretionary less favorable in the mid cycle. Information technology was also affected by losing some internet and entertainment software companies, but the overall business cycle playbook for information technology companies did not change as a result.
<<<
The gold breakout has resolved some of the questions that have surrounded gold. The question now isn't whether to have gold in your asset allocation, but -
1) How much?
2) Buy now, or wait for a pullback?
3) Physical gold, or ETFs?
4) Gold mining sector?
Rickards has been recommending up to 10% in physical gold, and has mentioned having some exposure to the miners.
Buy now or wait? It might be best to average in over the next period of months. The breakout has been strong, but there could be a pullback to re-test the breakout level (1350-65).
>>> Wealthy Families Are Adding Forests to Their Portfolios
It’s a long-term bet on growth.
Bloomberg
By Lananh Nguyen
June 16, 2019
https://www.bloomberg.com/news/articles/2019-06-17/wealthy-families-are-adding-forests-to-their-portfolios?srnd=premium
Tom Crowder spent much of his two-year career in the NFL running away from men who weighed upwards of 300 pounds. These days? He worries about bears and snakes. As a senior vice president at Bank of America Corp., Crowder spends most days in the woods, from the evergreen forests of New England to the wetlands of the Carolinas, scouting U.S. timberland assets for people with a net worth of at least $100 million and a minimum of $10 million to invest.
“Trees don’t move as fast as Pro Bowl linebackers,” Crowder says on a recent field trip to a client’s timber farm in South Carolina overlooking the alligator-populated Waccamaw River. As turtles sun themselves and wild turkeys roam, he recounts over a picnic lunch the “neat experience” of his stint as a wide receiver and safety for the Dallas Cowboys. After a busted jaw and emergency surgery, he was happy to go back to his roots, as a third-generation forester.
Crowder is among more than 200 experts employed by Bank of America’s Specialty Asset Management group, or SAM, which manages more than 94,000 assets with a value of $13.6 billion for individuals and institutions. The target client is looking for timberland, farms, ranches, energy interests, or real estate, so-called alternative investments that can diversify portfolios mostly made up of stocks and bonds and can provide a hedge against inflation.
Returns for timberland totaled 3.2% in 2018, compared with 2.4% so far this year, according to an index from the National Council of Real Estate Investment Fiduciaries.
John Kelley, a SAM national executive, says “long-term themes” sell. The decline in arable land and rising global food demand, for example, are reasons to invest in farmland. “People have to eat, and what we believe about the intrinsic nature of these assets is that they have real value and they will persist over time,” he says.
For clients willing to make these long-term bets, SAM brings in what it calls boots-on-the-ground specialists from 38 offices across the U.S. They have an average of more than 15 years of experience, Kelley says, and some have been in their field for more than 30 years. Many, like Crowder, come from families who’ve been in those businesses for generations.
An exception is Nancy Fahmy, the head of alternative investments who was tapped to also lead SAM last year after spending most of her 23-year career dealing in esoteric financial assets in New York. “This is a different world for me,” she says, recalling the novelty of climbing onto a tractor for the first time and being intrigued by meeting a colleague wearing an impeccably tailored suit and alligator-skin cowboy boots, the product of a family hunt.
For Crowder, who grew up in Arkansas on his family’s timber farm, it’s familiar territory. While on the trip to the client’s timber tracts, a half-hour drive from Myrtle Beach in South Carolina, he used GPS maps on an extra-large iPad to show off an aerial view of pine trees annotated by the date they were planted. Then he offered instructions on how to use a T-shaped forestry tool, called an increment borer, to extract a section of wood about the size of a drinking straw from a tree to count its rings and gauge its pace of growth.
“People have to eat, and what we believe about the intrinsic nature of these assets is that they have real value and they will persist over time”
Crowder covered a lot of ground over the course of a day, giving a crash course in timber management. He detailed the widespread problem of wild hogs damaging timber properties. He talked about the benefits of recreational hunting clubs, which can offer a revenue stream for owners. He laughed about a catchphrase among colleagues—“release the deer”—a reference to the Chevy Chase movie Funny Farm. That’s what SAM staff say when an impressive animal is spotted on a site visit, as if they’d arranged it specifically to impress prospective buyers.
The bank’s roster of clients includes people from both the U.S. and overseas. Investors new to the arena are strongly encouraged to visit what they might be buying into, and it’s during these trips that the idea of passing on a legacy to future generations hits home, Kelley says. Wealthy families are also becoming more interested in environmental and sustainable investments, he says.
“It has a transformative effect in a lot of ways when they actually get to see it, feel it, touch it, and—sometimes in the case of farmland—smell it,” Kelley says. “It goes beyond the numbers.”
And the numbers for real-asset deals, such as predicted profits and hurdle rates, don’t correspond to typical Wall Street metrics. In some cases, the bank has to explain to sophisticated investors that the investments might not work for them.
The assets do produce revenue—in the form of logs, crops, livestock, or oil and gas—but buyers have to get comfortable with multiyear time horizons for returns. A timber farm could generate immediate sales or take years to harvest, depending on tree maturity and market conditions, or decades if starting from seed.
“This is not like stocks and bonds,” Kelley says. “This is not something that you buy on Monday and sell on Wednesday. That’s not the deal. If you’re not coming in with at least a minimum of a 10-year investment horizon, you really don’t belong in this investment class.”
There are other reasons to be careful. Universities including Yale and Harvard ran into trouble with their forestry investments in recent years after endowment funds bought into huge tracts of land as a way to hedge against inflation. The bets paid off handsomely until 2017, when returns slumped and the universities came under criticism from local residents and environmentalists. The various complaints included concerns about overlogging, destruction of scenery, and the disruption of animal habitats.
The California Public Employees’ Retirement System, the largest U.S. public pension system, is restructuring its forestland portfolio after its investments lost an average of 1.1% annually over the last 10 years, according to a presentation at a September meeting. The forestlands program has been under review the past few years and will likely be part of a broader examination by Ben Meng, who started in January as chief investment officer, CalPERS spokesman Joe DeAnda says.
That’s why Bank of America emphasizes the importance of its experts, who handpick properties for direct purchases. Farmland specialist Katie VanMeter comes from a family who owns thousands of acres of wheat and chickpeas in Montana. Shelda Owens, who runs operations for the timber business, has a master of science in forest economics. It might be argued that Crowder’s forestry experience goes as far back as his childhood. He cultivated his own sandbox-size plot of trees when he was a kid and had to make “hard decisions” about which ones to thin so the others could grow.
That depth of knowledge is important when the SAM experts are sitting across a table from savvy investors and being grilled by them—and, of course, when they’re showing off the land.
Crowder goes to great lengths out there. He once waded through a waist-deep river, holding the iPad overhead, to assess a property that housed a cave of endangered bats. It wasn’t a good fit, and the bank decided not to manage the property. He prepares for site visits in great detail, readying contingency plans for weather-related disruptions. And he’s learning Mandarin to speak to Chinese clients, but it’s hard going: The Rosetta Stone program doesn’t always understand his Arkansas accent.
Among his clients are New Yorkers who consider Central Park a forest. He points out differences—on timber farms, there are no sidewalks, no lights, and sometimes no cellphone coverage. That off-the-grid experience and the opportunity to learn about nature are refreshing for visitors who might be titans of industry. Crowder enjoys being their guide.
“It’s incredible to make a career out of something that you’re so passionate about,” Crowder says. He spends much of his free time hiking in the forest next to his home in Little Rock, accompanied by his 100-pound giant schnauzer, Ranger. “That’s his passion, too.”
<<<
>>> How to Invest and Profit in the Next Recession
A slump is likely in the next year or so. There are ways to prepare for it.
By Barry Ritholtz
June 17, 2019
https://www.bloomberg.com/opinion/articles/2019-06-17/how-to-invest-and-profit-in-the-next-recession?srnd=premium
Ever since the Great Recession ended in June 2009, investors have been treated to a stream of forecasts warning that another slump is right around the corner. As we have seen, none of these predictions have come to pass. Smart investors paid little heed to predictions that were subjective and of little value.
Enter Campbell R. Harvey. He's a finance professor at Duke University’s Fuqua School of Business. He also is a research associate at the National Bureau of Economic Research, which among other things provides the official start and end dates of expansions and contractions. Most important of all, he maintains one of the more rigorous models for analyzing the potential for a future economic contraction.
Harvey is not an alarmist; to the contrary, he is a sober-minded researcher. In a recent YouTube discussion of the warning signs of an impending recession, he cited four signals. One is the Duke-CFO Global Business Outlook survey, which this month found that more than two-thirds of corporate chief financial officers expect that a recession will be underway by the end of 2020. His second factor is “the realization of anti-growth protectionism,” aka tariffs and rising trade-war tensions; the third is market volatility, which he notes frequently gives false signals, but has generally been on the rise the past few months.
The last, and most important component, is the yield curve, or the schedule of bond yields based on maturity dates. His focus is on the five-year Treasury bond yield, which now is lower than the yield on three-month Treasury bill. According to Harvey’s research, when this inversion -- short-term rates being higher than long-term rates -- lasts for a full quarter, or 90 days, then a recession will occur in 12 to 18 months.
Inversion occurred on March 7 and earlier this month we crossed the 90-day threshold. Thus, all four of the conditions for a future recession in Harvey’s model now have been met. 1
I am not in the business of predicting recessions. However, since the previous one was a decade ago, I am quite comfortable with the idea we are closer to the next one than we are to the last one.
Since we can all agree that another recession is inevitable, I am going to go out on a limb and suggest that now is the time to plan for it. Maybe these will help you get through relatively unscathed:
No. 1. Clean out your portfolio: We all accumulate holdings for reasons that are too silly to go into and look terrible in hindsight: your brother-in-law’s stock recommendation, the initial public offering that didn’t work out, the hot tip from a broker.
Sell ‘em all! With markets near record highs, this is your best opportunity to minimize your losses, since this might be as good as it gets. Remember, weaker companies will do much worse than average ones in recessions. If you own any junk bonds sell them, too.
No. 2. Pay down debt: Today, markets are near all-time highs, unemployment is near 50-year lows and wages are rising. It might not be this easy to lower your outstanding obligations for a while. Give yourself a little maneuvering room and maybe sock away some cash in your emergency fund.
No. 3. Be ready to buy when stock prices plunge: Markets typically tank in recessions. Use the cash you raised from selling your garbage holdings and develop a plan of action while you are still calm and objective. Have the confidence to act when the time comes.
It can be simple, too. For example, plan on deploying your cash in tranches: Buy a U.S. index fund when markets are down 20 to 25%; add a developed global index fund when markets fall by 30%. And if we are lucky enough to enjoy a 35 to 40% decline (that's assuming you prepared for this moment), buy emerging-market stocks.
The trick to create this plan NOW, set some alerts and be prepared to put the cash to work when the predetermined levels are hit. You might look (and feel) foolish for a few months, but seem like a genius a few years later.
No. 4. Check and clean up your credit score: I found an erroneous blemish on my credit rating some time ago that took two years of arduous work to remove. Improving your credit score allows you to borrow at more advantageous prices. This helps if you want to refinance when mortgage rates drop, which usually happens during recessions, or take advantage of falling prices to buy a home. Improve your credit score when you don’t have to.
I hope I am wrong, and we don’t see a recession for a long time to come, although that seems unlikely. But even if we are fortunate enough to never have another recession, all of the steps described above will serve to help you get your financial house in order and make you a better investor.
Harvey says the model has delivered no false signals in the modern era, and a variety of out-of-sample evidence has also validated the model.
<<<
>>> Barry Ritholtz is a Bloomberg Opinion columnist. He founded Ritholtz Wealth Management and was chief executive and director of equity research at FusionIQ, a quantitative research firm. He is the author of “Bailout Nation" <<<
>>> Powell’s Concern Over Zero Rates Expected to Lower Bar for Fed Cut
Bloomberg
By Craig Torres
June 16, 2019
https://www.bloomberg.com/news/articles/2019-06-16/powell-s-concern-over-zero-rates-seen-lowering-bar-for-fed-cut?srnd=premium
Fed chairman says extending expansion an ‘overarching’ goal
No interest rate move expected when officials meet this week
Chairman Jerome Powell’s frequent assurance that sustaining the U.S. economic expansion is the Federal Reserve’s “overarching’’ goal is opening the door to potentially aggressive interest-rate cuts.
The timing, size and whether such moves are indeed in his plans may become clearer when Powell and his colleagues meet on Tuesday and Wednesday in Washington.
While investors are agitating for the Fed to shift, economists don’t see a move this week and are divided on whether officials will cut at all in 2019. The median estimate of Bloomberg’s most recent survey shows a quarter point reduction in December, though it was a close call.
Policy rate has been closer to zero compared with any expansion since 1950s
The suspicion of a number of Fed watchers, though, is that the hint of a slowdown would be enough for the Fed to move, and that policy makers will acknowledge that readiness this week. One reason is that the chairman has signaled he’s concerned about how just low rates still are, meaning it may be better to act sooner and avoid a recession than wait and find the economy slumping with the Fed having limited room to act.
Prospects for a shift have mounted in recent weeks as President Donald Trump’s trade war with China has escalated and the U.S. economy had displayed some signs of weakness.
“They will be very reactive if the data even confirms a small amount of slowing,’’ said Priya Misra, global head of interest rate strategy at TD Securities. “They are going to be more pre-emptive and more aggressive. They will open the door for a rate cut’’ at the meeting this week.
That perspective of Fed policy has a lot to do with Powell’s perception of risk at a time of high uncertainty and Trump’s dispute with China.
The Fed’s benchmark policy rate has never been this low during a prolonged economic expansion in records going back to the 1950s. That means when the next recession occurs rates will be closer to the zero limit: in effect, U.S. central bankers have less room to cut.
The Fed chairman described the zero boundary as “the preeminent monetary policy challenge of our time, tainting all manner of issues’’ in a speech in Chicago this month.
Fed watchers read those words as a new trigger point for the central bank. It won’t take an overwhelming confirmation of weakness in data for the Fed to ease, in their view, and a sense that risks are particularly heightened might be enough to prompt a move.
“The bar for precautionary cuts is lower if you are worried about the zero lower bound,’’ said Michael Gapen, chief U.S. economist at Barclays Plc, which predicts 0.75 percentage points of easing this year, one of the most aggressive calls on Wall Street.
That said, economists are still parsing how much weight the Fed will put on the economic data in hand versus risks and uncertainties, and there isn’t much consensus. Twelve firms expect at least one cut this year, the Bloomberg survey showed, while 12 expect two cuts. Sixteen firms expected no cut at all, and two projected a hike.
“I am hard pressed to figure out what all the fuss is about,’’ said Ward McCarthy, chief financial economist at Jefferies LLC, who expects rates to remain unchanged this year. “I think the slowdown’’ in the data now “is the slowdown we are going to get.’’
Monthly job growth in 2019 has slowed to an average of 164,000, down from 230,000 in the first five months of 2018. Job openings remain near record highs and consumption is holding up, but concerns over tariffs have hit household confidence. It all paints a picture of an economy that’s down-shifted a bit with inflation below the Fed’s 2% target.
“We see weak inflation impulses,’’ said Julia Coronado, founder of MacroPolicy Perspectives LLC, who forecasts two rate cuts this year. “It is not like the consumer has rolled over, but you are now seeing a slowing in the pace of growth that makes the economy look more vulnerable to the uncertainties ahead.’’
Perhaps the biggest source of uncertainty is Trump. World leaders meet in Osaka for the G-20 summit later this month, and investors hope for fresh trade talks between the U.S. and China.
Anything short of a clearly positive reset between Trump and Chinese President Xi Jinping would weigh on business confidence and investment as it could upset supply chains and roil markets. That risks a steeper slowdown in U.S. growth that Fed officials won’t tolerate, warned Barclays economists, who predict a 0.50 percentage point cut as soon as July.
Fed independence will also be on Powell’s mind. Trump has relentlessly attacked the central bank for months for having tightened too far, including a fresh broadside on Friday.
If rates were lowered back to zero, the Fed would have to return to emergency-era policies such as buying bonds, an unpopular measure with lawmakers of both parties.
“In the long wake of the crisis, they just don’t have that much political capital to fall back on. Add to that unprecedented presidential pressure and party polarization and it gets ugly,” said Mark Spindel, co-author of a recent book about the Fed’s relations with Congress. “They are the only game in town -- and they are without deep pockets or ammo” to address the next recession.
<<<
>>> Opinion: This is the only protection your stock-market investments will ever need
MarketWatch
By Howard Gold
May 30, 2019
https://www.marketwatch.com/story/this-is-the-only-protection-your-stock-market-investments-will-ever-need-2019-05-30?siteid=yhoof2&yptr=yahoo
Bonds are the simplest and cheapest way to hedge your investment portfolio
As the Dow Jones Industrial Average DJIA and S&P 500 index have fallen more than 5% from their recent highs, investors have rushed toward safety. Funds that aim to lower risk and limit stock market losses raised almost $10 billion in the first four months of 2019, The Wall Street Journal reported.
But there’s a much simpler, cheaper way to hedge your stock-market investments — bonds. And they’ve been the most effective way to do that for more than a decade. Recently, haven buyers have scooped up 10-year Treasury notes, driving yields down a full percentage point since last October, to as low as just above 2.20% at one point Wednesday.
New research by Christine Benz, Morningstar’s director of personal finance, confirmed the superiority of bonds — especially Treasurys — as hedges over the long run.
Benz looked at asset classes traditionally considered stock-market hedges over different periods, from one year to 15 years. She used Morningstar Direct’s database and stuck mostly to funds and ETFs available to institutional and individual investors.
Benz looked at the correlation coefficient between different pairs of asset classes over time. That’s a number between -1 and 1 that measures how closely two variables move together. A correlation of 1 means the two are perfectly in sync, 0 means no correlation, and -1 means the two are going in the opposite direction. In short, it tells us how much other assets have zagged when stocks zigged, and vice versa. Ideally, to hedge your equity risk, you’d want something that has as negative a correlation with the S&P 500 as possible.
“The goal is when stocks tumble, that you have something in your portfolio with the ability to at least hold its ground, or maybe even earn a little bit,” said Benz. That’s important for maximizing your holdings’ long-term growth.
This table tells the story.
Bonds: The best hedge
Correlation - 5-year, 10-year, 15-year
Asset class
Real estate 0.57 0.69 0.74
SPDR Gold Shares (GLD) -0.18 0.06 NA
Managed futures 0.12 0.22 NA
Cash 0.04 -0.01 -0.11
U.S. Aggregate Bond -0.05 -0.13 0
U.S. Treasury 20+ Year -0.18 -0.46 -0.3
U.S. Treasury 5-10 Year -0.28 -0.37 -0.28
Real estate, often recommended as a portfolio diversifier, actually is highly correlated with stocks — 0.74 over 15 years. Managed futures, which have been touted by some investment advisers, are mediocre hedges at best, showing positive correlations with stock prices. Developed and emerging markets international stocks had similarly high correlations with U.S. equities over the past 10 to 15 years, as did high-yield bonds. Long-only commodities also were highly correlated with stocks — 0.4 to 0.5.
Gold GLD was an excellent hedge over the past five years and cash did its job over the last 15; both were solidly in negative territory over those periods.
Then there were two categories — long-short equity and market-neutral — that supposedly mimic the strategies of hedge funds. Their high correlation with stocks (up to 0.97 for long-short and 0.47 for market-neutral) point to why the only thing hedge funds have successfully hedged against over the past decade has been good returns.
But the big winner across the board was bonds. The Bloomberg Barclays U.S. Aggregate Bond index AGG, which covers a broad swath of Treasury, agency, and investment-grade corporate bonds, had zero correlation with stocks for 15 years, but negative correlations over five and 10 years.
Treasurys did even better protecting against equity risk, and here’s the big surprise: Treasurys with maturities longer than 20 years weren’t much better at protecting your portfolio than intermediate-term Treasurys; over the past five years, they did worse.
That’s great news for investors, because intermediate-term Treasurys — those with maturities of five to 10 years — are less interest-rate-sensitive and less volatile than long bonds.
In that category, I like the Vanguard Intermediate-Term Treasury ETF VGIT, the SPDR Bloomberg Barclays Intermediate Term Treasury ETF ITE, or the Schwab Intermediate-Term U.S. Treasury ETF SCHR. All have full exposure to intermediate Treasurys and rock-bottom expense ratios.
Bonds haven’t always been good hedges; in the four decades before the 1990s, stocks and bonds had positive correlations, a study by Graham Capital Management found. But I doubt the complex alternative investing products the ETF industry has concocted over the past few years would have done better — if anybody can figure out how they actually work.
“So, the takeaway is that for most investors, at least based on…history, simpler and cheaper has been better than investing in alternatives,” said Benz.
Nobel Prize-winning economist Harry Markowitz reportedly called diversification “the only free lunch in finance.” If that’s true, then bonds, especially Treasurys, are the only free dinner.
<<<
>>> The Fed May Have No Choice But to Bail Out Trump
The stage is set for an interest-rate cut, but probably not until September.
Bloomberg
By Tim Duy
June 6, 2019
https://www.bloomberg.com/opinion/articles/2019-06-06/the-fed-may-have-no-choice-but-to-bail-out-trump
The U.S.-China trade war may force the Federal Reserve to cut rates.
Federal Reserve Chair Jerome Powell addressed nervous market participants this week by assuring them that the central bank “will act as appropriate” to keep the U.S. expansion on track. This wasn’t a signal that a rate cut is imminent. It was, however, a clear signal that the bar to lowering rates is fairly low. Considering the growing risks to the outlook, the Fed only needs a push to justify a cut. The push will likely come in the form of softer economic data, but could also be a severe bout of financial turmoil.
Fed officials have resisted sending signals about the direction rates, assigning equal possibilities of either an increase or a cut. The shifting balance of risks, however, make that an increasingly difficult story to sell. The escalation of trade wars from China to Mexico create substantial uncertainty for the outlook, and none of it good.
Some complain that the Fed would only be bailing out President Donald Trump in his ill-advised use of tariffs by cutting rates. Such charges will fall on deaf ears at the Fed. Policy makers may not like responding to Trump’s escapades with easier policy, but they ultimately have little choice but to do so. The Fed responds to shocks in a systematic fashion, even those created by the government. The Fed will respond to this shock with easier policy as they seek to sustain the expansion and meet their employment and inflation objectives.
Won’t the inflationary impact of tariffs stay the Fed’s hands when it comes to rate cuts? Most likely not. First, the Fed views tariffs as a temporary price shock expected to fade over time. They will look through any acceleration in inflation.
Second, Fed officials adhering to a symmetric price target will tolerate inflation overshoots to the same degree they tolerate undershoots. In practice, this means that just like they have not pursued an excessively easy policy to push the rate inflation back up to their 2% target, they will not pursue an excessively tight policy to push it back down. Going forward we may see a distribution of inflation outcomes centered above 2%. This would have the benefit of proving the Fed’s inflation target is in fact symmetric.
Third, the Fed will err on the side of caution. The Fed is well aware of the dangers of the zero bound in rates. I suspect that those dangers will lead them to conclude that the policy risks are very asymmetric. Their tools will prove more effective at pulling down an inflation overshoot in the future relative to stimulating the economy at the zero bound. There is much to be said for an insurance rate cut, especially at this challenging point in the business cycle where growth is slowing and companies worry that they should be retrenching in anticipation of the next recession.
The Fed, however, still needs to see greater evidence that growth is in fact slowing as forecast. Policy makers do not see large macro impacts from tariffs, which makes it difficult to justify substantial changes to the outlook on tariffs alone. Moreover, while we have seen some softness in the data, it is not excessive. The Institute for Supply Management’s manufacturing report for May showed that the sector was still expanding. The ISM’s services report, covering the much larger sector, revealed that activity, including hiring, accelerated in May.
In contrast, the ADP Research Institute’s employment report indicated that job growth slowed in May. A sustained slowdown in job growth would go a long way toward justifying a rate cut. The ADP number, however, is not always a reliable signal. The Fed will pay much more attention to the Labor Department’s employment report for May that comes Friday. But even there one weak number will be seen as an outlier, not a trend. The Fed typically needs a wider range of data to shift gears.
Although the stage is set for the Fed to cut rates, policy makers won’t have sufficient data to act until the end of the summer. A move at the September meeting is a reasonable baseline at this point. If the data deteriorate more quickly, or if markets seize up, pull that cut forward into July. If trade tensions ease and growth stays strong, push it back.
<<<
Performance comparison of HDGE, short S+P ETFs, and long Treasury ETFs during the big December swoon -
S+P 500 (SPX) - down 16%
________________________
HDGE - up 19%
1X Short S+P (SH) - up 19%
2X Short S+P (SDS) - up 40%
3X Short S+P (SPXS) - up 69%
________________________
1X Long 20+ year Treasuries (TLT) - up 8%
3X Long 20+ year Treasuries (TMF) - up 22%
________________________
So while the Treasury approach won't give you the best 'bang for the buck' for short term trading, as an asset allocation tool to reduce risk and overall volatility, Treasuries work well.
>>> Asset Allocation for Beginners
An Introduction to Diversifying Between Asset Classes
BY JOSHUA KENNON
December 30, 2018
https://www.thebalance.com/asset-allocation-basics-357311
In its simplest terms, asset allocation is the practice of dividing resources among different categories such as stocks, bonds, mutual funds, investment partnerships, real estate, cash equivalents, and private equity. The theory is that the investor can lessen risk because each asset class has a different correlation to the others; when stocks rise, for example, bonds often fall. At a time when the stock market begins to fall, real estate may begin generating above-average returns.
The amount of an investor’s total portfolio placed in each class is determined by an asset allocation model. These models are designed to reflect the personal goals and risk tolerance of the investor. Furthermore, individual asset classes can be sub-divided into sectors (for example, if the asset allocation model calls for 40% of the total portfolio to be invested in stocks, the portfolio manager may recommend different allocations within the field of stocks, such as recommending a certain percentage in large-cap, mid-cap, banking, manufacturing, etc.)
Model Determined by Need
Although decades of history have conclusively proved it is more profitable to be an owner of corporate America (viz., stocks), rather than a lender to it (viz., bonds), there are times when equities are unattractive compared to other asset classes (think late-1999 when stock prices had risen so high the earnings yields were almost non-existent) or they do not fit with the particular goals or needs of the portfolio owner. A widow, for example, with one million dollars to invest and no other source of income is going to want to place a significant portion of her wealth in fixed income obligations that will generate a steady source of retirement income for the remainder of her life.
Her need is not necessarily to increase her net worth but to preserve what she has while living on the proceeds. A young corporate employee just out of college, however, is going to be most interested in building wealth. He can afford to ignore market fluctuations because he doesn’t depend upon his investments to meet day to day living expenses. A portfolio heavily concentrated in stocks, under reasonable market conditions, is the best option for this type of investor.
Model Types
Most asset allocation models fall somewhere between four objectives: preservation of capital, income, balanced, or growth.
Preservation of Capital.
Asset allocation models designed for the preservation of capital are largely for those who expect to use their cash within the next twelve months and do not wish to risk losing even a small percentage of principal value for the possibility of capital gains. Investors that plan on paying for college, purchasing a house or acquiring a business are examples of those that would seek this type of allocation model. Cash and cash equivalents such as money markets, treasuries, and commercial paper often compose upwards of eighty percent of these portfolios. The biggest danger is that the return earned may not keep pace with inflation, eroding purchasing power in real terms.
Income.
Portfolios that are designed to generate income for their owners often consist of investment-grade, fixed income obligations of large, profitable corporations, real estate (most often in the form of Real Estate Investment Trusts, or REITs), treasury notes, and, to a lesser extent, shares of blue-chip companies with long histories of continuous dividend payments. The typical income-oriented investor is one that is nearing retirement. Another example would be a young widow with small children receiving a lump-sum settlement from her husband’s life insurance policy and cannot risk losing the principal; although growth would be nice, the need for cash in hand for living expenses is of primary importance.
Balanced.
Halfway between the income and growth asset allocation models is a compromise known as the balanced portfolio. For most people, the balanced portfolio is the best option not for financial reasons, but for emotional. Portfolios based on this model attempt to strike a compromise between long-term growth and current income. The ideal result is a mix of assets that generate cash as well as appreciates over time with smaller fluctuations in quoted principal value than the all-growth portfolio. Balanced portfolios tend to divide assets between medium-term investment-grade fixed income obligations and shares of common stocks in leading corporations, many of which may pay cash dividends. Real estate holdings via REITs are often a component as well. For the most part, a balanced portfolio is always vested (meaning very little is held in cash or cash equivalents unless the portfolio manager is absolutely convinced there are no attractive opportunities demonstrating an acceptable level of risk.)
Growth.
The growth asset allocation model is designed for those that are just beginning their careers and are interested in building long-term wealth. The assets are not required to generate current income because the owner is actively employed, living off his or her salary for required expenses. Unlike an income portfolio, the investor is likely to increase his or her position each year by depositing additional funds. In bull markets, growth portfolios tend to outperform their counterparts significantly; in bear markets, they are the hardest hit. For the most part, up to one hundred percent of a growth modeled portfolio can be invested in common stocks, a substantial portion of which may not pay dividends and are relatively young. Portfolio managers often like to include an international equity component to expose the investor to economies other than the United States.
Changing with the Times
An investor that is actively engaged in an asset allocation strategy will find that his or her needs change as they move through the various stages of life. For that reason, some professional money managers recommend switching over a portion of your assets to a different model several years prior to major life changes. An investor that is ten years away from retirement, for example, would find himself moving 10% of his holding into an income-oriented allocation model each year. By the time he retires, the entire portfolio will reflect his new objectives.
The Rebalancing Controversy
One of the most popular practices on Wall Street is “rebalancing” a portfolio. Many times, this results because one particular asset class or investment has advanced substantially, coming to represent a significant portion of the investor’s wealth. To bring the portfolio back into balance with the original prescribed model, the portfolio manager will sell off a portion of the appreciated asset and reinvest the proceeds. Famed mutual fund manager Peter Lynch calls this practice, “cutting the flowers and watering the weeds.”
What is the average investor to do? On the one hand, we have the advice given by one of the managing directors of Tweedy Browne to a client that held $30 million in Berkshire Hathaway stock many years ago. When asked if she should sell, his response was (paraphrased), “has there been a change in fundamentals that makes you believe the investment is less attractive?” She said no and kept the stock. Today, her position is worth several hundred millions of dollars. On the other hand, we have cases such as ?Worldcom and Enron where investors lost everything.
Perhaps the best advice is only to hold the position if you are capable of evaluating the business operationally, are convinced that the fundamentals are still attractive, believe the company has a significant competitive advantage, and you are comfortable with the increased dependence upon the performance of a single investment. If you are unable or unwilling to commit to the criteria, you may be better served by rebalancing.
Strategy
Many investors believe that by merely diversifying one’s assets to the prescribed allocation model is going to alleviate the need to exercise discretion in choosing individual issues. It is a dangerous fallacy. Investors that are not capable of evaluating a business quantitatively or qualitatively must make it absolutely clear to their portfolio manager that they are interested only in defensively selected investments, regardless of age or wealth level.
<<<
S&P 500 PE Ratio - 90 Year Historical Chart
https://www.macrotrends.net/2577/sp-500-pe-ratio-price-to-earnings-chart
S&P 500 Index - 90 Year Historical Chart
(this chart shows why investors need at least some allocation to stocks)
https://www.macrotrends.net/2324/sp-500-historical-chart-data
>>> Vanguard Patented a Way to Avoid Taxes on Mutual Funds
By Zachary R. Mider, Annie Massa and Christopher Cannon
May 1, 2019
https://www.bloomberg.com/graphics/2019-vanguard-mutual-fund-tax-dodge/?srnd=premium
Like flipping a light switch, Vanguard Group Inc. has figured out a way to shut off taxes in its mutual funds.
The first to benefit was the Vanguard Total Stock Market Index Fund. Investors’ end-of-year tax forms abruptly stopped showing capital gains in 2001, even as the fund went on to generate billions of dollars of them. By 2011, Vanguard had flipped the switch in 14 stock funds. In all, these funds have booked $191 billion in gains while reporting zero to the Internal Revenue Service.
This astounding success gives Vanguard funds an edge over competitors. Yet the world’s second-largest asset manager has avoided drawing attention to it. Top executives at the Malvern, Pennsylvania-based firm don’t want U.S. policymakers looking too closely at how they’re doing it, according to a former insider.
But a review of financial statements and trading data shows that Vanguard relies substantially on so-called heartbeat trades, which wash away taxes by rapidly pumping stocks in and out of a fund. These controversial transactions are common in exchange-traded funds—a record $98 billion of them took place last year, according to data compiled by Bloomberg News—but only Vanguard has used them routinely to also benefit mutual funds.
Here’s how it works: Vanguard attaches a more tax-efficient ETF to an existing mutual fund. Then the ETF siphons appreciated stocks out of the mutual fund without incurring taxes, often using heartbeat trades. Robert Gordon, who has written about the concept and is president of Twenty-First Securities Corp. in New York, calls it a tax “dialysis machine.”
How to Spot a Heartbeat
Rapidly pumping money into and out of the exchange-traded portion of the Vanguard Small-Cap Index Fund removes taxable gains for the benefit of the mutual fund’s shareholders.
Vanguard even got a patent on the design, valid until 2023, so competitors can’t copy it.
Rich Powers, Vanguard’s head of ETF product management, acknowledged the design’s tax advantages. But he said in an interview that they’re not the driver of the company’s strategy and that all of its trading complies with the law.
“We agree the Vanguard funds have been extremely tax efficient, enabling us to provide higher after-tax returns to our shareholders and better their chances of achieving long-term investment success,” Freddy Martino, a spokesman for the company, said in an email.
Although the dialysis treatment shut off taxable gains in the 14 stock funds, it didn’t completely neutralize them in a separate real estate index fund, which invests in trusts that aren’t taxed like stocks.
Taxable Gains Begone
Unlike competitors that follow similar indexes, Vanguard mutual funds stopped saddling investors with ? taxable gains once ETF share classes were added.
The main benefit of avoiding taxable gains in a mutual fund is tax deferral. Funds distribute their taxable gains to investors, who pay income taxes on them in the same year. By avoiding tax events within the fund, investors get to delay taxes until they sell the fund, which could be years or decades later. It’s akin to a zero-interest loan from the IRS.
The stakes for the U.S. Treasury are significant. While heartbeats already help eliminate taxable-gain distributions in the $3 trillion U.S. equity ETF industry, the mutual fund market is more than three times as big. When Vanguard’s patent expires four years from now, other mutual fund managers may have the chance to build their own dialysis machines.
To understand how the process works, consider an investor who owns a portfolio of stocks. If one is sold for more than what it cost, capital-gains tax is due on the difference.
Theoretically, owning stocks through a mutual fund or ETF works the same way. If the fund sells a stock for a profit, the taxable gain shows up on each investor’s end-of-year Form 1099.
But thanks to an obscure loophole in the tax code, ETFs almost always avoid incurring taxable gains.
The rule says that a fund can avoid recognizing taxable gains on an appreciated stock if the shares are used to pay off a withdrawing investor. The rule applies to both ETFs and mutual funds, but mutual funds rarely take advantage of it because their investors almost always want cash.
ETFs use it all the time, because they don’t transact directly with regular investors. Instead, they deal with Wall Street middlemen such as banks and market makers. It’s those firms, not retail investors, that expand the ETF by depositing assets or shrink it by withdrawing. These transactions are usually done with stocks rather than cash. The middlemen, in turn, trade with regular investors who want to buy and sell ETF shares.
Trading with middlemen presents ETFs a tax-cutting opportunity. Whenever one of these firms makes a withdrawal request, an ETF can deliver its oldest, most appreciated stocks, the ones most likely to generate a tax bill someday.
If the ETF wants to cut its taxes further, it can generate extra withdrawals just to harvest the tax break. A heartbeat is when an ETF asks a friendly bank or market maker to deposit some stock in the fund for a day or two, then take different stock out. Some critics call these trades an abuse of the tax code. But with the help of heartbeats, most stock ETFs, even ones that change holdings frequently, are able to cut their capital-gains taxes to zero.
Customer-owned Vanguard, founded in 1975 by John Bogle, built a reputation for low fees and tax efficiency by offering simple buy-and-hold funds that follow broad indexes such as the S&P 500. It now has about $5 trillion of assets under management.
In 2000, after Bogle had stepped down as chief executive officer, the firm unveiled a novel strategy to enter the ETF business, a market dominated by State Street Corp. and iShares, now part of BlackRock Inc. Rather than establish new, freestanding ETFs, Vanguard proposed to add an ETF share class to existing mutual funds. ETF and mutual fund investors would jointly own the same underlying pool of stocks.
The concept made sense for Vanguard. Investors who preferred ETFs could easily convert without selling. And the Vanguard ETFs would have a head start in the marketplace. They’d be able to point to decades of performance history and benefit from the existing mutual funds’ scale, ensuring low fees.
To keep competitors from copying the idea, Vanguard filed the plan with the U.S. Patent Office in 2001.
Heartbeat Leader
Vanguard funds made more use of heartbeat trades than those of any other ETF manager, a Bloomberg News analysis of trading data from 2000 to 2018 shows.
Taxes weren’t a big part of the investor pitch. In fact, some observers thought taxes were a drawback to Vanguard’s plan. Investors expect ETFs to be more tax-efficient than mutual funds. Why buy a Vanguard ETF if it might get burdened with the tax bills of its sister mutual fund?
“The fund will exhibit little of the ETF’s characteristic tax efficiency,” one skeptical ETF consultant told Investment Management Weekly in 2004.
In hindsight, it’s clear that those fears were misplaced. Rather than getting dragged into a tax abyss, the ETFs lifted up their sister mutual funds.
Vanguard’s Dialysis Machine
Once an ETF share class was added to a mutual fund, taxable-gain distributions fell to zero while ? non-taxable gains from stock withdrawals shot up.
Although the dialysis machine has attracted little notice outside Vanguard, it has been controversial within the firm, according to two people with knowledge of the matter. Some employees have raised questions about whether it’s appropriate to use ETFs to wipe away capital gains built up years earlier in mutual funds.
“What I can share with you,” Powers said, “is that we have reviewed that topic and feel comfortable with our approach to portfolio management.”
Vanguard’s trading in Monsanto Co. in June showed the dialysis machine in action. The agrochemical giant had agreed to be sold to a German rival for $56 billion in cash, and the Vanguard Total Stock Market Index Fund was one of Monsanto’s biggest shareholders. It had owned shares since the early 1990s and, over the decades, the stock had risen more than 25-fold. That meant Vanguard probably faced a big taxable gain.
On June 4, an unidentified investor pumped $1 billion into the fund’s ETF. Two days later, when Monsanto was scheduled to exit the index, the same investor took $1 billion out.
It looked like a classic heartbeat trade, except it was five times too big. The ETF portion of the fund had only $184 million of Monsanto to get rid of, and no other large stock was leaving the index that day.
The size of the deal makes sense, though, considering that the entire fund had $1.3 billion of Monsanto to unload. The ETF didn’t just dispose of its own small stake in the company—it got rid of most of the mutual fund’s much larger stake as well.
Monsanto Magic
An outsize heartbeat trade in June helped Vanguard remove taxable gains from one of its mutual funds.
Fund flow
? On June 4, 2018, an unidentified investor pumped $1 billion into the fund’s ETF.
? The ETF’s share of Monsanto stock was worth only $184 million.
? Two days later, the day Monsanto was due to exit the index, the same investor took $1 billion out.
? But the whole fund was shedding enough Monsanto to explain the size of the trade.
Thanks to winnings on stocks like Monsanto, the fund reported $6.51 billion of capital gains in 2018. But for the 17th straight year since it got an ETF share class, the fund distributed no taxable gains to investors. The ETF ensured that the vast majority of the gains, $6.49 billion, weren’t taxable. The balance was probably canceled out by tax losses from earlier years.
There are dozens of similar examples of outsize heartbeats in Vanguard ETFs, an indicator of how hard the dialysis machine is working for mutual fund investors. They help explain why Vanguard’s heartbeats are so much bigger than those of other firms. The company has completed heartbeats worth $130 billion since 2004, according to a Bloomberg News analysis based on fund-flow data, compared with $75 billion by BlackRock’s iShares, the world’s largest ETF manager.
In addition to the 14 stock mutual funds that added a dialysis machine, Vanguard has created dozens of new stock investment pools as ETF-mutual fund hybrids. These funds have realized tens of billions of dollars of additional gains without burdening shareholders with taxes.
In some Vanguard funds, heartbeats are so large and frequent they outweigh regular stock withdrawals. The Vanguard Small-Cap Index Fund had about $37 billion of stock withdrawals over the past seven years, about $20 billion of which were from heartbeats, the fund-flow data show.
Vanguard has discussed licensing its hybrid ETF-mutual fund design to other firms, but no deal has come to fruition, according to people with knowledge of the talks. Those that have expressed interest included both index followers and active stock-pickers. United Services Automobile Association licensed the patent but never used it, and Van Eck Associates Corp. once sought regulatory approval for a similar design. Spokesmen for USAA and Van Eck declined to comment.
Phil Bak, CEO of Exponential ETFs in Ann Arbor, Michigan, said he expects other firms to mimic the Vanguard model once the patent expires.
“If you want to operate both vehicles, and you want to transfer some of the tax advantages of an ETF into the mutual fund investors, it’s a very efficient way to do so,” Bak said.
Mario Gabelli, founder of mutual fund manager Gamco Investors Inc., said he’s long called for ending ETFs’ tax advantage over mutual funds. Vanguard may have found a way to level the playing field by using heartbeats, he said, but he’s not tempted to copy it.
“You’re going against the intent of the system and finding ways to manipulate it,” Gabelli said. “It’s not good for confidence in the capital markets, and shame on Vanguard for doing it.”
Methodology: To identify heartbeat trades, Bloomberg News analyzed fund-flow data for 1,578 stock and mixed-asset ETFs on U.S. exchanges. The data was screened to find symmetrical inflows and outflows that occurred within five trading days of each other, were at least three times as large as any flows within the surrounding 40 days, represented more than 1 percent of fund assets, and met other criteria. Not every heartbeat pattern represents a maneuver to shed stocks without incurring taxes, but spot checks show almost all of them occurred in connection with portfolio changes and in years following stock-market gains. The screen identified only the most pronounced heartbeats and didn’t count those that occurred in rapid succession or weren't significantly bigger than adjacent fund flows.
To compute taxable gains in Vanguard’s Dialysis Machine chart, Bloomberg News used the sum of total capital-gains distributions by 13 Vanguard stock funds as a share of net assets, compared with the sum of capital gains realized through in-kind distributions as a share of net assets. The funds are the Total Stock Market, Extended Market, Value, Growth, Small-Cap, Mid-Cap, Small-Cap Value, Small-Cap Growth, European Stock, Pacific Stock, Emerging Markets Stock, Developed Markets and Total International Stock Index Funds. Each began as a mutual fund and later added an ETF share class. The 500 Index Fund was excluded because it had a unique method of generating significant in-kind redemptions prior to the addition of the ETF share class. The Real Estate Index Fund was excluded because it invests in real estate investment trusts that are taxed differently from stocks.
<<<
>>> Vanguard Founder Jack Bogle's Investment Tips, 12 Years Later
By Hailey Waller
May 4, 2019
https://www.bloomberg.com/news/articles/2019-05-04/vanguard-founder-jack-bogle-s-investment-tips-12-years-later?srnd=premium
Jack Bogle’s long-lost investment advice looks pretty good with hindsight.
Back in March 2007, the late Vanguard Group Inc. founder wrote an article for a men’s magazine laying out four fundamental tips. Though it didn’t make it into print at the time, the editor who worked with Bogle dug it up for Barron’s to publish 12 years later.
Bogle recommended a simple portfolio consisting of a bond index fund and a stock index fund, adjusted for the investor’s age. A 40-year-old investor who followed his advice and did nothing would have earned an annualized 7.3 percent, turning $100,000 into $236,000 by May 1, 2019, according to Barron’s. Vanguard’s 2035 target-date fund returned an annualized 6.1 percent over that period, which includes the Great Recession bear market that cut stock prices in half.
Bogle’s four tips? Focus on costs, diversify broadly, allocate prudently and stay the course. For anyone saying there might be better options than simply buying and holding two funds, his response was that the number of worse strategies is infinite.
“Successful investing doesn’t require sophistication and complexity; all that’s necessary is a healthy dose of common sense,” Bogle wrote, according to Barron’s.
He wasn’t as keen on the exchange-traded funds born out of his index funds. Ironically, advisers these days are making active bets through passive ETFs, straying far from the Bogle doctrine of low-cost, broadly diversified index investing, according to Barron’s.
Bogle, who died at age 89 in January, brought low-cost index-based mutual funds to the mainstream, saying that most stock-picking money managers weren’t worth the fees they charged.
>>>
Investors undermine their own portfolios -
>>> How big is your behaviour gap?
You are the real reason your returns suck. But help is on the way
by Tom Bradley
Nov 11, 2016
https://www.moneysense.ca/save/investing/real-reason-investment-returns-suck/
Not happy with your returns? If you’re looking for someone to blame you may want to try the mirror. I’ve spent the last decade trying to figure out the best way to deliver investment management to individual Canadians. What I’ve found is no matter how much careful thought goes into constructing a low-cost portfolio, there is no way to account for the biggest swing factor—investor behaviour.
Study after study confirms what I see on the front lines—investor returns are considerably worse than the returns of the products they invest in. Indeed, Dalbar, a U.S. research firm, did a study looking at 20-year returns to December 2014. It showed that a simple mix of 60% U.S. stocks and 40% bonds generated a return of 8.4% per year, while the average investor had a return of 2.5%. Carl Richards, a financial educator and personal finance writer for the New York Times, named this shortfall the ‘Behaviour Gap’.
There are many factors that contribute to the gap. Fees and commissions are part of it. Investors’ propensity to trade too much (often buying high and selling low) is another. Most portfolios hold too much cash. And perhaps the biggest gap widener is investor action at extreme points in the market cycle. Making significant changes to a portfolio at euphoric or gloomy moments can devastate long-term returns.
Just how big is your behaviour gap? Unfortunately, it’s difficult to figure out, but it’s about to get a whole lot easier. In January, banks and investment dealers will be required to report investment returns to their clients, so you’ll finally get a clear look at how your portfolio is doing. But if you already suspect you’re leaving money on the table, there are some simple things you can do to eliminate the behaviour gap.
Have a plan
It sounds basic, but knowing the purpose of the money and how you’re going to achieve your goal is the most important thing you can do. Investing isn’t a quick run to the corner store, it’s a multi-decade road trip, with winding roads, steep hills and detours to navigate around. It’s imperative that you have a map to keep you on course.
Develop a routine
Most aspects of your life have a pattern to them and investing should be no different. You want it to be as regular and disciplined as you can. That means consistently contributing to your portfolio, no matter what the markets are doing, rebalancing when your asset mix gets out of whack and staying on top of what’s happening with your portfolio and investment provider. Woody Allen said, “90% of success is just showing up.” Investing is like that. It’s not rocket science.
Stop overpaying
Are you paying commissions and fees for advice you’re not receiving? Do you own funds that charge active fees for passive management, or have multiple people doing the same thing? Stop it. Part of effective cost management is understanding the low-cost alternatives, such as ETFs, low-cost mutual funds, discount brokers and robo-advisors, all of which could play a role in your portfolio.
Be prepared for jolts and extremes
There’s no avoiding them. You might as well be prepared because they’re a necessary part of wealth creation. You should know what you’re going to do when stocks are up 30%, or down 20%. Or when a well-known columnist predicts a major crash. None of these things should take you off your plan, but if you’re not prepared, they just might.
Avoid the cash drag
In Canada, the biggest cause of the behaviour gap has been too much cash in portfolios. When investors are busy, or worried or unhappy with their advisor, they tend to leave large amounts of money sitting in the bank. Their do-nothing option is a savings account or GIC. For the money you’ve set aside to invest, however, the answer to being too busy, nervous or unhappy shouldn’t be cash, but rather your long-term asset mix. For example, if your plan calls for a mix of 70% stocks and 30% fixed income, that’s your default position.
There’s lots of blame to go around when your investment returns are disappointing, but you shouldn’t overlook the most important factor of all. You’re the CEO of your portfolio. The buck stops with you.
<<<
>>> Sell in May and go away? Maybe not this year.
CNBC
MAY 1 2019
Bob Pisani
https://www.cnbc.com/2019/04/30/sell-in-may-and-go-away-maybe-not-this-year.html
It is May, but this year don’t sell and get out just yet.
The “Best Six Months” strategy has become legendary on Wall Street. “Sell in May and go away” means investing in the Dow Jones Industrial Average between Nov. 1 and April 30 and switching into fixed income for the other six months. This has dramatically outperformed owning the Dow Industrials from May 1 to Oct. 31.
While the outperformance has not been as strong recently — the Dow has been up between May and November in 5 of the last 6 years — the overall strategy remains one of the greatest mechanical trading models ever devised.
An investor putting $10,000 into the S&P 500 between May 1 and Oct. 31, 1950 to the present would have $4,138, an astonishing loss of $5,862.
An investor putting $10,000 into the S&P 500 from Nov. 1 to April 20 over the same time period would have a gain of $2,836,350.
That is not a typo. We are talking about a gain of $2,836,350, versus a loss of $5,862.
These results were obtained by adding MACD triggers, certain buy and sell signals developed by the Stock Trader’s Almanac. Even without those MACD triggers, the results are amazing: Simply owning the Dow with an initial $10,000 investment from May 1 to October 31 since 1950 would have produced a gain of just a little more than $1,000, while simply owning the Dow with an initial $10,000 investment from November 1 to April 30 since 1950 would have produced gains north of $1 million.
“Thus far we have failed to find a similar trading strategy that even comes close over the past six decades,” said Jeffrey Hirsch, who runs Stock Trader’s Almanac. His father, Yale Hirsch, discovered this “Best Six Months” strategy back in 1986.
What could possibly account for this outperformance? First, there are still clear seasonal trends in market trading, particularly around the summer.
“It falls during a time when traders and investors prefer the golf course, beach, or pool to the trading floor or computer screen,” Hirsch said. “Trading volume can decline throughout the summer and then, in September, there’s back-to-school, back-to-work, and end-of-third-quarter portfolio window dressing that has caused stocks to sell off in September, making it the worst month of the year on average.”
October is also a traditionally a poor month for stocks, which Hirsch partially attributes to the Oct. 31 mutual fund deadline. The Tax Reform Act of 1986 mandated that Oct. 31 was the cut-off date for mutual funds to realize capital gains and losses.
Once the fourth quarter comes around, Hirsch says end-of-the-year strategies drive stocks.
“Institutions’ efforts in the fourth quarter to beef up their numbers can help drive the market higher, as does holiday shopping and an influx of year-end bonus money,” he said. “This is followed by the New Year, which can tend to bring a positive ‘new-leaf’ mentality to forecasts and predictions and the anticipation of strong fourth- and first-quarter earnings and drives the market higher into the second quarter.”
As he has many times in the past, Hirsch emphasizes that “sell in May” does not necessarily mean May will be down, or that the six-month period will be down.
“We are not the ‘sell in May’ people, we are the ‘reposition in May’ people,’” he said. “The point is that most of the market’s gains occur November through April and that the market tends to drift sideways and is more prone to sell-offs and bears May-October.”
Hirsch, in fact, is fairly bullish about the short-term prospects for the market. “The market will most likely drift higher on the bullish GDP, earnings backdrop and the dovish Fed,” Hirsch said. “Plus it’s the preelection year, and that is the best of the four-year cycle up 15.8% for DJIA and 28.8%.”
<<<
>>> Goldman Considers ‘A World Without Buybacks.’ It Looks Ominous.
Bloomberg
By Lu Wang
April 8, 2019
https://www.bloomberg.com/news/articles/2019-04-08/goldman-considers-a-world-without-buybacks-it-looks-ominous?srnd=premium
Corporate demand for stocks has dwarfed other investors
A ban on buybacks would spur stock volatility, a drop in P/Es
With political scrutiny of stock buybacks growing, Goldman Sachs started assessing an extreme scenario: “a world without buybacks.” The picture doesn’t look pretty.
That’s because corporate demand has far exceeded that from all other investors combined, according to strategists led by David Kostin. Since 2010, net buybacks averaged $420 billion annually, while buying from households, mutual funds, pension funds and foreign investors was less than $10 billion for each, Federal Reserve data compiled by Goldman showed.
“Repurchases have consistently been the largest source of U.S. equity demand,” the strategists wrote in a note Friday. “Without company buybacks, demand for shares would fall dramatically.”

Voices against buybacks are getting louder as politicians focus on corporate governance as an election issue. Senator Marco Rubio (R-Fla.), several Democratic senators and presidential candidate Bernie Sanders (I-Vt.) have lashed out at buybacks and have proposed related legislation.
Goldman has been one of the strongest defenders of the corporate practice, saying in a note a month ago that some “misconceptions” about buybacks are unfair. Without share repurchases, volatility would rise and valuation would dwindle and the bull market would risk losing one of its staunchest allies, they said in the latest report.
To get a taste of what the market would look like without buybacks, Goldman studied stock performance during earnings-related blackout periods, when discretionary buybacks are restricted beginning about five weeks before a company releases earnings, and then for two days after. During the past 25 years, return dispersion and volatility during blackout windows have been higher compared with non-blackout periods: 16 percentage points versus 14 percentage points, and 16.4 points versus 15.8 points, respectively.
Meanwhile, since buybacks have bolstered earnings per share by reducing the total stock outstanding, blocking repurchases would hurt growth in per-share earnings, a key measure watched by investors, Goldman said. Over the past 15 years, the gap between EPS growth and earnings growth for the median S&P 500 company averaged 260 basis points.
“In a world without buybacks, forward EPS growth could be trimmed by 250 bp,” a reduction that has historically corresponded to a 1 point decline in forward price-earnings multiples, the strategists said.
The role of buybacks have become all the more important now that equity exposure among major investors is already high, according to Goldman. By its count, aggregate equity allocation totals 44 percent across households, mutual funds, pension funds and foreign investors -- and that ranks in the 86th percentile relative to the past 30 years.
“Eliminating the largest source of equity demand could lower the demand curve if other investor categories do not replace the corporate bid from buybacks,” the strategists warned.
<<<
>>> Read This Before Buying Fidelity's Zero-Fee Funds
Get to know Fidelity's free funds before you invest in them.
Motley Fool
Jordan Wathen
Jan 6, 2019
https://www.fool.com/investing/2019/01/06/read-this-before-buying-fidelitys-zero-fee-funds.aspx
There are a few things in life you can expect to get for free: T-shirts, pens, and maybe the occasional koozie. But rarely do financial firms offer to manage your money at no cost at all. That's exactly what Fidelity is doing with its line of zero-fee funds, four index funds that look a lot like some of the most popular funds on the market, with the exception that they cost nothing at all.
It's a loss leader for Fidelity, but it could be a boon for some penny-pinching investors. Here's what you need to know about the four no-minimum, no-fee funds Fidelity will let you buy and hold without paying a dime in expenses.
A fund for (almost) every U.S. stock
Nothing says "index fund" quite like a total market index fund. The Fidelity ZERO Total Market Index Fund (NASDAQMUTFUND:FZROX), and funds like it, essentially invest in every single company listed on U.S. markets with only a few exceptions.
In this case, the fund excludes companies that have a market cap of less than $75 million and six-month trading volume of less than $25 million. Buying shares of smaller companies is hard to do without moving the market, so index funds generally avoid the smallest of public companies. Index funds and "nanocap" companies are like oil and water -- they don't mix very well.
Even so, this fund is as diverse as it gets, given it has about 2,500 holdings. Because it invests more money in the most valuable companies on the market, large-cap stocks make up the majority of its portfolio (the 10 largest stocks make up 18% of the portfolio).
This fund is just like any other fund that bears the "total stock market" or "total market index" name, making it most comparable to a Russell 3000 index fund. When you buy this fund, you own virtually every single U.S.-listed stock in proportion to its worth as a percentage of all U.S.-listed stocks out there. That's why funds like these are the closest thing to truly passive stock investing.
A copycat of the biggest and most popular index funds
It doesn't take much investigative work to figure out that the Fidelity ZERO Large Cap Index Fund (NASDAQMUTFUND:FNILX) is designed to replicate the most popular stock index funds on the market -- S&P 500 index funds. Of course, Fidelity will never advertise it as such, because doing so would require that Fidelity pay a hefty licensing fee to borrow the S&P 500 brand name. (Technically, this fund tracks the nondescript Fidelity U.S. Large Cap Index.)
The case for investing in the S&P 500 is simple: The roughly 500 monstrous companies that make up the index together comprise a little more than 80% of the U.S. stock market's value.
Fidelity's copycat has only a short operating history, but it's managed to perform roughly in line with the S&P 500 over the three-month period since its launch, lagging by about 0.08%. I suspect that the fund's ability to match the returns of the S&P 500 will improve as it grows. At $227 million in assets, it simply doesn't have the scale (yet!) to match the index as well as larger, true S&P 500 funds.
Top off your portfolio with some smaller stocks
An extended-market index fund is typically a complement for another fund. In this case, the Fidelity ZERO Extended Market Index Fund (NASDAQMUTFUND:FZIPX) is meant to be paired with the Fidelity ZERO Large Cap Index Fund because it holds stocks that are too small to get included in the large-cap party.
Whereas the Fidelity ZERO Large Cap Index Fund invests in roughly 500 of the very largest companies on U.S. exchanges, this fund invests in the 2,000 stocks that didn't make it in because of their size. To put it simply, if you add the stocks in this fund to the stocks in the Fidelity ZERO Large Cap Index Fund, you'll have all the holdings in the Fidelity ZERO Total Market Index Fund.
This fund is yet another knockoff. It's basically designed to be an alternative to funds that are based on the S&P Completion Index, which includes roughly 3,000 stocks that aren't in the S&P 500. It holds roughly 500 fewer stocks than the S&P Completion Index, but arguably those smaller companies are a rounding error, given the market cap weighting (more money is invested in larger companies).
Invest abroad...for free
It's a simple fact of life that international stock funds typically carry higher fees, but Fidelity ZERO International Index Fund (NASDAQMUTFUND:FZILX) is completely free. The fund is designed to invest in the vast majority of the most valuable companies listed on international exchanges. If you combine this fund with the Fidelity ZERO Total Market Index Fund, you'll own a piece of just about every investable stock in the U.S. and abroad.
This fund is another knockoff that, for practical purposes, is designed to produce returns similar to those of funds that track the MSCI ACWI Ex USA Index, including the Fidelity Total International Index (NASDAQMUTFUND:FTIHX). The difference between Fidelity's free ZERO fund and almost-free Total fund (it carries an expense ratio of 0.06% per year) is that the free alternative holds substantially fewer stocks. The ZERO fund has over 2,300 holdings versus nearly 4,700 holdings in Fidelity Total International Index.
When it comes to performance, though, these funds differ very little -- at least so far. In the fourth quarter of 2018, the only full quarter in which both funds were in operation, the ZERO fund modestly outperformed its comparable non-free Fidelity fund. Whether one outperforms the other will largely come down to international small caps, which are included in the Total fund but generally excluded from the ZERO fund.
Should you use Fidelity's free funds?
Free is good, but it's not always great.
It's important to remember that Fidelity's ZERO funds compete with funds that are already among the least expensive on the market. Plain-vanilla index funds can be found with expense ratios of 0.10% or less, which means you'd pay all of $0.10 per $100 invested to invest in those "name-brand" funds with long operating histories to analyze.
For investors who are just getting started, the benefits of a $0 minimum investment and no expenses is tough to beat. The only cost associated with investing in Fidelity's free funds is using a Fidelity brokerage account. If you're a new investor who just wants an inexpensive way to start investing small amounts of money, Fidelity's free funds are incredibly compelling.
Investors who have larger sums to invest, as well as those who invest in taxable accounts, may want to stick with the tried and true for now. Fidelity's free funds are still minnows compared to the established, low-cost index funds against which they compete. Until we have more history, it's smart to assume Fidelity's ZERO funds will likely generate returns that deviate from the indexes they "track."
In any given year, the Fidelity ZERO Large Cap Index Fund could easily post returns that are 0.2 percentage points higher or lower than the S&P 500, for example, which may negate the cost savings of a nonexistent expense ratio. (To be clear, that fund doesn't claim to track the S&P 500, though it is as close as it gets to being an S&P 500 index fund without actually being one. Wink, wink.) If you have $1 million in the market, a hypothetical 0.2-percentage-point divergence from the index is material ($2,000) and the differences only compound over time.
For investors who use taxable accounts, mutual funds of any kind -- even free ones -- are an easy "pass." For reasons that go far beyond the scope of this article, if you have the choice between an ETF or a mutual fund, and both track the same or very similar index, you're almost always better off with the ETF. The reason is that ETFs are often far more tax efficient than mutual funds, meaning ETFs generate fewer taxable capital gains than comparable mutual funds. According to one study, investors who held the 25 largest ETFs in 2015 effectively dodged taxes on nearly $60 billion of gains.
To boil it all down: Fidelity's free funds may not be perfect -- no funds are -- but their value proposition is most clear for beginning investors who plan to invest in a tax-advantaged retirement account.
<<<
Here's the model asset allocation that I decided upon, subject to future tweaking. I originally had the stock portion even lower, but listening to John Bogle, he considered a portfolio of 50/50 stocks/bonds to be the most bearish allocation he would have personally, and he was in his 80s.
My own view is that one should be able to drop the stock portion down to as low as 20%, so the current 45% could be subject to revision. To me 45% in stocks right now seems high.
Using index ETFs means no market timing, no individual stock blowups, super low expenses, etc. ETFs are considerably more tax efficient than the older index mutual funds, though those would still be fine within an IRA. The gold portion could be bumped up to 10%, but 10% would be the max allowed (per Jim Rickards). The dividends generated by these stock ETFs generally qualify as 'Qualified Dividends' for tax purposes (just like owning individual stocks), which is a big plus. ETFs almost never have year end capital gains distributions (unlike the older mutual fund format).
Bonds - 50%
Stocks - 45%
Gold - 5%
BONDS -
********
10% - Vanguard Total Bond Market ETF (BND) ------------ 3.17%
10% - Vanguard Intermediate Term Bond (BIV) ----------- 3.24%
10% - Vanguard Long Term Bond ETF (BLV) --------------- 3.96%
10% - Vanguard Intermediate Term Corporate ETF (VCIT) - 4.04%
10% - Vanguard Long Term Corporate ETF (VCLT) --------- 4.67%
STOCKS -
*********
20% - Vanguard High Dividend ETF (VYM) -------------- 3.39%
10% - Vanguard 500 Index ETF (VOO) ------------------ 2.23%
10% - Vanguard Utilities ETF (VPU) ------------------ 3.28%
5% -- Individual Stocks / Trading
GOLD -
*******
5% -- GOLD - US Eagle Coins -------------------------- 0%
>>> Gold Is One Wealth Fund's Escape From Geopolitics, Credit Risk <<<
___________________________________________________
Note - Looks like their allocation is -
Money Market + Bonds - 55% (down from 60%)
Real Estate - 30% (approx)
Stocks - 13-14% (the fund is allowed up to 25%)
Gold - 10% (up from 5%)
So this looks somewhat like Jim Rickards' allocation
____________________________________________________
>>> Gold Is One Wealth Fund's Escape From Geopolitics, Credit Risk
Bloomberg
By Zulfugar Agayev
February 3, 2019
https://www.bloomberg.com/news/articles/2019-02-03/gold-is-one-wealth-fund-s-escape-from-geopolitics-credit-risk?srnd=fixed-income
Azeri fund plans to grow gold holdings to 100 tons by year-end
For Azerbaijan’s sovereign wealth fund, nothing beats the safety of gold in a world gripped by trade disputes and geopolitical risk.
Known as Sofaz, the fund is looking to almost double its holdings of the precious metal in 2019 to 100 tons after resuming purchases in 2018 following a five-year break. By contrast, it’s steering clear of larger bets on bonds and especially equities, an approach that Executive Director Shahmar Movsumov says allowed the fund to avoid losses last year.
“We would want to have something that is not someone else’s credit risk,” Movsumov said in an interview in the capital, Baku, on Friday. “In a world where you see the changes in geopolitics, changes in reserve currencies, changes in the dynamics between superpowers and their imminent impact on the financial sector, you want to be on the safe side.”
As a traditional haven in times of turmoil, bullion is seeing a resurgence of demand after the U.S. Federal Reserve signaled that interest-rate increases could be off the table for now. Signs of a global slowdown and the prolonged U.S.-China trade war have added uncertainty to financial markets. With sentiment toward gold brightening since mid-October, it finished last year with its best quarter since March 2017 as stock-market volatility and a partial U.S. government shutdown also spurred demand.
Bullion had its best quarter in almost two years amid equity volatility
Sofaz, whose holdings now exceed 80 percent of Azerbaijan’s gross domestic product, was established in 1999 to manage oil and natural-gas income of the third-largest crude producer in the former Soviet Union. The fund expects its assets to rise by $2.3 billion and hit a record high of $40 billion this year, Movsumov said.
In 2012, Sofaz started to diversify by adding gold, equities and real estate. While the regulations allowed the fund to invest as much as 25 percent of its holdings in equities last year, it opted to keep those investments as low as 13 percent to 14 percent.
“We decided that it was not the right time to increase investment in equities, and we were right,” Movsumov said. “As life showed, last year was a very bad year for equities.”
Azeri President Ilham Aliyev signed a decree in December to change Sofaz’s guidelines, allowing it to double the allocation for gold to 10 percent of its investment portfolio. The share of bonds and money-market instruments was reduced to 55 percent from 60 percent. The fund made a “very small” profit in managing its assets last year but probably avoided losses thanks to the decision not to increase exposure to equities.
“Our peers made a lot of losses because of a bigger allocation into stocks,” Movsumov said. While Sofaz wants to take more risks as a long-term investor, the “risk appetite” of its stakeholders -- the country’s citizens and local media -- isn’t yet there, he said.
Sofaz had had more success investing in real estate, which has generated a “very steady income,” Movsumov said. It’s bought commercial real estate in London, Paris, Milan, Moscow, Seoul and Tokyo, and is still looking at markets in Europe, North America and Asia for more opportunities. There’s more interest in Asia because of better prospects for economic growth, he said.
While the fund has carried out direct acquisitions of real estate in previous years, nowadays it prefers investments via real estate funds because direct acquisitions requires more resources, Movsumov said.
Holdings in gold-backed ETFs rose in January by the most in two years
All of the gold Sofaz buys overseas is transported to Azerbaijan to be stored in its new building on Baku’s Heydar Aliyev Avenue. Asked why the fund doesn’t want to keep at least part of its gold holdings abroad, Movsumov said it’s a purely commercial decision and has nothing to do with trust.
“If you look at the returns on gold investments, they are so miserable that if there is a small change in tariffs on imports of gold, that will simply eat up all your returns,” Movsumov said. “So why bother? It’s better keep it in your vault downstairs.”
<<<
>>> Jack Bogle Changed Your Life Even If You Don’t Know Who He Was
Bloomberg
By Ben Steverman
January 19, 2019
https://www.bloomberg.com/news/articles/2019-01-19/jack-bogle-changed-your-life-even-if-you-don-t-know-who-he-was?srnd=premium
Vanguard chief’s idea of low-cost index fund flopped at first
Bogle, who died Wednesday, exposed drawbacks of stock-picking
Jack Bogle knew how to make a nuisance of himself.
“What he meant to most people in the investment business was that he was a royal pain in the bottom,” said Jeremy Grantham, co-founder of Boston-based Grantham Mayo Van Otterloo, or GMO.
By the time of Bogle’s death, on Wednesday at age 89, his victory was nearly total. Low-cost index funds, the idea he championed, are everywhere, from giant pensions and endowments to millennials’ 401(k) accounts. Vanguard Group, the firm Bogle founded, is now a $5 trillion giant.
This year, the investing industry will hit a symbolic tipping point: The amount of assets in U.S. index funds is almost certain to surpass the amount in actively managed products for the first time. Meanwhile, Vanguard collected inflows of $218 billion in 2018, Bloomberg data show. The rest of the U.S. fund industry lost $237 billion.
Bogle, who suffered the first of six heart attacks at age 31 and ended up with a heart transplant, didn’t seem like such a threat to Wall Street when he started Vanguard back in 1975.
Few Allies
People thought he was crazy. Practically his only allies were academics, economists like Nobel Prize winner Paul Samuelson and Princeton University’s Burton Malkiel, who thought the idea of index funds made a lot of sense. Money managers were charging big fees for the privilege of racking up mediocre returns. Bogle’s concept was simple. Since it was nearly impossible to consistently beat the market, why try? Just buy a large basket of stocks (or bonds), skip the cost of hiring an investment pro, and patiently collect the market return as the savings from those lower fees compounded.
Nice idea, but could anyone make money offering it? Other investment firms experimented with index funds, to underwhelming results. Clients didn’t seem to be clamoring for the product at a time when Wall Street’s marketing was all about investing prowess. Batterymarch Financial Management, a firm Grantham co-founded before GMO, tried it. One barrier, beyond client skepticism, Grantham says, was that “it was destined to be a very, very low profit business.”
And that –- low fees, low profit margins, letting investors keep more of their money –- was Bogle’s entire point.
Standard Load
The first-ever index mutual fund, accessible to all investors, not just institutional clients, was a flop. With Bogle expecting investment of as much as $150 million, Vanguard launched it with just $11.3 million. Even his fans in academia weren’t pleased. Samuelson complained about the fund’s 6 percent sales load, which was standard at the time. Loads were used to pay for kickbacks to financial advisers so they’d recommend the funds to their mostly unaware clients. Vanguard eliminated its loads in 1977, a virtuous move that nonetheless made it harder, at least at first, to attract assets.
Perhaps more disappointing was the fund’s performance. In the late 1970s, three-quarters of active-fund managers were still delivering better returns than Bogle’s index fund. By the early 1980s, half were outperforming the index fund, despite the lower fees. Then, later in the 80s, the tide turned, and Vanguard’s index fund began outpacing the vast majority of active funds.
Technology’s Role
Technology played an underappreciated role. Index funds have to buy and sell hundreds of securities every day, to deal with investment flows, re-invest dividends and generally keep up with the index they’re meant to track. Vanguard’s first fund could only handle about half of the Standard & Poor’s 500 index. By 1992, computers and trading systems had advanced to the point where Vanguard could launch its Total Stock Market Index Fund, which is now a $672 billion behemoth that buys every single U.S. stock, 3,500 in all, for fees as low as 0.04 percent per year.
Another reason Vanguard was able to turn the tide was the fierce competition active-fund managers started facing from each other. Investors were eager to jump into the surging markets of the 1980s and 1990s. Celebrity fund managers multiplied, and they were also up against new, high-tech hedge funds, which built powerful computers and hired scientists and math Ph.D.s to run them. The arms race made it more and more difficult to outsmart the market.
Finance Joke
By now, it’s become almost a joke on Wall Street. Every so often, some pundit predicts that this year, finally, will be a “stock-picker’s market,” when skilled individual stock selection can finally triumph over the quants and the indexes. But with each passing year, mutual funds, and even hedge funds, fall further behind the plain old index fund.
As Vanguard won more and more assets, along with the respect of many personal-finance experts, it was competing against a financial industry that loved to steer clients into higher-fee products. Vanguard, which Bogle had set up as a cooperative, would periodically cut fees, passing the savings from efficiencies and economies of scale to its customers. Other fund companies mostly held the line.
Then, investors started asking about fees, particularly after the steep market declines of 2000-2002 and 2008. Only the most unsophisticated investors would still put up with an adviser who recommended load funds. Pensions, endowments and, crucially, 401(k) retirement plans pushed more and more assets into index funds.
Fee War
Suddenly, Vanguard started facing serious competition of its own. A fee war broke out, with players like Fidelity Investments and Charles Schwab angling to cut costs closer and closer to zero.
The craze for indexes took on qualities that made Bogle unhappy. In his later years, when he was no longer in charge at Vanguard, he railed against exchange-traded funds, or ETFs, which are index products that can be bought and sold like stocks. He worried ETFs encouraged the sort of wasteful trading that hurt investor returns. Few agreed with Bogle –- even at Vanguard, which offered its own ETFs –- and the funds now hold $3.5 trillion in assets in the U.S.
Bogle’s Philosophy
Still, Bogle’s philosophy -- that trying to beat the market was futile, especially if you’re an investing amateur –- was winning the day. His advice became conventional wisdom for big companies setting up 401(k)s. They encouraged workers to buy and hold index funds with low fees, and discouraged them from getting in their own way by trading too much. Today, a generation of workers is plowing its retirement savings into index funds, whether they realize it or not.
The ultimate savings for the American investor from Bogle’s persistence may amount to more $1 trillion, according to an estimate by Bloomberg ETF analyst Eric Balchunas. And the windfall will continue to rise as the benefits of lower fees compound year after year after year.
Bogle was a folk hero to investing nerds and an outspoken enemy of stock-pickers and self-serving financial advisers. But he wasn’t a household name. The biggest beneficiaries of Bogle’s invention are regular investors who might have no idea who he was.
<<<
>>> Jack Bogle, the Apostle of Index Funds, Never Gave Up
His ideas were initially dismissed as “folly,” but today Vanguard has $5 trillion under management.
Bloomberg
By Joe Nocera
January 16, 2019
https://www.bloomberg.com/opinion/articles/2019-01-17/vanguard-founder-jack-bogle-was-the-apostle-of-index-funds?srnd=premium
He shouted from the rafters: Stay the course!
To be perfectly crass about it, you would have made an awful lot of money if you had followed the advice of Jack Bogle, the Vanguard founder who died Wednesday at the age of 89.
In 1976, a year after starting the Vanguard Group, as it’s now known, Bogle introduced the first index fund geared to individual investors. This was an era, recall, when what mattered most if you ran a mutual fund company was to have a handful of star fund managers you could market. Peter Lynch, John Neff, Bill Miller, John Templeton — these were the financial heroes of the 1970s and 1980s, renowned for their ability to outperform the market.
Bogle’s idea could not have been more different. Instead of trying to beat the market, his Vanguard 500 Index Fund would hold the same stocks as the S&P 500, and would simply match the market. His fund did not require an active manager, much less a superstar like Lynch. It also didn’t require much overhead; Bogle knew that fees chewed up stock gains, and he kept Vanguard’s fees far lower than the rest of the industry.
Finally, Bogle knew that even the greatest fund manager was likely to fall back to earth sooner or later. Investors often threw money at a fund manager just as he was peaking, and wound up losing money. Year in and year out, an astounding 80 percent or more of fund managers fell short of the market. Investors who stopped trying to beat the market — who were simply content with matching it — were far better off.
When he first introduced it, people in the industry called it “Bogle’s folly.” But he had the last laugh. On Jan. 16, the day he died, the S&P 500 closed at 2616.10. If you had stuck with his philosophy, Bogle’s folly would have gotten you a total return of 8,559 percent.
Bogle was a scold — there’s no getting around it. A gentlemanly scold, who could not have been more gracious when you visited him, but a scold nonetheless. It took years for his index fund to catch on. In the 1980s, when the market was rocketing up, investors could not have cared less about “merely” matching the market. That was for wimps. Then, in the ’90s, although index funds had gained acceptance, especially in corporate 401(k) accounts, the internet bubble turned investors’ heads.
All the while Bogle would make speeches, and give interviews, and write articles and books — and shout from the rafters — that fees mattered more than investors realized, and that index funds made the most sense for the vast majority of individual investors, and that people who were always looking for the hot fund or the hot stock were not doing themselves any favors. “Stay the Course,” was the title of one of his books. “The Clash of the Cultures: Investment vs. Speculation” was another.
Bogle’s Vanguard had a panoply of actively managed funds as well — Neff managed the Windsor Fund, for instance — but his heart was always with his beloved index funds. In 1996, the year he stepped down as Vanguard’s chief executive — he had a heart transplant that year — his company had more than $45 billion in a variety of index funds.
But Bogle still felt as if he were preaching to an empty church. In a speech he made that May to a group of portfolio managers, he complained that Vanguard “is the sole apostle of indexing” and that companies now offering an index fund had come to it “kicking and screaming.” And he was right. An index fund represented something people didn’t really want to admit: that the chances of beating the market were slim, and they were better off not trying.
His first converts were the nation’s financial writers like Jane Bryant Quinn at Newsweek and Jonathan Clements at the Wall Street Journal. (“Without a doubt, Jack C. Bogle is the greatest man I’ve had the privilege of knowing,” wrote Clements on his blog.) After the crash of 1987, I became a convert too. Bogle always had time for us. We were the ones spreading his message, pointing out the statistics about how mutual fund managers underperformed, stressing the importance of fees, and talking up the utility of indexing.
Eventually, the great body of investors found themselves in agreement with Bogle. On the strength of its index funds, Vanguard became the nation’s largest mutual fund complex with more than $5 trillion under management. (That’s right, trillion.) Was Bogle happy? Alas, he was not.
As he saw it, far too much of the popularity of index funds was being driven by exchange traded funds, which allowed investors to quickly get in and out of the market — to time the market. Indeed, turnover in the biggest such funds was over 100 percent in a month. Turnover like that represented everything Bogle despised about the financial services industry.
Last year, when I asked Bogle about ETFs, he told me that Vanguard had been offered the chance to market the first ETF in the early 1990s, when he was still running the company. “I said, ‘No way. That’s not what index funds are for.’ Now you can trade the S&P 500 all day long,” he added. “What kind of nut would do that?”
As recently as November, Bogle was still at it, writing an article in the Wall Street Journal offering a series of idea for how index funds should be reformed.
In the end, although he never put it like this, Bogle understood that investing is hard. Most of us lack not only the time to put into it, but also the fortitude to zig when others are zagging, or to buy when others are selling. That’s why we should have listened to Jack Bogle for all those years when we were jumping on hot stocks — and why we should listen to him still, even though he’s is no longer with us.
<<<
>>> John C. Bogle, Founder of Financial Giant Vanguard, Is Dead at 89
John C. Bogle built the Vanguard Group on the belief that over the long term, most investment managers cannot outperform the broad market averages.
New York Times
By Edward Wyatt
Jan. 16, 2019
https://www.nytimes.com/2019/01/16/obituaries/john-bogle-vanguard-dead.html
John C. Bogle, who founded the Vanguard Group of Investment Companies in 1974 and built it into a giant mutual fund company, with $4.9 trillion in assets under management today, died on Wednesday in Bryn Mawr, Pa. He was 89.
Vanguard, based in Malvern, Pa., announced his death but gave no cause. Mr. Bogle, who had struggled with a congenital heart defect and had several heart attacks, received a heart transplant in 1996.
Mr. Bogle built Vanguard on a cornerstone belief that was anathema to most mutual fund companies: that over the long term, most investment managers cannot outperform the broad market averages. He popularized and became the leading proponent of indexing, the practice of structuring an investment portfolio to mirror the performance of a market yardstick, like the Standard & Poor’s 500 stock index.
“Indexing was the purview of institutional investors, but Jack Bogle came up with the consumer version,” said Daniel P. Wiener, the editor of The Independent Adviser for Vanguard Investors, a newsletter and website that has tracked the company for decades. “He made people aware of expenses, and told them that costs come right out of the bottom line.”
But Mr. Bogle became a harsh critic of the mutual fund industry in later years. In the second half of the 1990s, he said, stock market investors were spoiled by average annual returns of more than 20 percent per year and, as a result, cared too little about the high expenses they were paying to mutual fund managers for those managers’ presumed expertise at picking stocks. Mutual fund companies, he said, were all but immoral for accepting such fees.
“My ideas are very simple,” he told the financial columnist Jeff Sommer of The New York Times in 2012. “In investing, you get what you don’t pay for. Costs matter. So intelligent investors will use low-cost index funds to build a diversified portfolio of stocks and bonds, and they will stay the course. And they won’t be foolish enough to think that they can consistently outsmart the market.”
In recent years it has been hard to argue with that. Since 1984, less than half of the actively managed mutual funds that invest in a broad array of American stocks have outperformed Vanguard’s Index 500 fund, one of the world’s largest, with more than $441 billion in assets under management, according to Vanguard.
Vanguard’s advantage came from the unusual corporate structure that Mr. Bogle adopted. Vanguard managed its indexed mutual funds at cost, charging investors fees that were far lower than those of virtually all of its rivals.
Mr. Bogle also went a step further in differentiating Vanguard from other companies that sponsor mutual funds. In contrast to a management company, which in most cases controls the fund complex and provides all the investment, administrative and marketing services required in its operations, Vanguard is more like a mutual insurer, owned by investors in the funds, which employ their own officers and staff. Those employees are responsible to the funds’ directors.
Mr. Bogle argued that Vanguard funds were thus completely independent of their advisers and operated solely in the interests of shareholders — able to monitor investment results objectively, negotiate advisory fees at “arm’s length” and change advisers if need be.
“John Bogle has changed a basic industry in the optimal direction,” Paul A. Samuelson, the 1970 Nobel laureate in economics, wrote in a foreword to “Bogle on Mutual Funds” (1993). “Of very few this can be said.”
The superior performance of the Vanguard funds attracted investors and assets in droves. In the last three years of the 1990s, Vanguard received more new money from investors than the next three largest fund companies combined.
Vanguard’s consistent growth produced riches for Mr. Bogle, but not to the extent that another ownership structure might have done. For example, Edward C. Johnson III, the chairman of Fidelity Investments, has a net worth of $7.4 billion, according to Forbes. Mr. Bogle’s net worth was generally estimated at $80 million last year.
Most fund companies spend huge sums to attract new customers. But Mr. Bogle eschewed the product- and marketing-driven thinking of much of the industry that has spread with the boom in mutual fund sales this decade.
“We’re never allowed to use the word ‘product,’ ” he told an interviewer in 1995. “It sounds like toothpaste and beer.”
His reputation as a tightwad was well earned. At breakfast with a reporter in 1993, at a suburban Philadelphia restaurant near Vanguard’s headquarters, Mr. Bogle figured out that he would beat the $5.95 cost of the buffet by ordering from the menu. If he had an early-morning meeting in New York, he would take the early Amtrak Metroliner shuttle rather than pay for a hotel room in Manhattan.
Mr. Bogle readily took swipes at the press for lauding fund managers who temporarily got a hot hand, and for focusing heavily on a fund’s quarterly performance. Even a fund manager’s long-term record is not an accurate predictor of future performance, he said.
It was that combative nature that had led him to start Vanguard in the first place.
After graduating magna cum laude from Princeton in 1951 with an economics degree, Mr. Bogle was hired by Walter L. Morgan, founder of the Wellington Fund, a Philadelphia-based fund management company. Mr. Morgan had read Mr. Bogle’s senior thesis on mutual funds.
While working his way up at Wellington, Mr. Bogle persuaded Mr. Morgan to introduce a new all-equity fund, called the Windsor Fund, to complement Wellington, which invested in both stocks and bonds.
Mr. Bogle was named president of Wellington in 1967, and soon thereafter it merged with the Boston investment company Thorndike, Doran, Paine & Lewis. Several years later, a management dispute with the principals of the new company led Mr. Bogle to depart; he founded Vanguard in 1974 to handle the administrative functions of the mutual funds overseen by Wellington Management.
Two years later, Mr. Bogle founded the Vanguard Index Trust, now known as the Index 500 fund, the first index fund for individual investors. The next year he again broke from industry practice, selling mutual funds directly to investors rather than through brokers, and thus eliminating the sales fees of up to 9 percent that funds typically charged.
“Our challenge at the time was to build, out of the ashes of a major corporate conflict, a new and better way of running a mutual fund complex,” Mr. Bogle said in 1985.
He officially stepped down as chief executive of Vanguard in January 1996 and remained as chairman until the end of 1999. Tim Buckley is the current chief executive.
Mr. Bogle’s retirement did not come easily. After giving up the chief executive title to his handpicked successor, John J. Brennan, Mr. Bogle openly disagreed with several of Mr. Brennan’s decisions. A rift developed between them, which contributed to Mr. Bogle’s failure to persuade Vanguard’s board of directors to allow him to stay on past the traditional retirement age of 70.
“I thought there would be an exception for the company’s founder,” he said in 2012. Vanguard veterans say that Mr. Bogle and Mr. Brennan barely spoke, if at all, in the years afterward.
Mr. Bogle left the Vanguard board and set up the Bogle Financial Markets Research Center, a financial research institute, in order, he said, to “let the controversy die away in a gracious way.”
Mr. Brennan was succeeded by F. William McNabb III, who told Mr. Sommer in 2012 that people at Vanguard “revere Jack Bogle.”
John Clifton Bogle was born in Montclair, N.J., on May 8, 1929. A twin brother, David, died in 1994.
Mr. Bogle graduated from Blair Academy in Blairstown, N.J., and, in 1951, from Princeton; he was a scholarship student at both.
Mr. Bogle was treated for right ventricular dysplasia, a congenital heart defect, for more than 30 years, and had at least six heart attacks, the first in 1960. After his heart transplant in 1996, he returned to good enough health that he was able to play squash daily.
Mr. Bogle served on the board of the Investment Company Institute, a mutual fund trade group, from 1969 to 1974, and as its chairman from 1969 to 1970. In 1991, he was named by the chairman of the Securities and Exchange Commission, Richard C. Breeden, to the Market Oversight and Financial Services Advisory Committee.
In addition to “Bogle on Mutual Funds,” his other books include “Common Sense on Mutual Funds” (1999) and “The Clash of the Cultures: Investment vs. Speculation” (2012).
Mr. Bogle married Eve Sherrerd in 1956. They had four daughters, Barbara Bogle Renninger, Jean Bogle, Nancy Bogle St. John and Sandra Bogle Marucci; two sons, John Jr. and Andrew; 12 grandchildren; and six great-grandchildren.
Mr. Bogle regularly gave half his salary to charities.
“My only regret about money,’’ he said in 2012, “ is that I don’t have more to give away.”
<<<
>>> What to Expect When You’re Expecting a Bear Market
Make adjustments to your portfolio, but don’t abandon your strategy.
Bloomberg
January 11, 2019
https://www.bloomberg.com/news/articles/2019-01-11/what-to-expect-when-you-re-expecting-a-bear-market?srnd=premium
If there’s a silver lining for Main Street investors in the stock market turmoil of the past few months, it’s this: They now have a far more realistic idea of how much risk they’re willing to take—and a new appreciation for what portfolio diversification means.
The plunge in the S&P 500 late last year, 19.8 percent from its September high to its December low, wasn’t quite enough to meet the traditional definition of a bear market (unless you’re rounding up). And stocks have climbed back more than 9 percent since. Still, after a very long bull market, fear of missing out has suddenly morphed into worry about years of fat gains melting away. Some investors are taking a serious look at the risks in their portfolio for the first time in a while. Financial planners see it in their offices. “Our highest client acquisition periods are when the markets are getting murdered,” says Lou Stanasolovich, president of Legend Financial Advisors. “We live for this.”
It’s true that many people don’t do a deep analysis of their portfolio until a hard knock forces them to pay attention. While many are nervous now, few are in crisis mode, which makes this a good time for them to reexamine whether their portfolios are still in sync with their risk tolerance and financial goals. “We should spend more time planning for volatility and potential losses than trying to predict when the next downturn will happen,” says Peter Lazaroff, chief investment officer at investment adviser Plancorp.
Of course, advisers warn against selling emotionally after a drop. Many investors will even want to buy stocks, if only to get the share of their portfolio that’s devoted to equities back up to their intended allocation. “When big market moves happen, there’s a big opportunity to rebalance,” says Greg Davis, CIO for Vanguard Group. “Valuations are back to fair levels when it comes to U.S. equities.” Sam Boyd, a 31-year-old financial planner and senior vice president at Capital Asset Management Group, says that when he sees high volatility, he just hopes it coincides with the end of his pay period so his 401(k) contribution goes into the market as it falls.
The idea of a portfolio review isn’t to try to time the market, but to accept that volatility is normal and make sure you aren’t getting more of it than you can handle. Investors can start by looking at all their accounts next to one another to see where they overlap and if they need to be rebalanced. Many are likely to discover that their supposedly diversified portfolio is surprisingly concentrated in large-cap tech stocks. “I hear people say all the time that they have an S&P 500 index fund, so are diversified across 500 companies,” says David Alison of Alison Wealth Management. What they don’t take into account, he says, is how shares of a handful of massive technology companies have grown in value and now take up a large portion of not only indexes such as the S&P 500 but also the portfolios of actively managed mutual funds.
About a decade ago, at the stock market bottom on March 9, 2009, the largest weighting in the S&P 500 was Exxon Mobil Corp., at 5.6 percent of the index. The oil giant was followed by about 2 percent weightings each in companies as diverse as AT&T, Chevron, Johnson & Johnson, and Procter & Gamble. As of Jan. 8 the highest weighting is Microsoft Corp., at about 3.7 percent of the index. It’s followed by Amazon.com, Apple, Berkshire Hathaway (which has Apple as its largest common-stock holding), and Johnson & Johnson. The S&P’s top 10 also includes Alphabet Inc. and Facebook Inc.
Highflying tech stocks are also dominant in many funds with a big presence in 401(k) retirement savings plans. At the $108 billion Fidelity Contrafund, for example, three of the top five holdings on Nov. 30 were tech stocks: Amazon represented almost 7 percent of assets, Facebook 5.4 percent, and Microsoft 4.2 percent. All told, tech represented more than 34 percent of the fund’s portfolio, according to Morningstar Inc. data.
What’s more, portfolio concentrations tend to grow when clients invest on their own, Alison says, because people often invest in what they know. “My Apple employees are buying Facebook, Netflix, Qualcomm, Amazon,” he says. His Facebook clients aren’t buying more Facebook directly, he adds, but when their restricted shares vest, they hold on to them rather than diversify.
“It’s surviving the head game over time that determines how successful you are”
Reassessing tech exposure doesn’t have to mean running from these companies altogether. As of Nov. 30, the Vanguard S&P 500 exchange-traded fund had about 22 percent of its assets in the tech sector. You can use that figure as your rough baseline. If your overall stock portfolio holds much less, you’re making a bet that tech stocks have become overvalued. (This may make some intuitive sense after a long rally, but remember that these kinds of active calls are extremely difficult even for professionals to get right.) If you hold a lot more, you may have unintentionally chased the momentum of the market’s hottest sector, and it could make sense to pare back to a weighting in line with the index.
Investors should also consider if they have enough money in bonds. This may feel like odd advice just now: One reason the stock market is hurting is because the U.S. Federal Reserve has been pushing up interest rates, and bond prices fall when rates rise. Still, a diversified portfolio of high-quality bonds should be less volatile than stocks and can play a key role in preserving capital over time.
A starting point for thinking about how much to hold in bonds is your age, says William Bernstein, a principal at Efficient Frontier Advisors. An old, conservative rule of thumb is “your age in bonds”—so if you’re 45, you’d hold 45 percent in fixed income. But you can adjust that up or down based on how comfortable you are with risk. Many target-date retirement mutual funds, which allocate assets based on an investor’s age, are much more aggressive. That can work if you tend to see stock market drops as buying opportunities.
Which brings us to psychology. Bernstein puts the challenge of staying cool amid constant market noise in blunt terms: “It’s all a head game, and it’s surviving the head game over time that determines how successful you are.” Theoretically, young investors could be 100 percent in stocks because they could have 40 to 50 years of earning power and the ability to ride out market cycles. The problem? “There aren’t very many sentient beings in this quadrant of the universe that can actually tolerate [a portfolio] of all stocks,” Bernstein says.
Even a young person may want some bonds as ballast, to help lessen urges to sell during a market swoon. Perhaps more crucial is keeping money in safe short-term bonds or a money-market fund—outside of a retirement account—to tap in case of an emergency, such as losing a job. Recessions—and jumps in unemployment—sometimes follow bear markets, and you don’t want to find yourself forced to sell stocks for living expenses after prices have plunged.
Experienced, older investors face a tougher dilemma. They’ve lived through market downturns and know the wisdom of staying the course, but they’re also closer to retirement, when they will be living on savings and investments rather than adding to them. They also face this turmoil with more dollars at stake than they had when they were young, which can intensify the pain of a percentage loss they might have once brushed off.
Behavioral tricks that reframe how to think about money can make it easier to deal with such problems. Some planners suggest allocating money into three different “buckets” for goals with different time horizons. A “now” bucket for daily expenses and emergencies might hold three years of income in a bank account or money market. For a 60-year-old, a “soon” bucket would cover expenses further out, like the first 5 to 10 years of retirement expenses. That would be invested conservatively, maybe in bonds. “Generally, in a diversified portfolio, if you have 10 years, you’re not going to be hurt too badly,” Alison says. A “later” bucket focused on goals more than 10 years out holds the rest of the portfolio and can be invested in stocks. Once you’ve tackled those big issues, you can go back to tuning out most of the market indexes’ ups and downs.
<<<
>>> Triple-X ETFs Now Taboo at Vanguard as Regulators Look Other Way
The Street
Bradley Keoun
Jan 10, 2019
https://www.thestreet.com/markets/triple-x-etfs-now-taboo-at-vanguard-as-regulators-look-other-way-14830195?puc=yahoo&cm_ven=YAHOO&yptr=yahoo
Some exchange-traded funds are so risky that big financial firms won't even sell them.
Some financial products are so risky that big firms sometimes decide not to sell them despite their popularity -- out of fear that customers will end up with such devastating losses that refunds are sought, lawsuits are filed or tales of woe are peddled to a sympathetic news reporter.
That appears to be the case with "triple-X" exchange-traded funds, which offer investors the ability to triple gains on stock-market movements, but also the potential for triple losses.
Vanguard Group, the $5.1 trillion money manager, said this week that starting on Jan. 22 it will stop selling the ETFs, which use complex financial engineering to amplify market returns, using a concept known as "leverage." In addition to banning the the so-called leveraged ETFs, Vanguard will also halt sales of "inverse ETFs," which use similar financial-engineering techniques to provide investors with fat gains whenever stocks fall.
"This change is part of an ongoing effort to align the products and services we offer with our investors' focus on the long term," according to a notice posted on the Malvern, Pennsylvania-based company's website on Jan. 8. "These investments, which are generally incompatible with a buy-and-hold strategy, run counter to this long-term focus."
Three years ago, U.S. regulators tagged the leveraged and inverse ETFs as among the riskiest Wall Street inventions to emerge as part of the rapid growth in the ETF industry as a whole, where total assets globally have swelled sixfold over the past decade to $4.79 trillion, based on the latest count by the research firm ETFGI.com.
The vast majority of ETFs are far simpler in construction, allowing investors to make bets on things like the Standard & Poor's 500 Index of large U.S. stocks via easy, low-commission trades on an exchange.
Mary Jo White, former chairwoman of the Securities and Exchange Commission, led a push in 2015 to ban triple-leveraged, or "3x," funds -- on the grounds that they were too risky.
Yet White was replaced at the SEC after President Donald Trump was elected in 2016 amid promises of loosening regulations on the financial industry. Her successor, Jay Clayton, has taken no action on the proposal, instead offering to require better labeling of exchange-traded products.
In May 2017, the SEC even approved one firm's proposal to offer a "4x" ETF, offering quadruple the returns of the S&P 500.
Vanguard revealed its distaste for the investment vehicles in mid-2018, when it announced plans to provide commission-free online trading in almost 1,800 of competitors' ETFs in addition to its own 77 ETFs. Leveraged and inverse ETFs were specifically excluded from the offer.
In this week's announcement, the firm said that the leveraged and inverse ETFs' "extremely short-term, speculative nature is contrary to the long-term focus shared by most Vanguard investors."
Ben Johnson, director of global ETF research at Morningstar, said in a phone interview that a growing number of Wall Street firms have been taking extra steps to make sure customers are fully informed about the risks of leveraged and inverse ETFs, though usually stopping short of banning them outright.
"There's more gating and red-taping in place so as to immunize these firms from any of the potential negative ramifications and blowback" that might occur if customers suffered devastating losses en masse, Johnson said. He added that he assumes Vanguard wasn't making enough profit off of selling the leveraged and inverse ETFs to justify the ongoing business risk.
Yet Daniel Wiener, editor of the newsletter Independent Adviser for Vanguard Investors, says the firm still sells plenty of other investments that, in his opinion, are just as risky.
"I agree with Vanguard that these leveraged ETFs are dangerous when used by people who don't understand how they work," Wiener said in a phone interview. "But it's a little bit of nanny-stateness to actually be telling investors what they can and can't invest in."
Of course, when things go badly, it can be nice to have a nanny.
<<<
>>> Study Shows 96% of Stocks Don’t Beat Treasuries in Long Term
Think Advisor
By Jane Wollman Rusoff
August 21, 2017
https://www.thinkadvisor.com/2017/08/21/study-shows-96-of-stocks-dont-beat-treasuries-in-l/?slreturn=20181131185330
Undiversified portfolios are at a high risk of underperforming, Bessembinder says.
Here’s an eye-opener: From 1926 through 2015, only 4% of listed stocks were responsible for the overall net gain in the U.S. stock market. The other 96% collectively matched one-month Treasury bills over their lifetimes.
That’s what a working paper, “Do Stocks Outperform Treasury Bills?”, by finance professor Hendrik Bessembinder of Arizona State University, has found and discusses in an interview with ThinkAdvisor. He studied data on nearly 26,000 stocks going back to 1926.
The professor’s research helps explain why active managers most often underperform benchmarks. Since actively managed portfolios are typically poorly diversified, the research emphasizes the importance of diversification.
Bessembinder’s study suggests that active management’s underperformance can typically be anticipated as a result of undiversified portfolios — “even in the absence of costs, fees or perverse skill,” he writes.
The phenomenon is a consequence of “positive skewness on the cross-sectional distribution of stock returns.” Skewness is present in undiversified portfolios but not in fully diversified ones. Bessembinder explains this lack of symmetry, in succinct layman’s terms, in the interview.
If you’re surprised that the positive performance of the market is attributable to outsize returns of only a small number of “powerhouse” stocks, so was Bessembinder. He’d always assumed that over time, most equities would deliver a positive premium compared to Treasury bills, he says.
He got the idea for the study while working on another project for which he was analyzing data from Chicago University’s Center for Research in Security Prices (CRSP). Finding the monthly data to be negative, he began digging and then dug some more, which led to his paper.
Bessembinder has published more than 35 academic articles on the financial markets and consults to firms including Barclays Global Investors and Goldman Sachs. He has also consulted to the Financial Industry Regulatory Authority on transparency in bond markets, the New York Stock Exchange on measuring trading costs, the Securities and Exchange Commission on order routing and the Justice Department on stock market collusion.
ThinkAdvisor recently interviewed Bessembinder, on the phone from Seattle, where he conducts research every summer at the University of Washington. In our conversation, he does not neglect to opine on why investing in stocks still beats playing the lottery. Here are excerpts from the interview:
THINKADVISOR: What are the chief takeaways from your study?
HENDRIK BESSEMBINDER: The bad news for stock pickers is that there’s worse than a 50%-50% chance that the stocks will underperform. The good news is that if, by luck or wisdom, you’re able to identify those relatively few big winning, home-run stocks, there’s tremendous potential return. There is an enormous possible upside to active management if one can pick those super stocks in advance.
Net-net, what does that mean to financial advisors?
If you pick relatively few stocks as opposed to being broadly diversified, there isn’t a 50%-50% chance as to whether they’ll over- or underperform the market. There’s a greater than 50% chance they’ll underperform.
So is a key implication from your study that most advisors should build diversified portfolios?
For a lot of advisors, that goes against their core mission. To say that active managers should broadly diversify would go against the grain for them because if you broadly diversify, you’re essentially an indexer. The more diversified you get, the more you start looking like an indexer as opposed to being a true active manager. And if you’re an indexer, have you justified charging a sizable fee?
What does your research add to what has already been documented about active management’s performance?
We already know that most active strategies underperform, particularly over longer time periods. In addition to the explanations that are in the literature, like management fees and trading costs, the point that comes out of my paper is that the skewness of returns contributes to more than 50% of active strategies underperforming.
Is that mainly due to lack of portfolio diversification?
Right. The skewness issue is present in undiversified portfolios.
OK. Now, please define “skewness.”
In a positively skewed distribution, which is what I’m documenting, the median is less than the mean: Most of the individual returns are less than the mean, and a few individual returns are much greater than the mean. So most individual stocks are going to underperform.
Do the big home-run stocks have any common characteristics?
That relates to the question: Can we identify these stocks in advance? All I can say is that I don’t have any good insights on how to do that. Of course, the key question for active managers is whether they can convince their investors that they can.
What are some examples of the super stocks that you found?
Many were the big technology stocks, like Apple, Facebook, Microsoft. There were some old-school industrial stocks too, such as ExxonMobil, which is No. 1 in lifetime wealth creation. But they’ve been in the database since the 1920s. The other stocks of course have been there for much shorter periods of time — yet they’re high on the list.
You looked at returns as of July 26, 1928. That was a year before the start of the Great Depression. How did the Depression and the Wall Street Crash of 1929 impact the returns you studied?
Of course the Depression weeded out some stocks. It’s in the database, and it’s relevant. But the phenomenon of the majority of stocks underperforming Treasury bills is concentrated in stocks that have joined the database since the 1970s.
Why is that?
It seems likely that we had a change in the type of company that was brought to market around that time. They were probably bringing younger and less prudent companies to market as compared to the stocks brought in earlier decades.
Do you agree with the reporter, writing in The New York Times, that interpreted your findings to mean that “individual stocks resemble lottery tickets”?
He was focusing on the small possibility of very large returns. The danger in that analogy is that lottery tickets lose money on average. The stock market does not lose money on average. So it’s important to make that distinction. Stocks are a much better investment than the lottery.
Certainly most people don’t create money by buying a lottery ticket.
Right. Buying lottery tickets is keeping the dream alive. But if you’re reasonably diversified in the market for a time, you do make money. You’re better off being a stock picker and seeing if you can pick the next Amazon. The problem is that you have to wait 20 years to see if you have.
What do you invest in?
I’m completely an indexer and largely buy-and-hold. I have equity index funds and low-cost bond funds. So I’m personally not a stock picker.
<<<
Fwiw, my current model allocation looks like this (for a retiree) -
STOCKS (US) (30%) - Vanguard High Dividend ETF (VYM)------- 3.26%
BONDS (US) (50%) - Vanguard Total Bond Market ETF (BND) -- 3.34%
CASH - (10%) - Vanguard Federal Money Market Fund (VMFXX) - 2.06%
GOLD - (10%) - US Gold Eagles
You could also get a similar mix of stocks/bonds in a single vehicle using the Vanguard Wellesley Income Fund (40% Stocks/60% Bonds), or for a higher stock percentage you could use the Vanguard Balanced Index Fund (60% Stocks/40% Bonds). Either way, these should get through a bear market pretty well -
https://investorshub.advfn.com/Asset-Allocation-Strategies-36260/
Well, now comes the moment of truth for the market - the Oct/Nov lows have failed, so next comes the test of key support (Feb-April lows). Better hope that holds or it could be a long way down.
Of course for the HDGE aficionados, that will be a time of glee and celebration, and too bad if the world unravels and we head into another Dark Age. But a recession won't be the end of the world, and even if Ice-9 comes, we will survive.
An interesting insight from that '60/40' asset allocation article I posted is that even if the stock market is cut in half, with a 60% Bond/40% Stock allocation, your portfolio would only be down 20% overall, and less if you have some Treasuries in the bond mix, since the Treasuries should rally.
If you use the Vanguard Total Bond Fund or ETF, they have 64% in US Govt bonds, and on the corporate bond side, 21% in bonds rated Aaa, Aa, and A, and less than 15% in corporates rated Baa, with zero rated under that.
I figure the 60% bond allocation will probably rally during a stock market meltdown, with the expected flight to quality/safety (Treasuries) and the Fed reversing course on interest rates. Add in a 10% gold and a sizable cash position, and a 50% drop in stocks shouldn't faze a conservative investor too much.
The 60/40 solution -
(60% bonds, 40% stocks)
>>> The Stock Market Is Having Its Worst Year in a Decade. Here's What to Do Now, Depending on Your Age
Money
Sergei Klebnikov
December 12, 2018
https://finance.yahoo.com/news/stock-market-having-worst-decade-195555396.html
The Stock Market Is Having Its Worst Year in a Decade. Here's What to Do Now, Depending on Your Age
The stock market has been pretty scary since October. Don’t panic: There are smart, simple moves you can make to protect your portfolio, no matter what age you are.
For the first three quarters of 2018, it looked like another great year for U.S. stocks. As recently as September 20th, the S&P 500 hit an all-time record. Since then, however, fears about rising interest rates and political dysfunction have rattled markets. In the past three months, stocks have tumbled almost 10%. The upshot is that the S&P 500 is set to return just 0.27% for 2018 – its worst showing since the 2008 financial crisis.
Given the recent trends — and the fact that many economists are predicting a recession by 2021 or sooner — here are some steps you can take to protect your portfolio.
If You’re Young, Ignore the Turmoil
For younger investors – with 80% or more of their portfolios in stocks – your best bet is to simply ride out the next bear marked, whenever it comes.
“Stay disciplined and keep funding your 401(k),” says Salt Lake City financial planner Devin Pope, pointing out that in some ways a downturn is advantageous to young investors. It gives them a chance to buy stocks at discounted prices.
While seeing your hard-earned savings lose value isn’t easy, you might not have to endure it as long as you think. For instance, an investor with 90% in stocks and 10% in bonds at the start of the financial crisis in 2008 would have been down more than 40% in March 2009, when the market bottomed out. But, assuming they avoided cashing out, they’d have broken even by mid-2011, just over three years later, according to data from Morningstar. By the start of this year, they’d have more than doubled their money.
“The best idea is to turn off CNN and stop listening to the talking heads,” says to Huntington, N.Y. financial planner Jon Ten Haagen.
If You’re Older, Preserve Purchasing Power
Older investors, especially retirees, can’t afford to be as aggressive as younger ones. That’s because once you start using your portfolio to fund living expenses, you can no longer expect to just ride out the next downturn. In the worst case scenario, you could be forced to sell stocks to cover your monthly bills right at the moment they’re at their least valuable.
That means, at a volatile time like this, it can be tempting to move the bulk of your assets to bonds. Bonds tend to more or less hold their value even in dramatic bear markets, meaning your purchasing power is preserved no matter what the stock market does in any given year. There’s a problem with that approach too, however. In the long-run, bonds don’t offer the same returns as stocks. If you’re like most retirees, you’ll need to count on the stock market’s long-term growth potential to make sure your savings last through a long retirement.
So what to do? Financial advisers recommend investors who are close to or have just entered retirement move 50% to 60% of their savings to bonds to weather downturns and keep the rest in stocks to ensure long-term growth. A portfolio that’s 60% bonds and 40% stocks should decline less than 20%, even in the worst years, according to a study of historical stock-market returns by Vanguard. Meanwhile, that 40-60 portfolio will still return about 8% a year on average in the long run, compared to the stock market’s 10% average return.
Another approach: Put enough of your savings into bonds to fund three to seven years of living expenses, and the rest into the stock market, according to Pope. That should give you a big enough bond portfolio to wait out any bear market, while also maximizing your portfolio’s long-term growth potential.
“If the economy goes into recession, you’ll have those assets to pull from,” he says of investors’ bond holdings.
<<<
Vanguard Wellesley Income Fund holdings -
Stocks - 36.69%
Bonds - 61.24%
Short-term reserves - 2.07%
_______________________________
30 day SEC yield - 3.4% as of 11/30/2018
Expense ratio - 0.22%
Fund total net assets
$51.7 billion
Net assets of 10 largest holdings
11.6%
Number of stocks
72
Number of bonds
1042
Average effective maturity
9.3 years%
Average duration
6.3 years
10 largest holdings
(11.60% of total net assets) as of 10/31/2018
1 JPMorgan Chase & Co.
2 Verizon Communications Inc.
3 Johnson & Johnson
4 Pfizer Inc.
5 Cisco Systems Inc.
6 Philip Morris International Inc.
7 Chevron Corp.
8 Eli Lilly & Co.
9 Comcast Corp.
10 Suncor Energy Inc.
>>> 72 Stock Holdings
JPMorgan Chase & Co.
Johnson & Johnson
Cisco Systems Inc.
Pfizer Inc.
Verizon Communications Inc.
Suncor Energy Inc.
Philip Morris International Inc.
Chevron Corp.
Eli Lilly & Co.
Exxon Mobil Corp.
DowDuPont Inc.
Intel Corp.
Comcast Corp. Class A
Unilever NV
Wells Fargo & Co.
Merck & Co. Inc.
Medtronic plc
Analog Devices Inc.
MetLife Inc.
Coca-Cola Co.
Union Pacific Corp.
Eaton Corp. plc
Lockheed Martin Corp.
Dominion Energy Inc.
Caterpillar Inc.
Crown Castle International Corp.
Bristol-Myers Squibb Co.
Novartis AG
NextEra Energy Inc.
Eversource Energy
TransCanada Corp.
Procter & Gamble Co.
QUALCOMM Inc.
PepsiCo Inc.
Duke Energy Corp.
3M Co.
McDonald's Corp.
Canadian Natural Resources Ltd.
Koninklijke Philips NV
Roche Holding AG
Sempra Energy
Travelers Cos. Inc.
American Electric Power Co. Inc.
Kinder Morgan Inc./DE
Nutrien Ltd.
Home Depot Inc.
Occidental Petroleum Corp.
BAE Systems plc
Schlumberger Ltd.
Kraft Heinz Co.
Chubb Ltd.
BB&T Corp.
International Paper Co.
Maxim Integrated Products Inc.
M&T Bank Corp.
BCE Inc.
American International Group Inc.
Nestle SA
Xcel Energy Inc.
British American Tobacco plc
PNC Financial Services Group Inc.
Mondelez International Inc. Class A
Exelon Corp.
Phillips 66
Sysco Corp.
Cie Generale des Etablissements Michelin SCA
Bank of Nova Scotia
BlackRock Inc.
LyondellBasell Industries NV Class A
Edison International
Broadcom Inc.
KLA-Tencor Corp.
<<<
Vanguard Wellesley Income Fund (VWINX) -
>>> In Praise of Balanced Funds
https://obliviousinvestor.com/in-praise-of-balanced-funds/
As regular readers have probably noticed, Darrow Kirkpatrick of Can I Retire Yet is one of the writers most frequently included in my weekly roundups. I’ve been enjoying his writing since I first encountered it, so when I met Darrow in person at the Financial Blogger Conference this year, I invited him to author a guest article for this site. I hope you enjoy it.
Balanced funds are mutual funds that combine stocks and bonds into a single investment. Generally they stick to a fixed asset allocation, within certain ranges. Balanced funds have traditionally been favored by conservative investors looking for safety, income, and modest growth. In a word, they’re boring!
For most of my journey to early retirement, I had no interest in balanced funds. I dabbled in individual stocks, then gradually shifted to passive index funds during my heavy accumulation years. Towards the end of that time, as I focused more on safety and retirement income, balanced funds appeared on my radar.
At some point I took a small position in Vanguard Wellesley Income. Then something curious happened. Whenever I had free cash to invest, I’d scrutinize my existing holdings plus my investing “wish list.” After some research, number crunching, and pondering, I’d often just put the money in Wellesley Income! Over time, that one fund has grown to constitute about one-third of my portfolio.
Why did I keep choosing this one balanced fund? Because, regardless of the economic cycle, market cycle, or my own personal life cycle, it was nearly always an appealing investment.
The bond component of a balanced fund tends to dampen out the volatility of the stock market. A balanced fund won’t rise quite as high in the good times, but it will fall far less in the bad times, and you’ll generally make back those dips in reasonable order. So, over time, a balanced fund can limit the stock market’s swings, while delivering much of its returns.
And, while it’s not guaranteed, the stock component of a balanced fund makes the fund more likely to keep up with inflation than a bank CD, a bond, or a bond fund.
Helping You Avoid Mistakes
Another research-documented reason to like balanced funds: They help you to avoid common behavior that leads to investing mistakes.
To appreciate the evidence for this, you first need to understand the concept of investor returns as distinguished from fund returns. We’re all familiar with the annual returns that mutual funds report in their glossy ads. But investor returns are what the average investor actually earns from the fund.
Why would those numbers be different? Consider a fund that has a great quarter and goes up 5% early in the year. That’s approximately a 20% annual return. Investors see that great return and pile in. Then the fund flat lines for the rest of the year. So it winds up the year by earning 5%, while most of its investors earned nothing. That’s investor returns.
In 2011 Morningstar completed a study on the gap in investor returns — how individual investors do compared to their funds’ overall returns. Here’s a snapshot of what they found: In 2010, the average domestic stock fund earned a return of 18.7% compared with only 16.7% for the average fund investor — a 2% difference. For the trailing three years, that gap was 1.28%.
However it was a different story for balanced funds: The gap between investor and fund performance in 2010 was only 0.14%, and just 0.08% for the trailing three years. Results were even better for the trailing 10 years. And results were similar for target-date funds and moderate- and conservative-allocation funds — close kin to balanced funds. As anybody who has crunched retirement numbers knows, a 1-2% difference in annual return over long periods can easily add up to tens of thousands of dollars!
Why do individual investors do better when they are buying and holding balanced funds? It’s probably because balanced funds don’t tend to incite fear or greed — two emotions that can be lethal to investment performance. Balanced funds are easier to live with.
It’s like the difference between a family sedan and a race car. The race car might have awesome performance, in the right hands. But, for those of us who aren’t full-time professional drivers, there are much better vehicles for driving around a city. It’s the same with investing: For most people, a vehicle with predictable behavior, that they can handle, will produce better results. [Mike’s note: That’s my bolding.]
Using a Balanced Fund In Your Portfolio
Should a balanced fund (or a target-date or allocation fund) make up your entire portfolio? That’s a viable option for many. But it may not be possible, given the investment choices in your retirement plan. Or you might want the level of control offered by individual index funds or ETFs. But a balanced fund could still play a useful anchoring role in your portfolio, while serving as a mechanism to diversify or automate part of your rebalancing strategy. That’s how Wellesley Income functions in my portfolio.
Which balanced fund might be best for you? Vanguard Wellington and Wellesley Income have long and enviable track records, and have worked well for me. But note these are actively managed funds. While they have extremely low expenses — 0.25% for Wellesley Income investor shares and 0.18% for Admiral shares, for example — their managers do trade positions in an attempt to enhance performance. Mike makes a good case for the passive index-based Vanguard LifeStrategy Moderate Growth Fund, largely because of the increased international exposure. And if I had it to do over, I’d probably choose one of the LifeStrategy funds too.
In the end, only you can choose what’s right for you. But, whatever you decide, remember this principle: your long-term investing behavior is far more important to success than the exact investments you pick, the exact asset allocation you choose, or the rebalancing strategy you implement. As it turns out, balanced funds just make it easier for you to behave well!
<<<
Cash as an alternative to stocks -
Short term rates close to 3.5% by the end of 2019
>>> Bank of America sees market decline next year: 'There is now an alternative to stocks'
CNBC
by Fred Imbert
11-12-18
https://www.cnbc.com/2018/11/23/bank-of-america-sees-market-decline-next-year-there-is-now-an-alternative-to-stocks.html?__source=yahoo%7Cfinance%7Cheadline%7Cstory%7C&par=yahoo&yptr=yahoo
Bank of America Merrill Lynch's Savita Subramanian says the S&P 500 will rise to 3,000 by the end of this year and then will decline to 2,900 next year.
"Our rates team is calling for an inverted yield curve during the year, homebuilders peaked about one year ago and typically lead equities by about two years and our credit team is forecasting rising spreads in 2019," Subramanian says.
"Assuming the market peaks somewhere at or above 3000, our forecast is for modest downside in 2019," she added.
There is a good chance stocks stall out next year as credit conditions tighten and earnings growth slows, according to Bank of America Merrill Lynch.
"We believe the peak in equities is likely before the end of 2019," wrote Savita Subramanian, equity and quantitative strategist at Bank of America Merrill Lynch, in a note this week. She sees the S&P 500 rising slightly to 3,000 before the end of this year and then falling 3 percent in 2019 to 2,900.
"Our rates team is calling for an inverted yield curve during the year, homebuilders peaked about one year ago and typically lead equities by about two years and our credit team is forecasting rising spreads in 2019," Subramanian said. "Assuming the market peaks somewhere at or above 3000, our forecast is for modest downside in 2019."
An inverted yield curve refers to when the yield on short-term sovereign debt, such as the two-year Treasury note, is higher than the rate on longer-dated paper such as the benchmark 10-year Treasury note. An inverted yield curve is typically followed by an economic recession.
Investors have been fretting this year about the Treasury yield curve possibly inverting. The spread between the 10-year and two-year yields was around 24 basis points on Friday. This has been happening as the Federal Reserve has hiked the overnight rate three times this year. The central bank is also expected to hike once more before year-end. The Fed also forecasts it will raise rates three times in 2019.
As the yield curve continues to flatten, Subramanian expects equity-market volatility to increase and for more of the firm's "bear market signposts" to be triggered. Currently, 58 percent of these signals are triggered. In October 2007 — roughly a year before the financial crisis — all of the 19 signposts were triggered.
"Still-supportive fundamentals, still-tepid equity sentiment and more reasonable valuations keep us positive. But in 2019, we see elevated likelihood of a peak in the S&P 500," the strategist notes, adding S&P 500 earnings growth will likely slow down to a crawl after a blockbuster 2018. S&P 500 earnings grew by 25 percent in the first three quarters of the year, boosted in large part by lower corporate taxes.
Cash as alternative
However, Subramanian says investors can now turn somewhere they have not been able to for a long time as stocks stall out: cash. "There is now an alternative for stocks," Subramanian said, noting yields for cash are higher today than for 60 percent of S&P 500 companies. "Cash is now competitive and will likely grow more so … our Fed call puts short rates close to 3.5% by the end of 2019, well above the S&P 500's 1.9% dividend yield."
Many investors operated during this bull market under the mantra "There Is No Alternative" to stocks following the financial crisis as low Federal Reserve rates made assets like cash yield next to nothing, thus making them unattractive to investors.
Subramanian recommended investors buy stocks in the health care, technology and financials sectors.
On health care, she says it is "cheap" compared to historical levels and is trading at a discount to the overall S&P 500. She also notes fundamentals are strong for the sector and that more than half of the companies beat earnings and sales estimates during the third quarter.
Subramanian said tech is now "cheaper" and less crowded after a big sector reorganization moved Netflix and Facebook out of the sector. "Positioning risk is neutral to positive" now, she said.
Financials, meanwhile, should get a boost as companies in the sector ramp up their buyback programs. "Whereas other sectors have been buying back shares for almost a decade, Financials were disallowed until recently. But Financials' share buybacks have ticked up substantially, and the sector has the second highest dividend growth in the S&P 500."
<<<
Cash is back -
>>> One ominous sign that another recession is looming
Brett Arends
11-1-18
MarketWatch
https://www.msn.com/en-us/money/markets/one-ominous-sign-that-another-recession-is-looming/ar-BBP3sGl?li=BBnb7Kz
Yes — cash is back.
Once again people who don’t want to take on the risks of the stock market or the bond market or the gold market or any other market — and just want a reasonable rate of return on their savings without having to worry — are starting to feel some love.
Interest rates on two-year certificates of deposit or CDs — not quite “cash,” but pretty close — have just cracked 3% for the first time since living memory. And rates on parallel two-year Treasury bonds are not far behind. Just a couple of years ago they were offering barely half a percent — and this minuscule rate of interest, of course, was fully taxable too.
These rates are already well ahead of the 2.2% overnight Federal Funds rate set by the Federal Reserve, as financial markets have already anticipated further rate hikes by the Fed, expected later this year and in 2019.
The surge in rates for deposits comes at a time when stocks and bonds are both suddenly looking distinctly rocky. And for the first time in quite a while, those buying CDs can beat inflation, which has averaged about 2.5% this year.
One woman’s trash is another woman’s treasure, so while Wall Street speculators freak out at the prospect of rising interest rates, and President Trump complains that the Federal Reserve is going “crazy” by putting rates back up, let’s not forget all for those whom rising interest rates are a matter of enormous relief. That means, above all, retirees, and those near retirement, as well as all those who are willing to accept lower returns for a lot less risk.
Right now my broker is offering me CDs paying 3% or better from six nationally known banks. Bankrate.com lists one. All of these are insured by the Federal Deposit Insurance Corporation, which means up to $250,000 is covered even if the bank pulls a Lehman. Two-year Treasury Notes — IOUs issued by Uncle Sam, and freely tradable through any broker — are now paying interest rates of 2.84%. The last time we saw rates that high was in 2007 — almost a year before the Lehman collapse.
These two-year notes and equivalent 24-month CDs seem to be in the sweet spot in terms of length. They effectively lock in the next couple of interest rate hikes by the Federal Reserve, while taking on very little risk from inflation. They are paying nearly as much as 10-year Treasury Notes (which are currently yielding 2.84%).
The gap between the two has rarely been this low. Typically, longer-term bonds have to offer one or more extra percentage points of interest per year to tempt investors into a longer-term fixed rate of interest. The narrowing of this gap is widely seen on Wall Street as an ominous sign of a recession on the horizon.
Cash is considered a four-letter word on Wall Street, figuratively as well as literally, because of the simplistic argument that cash-like securities — things like Treasury bills, savings accounts and certificates of deposit —have historically offered very low returns compared to stocks and bonds. It’s true up to a point, but it misses a lot.
Data from New York University’s Stern School of Business show that short-term Treasury bills, for example, failed to keep pace with inflation in the 1940s and 1950s, and again in the 1970s. On the other hand, they kept you ahead of the eight-ball in the 1930s, 1960s, and after the early 1980s.
Cash, of course, did very well during the financial meltdowns and market crashes of, for example, 1929-1932, 1987, 2000-2003 and 2007-2009. Research conducted for England’s Cambridge University last decade also argued that 20% cash, rather than bonds, was the best counterbalance to stocks in a long-term portfolio.
Whether cash outperforms stocks or bonds in the near future is something no one will know in advance. U.S. stocks are at historically elevated levels when compared to, say, the size of the national economy, or the corporate earnings of the past decade. Meanwhile bond market king Jeffrey Gundlach has warned that longer-term bond prices could fall a lot further.
<<<
Asset allocation model -
Watching my dad's investing success over the years, I concluded that asset allocation plays a big role. Here are the percentages I came up with for a conservative investor nearing retirement, taking into account that we're 10 years into a bull market -
50% - Bonds/Fixed Income
25% - Stocks
10% - Gold/Silver
10% - Cash
5% - Trading
These percentages don't include one's real estate holdings, collectibles, or any positions in commodities. The 25% in stocks would mostly be in large cap higher dividend type. Bonds would be divided into high quality corporates and munis. I included 5% for trading, for fun, but with strict position limits.
Overall this looks like a workable model, providing income and some prospects for modest growth over time. The 10% in gold/silver is disaster insurance.
>>> Achieve Optimal Asset Allocation
By Shauna Carther
March 8, 2018
https://www.investopedia.com/managing-wealth/achieve-optimal-asset-allocation/
Allocating your investments among different asset classes is a key strategy to help minimize risk and potentially increase gains. Consider it the opposite of "putting all your eggs in one basket."
The first step to understanding optimal asset allocation is defining its meaning and purpose. We will then take a closer look at how allocation can benefit you and determine the right asset mix to achieve it.
What Is Asset Allocation?
Asset allocation is the strategy of dividing your investment portfolio across various asset classes like stocks, bonds and money market securities. Essentially, asset allocation is an organized and effective method of diversification.
Your options typically fall within three classes: stocks, bonds and cash. Within these three classes are subclasses or alternatives that can include:
Large-cap stock: Shares issued by large companies with a market capitalization generally greater than $10 billion.
Mid-cap stock: Issued by mid-sized companies with a market cap generally between $2 billion and $10 billion.
Small-cap stocks: Represent smaller-sized companies with a market cap of less than $2 billion. These equities tend to have the highest risk due to lower liquidity.
International securities: Assets that are issued by foreign companies and listed on a foreign exchange. International securities allow an investor to diversify outside of his or her country, but they also have exposure to country risk, which is the risk that a country will not be able to honor its financial commitments.
Emerging markets: Securities from the financial markets of a developing country. Although investments in emerging markets offer a higher potential return, there is also higher risk, often due to political instability, country risk and lower liquidity.
Fixed-income securities: The fixed-income asset class comprises debt securities that pay the holder a set amount of interest, periodically or at maturity, as well as the return of principal when the security matures. These securities tend to have lower volatility than equities and lower risk because of the steady income they provide. Note that though the issuer promises income payment, there is a risk of default. Fixed-income securities include corporate and government bonds.
Money market: Money market securities are debt securities that are extremely liquid investments with maturities of less than one year. Treasury bills (T-bills) make up the majority of these types of securities.
Real estate investment trusts (REITs): Real estate investment trusts (REITs) trade similarly to equities, except the underlying asset is a share of a pool of mortgages or properties, rather than ownership of a company.
Maximizing Return & Minimizing Risk
The main goal of allocating your assets is to minimize risk while meeting an expected level of return. Of course to maximize return and minimize risk, you need to know the risk-return characteristics of the various asset classes. Figure 1 compares the risk and potential return of some popular choices:
Equities have the highest potential return, but also the highest risk. On the other hand, Treasury bills have the lowest risk because they are backed by the government, but they also provide the lowest potential return.
This is the risk-return tradeoff. Keep in mind that high-risk choices are better suited for investors who have a high risk tolerance (can accept wide fluctuations in value) and who have a longer time horizon to recover from losses.
It's because of the risk-return tradeoff – that potential return rises with an increase in risk – that diversification through asset allocation is important. Since different assets have different risks and market fluctuations, proper asset allocation insulates your entire portfolio from the ups and downs of one single class of securities.
So, while part of your portfolio may contain more volatile securities – which you've chosen for their potential of higher returns – the other part of your portfolio devoted to other assets remains stable. Because of the protection it offers, asset allocation is the key to maximizing returns while minimizing risk.
Deciding What's Right for You
As each asset class has varying levels of return and risk, investors should consider their risk tolerance, investment objectives, time horizon and available capital as the basis for their asset composition. Investors with a long time horizon and larger sums to invest may feel more comfortable with high-risk, high-return options. In contrast, investors with smaller sums and shorter time spans may feel more comfortable with low-risk, low-return allocations.
To make the asset allocation process easier for clients, many investment companies create a series of model portfolios, each comprising different proportions of asset classes. These portfolios of different proportions satisfy a particular level of investor risk tolerance. In general, these model portfolios range from conservative to very aggressive:
Conservative Portfolios
Conservative model portfolios generally allocate a large percent of the total portfolio to lower-risk securities such as fixed-income and money market securities. The main goal of a conservative portfolio is to protect the principal value of your portfolio (the money you originally invested). As such, these models are often referred to as "capital preservation portfolios."
Even if you are very conservative and prefer to avoid the stock market entirely, some exposure can help offset inflation. You could invest the equity portion in high-quality blue chip companies or an index fund, since the goal is not to beat the market.
Moderately Conservative Portfolios
A moderately conservative portfolio is ideal for those who wish to preserve a large portion of the portfolio's total value, but are willing to take on a higher amount of risk to get some inflation protection. A common strategy within this risk level is called "current income." With this strategy, you chose securities that pay a high level of dividends or coupon payments.
Moderately Aggressive Portfolios
Moderately aggressive model portfolios are often referred to as balanced portfolios as the asset composition is divided almost equally between fixed-income securities and equities in order to provide a balance of growth and income. Since moderately aggressive portfolios have a higher level of risk than conservative portfolios, this strategy is best for investors with a longer time horizon (generally more than five years) and a medium level of risk tolerance.
Aggressive Portfolios
Aggressive portfolios mainly consist of equities, so their value tends to fluctuate widely. If you have an aggressive portfolio, your main goal is to obtain long-term growth of capital. As such, the strategy of an aggressive portfolio is often called a "capital growth" strategy. To provide some diversification, investors with aggressive portfolios usually add some fixed-income securities.
Very Aggressive Portfolios
Very aggressive portfolios consist almost entirely of equities. As such, with a very aggressive portfolio, your main goal is aggressive capital growth over a long time horizon. Since these portfolios carry a considerable amount of risk, the value of the portfolio will vary widely in the short term.
Tailor Your Allocations to Your Needs
Note that the above outline of model portfolios and the associated strategies offer only a loose guideline. You can modify the proportions to suit your own individual investment needs. How you fine-tune the models above can depend on your future needs for capital and what kind of investor you are.
For instance, if you like to research your own companies and devote time to stock picking, you will likely further divide the equities portion of your portfolio into subclasses of stocks. By doing so, you can achieve a specialized risk-return potential within one portion of your portfolio.
Also, the amount of cash and equivalents or money market instruments you place in your portfolio will depend on the amount of liquidity and safety you need. If you need investments that can be liquidated quickly or you would like to maintain the current value of your portfolio, you might consider putting a larger portion of your investment portfolio in money market or short-term fixed-income securities. Those investors who do not have liquidity concerns and have a higher risk tolerance will have a small portion of their portfolio within these instruments.
Asset Allocation Strategies
While you decide how to allocate your portfolio, keep in mind several allocation strategies and their goals. Each one offers a different approach based on the investor's time frame, goals and risk tolerance. The most common strategies include strategic, tactical, constant weighting and systemic asset allocation.
The Importance of Maintaining Your Allocated Portfolio
Once you have chosen your portfolio investment strategy, it's important to conduct periodic portfolio reviews, as the value of various assets will change. This affects the weighting of each asset class, meaning over time a portfolio can grow from containing primarily one type of asset class to another. For example, if you start with a moderately conservative portfolio, the value of the equity portion may increase significantly during the year, suddenly giving you an equity heavy portfolio. This makes the portfolio more like that of an investor practicing a balanced portfolio strategy, which is higher risk.
In order to reset your portfolio back to its original state, you need to rebalance it. Rebalancing is the process of selling portions of your portfolio that have increased significantly and using those funds to purchase additional units of assets that have declined slightly or increased at a lesser rate. This process is also important if your investment strategy or tolerance for risk has changed.
The Bottom Line
Asset allocation is a fundamental investing principle because it helps investors maximize profits while minimizing risk. The different asset allocation strategies described above cover a wide range of investment styles, accommodating varying risk tolerance, time frames and goals.
Once you've chosen an appropriate asset allocation strategy, remember to conduct periodic reviews of your portfolio to ensure you're maintaining your intended allocation and are still on track to your long-term investment goals.
<<<
| Name | Symbol | % Assets |
|---|---|---|
| Apple Inc | AAPL | 3.23% |
| Microsoft Corp | MSFT | 2.88% |
| Amazon.com Inc | AMZN | 2.43% |
| Facebook Inc A | FB | 1.14% |
| Alphabet Inc Class C | GOOG | 0.78% |
| Alphabet Inc A | GOOGL | 0.77% |
| Johnson & Johnson | JNJ | 0.71% |
| Berkshire Hathaway Inc Class B | BRK.B | 0.68% |
| Procter & Gamble Co | PG | 0.62% |
| Visa Inc Class A | V | 0.61% |
| Volume | |
| Day Range: | |
| Bid Price | |
| Ask Price | |
| Last Trade Time: |


