 News
News  Market Data
  Discover
Support: 888-992-3836
Copyright © 2023 InvestorsHub Inc.


Register for free to join our community of investors and share your ideas. You will also get access to streaming quotes, interactive charts, trades, portfolio, live options flow and more tools.
Goldman - >>> Investors should 'go for gold' as Fed rate cut looms, Goldman says
Yahoo Finance
by Ines Ferré
Sep 3, 2024
https://finance.yahoo.com/news/investors-should-go-for-gold-as-fed-rate-cut-looms-goldman-says-155551358.html
Investors should "go for gold" as the precious metal's stellar run isn't over, Goldman Sachs analysts said in a research note.
On Tuesday, gold futures hovered above $2,515 per ounce. The precious metal is off its all-time high touched last month but still up nearly 22% year to date, making it the world's second-best-performing asset behind crypto.
"Our preferred near-term long is gold. It remains our preferred hedge against geopolitical and financial risks, with added support from imminent Fed rate cuts and ongoing EM central bank buying," wrote Goldman Sachs analysts on Sunday.
The firm maintains a 2025 target of $2,700 per ounce and issued a "long gold" recommendation.
Purchases by central banks, which hit a record in the first quarter of 2024, have been one of the biggest drivers of the precious metal's rise this year. BofA analysts estimate gold has now surpassed the euro to become the world's largest reserve asset, second only to the US dollar.
Geopolitical risks such the Israel-Hamas war and Russia-Ukraine conflict, as well as signals from the Federal Reserve of a September rate cut amid signs of a slowing labor market, have also buoyed prices.
"We're seeing gold being used as an uncertainty hedge," said Tom Bruni, head of market research at Stocktwits, in a recent episode of Stocks in Translation.
Global physically backed gold ETFs have now seen inflows three months in a row as Western investors pile into gold, with North American activity outpacing Europe and Asia in July, according to the latest World Gold Council data.
In the near term, traders may be wondering if gold will succumb to a historically negative trend for assets this month. The yellow metal has declined every September since 2017, according to Bloomberg data.
Analysts expect the commodity's next catalyst will come when the Federal Reserve meets this month following a week of fresh labor data and a crucial monthly jobs report on Friday.
"Gold prices continue to hover at around $2,500/oz with focus primarily on the size of the expected upcoming Fed rate cut later this month," wrote JPMorgan analysts in a note on Tuesday.
As of early Tuesday, traders were pricing in a 31% probability of a 50 basis point cut instead of 25 basis points, per the CME FedWatch Tool.
<<<
---
>>> Why gold is outperforming nearly everything so far this year
Yahoo Finance
by Jared Blikre
Aug 28, 2024
https://finance.yahoo.com/news/why-gold-is-outperforming-nearly-everything-so-far-this-year-100022695.html
Gold futures have been surfing record highs, with Monday's prices hitting $2,555.2 per ounce, sending the value of a 400 troy ounce gold bar to $1,022,080.
The yellow metal has forged meteoric gains this year, emerging as the world's second-best-performing asset next to crypto. Its 23% year-to-date gain edges out the megacap-loaded Nasdaq Composite — itself up a healthy 18%. (A proxy for the crypto market writ large, the Bitwise 10 Crypto Index Fund (BITW), is up 47% this year.)
According to BofA Global Research, gold funds just absorbed the largest inflows in four weeks, attracting $1.1 billion. Yet, the broader trend has actually seen $2.5 billion in outflows year to date, suggesting that underlying strength is coming from outside traditional fund flows.
Central banks — especially those of developing countries — have been buying the barbarous relic at a record clip. According to the World Gold Council, central banks have purchased 290 tonnes in the first quarter alone, beating out the prior Q1 record from 2023 and setting CBs on a path to record gold purchases in 2024 that are estimated to easily eclipse 1,000 tonnes.
"Not only is the long-standing trend in central bank gold buying firmly intact, it also continues to be dominated by banks from emerging markets," wrote the Gold Council.
In that regard, Turkey tops the buy list this year with 30 tonnes purchased in the first quarter — lifting its gold reserves to 570 tonnes. China bought 27 tonnes in Q1, making it the 17th consecutive quarter of purchases and also bringing its holdings to 2,262 tonnes. Other notable purchasers include India, Kazakhstan, the Czech Republic, Oman, and Singapore.
The central bank buying spree has solidified gold's status as a reserve asset. According to BofA, gold has now surpassed the euro to become the world's largest reserve asset second only to the US dollar, representing 16% of the reserve pool.
The precious metal’s performance can be attributed to its unique position as a real asset with one of the lowest correlations to stocks across asset classes, making it a safe haven from market swings and inflation.
According to Tom Bruni, head of market research at StockTwits, in a recent episode of Stocks in Translation, "We're seeing gold being used as an uncertainty hedge."
Bruni also emphasized gold's appeal to traders due to its price action. "With gold breaking out above its 2011 highs, it's drawing significant attention from trend followers and technical analysts alike."
Investors looking for deep, liquid gold markets have a robust choice of futures markets, ETFs, and gold miner stocks and ETFs, which tend to be even more volatile than the underlying metal.
"The volatility in gold prices has made it a prime trading vehicle, whether through gold ETFs or mining stocks," said Bruni.
BofA separately highlighted how this latest gold rally isn't like the other advances this century, offering a tantalizing glimpse of future bullish potential.
The bank noted this is the third major gold advance in two decades, yet "households have missed this rally." The first two rallies — from 2004 to 2011, and from 2015 to 2020 — attracted big fund flows into gold ETFs. But over the last year, gold bullion and gold miner ETFs have shed $6.4 billion in assets, according to Bloomberg data and Yahoo Finance calculations.
But if last week's large gold inflows were to gain momentum, that trend could signal a perfect storm of retail, institutional, and central bank gold buying is brewing. Why?
Bruni said it best: “Gold is kind of one of these things that operates on vibes."
<<<
---
>>> Trump is starting to move markets
Yahoo Finance
by Rick Newman
Jul 17, 2024
https://finance.yahoo.com/news/trump-is-starting-to-move-markets-203051423.html
Donald Trump has had a surprisingly solid summer, raising the odds, for now, that he’ll win a second presidential term.
That's why financial markets are reawakening to the “Trump trade,” with varying implications for stocks, bonds, cryptocurrencies, interest rates, and inflation.
Trump’s upturn began with the June 27 presidential debate in which President Joe Biden’s bumbling raised more questions than ever about the incumbent’s age and stamina. Ever since, a swelling chorus of Democrats has been calling for Biden to withdraw and let Vice President Kamala Harris or another younger Democrat take on Trump.
Trump survived a July 13 assassination attempt and appointed the first millennial to a national ticket by choosing J.D. Vance as his vice presidential running mate. Former Trump challengers lined up behind the former president at the Republican convention, an uncharacteristic show of unity in an otherwise fractious party.
Trump himself seems to be steering to the center, perhaps in a bid to win swing voters and mainstream business backers. In an interview with Bloomberg Businessweek, he sought to assuage Wall Street fears of chaos in a second term. He said he’d probably keep Fed Chair Jerome Powell in the job through the end of his term in 2026, “especially if I thought he was doing the right thing.” That means lowering interest rates, but only during a Trump presidency—not in the fall, when it might help Biden.
Trump tried to assure investors there would be no unusual inflation caused by new tariffs without explaining how he’d work that magic. He even suggested he’d consider JPMorgan Chase CEO Jamie Dimon for Treasury Secretary, which would put a Wall Street eminence in the job, should Dimon accept.
Election scenarios are now nudging earnings and inflation off the radar screen as top investor concerns. “‘Animal spirits’ have taken on a whole new head of steam because of this growing feeling that Donald Trump is going to emerge victorious,” economist David Rosenberg of Rosenberg Research wrote to clients on July 17. “No wonder investors are foaming at the mouth.”
Betting markets — which can be spurious — now give Trump 66% odds of winning, according to the RealClearPolitics average. That suggests rising odds of not just a Trump win, but of a Republican sweep in which the GOP wins both houses of Congress too, giving it unified control of the government.
That would open the door to more corporate tax cuts, which Democrats would likely block if they controlled at least one chamber of Congress. Rosenberg views the GOP sweep scenario as a contributor to the recent investor rotation out of tech stocks into smaller companies deemed value stocks on the theory that more tax cuts would help smaller shares catch up in value to the so-called Magnificent Seven.
Cryptocurrencies have been another beneficiary of Trump’s rising fortunes. Trump, once a crypto skeptic, now pledges to end government efforts to regulate crypto in a bid to capture younger voters smitten with the trend. The value of bitcoin jumped by $1,000 during the first hour after Trump survived the July 13 shooting as buyers bet the failed assassination would boost Trump’s election odds. During the next four days, bitcoin rose by another $4,500. Most other cryptos followed bitcoin higher.
But the outlook for a second Trump presidency isn’t entirely bullish.
For instance, Trump’s plans to boost import tariffs and roust undocumented immigrants out of the country are both inflationary, since they would raise the prices of imported goods on their face and probably also boost labor costs by making workers in some industries more scarce.
That could undo the considerable progress of the last two years, with inflation falling sharply from its 2022 peak, prompting hope that the Federal Reserve could start cutting interest rates as soon as September. Any sign of resurgent inflation — including possible Trump policies — could interfere with that and keep interest rates elevated. Some analysts think interest rates are already higher than they would otherwise be because investors are beginning to price in the effect of inflationary Trump policies.
Investors are also sniffing around for specific sectors or companies that could benefit or suffer under a second Trump term. During the Bloomberg interview, for instance, Trump suggested he wouldn’t aid Taiwan if China attacked, even though Taiwan is a key source of the world’s most advanced semiconductors, which are fundamental to the US economy and to the artificial intelligence boom. Or, he said, Taiwan should pay the United States for its protection.
Tech stocks promptly sold off, leading to a 2.5% one-day drop in the Nasdaq stock index on July 17. “Some of the pressure on big tech stocks today seems to be tied to [Trump] remarks that Taiwan should pay for US defense,” Capital Economics explained on July 17, the day Bloomberg published the Trump interview. Shares of TSMC, Taiwan’s semiconductor giant, fell by 7% on the news.
Though he’s having a good run, Trump is not a shoo-in.
For all of Biden’s woes, he’s less than three points behind Trump in the Cook Political Report polling average.
And an already unpredictable race could get woolier still. Biden could still withdraw, with a less familiar Democrat taking his place. Trump is also due to be sentenced on 34 felony convictions in the New York City fraud trial on Sept. 18, just six weeks before the election. And both candidates are elderly and frail in their way, elevating the odds of a health emergency in the home stretch of the election.
Whatever markets price in today they could price out tomorrow.
<<<
---
>>> The Economic Slowdown Is Finally Here. Welcome It.
The Wall Street Journal
by Aaron Back
5-4-24
https://www.msn.com/en-us/money/markets/the-economic-slowdown-is-finally-here-welcome-it/ar-AA1o8acL?cvid=3bfc0e278d8b4951a298718a752e86b8&ei=71
Evidence is stacking up that the U.S. economy has slowed, led by the formerly red-hot services sector.
Yet overall activity levels remain healthy, and some cooling is welcome news to investors because it opens the door back up to possible rate cuts by the Federal Reserve.
The most obvious indicator was Friday’s employment report, which showed the economy added 175,000 jobs in April, down significantly from 315,000 in March. Particularly notable was the shift to just 5,000 jobs being added in the leisure and hospitality sector compared with 53,000 in March.
This is consistent with earnings reports over the past week from food-services providers including Starbucks and McDonald’s, which both cited growing caution among consumers. Even Kraft Heinz said out-of-home venues such as restaurants are buying less from it.
“The consumer is certainly being very discriminating in how they spend their dollar. And the inflation that has occurred over the last couple of years in the U.S., I think, has certainly created that environment,” McDonald’s Chief Executive Christopher Kempczinski told analysts on a conference call on Tuesday. Starbucks, for its part, reported a 3% decline in North American comparable-store sales in the first quarter which, along with weakness in China, prompted a 15.9% plunge in its stock price.
Also on Friday, a monthly survey by the Institute for Supply Management showed services-sector activity dipping into contractionary territory in April for the first time in 15 months. “The composition of the report was weak, as the employment, new orders, and business activity components all declined,” Goldman Sachs economists said in a note.
Why many Americans still feel bad about the economy despite strong data
Of course, it wasn’t all doom and gloom. True, the unemployment rate ticked up to 3.9% in April from 3.8% the prior month. But, as the Bureau of Labor Statistics noted, this indicator has been in a narrow range of between 3.7% and 3.9% since August of last year. Economists at Bank of America said they see evidence that the great “catch up” in services-sector employment following the pandemic is finally ending. “In our view, this is not an outright negative sign for the economy,” they added.
One very welcome sign from the Fed’s point of view is the continued slowdown in wage growth, with average hourly earnings rising just 3.9% from a year earlier in April, compared with 4.1% in March and 4.3% in February. This suggests pricing pressures could keep subsiding, despite the stubbornly high inflation reports of recent months.
Indeed, Friday’s soft jobs data was enough to get investors thinking about rate cuts again. Stocks rose and bond yields fell on the data, with the S&P 500 gaining 1.3% and yields on benchmark 10-year Treasurys declining by 0.07 percentage point. A move at the Fed’s next meeting in June still seems to be off the table. But the likelihood of a cut by September as implied by the Fed Funds futures market rose to 67.1% late Friday from 61.6% a day earlier, according to CME Group.
If the economic data cooperates between now and then, the possibility of a sneaky July cut could keep creeping higher. Right now, markets put that at just a 36.6% chance, but it is Goldman Sachs’s base case.
A little summer slowdown could be just what this economy needs.
<<<
---
>>> Equal-Weight RSP Boxing Out SPY, Mag 7
ETF.com
by Jeff Benjamin
March 20, 2024
https://finance.yahoo.com/news/equal-weight-rsp-boxing-spy-160000389.html
While riding a handful of stocks that have been driving market indexes can be exhilarating, there is also a time for tapping the brakes, whether to reduce risk or diversify a portfolio.
That’s the premise behind ETFs like the Invesco S&P 500 Equal Weight ETF (RSP), which has risen more than 3% over the past month.
The fact that RSP has been running evenly with the market-capitalization-weighted SPDR S&P 500 ETF Trust (SPY) over the past 30 days has drawn the attention of both savvy market watchers and trigger-happy traders as a sign that the influence of the Magnificent Seven stocks is waning slightly.
“The broadening of market breadth may make financial advisors feel a bit more at ease,” said Nicholas Codola, senior portfolio manager at Omaha, Neb.-based Orion.
“Generally, it’s a sign of a stronger, more resilient market when the majority of the stock market returns are not explained by seven-to-10 names,” he added. “We’ve all heard the old adage that diversification is the only free lunch.”
RSP's Implications for Long-Term Investors
Indexes weighted to the largest and fastest growing companies have historically had a huge upside, as has been evident recently.
Last year, SPY’s 26.2% gain was nearly double the 13.7% gain by RSP. And so far this year that trend has continued with SPY up 8.2% and RSP up 4.5%.
But longer term, where most retail class investors live, RSP has been a powerful force.
Since its inception, 21 years ago, RSP has produced a cumulative return of 542%, which compares to a 458% cumulative return over the same period for SPY, according to Morningstar.
On an annualized basis, according to Invesco, RSP's index, the S&P 500 Equal Weight Index, has generated an 11.5% gain since inception, which compares to a 10.8% annualized return for the S&P 500 Index over the same period.
“Advisors can tell clients that if and when the rest of the 490-plus companies in the index begin to catch up, investors will be more exposed to those gains with an equal weight approach,” said Jeff Schwartz, president of Markov Processes International in Summit, N.J.
“Additionally, equal-weighted indices have an important quirk where the average or mean return of the portfolio is slightly above the median,” he added. “This means that the investor should expect to have a return that is slightly better than half the companies in the portfolio.”
Paul Schatz, president of Heritage Capital in Woodbridge, Conn., sees equal-weight indexes as the start of a longer-term story.
“The Mag Seven has struggled lately and at the same time the New York Stock Exchange advance-decline line has been chugging higher, which is expressed in RSP finally trying to hold its own against SPY,” he said.
Chuck Etzweiler, senior vice president of research at the advisory firm Nepsis in Minneapolis, said equal-weighted and factor-based indexes are part of the nuance that can make indexed investing “quite confusing to even the most intuitive investor.”
“Equally weighted indexes not only provide a greater level of diversification as they lower concentration risk, (but) their methodology allows for a greater number of companies down the market-cap stream to be included, such as mid and small cap companies,” he said. “And anytime an equal-weight process begins to outperform it usually shows a broadening out of companies achieving higher price appreciation and suggests a near term healthy economic environment."
<<<
---
You are the second person in a week to mention DHR to me. Perhaps the Universe is giving me a stock tip.
Of those listed, WTS appealed to me the most.
Key Competitors
 ELECTRONIC EQUIPMENT: CONTROL AND FILTER
 Name	Consolidated Market Cap
 - Current (MM) 	Sales
 - Last Twelve Months (MM) 	EBITDA
 Margin - Last Twelve Months 	Enterprise Value/EBITDA
 - FY1
 Pentair Plc	12,094.92	4,123	20.1	15.1
 Xylem Inc	27,106.78	6,752	15.1	21.5
 Mueller Water Products, Inc.	2,140.57	1,276	14.9	12.9
 Idex Corp	15,994.8	3,296	29.8	18.8
 A O Smith Corp	11,559.34	3,801	10.7	14.3
 Zurn Elkay Water Solutions Corp	5,123.83	1,514	17.7	16.2
 Flowserve Corporation	5,239.16	4,194	8.3	12.4
 Watts Water Technologies, Inc.	6,598.92	2,011	19.1	16.3
Derf, >> PHO <<
For the water sector, I've had PHO and FIW in the past, though currently only have a group of water related stocks -- BMI, ROP, TTEK, WTS, and Danaher (DHR) also has some exposure to water. See link to Water Sector below.
The expense ratios are fairly high with FIW and PHO, but they do provide the diversification aspect. Fwiw, I've been leery of the water utility and electric utility stocks in general for a few years. On the water side, their aging infrastructure is going to need major improvements going forward, which will be expensive. On the electric utility side, they are facing lots of issues going forward. After the big PG&E lawsuits, I figure it's best to use an ETF, though I'm not currently in the sector.
Water Sector -
https://investorshub.advfn.com/Water-Investment-Ideas-31293
---
Instead of gold, look to $PHO. Moving up at about the same pace, and which commodity is more important?
I don't know who this guy is, but can't disagree with his points. Although one day not far in the future, I can see Treasuries being downgraded.
>>> Rickards’ Five 2024 Forecasts
BY JAMES RICKARDS
DECEMBER 12, 2023
https://dailyreckoning.com/rickards-five-2024-forecasts/
Rickards’ Five 2024 Forecasts
I have five forecasts for 2024 to help keep you ahead of the curve in positioning your investment portfolio.
My overall forecast is that 2024 will be more tumultuous and shocking than 2023. That may seem hard to credit.
With two major wars going on, an indicted former president and a demented current president, how can 2024 be more challenging than 2023?
Rest assured; it will be. I explain why below.
An Election of Dire Consequences
It’s a cliche to write that the next presidential election will be the “most important in our lifetimes.” Yet in 2024 that cliche will actually be true.
The divide between the two parties is probably greater than at any time in U.S. political history since the Civil War. The choice could not be more stark and the stakes could not be higher.
That’s why this election is so important.
First off, I don’t think that Joe Biden will be the Democratic nominee for president.
Biden’s problem is not just his age, but the fact that he actually is mentally and physically impaired. He’s simply not fit to be president, and everyone knows it even if Democratic operatives and media sycophants don’t want to mention it. But who will replace Biden?
The most likely replacements are Gavin Newsom, J.B. Pritzker, Gretchen Whitmer and Jennifer Granholm. All four were or are state governors. They’re all about the same ideologically; take your pick. Forget Kamala Harris; she’s simply too much of a liability.
The Republican Side
On the Republican side, there’s not a lot to say. Trump will be the nominee; no one can recall a non-incumbent with such a large lead in the polls.
He’s leading the pack by 55 points or more and is now even running ahead of Joe Biden in recent polls.
Meanwhile, Trump’s facing over 90 felony charges in four separate indictments in two state courts and two federal courts. Criminal indictments only increase Trump’s popularity because they are clearly motivated by politics.
A criminal conviction (likely in my view) will further solidify Trump’s base because of the blatant jury shopping, targeted prosecutions and absence of due process that Trump has had to endure.
The biggest curveball is that Trump may actually be behind bars on Election Day. That’s OK, there is no legal or other prohibition on electing an incarcerated convicted felon as president. Third-world, yes. Illegal, no.
This brings us to the third-party situation. There are many third-party candidates who will likely divide the Democrats. These include RFK Jr., Cornel West and Jill Stein. I wouldn’t rule out Sen. Joe Manchin from West Virginia, who’s announced he won’t seek reelection. If he runs for president, he’s likely to go on the No Labels party line.
I believe these third-party candidates will divide the Democratic vote, which I also believe will favor Trump. So that’s my first forecast — Trump will win back the presidency in 2024.
U.S., China and a Global Recession
Chinese economic growth is now in the low single digits (about 4% per year). That’s down from the double-digit growth of the 1994–2008 period.
China has had two failed “reopenings” (one after COVID in 2022, and one as the result of “stimulus” in 2023) and seems headed for a third. China gets a small boost from loose fiscal and monetary policy that rapidly fades because there is no real stimulus possible when a country is as heavily indebted as China.
The U.S. faces its own economic headwinds. The Federal Reserve has raised interest rates to 5.50% from zero in 20 months and reduced its balance sheet by over $1 trillion in the same period, an even tighter monetary policy than the one engineered by Paul Volcker from 1979–1981.
Fiscal policy is also tightening since the COVID handouts and student loan grace periods are over. Fiscal policy will get even tighter now that Republican deficit hawks have the upper hand in the House of Representatives.
The data showing the U.S. is heading to a recession is abundant. In fact, the U.S. may already be in recession. The indicators include inverted yield curves, rising commercial real estate defaults, declining industrial production, declining job creation and falling bank loans.
That leads me to my next forecast: China, the U.S. and Japan will all fall into recession in the coming months. The EU is already in recession. A rare global recession will be the result in 2024.
Ukraine
Russia is winning the war decisively. The West and Ukraine have shown no willingness to negotiate and there’s no reason for the Russians to negotiate because they’re winning.
With that in mind, it seems likely that Joe Biden will double-down on his losing bet.
The Russians don’t expect the war to be over until 2025. That gives Biden time to deliver F-16 fighter jets and more money and to help Ukraine with its flying drones and sea-drones that can attack Russian vessels and the Kerch Bridge.
Russia will certainly match that kind of escalation by shooting down the F-16s, increasing its cruise missile attacks on Ukrainian cities and destroying Ukraine’s energy infrastructure so that the country will lack electricity and heat this winter.
My forecast is that Russia will not de-escalate because they’re winning. Biden will not de-escalate because he’s senile, is surrounded by warmongers and has no reverse gear.
I do not expect escalation to the point of nuclear weapons, but the probability of that outcome is uncomfortably high and should not be dismissed.
Next is part two of this forecast…
Israel and Gaza
The Israeli-Hamas War has its own risks of escalation. As of now, fighting is mostly limited to northern Gaza adjacent to the Israeli border. Yet Israel faces an enemy 10 times more powerful than Hamas in the form of Hezbollah, which is located in Lebanon on Israel’s northern border, and which is heavily subsidized by Iran in terms of money, weapons and intelligence.
Hezbollah has launched some missile attacks from Lebanon on Israel’s northern border, but those have not been extensive. In addition to Hezbollah, the Houthi rebels in Yemen are firing missiles into Israel.
The Houthis are a direct Iranian proxy intended to threaten Saudi Arabia, but are equally capable of threatening Israel. If Hezbollah and Houthi attacks on Israel escalate, Israel will not limit their response to those two groups. They are likely to launch attacks on Iran itself, going to the root of the problem. At that point, Iran may fire missiles at Israel and close the Straits of Hormuz.
For now, the tensions have been reduced slightly. But if the escalation scenarios play out even in part, expect oil prices to go to $150 per barrel or higher. That will put the U.S. and Western Europe in a recession worse than 2008 and the earlier oil shock of 1974.
Don’t rule it out.
Banking Crisis Stage 2
In less than two months from early March to early May 2023, we saw the failures of Silvergate Bank, Silicon Valley Bank, Signature Bank, Credit Suisse and First Republic.
In response, the FDIC stepped in with the mother of all bailouts. Going forward, the issue is: Once you’ve guaranteed every deposit and agreed to finance every bond at par value, what’s left in your bag of tricks? What can you do in the next crisis that you haven’t already done — except nationalize the banks?
Investors are relaxed because they believe the banking crisis is over. That’s a huge mistake. History shows that major financial crises unfold in stages and have a quiet period between the initial stage and the critical stage.
My next forecast is that a bigger and more acute Stage 2 of the banking crisis is coming after the quiet period that has prevailed since June. This new crisis will be focused on about 20 banks with $200–900 billion in assets — the so-called midsized regional banks that are not too big to fail.
Crises of this sort can feed on themselves and cause losses that go far beyond the particular banks that may be most vulnerable. A new global financial crisis could be the result.
Markets
All of the above predictions involve turmoil either in domestic U.S. politics, international macroeconomics, ongoing wars or a potential financial meltdown starting in the banking system. With that as background, my market predictions are fairly straightforward:
2024 will be a difficult year for stocks. The market could decline at least 30% on a recession alone, and as much as 50% if either the Ukraine or Israeli war escalates, or a global financial crisis emerges.
The major sectors that will outperform even in a falling market are energy, defense, agriculture and mining.
2024 should be an excellent year for U.S. government securities. All maturities will produce decent yields and capital gains as interest rates decline going into a recession.
Basic commodities such as copper, iron ore, coal, non-precious metals and agricultural produce will generally decline as the recession unfolds. Gold and silver should perform well based on declining interest rates and a flight to quality.
Energy will be volatile. It will tend to go down based on economic weakness, but occasionally rally on geopolitical fears.
The investment choices are clear. It will be a bad year for stocks, a good year for Treasury securities and a down year for commodities, except for energy and gold. The winners will be Treasuries, gold, oil and King Dollar.
Put on your crash helmets for a wild ride in the coming year.
<<<
---
>>> Goldman says ‘shine is returning' for gold as investors ramp up bets on rate cuts
by Jenni Reid
CNBC
November 27, 2023
https://www.nbcchicago.com/news/business/money-report/goldman-says-shine-is-returning-for-gold-as-investors-ramp-up-bets-on-rate-cuts/3287739/
...Analysts at Goldman Sachs said in a note Sunday on the metals outlook for 2024 that gold's "shine is returning."
"The potential upside in gold prices will be closely tied to U.S. real rates and dollar moves, but we also expect persistent strong consumer demand from China and India, alongside central bank buying to offset downward pressures from upside growth surprises and rate cut repricing," they said.
Bank of America analysts, meanwhile, said in a Sunday note that the commodities team's base case was for gold to appreciate from the second quarter of 2024 as "real rates are pushed lower by the Fed cutting."
<<<
---
>>> Signs the S&P 500 rally is broadening beyond megacaps feed investor hopes
Reuters
by Lewis Krauskopf
November 24, 2023
https://finance.yahoo.com/news/broadening-u-stock-rally-feeds-110424040.html
NEW YORK (Reuters) — Signs the U.S. stock market rally is broadening from the so-called Magnificent Seven of mega-cap growth and technology companies is bolstering investor hopes for a rally through year-end.
Equities have risen sharply, with the S&P 500 up over 8% in November, on the cusp of a new high for 2023, fueled by falling Treasury yields and cooling inflation readings that could signal the end of Federal Reserve rate hikes. Yields fall when Treasury prices rise, and the lower returns on guaranteed fixed-income investments make stocks more appealing.
While some big investors are skeptical the rally amounts to more than just a year-end rebound, recent signs of market strength include gains in areas that have lagged this year.
In one encouraging sign, about 55% of the S&P 500 were trading above their 200-day moving averages as of Monday. That level breached 50% last week for the first time in nearly two months, according to LPL Financial.
Breadth is finally starting to broaden out to levels more commensurate with bull markets," said Adam Turnquist, chief technical strategist at LPL Financial. "This has been one of the keys to calling this recovery sustainable."
Equal weight
Among other signs, the equal-weight S&P 500 — a proxy for the average stock in the index — rose 3.24% last week. That was substantially more than the 2.24% rise for the market-cap weighted S&P 500, the biggest percentage point outperformance for the equal-weight index in nearly five months.
Even so, the S&P 500 equal-weight index has gained just 3% in 2023, against an 18% rise for the overall S&P 500 — on pace for the biggest such annual percentage-point gap in 25 years.
Much of that underperformance is due to the outsized gain in the Magnificent Seven stocks, which collectively hold a 28% weight in the S&P 500 index: Apple, Microsoft, Alphabet, Amazon, Nvdia, Meta Plaforms and Tesla. Overall, the group of stocks makes up nearly 50% of the weighting of the Nasdaq 100, which is up nearly 47% for the year to date.
Struggling small-cap and bank stocks have perked up, especially after last week's U.S. consumer price data for October was unchanged from the prior month.
The small-cap Russell 2000 is up 5.5% since the CPI data with the S&P 500 banks index up 6.5%, versus a 3% rise for the S&P 500. Year-to-date, the Russell 2000 is up 2%, while the S&P 500 banks index has fallen over 6%.
Mona Mahajan, senior investment strategist at Edward Jones, said an environment that could be conducive for a broadening of the rally "is starting to take shape."
“This environment where rates are cooling, inflation is moderating and the Fed is on the sidelines, that is typically a good backdrop for risk assets,” Mahajan said.
“Typically when rates start to move lower, you get valuation expansion and the areas that we could see some more meaningful valuation expansion is outside of large-cap tech,” she said.
The equal-weight S&P 500 is trading at a 5% discount to its 10-year average forward price-to-earnings ratio, according to Edward Jones.
Case against
Still, there are reasons to think that the market rally is not on the verge of a sustained broadening.
Investors will get further readings of consumer confidence and inflation next week. Stronger than expected data could spur a selloff in Treasuries, sending yields higher.
At the same time, the sharp rally in stocks for the week ended Nov. 17 was accompanied by high demand for upside call options, particularly in parts of the market that have underperformed this year, such as the small-caps focused iShares Russell 2000 ETF.
Some of that has already started to unwind. "We saw a huge pickup in expectations for IWM, but now those seem to have stabilized," said Steve Sosnick, chief strategist at Interactive Brokers.
The recent surge, which has pushed the broad S&P 500 up approximately 10% over the last three weeks, may not last as investors prepare to close their books for the year, said Jason Draho, head of asset allocation Americas at UBS Global Wealth Management.
"A lot of good news is already priced in and investors may be reluctant to chase the rally," he said.
<<<
---
>>> Prime Time for Bonds
In our 2024 outlook, bonds emerge as a standout asset class, offering strong prospects, resilience, diversification, and attractive valuations compared with equities.
Asset Allocation Outlook
BY ERIN BROWNE, GERALDINE SUNDSTROM, EMMANUEL S. SHAREF
NOVEMBER 14, 2023
https://www.pimco.com/en-us/insights/economic-and-market-commentary/global-markets/asset-allocation-outlook/prime-time-for-bonds/
The global economic outlook along with market valuations and asset class fundamentals all lead us to favor fixed income. Relative to equities, we believe bonds have rarely been as attractive as they appear today. After a turbulent couple of years of high inflation and rising rates that challenged portfolios, investors may see a return to more conventional behavior in both stock and bond markets in 2024 – even as growth is hindered in many regions.
In this environment, bonds appear poised to perform well, while equities could see lower (though still positive) risk-adjusted returns in a generally overvalued market. Risks still surround the macro and geopolitical outlook, so portfolio flexibility remains key.
Macro outlook suggests a return of the inverse stock/bond relationship
In PIMCO’s recent Cyclical Outlook, “Post Peak,” we shared our baseline outlook for a slowdown in developed markets (DM) growth and, in some regions, the potential for contraction next year as fiscal support ends and monetary policy takes effect (after its typical lag). Our business cycle model indicates a 77% probability that the U.S. is currently in the “late cycle” phase and signals around a 50% probability of a U.S. recession within one year.
Growth has likely peaked, but so has inflation, in our view. As price levels get closer to central bank targets in 2024, bonds and equities should resume their more typical inverse relationship (i.e., negative correlation) – meaning bonds tend to do well when equities struggle, and vice versa. The macro forecast favors bonds in this trade-off: U.S. Treasuries historically have tended to provide attractive risk-adjusted returns in such a "post-peak" environment, while equities have been more challenged.
Valuations and current levels may strongly favor fixed income
Although not always a perfect indicator, the starting levels of bond yields or equity multiples historically have tended to signal future returns. Figure 1 shows that today’s yield levels in high-quality bonds on average have been followed by long-term outperformance (typically an attractive 5%–7.5% over the subsequent five years), while today’s level of the cyclically adjusted price/earnings (CAPE) ratio has tended to be associated with long-term equity underperformance. Additionally, bonds have historically provided these return levels more consistently than equities – see the tighter (more “normal”) distribution of the return outcomes. It’s a compelling statement for fixed income.
Delving deeper into historical data, we find that in the past century there have been only a handful of instances when U.S. equities have been more expensive relative to bonds – such as during the Great Depression and the dot-com crash. One common way to measure relative valuation for bonds versus equities is the equity risk premium or "ERP" (there are several ways to calculate an ERP, but here we use the inverse of the price/earnings ratio of the S&P 500 minus the 10-year U.S. Treasury yield). The ERP is currently at just over 1%, a low not seen since 2007 (see Figure 2). History suggests equities likely won’t stay this expensive relative to bonds; we believe now may be an optimal time to consider overweighting fixed income in asset allocation portfolios.
Price/earnings (P/E) ratios, are another way that equities, especially in the U.S., are screening rich, in our view – not only relative to bonds, but also in absolute.
Over the past 20 years, S&P 500 valuations have averaged 15.4x NTM (next-twelve-month) P/E. Today, that valuation multiple is significantly higher, at 18.1x NTM P/E. This valuation takes into account an estimated increase of 12% in earnings per share (EPS) over the coming year, an estimate we find unusually high in an economy facing a potential slowdown. If we assume, hypothetically, a more normal level of 7% EPS growth in 2024, then the S&P today would be trading even richer at 18.6x NTM P/E, while if we are more conservative and assume 0% EPS growth in 2024, then today’s valuation would rise to 19.2x NTM P/E. Such an extreme level, in our view, would likely drive multiple contraction (when share prices fall even when earnings are flat) if flat EPS came to pass.
We note, however, a crucial differentiation within the equity market: If we exclude the seven largest technology companies from this calculation, then the remainder of the S&P trades close to the long-term average at 15.6x NTM P/E. This differentiation could present compelling opportunities for alpha generation through active management.
Overall, we feel that robust forward earnings expectations might face disappointment in a slowing economy, which, coupled with elevated valuations in substantial parts of the markets, warrants a cautious neutral stance on equities, favoring quality and relative value opportunities.
Equity fundamentals support cautious stance
Our models suggest equity investors appear more optimistic on the economy than corporate credit investors. We use ERP, EPS, and CDX (Credit Default Swap Index) spreads to estimate recession probability implied by different asset classes, calculated by comparing today’s levels with typical recessionary environments. The S&P 500 (via ERP and EPS spreads) is currently reflecting a 14% chance of a recession, which is significantly lower than the estimates implied by high yield credit at 42% (via CDX).
Such optimism is underscored by consensus earnings and sales estimates for the S&P 500, which anticipate a reacceleration rather than a slowdown (see Figure 3). We’re concerned about a potential disconnect between our macro outlook and these equity earnings estimates and valuations. It reinforces our caution on the asset class.
Managing risks to the macro baseline
We recognize risks to our outlook for slowing growth and inflation. Perhaps the resilient U.S. economy will stave off recession, but also drive overheating growth and accelerating inflation that prompts into much more restrictive monetary policy. There’s also potential for a hard landing, where growth and inflation fall quickly.
In light of these risk scenarios, we believe it’s prudent to include hedges and to build optionality – and managing volatility, especially in equities, is attractively inexpensive (see Figure 4). For example, one strategy we favor is a “reverse seagull” – a put spread financed by selling a call option.
Investment themes amid elevated uncertainty
Within multi-asset portfolios, we believe the case for fixed income is compelling, but we look across a wide range of investment opportunities. We are positioned for a range of macroeconomic and market outcomes, and we emphasize diversification, quality, and flexibility.
Duration: high quality opportunities
At today’s starting yields we would favor fixed income on a standalone basis; the comparison with equity valuations simply strengthens our view. Fixed income offers potential for attractive returns and can help cushion portfolios in a downturn. Given macro uncertainties, we actively manage and diversify our duration positions with an eye toward high quality and resilient yields.
Medium-term U.S. duration is particularly appealing. We also see attractive opportunities in Australia, Canada, the U.K., and Europe. The first two tend to be more rate-sensitive as a large portion of homeowners have a floating mortgage rate, while the latter two could be closer to recession than the U.S. given recent macro data. Central bank policies in these regions could diverge, and we will monitor the bond holdings on their balance sheets for potential impact on rates and related positions.
In emerging markets, we hold a duration overweight in countries with high credit quality, high real rates, and attractive valuations and return potential. Brazil and Mexico, where the disinflation process is further along and real rates are distinctly high, stand out to us.
By contrast, we are underweight duration in Japan, where monetary policy may tighten notably as inflation heats up.
While we recognize cash rates today are more attractive than they’ve been in a long time, we favor moving out along the maturity spectrum in an effort to lock in yields and anchor portfolios over the medium term. If history is a guide, duration has significant potential to outperform cash especially at this stage of the monetary policy cycle.
Equities: relative value is key
Although the S&P 500 appears expensive in aggregate, we see potential for differentiation and opportunities for thematic trades. From a macro perspective, there’s also the potential for economic resilience (such as a strong U.S. consumer) to support equity markets more than we currently forecast. Accordingly, we are neutral in equities within multi-asset portfolios. An active approach can help target potential winners.
In uncertain times, we prefer to invest in quality stocks. Historically, the quality factor has offered an attractive option for the late phase of a business cycle (see Figure 5). Within our overall neutral position, we are overweight U.S. equities (S&P 500), which present more quality characteristics than those in other regions, especially emerging markets. Also, European growth could be more challenged than in the U.S., so we are underweight the local equity market despite its more attractive valuation.
We also favor subsectors supported by fiscal measures that may benefit from long-cycle projects and strong secular tailwinds. The U.S. Inflation Reduction Act, for example, supports many clean energy sectors (hydrogen, solar, wind) with meaningful tax credits.
On the short side of an equity allocation, we focus on rate-sensitive industries, particularly consumer cyclical sectors such as homebuilders. Autos could also suffer from higher-for-longer interest rates; as supply normalizes, we think demand will struggle to keep up.
Credit and securitized assets
In the credit space we favor resilience, with an emphasis on relative value opportunities. We remain cautious on corporate credit, though an active focus on individual sectors can help mitigate risks in a downturn. We are underweight lower-quality, floating-rate corporate credit, such as bank loans and certain private assets, which remain the most susceptible to high rates and are already showing signs of strain.
In contrast to corporate credit, attractive spreads can be found in mortgages and securitized bonds. We have a high allocation to U.S. agency mortgage-backed securities (MBS), which are high quality, liquid, and trading at very attractive valuations – see Figure 6. We also see value in senior positions of certain securitized assets such as collateralized loan obligations (CLOs) and collateralized mortgage obligations (CMOs).
Key takeaway
Looking across asset classes, we believe bonds stand out for their strong prospects in the baseline macro outlook as well as for their resilience, diversification, and especially valuation. Given the risks to an expensive equity market, the case for an allocation to high quality fixed income is compelling.
<<<
---
Here's how the energy sector fared in the 2008 and 2020 crashes, vrs the S+P 500, gold, silver, and the miners (approx figures) -
2008 -
XLE - (60%)
CXV - (47%)
SPY - (52%)
GLD - (32%)
GDX - (73%)
SLV - (60%)
2020 -
XLE - (63%)
CVX - (57%)
SPY - (35%)
GLD - (14%)
GDX - (50%)
SLV - (39%)
SIL - (53%)
---
>>> How to Invest in FAANG 2.0
Money
3-17-23
https://www.bottomlineinc.com/money/investing/how-to-invest-in-faang-2-0
Low-cost exchange-traded funds (ETFs) are the best way to gain broad exposure to the market niches poised to outperform in the coming years…
Fuel/Oil & Gas:
Vanguard Energy ETF (VDE) holds stocks of about 110 companies involved in the exploration and production of energy products such as oil, natural gas and coal. The fund, which had a recent 3% yield, is dominated by giant global oil-and-gas companies such as Chevron and Exxon Mobil. Cost: 0.10%. Year-to-date performance: 3.15%.* Important: ETFs that track oil prices directly can be very volatile and are suitable only for traders.
Agriculture:
iShares MSCI Global Agriculture Producers ETF (VEGI). With about 155 stocks, this portfolio provides exposure to companies that produce fertilizers and agricultural chemicals, farm machinery, and packaged foods and meats. Top holdings: Deere & Co…fertilizer producer Nutrien. Cost: 0.39%. Performance: 1.63%.
Aerospace/Defense:
SPDR S&P Aerospace & Defense ETF (XAR) spreads its assets across about 30 aerospace and defense manufacturers. While it includes giants Boeing and Lockheed Martin, 75% of the portfolio is in mid- and small-cap names such as National Presto Industries, which manufactures ammunition for the US government. Cost: 0.35%. Performance: 7.12%.
Nuclear/Renewables:
VanEck Uranium+Nuclear Energy ETF (NLR) tracks foreign and domestic stocks and offers a 1.9% recent yield. The fund’s 25 companies include nuclear plants, engineering firms that build and maintain nuclear power facilities and uranium-mining companies. Top holdings: Dominion Energy…CEZ, which operates nuclear power plants in the Czech Republic. Cost: 0.60%. Performance: 4.44%.
Gold/Metals:
SPDR Gold Mini-Shares Trust (GLDM) is best for investors who want direct exposure to the price of gold, which typically is used as a hedge against high inflation and geopolitical uncertainty. The actual gold backing the shares is kept in vaults in London and audited regularly. Cost: 0.10%. Performance: 2.6%.
SPDR S&P Metals & Mining ETF (XME) is best for aggressive investors who want broad exposure to companies that mine major minerals and metals. The equal-weighted portfolio holds about 35 US-based gold, steel, copper and aluminum producers including Royal Gold and Reliance Steel & Aluminum Co. Cost: 0.35%. Performance: 10.88%.
<<<
---
Summarizing Jim Rickards' recommendations -
Gold - 10%
Inflation hedges and for wealth preservation -
Cash
Land
Energy
Agriculture
US Treasury Notes
Real Estate
Gold Mining Sector
Defense Sector
Avoid -
Stocks
Corporate Bonds
Commercial Real Estate
https://investorshub.advfn.com/boards/read_msg.aspx?message_id=172668844
---
VanEck Inflation Allocation ETF (RAAX) -
RAAX Holdings
Top 9 Holdings (67.64% of Total Assets)
PIT
VanEck Commodity Strategy ETF
21.14%
IGF
iShares Global Infrastructure ETF
12.91%
GDX
VanEck Gold Miners ETF
6.69%
EINC
VanEck Energy Income ETF
5.52%
XLE
Energy Select Sector SPDR Fund
5.43%
VNQ
Vanguard Real Estate Index Fund
4.82%
XOP
SPDR S&P Oil & Gas Exploration & Production ETF
4.35%
MOO
VanEck Agribusiness ETF
3.42%
NURE
Nuveen Short-Term REIT ETF
3.38%
<<<
---
>>> Peter Lynch’s 6 Categories Tool» To Find The Best Stocks To Buy
With instructions on when to sell them too
https://medium.datadriveninvestor.com/peter-lynchs-6-categories-tool-to-find-the-best-stocks-to-buy-abb5e0466db4
Peter Lynch is one of the greatest value investors out there, and thanks to his Magellan Fund he has beaten the market for over 20 years. Not only that, but he also wrote an amazing investing book called “One Up On Wall Street”.
In this amazing book, he talks about investing and the stock market, focusing in particular on how to find investment ideas and good stocks to buy. Because, as he puts it,
“Investing without research is like playing stud poker and never looking at the cards”
One of the main points of the novel is that according to him, the best way to approach stocks is to categorize them into six predefined categories — a breakdown should give an investor a clear indication of whether something is a buy, sell, hold, or stay-away-stock. So, here are the different categories and how to use them.
Slow Growers: Just Avoid Them
Starting off with a bold claim, Peter Lynch believes that companies with very slow revenue growth are straight-up stocks to avoid.
Not only that, but he says everyone should also avoid those stocks that might end up in this category soon (even if they’re currently not). This is because it never looks nice for investors when this happens, just like Netflix and IBM show.
Here are a few things that slow growers tend to have in common:
Generous and regular dividends, plus buybacks. Most slow-growth stocks usually have a relatively high payout ratio, meaning they pay out most of the profits since they don’t have any growth to reinvest for.
Flat earnings, and sometimes a flat stock chart too. Slow-growth stocks tend to have flat earnings over the long term, and sometimes even a stock chart. Not always though, since stocks can still move with multiple expansions and contractions (the P/E might go from 10 to 20 and vice versa).
Strangely high payout ratio and mid-to-high debt: if the company has a high payout ratio with growing dividends and flat profits, the risk is that they might pay out in dividends more than they can afford. Just look at McDonald’s, using debt to sustain the dividend.
Finally, keep in mind that all of this is not to say that slow growers can’t move or make their investors money. They can indeed, but it’s so rare that Lynch believes you should avoid them altogether.
Stalwart Stocks: Good Recession Protection
The second category is that of stalwarts stocks. These are businesses that grow nicely, but not enough to be considered a growth stock essentially (8-12% stable earnings growth is what defines them for Lynch). And the second necessary condition is that these companies are not in a sector that completely melts down during a recession. Think pharmaceuticals, for example.
With these stocks, to make good profits you need to time your purchase well over the cycle. In fact, Lynch says that if a stalwart goes up 50–100% in two or three years after you buy it, you might want to take profits before it’s too late.
Great examples are Bristol Myers Squibb and 3M. They have been growing their revenue at roughly 8% a year over the decade, and their investors have made decent returns. But these people also didn’t make life-changing money, they just made normal returns. These stocks have only managed to double over a decade, which might seem great but is actually just 7% per year. This is why Lynch tells his readers to buy these companies only when the risk of a recession starts to become real. Because perhaps the most important thing is that over the great recession, these stocks were flat. They remained stable during the years in which everything fell by more than 50%.
This is why they are great for recession protection — because they don’t do wonders in regular times, but they usually pull through better than others during recessions. The key is to find a few well-priced ones that have done well in past recessions.
There are two things to look out for though. These are envy, and mergers and acquisitions: Lynch warns investors to be careful about the management of big stable companies essentially. He says that sometimes CEOs tend to be jealous of fast-growing companies, so they do something stupid and this usually ends up hurting investors (like AT&T with Warner Media).
His Favorite Stocks: The Fast Growers
Next up is Lynch’s favorite category: those companies that grow at 20% or more per year. The author here is referring to the land of the 10-to-40-baggers essentially, the Amazons and Apples of the future. Those stocks that you buy and never even think of selling because they are true long-term compounders.
These stocks do not have to belong to a fast-growing industry, all they have to do is have the room to expand in a slow industry. Starbucks for example was a fast grower in the 1990s and 2000s that has now turned into a stalwart: those that invested in the 1990s ended up with a 20-bagger, whereas those that invested later did still good, but not as good.
I don’t really think there’s much more to say about growth stocks, if not about their price. Lynch says that to make a good return on your money, you should always buy them with a P/E Ratio below the growth rate. A 30% growth allows for a P/E of 30 for example, but nothing more if you want to make real money.
Here’s what else you can expect from fast growers:
If growth slows down, the market doesn’t like it and you end up with a Stalwart or Slow Grower — which is a whole different story.
Look for good balance sheets making substantial profits from the start, not unprofitable ventures.
Figure out when they’ll stop growing and how much to pay for growth. Because at some point, they will for sure stop growing and turn into something else.
Check how much more room for growth there is. 20 to 25 percent is the best growth rate, whereas businesses with 50% growth will probably attract many competitors or not last forever.
Look for companies with proven and profitable expansion in more than one city or country. Possibly those that few have heard of in general.
The Cyclicals
Cyclical stocks are those that follow the economy and/or their respective sector. Automotive, airlines, steel, chemical, travel etc. are all cyclical companies. Ford is the perfect example, as it goes down with every recession and up with every boom (it’s currently down again on the expectation that there will be a recession soon).
As you can see, these stocks are not a bad buy if you do it at the right time. Those who bought in 1989 have had a 10x over a decade, and the same goes for 2009. But those who bought at the wrong time essentially lost their money going into a recession. Timing is really the key here:
These stocks flourish when the economy turns good again, but suffer when there is no economic growth. They usually decline when peak earnings are reached and investors expect the next recession (like today).
50 or 75% drops are normal if you buy at the wrong part of the cycle. And you might have to wait years before seeing another upswing, just like Ford which is down ever since 2013.
Timing is everything — watch for inventories, economic growth, interest rates and also for new market entrants in the sector.
Know your Cyclical and figure out the cycles for each sector you are buying these stocks in. Within the car industry, 3 to 4 bad years are usually followed by 3 to 4 good years, but that’s not a universal thing.
The worse the slump, the better the recovery. But it’s also much easier to predict an upturn than a downturn in the industry.
Turnarounds: Buy Only With Maximum Certainty
Turnaround stocks are companies that are deemed as “doomed” by the market, but that might not actually be as bad as everyone thinks. Therefore, the investment thesis with these ones is that the market is being overly pessimistic.
About these stocks, Lynch essentially says you should watch carefully for the moment in which bankruptcy fears ease and the stock explodes as investors re-evaluate earnings and potential (in other words, to look for a catalyst). The problem with these stocks is that you have to be certain that bankruptcy won’t happen, or else you lose your money.
You also need to understand whether the issues are as big as perceived by the market or not, and also remember what Warren Buffett says about these companies: “turnarounds almost never turn around”.
The Asset Plays
Finally, an asset play is a company sitting on something valuable that the market is overlooking. Or even one with a good asset that hasn’t yet started to print cash, which is therefore not baked into the price of the stock.
This asset can be cash, real estate, inventory, even accounting losses, the number of users, etc. For example, during the 2020 crash, there were REITs trading for cents on the dollar when you looked at the value of the assets.
But of course, it’s not as easy as it may seem:
You must know the asset well
You must have the patience to wait until the value unlocks
You must always look at the debt, just like you look for hidden assets.
Finally, check if the management is making or destroying value for the shareholders. If they’re doing well, the value will probably be recognized soon, if not you might have to wait a while.
How To Use The Above Categories
About using this list, in the book, Lynch says that every investor should always categorize each company and find out what kind of stock it is, then closely follow it and only after a while making investment decisions. Or at least, this is what he did to beat the market for two decades.
Of course, if you’d like to know more about these categories, you should definitely go read the amazing book “One Up On Wall Street”. It’s probably the most undervalued investing book out there.
<<<
---
>>> What Is Asset Allocation and Why Is It Important?
Investopedia
By JAMES CHEN
March 01, 2022
https://www.investopedia.com/terms/a/assetallocation.asp
What Is Asset Allocation?
Asset allocation is an investment strategy that aims to balance risk and reward by apportioning a portfolio's assets according to an individual's goals, risk tolerance, and investment horizon. The three main asset classes—equities, fixed-income, and cash and equivalents—have different levels of risk and return, so each will behave differently over time.
KEY TAKEAWAYS
Asset allocation is an investment strategy that aims to balance risk and reward by apportioning a portfolio's assets according to an individual's goals, risk tolerance, and investment horizon.
The three main asset classes—equities, fixed-income, and cash and equivalents—have different levels of risk and return, so each will behave differently over time.
There is no simple formula that can find the right asset allocation for every individual.
Why Asset Allocation Is Important
There is no simple formula that can find the right asset allocation for every individual. However, the consensus among most financial professionals is that asset allocation is one of the most important decisions that investors make. In other words, the selection of individual securities is secondary to the way that assets are allocated in stocks, bonds, and cash and equivalents, which will be the principal determinants of your investment results.
Strategic Asset Allocation to Rebalance Portfolios
Investors may use different asset allocations for different objectives. Someone who is saving for a new car in the next year, for example, might invest their car savings fund in a very conservative mix of cash, certificates of deposit (CDs), and short-term bonds. An individual who is saving for retirement that may be decades away typically invests the majority of their individual retirement account (IRA) in stocks, since they have a lot of time to ride out the market's short-term fluctuations. Risk tolerance plays a key factor as well. Someone who is uncomfortable investing in stocks may put their money in a more conservative allocation despite a long-term investment horizon.
Age-Based Asset Allocation
In general, stocks are recommended for holding periods of five years or longer. Cash and money market accounts are appropriate for objectives less than a year away. Bonds fall somewhere in between. In the past, financial advisors have recommended subtracting an investor's age from 100 to determine what percentage should be invested in stocks. For example, a 40-year-old would be 60% invested in stocks. Variations of the rule recommend subtracting age from 110 or 120, given that the average life expectancy continues to grow. As individuals approach retirement age, portfolios should generally move to a more conservative asset allocation to help protect assets.
Achieving Asset Allocation Through Life-Cycle Funds
Asset-allocation mutual funds, also known as life-cycle, or target-date, funds, are an attempt to provide investors with portfolio structures that address an investor's age, risk appetite, and investment objectives with an appropriate apportionment of asset classes. However, critics of this approach point out that arriving at a standardized solution for allocating portfolio assets is problematic because individual investors require individual solutions.
The Vanguard Target Retirement 2030 Fund would be an example of a target-date fund.
These funds gradually reduce the risk in their portfolios as they near the target date, cutting riskier stocks and adding safer bonds in order to preserve the nest egg. The Vanguard 2030 fund, set up for people expecting to retire between 2028 and 2032, had a 65% stock/35% bond allocation as of Jan. 31, 2022. As 2030 approaches, the fund will gradually shift to a more conservative mix, reflecting the individual's need for more capital preservation and less risk.
In a Nutshell, What Is Asset Allocation?
Asset allocation is the process of deciding where to put money to work in the market. It aims to balance risk and reward by apportioning a portfolio's assets according to an individual's goals, risk tolerance, and investment horizon. The three main asset classes—equities, fixed-income, and cash and equivalents—have different levels of risk and return, so each will behave differently over time.
Why Is Asset Allocation Important?
Asset allocation is a very important part of creating and balancing your investment portfolio. After all, it is one of the main factors that leads to your overall returns—even more than choosing individual stocks. Establishing an appropriate asset mix of stocks, bonds, cash, and real estate in your portfolio is a dynamic process. As such, the asset mix should reflect your goals at any point in time.
What Is an Asset Allocation Fund?
An asset allocation fund is a fund that provides investors with a diversified portfolio of investments across various asset classes. The asset allocation of the fund can be fixed or variable among a mix of asset classes, meaning that it may be held to fixed percentages of asset classes or allowed to go overweight on some depending on market conditions.
Bottom Line
Most financial professionals will tell you that asset allocation is one of the most important decisions that investors make. In other words, the selection of individual securities is secondary to the way that assets are allocated in stocks, bonds, and cash and equivalents, which will be the principal determinants of your investment results.
<<<
---
>>> The housing market is in free fall with 'no floor in sight,' and prices could crash 20% in the next year, analyst says
Market Insider
by Brian Evans
October 20, 2022
https://finance.yahoo.com/news/housing-market-free-fall-no-175430725.html
US home prices have soared over the last decade, but could soon be on their way down.
The housing market will continue to plummet as there's "no floor in sight," according to Pantheon Macroeconomics.
Chief economist Ian Shepherdson wrote in a note Thursday that home prices could fall as much as 20%.
His warning came after existing home sales dropped for an eighth consecutive month, the longest slump since 2007.
The housing market crash has yet to find a bottom, setting up home prices for a steep dive in the year ahead, according to Pantheon Macroeconomics.
"Eight straight declines in sales and no floor in sight," Pantheon chief economist Ian Shepherdson wrote in a note on Thursday.
He added that the cumulative fall in sales from the peak in January is now 27%, "but this is not the floor." Shepherdson also noted that because mortgage rates have climbed to nearly 7%, which has dampened borrowing demand, the result will be a continued decline in home sales until early 2023.
"By that point, sales will have fallen to the incompressible minimum level, where the only people moving home are those with no choice due to job or family circumstances," he predicted. "Discretionary buyers are disappearing rapidly in the face of the near-400bp increase in rates over the past year."
Meanwhile, prices for existing homes have fallen on a sequential basis for three straight months, sending the median price to $384,800 — the lowest since March.
But with mortgage rates rising, even prospective buyers who are looking to downgrade to a cheaper home would face bigger monthly payments, Shepherdson said, providing more incentive to stay put and constraining supply further.
"But prices have to fall substantially in order to restore equilibrium; the supply curve for housing is not flat, so the plunge in demand will drive prices down," he said. "We expect a drop of 15-to-20% over the next year, in order to restore the pre-Covid price-to-income ratio."
The grim outlook follows similarly stark comments from Wharton professor Jeremy Siegel, who said last week that he expected home prices to see the second-worst decline since World War II amid aggressive Fed rate hikes.
<<<
---
>>> "The Big Secret Wall Street Will Never Tell You About Investing"
Motley Fool
By Mark Blank
Jul 5, 2022
https://www.fool.com/investing/2022/07/05/the-big-secret-wall-street-will-never-tell-you/
'KEY POINTS
* Fund-manager underperformance has more to do with compensation structure than it does with investing skill.
* Institutions are incentivized to pursue short-term gains, which leads to higher taxes.
* Retail investors can beat the market if they stay focused on owning great companies for many years."
"There have been numerous studies that suggest it is impossible to beat the market as an individual investor. Beating the market is described as so difficult, only the best and the brightest minds on Wall Street achieve it.
So, if that's the case, who are individual investors to think they can pull off the miraculous feat of outperforming the larger market? Ludicrous, right?
Perhaps. But before you write off investing in individual stocks, there are a few flaws in that argument you should consider that Wall Street doesn't want you to know.
"Professional incentives
Using professionals as a benchmark for individuals is problematic because institutions have unique incentives that drive their trading behavior. The two main motivators are investor retention and performance-based bonuses.
In other words, fund managers need to generate high returns every year because if they don't, they will likely lose investors and make significantly less money from their year-end bonus.
These are powerful motivators to pursue short-term gains. Meanwhile, individual investors have no pressure to produce immediate results.
High turnover among funds
Ironically, the conclusion investors should arrive at after hearing that over 90% of fund managers underperform the market is that chasing short-term gains is disastrous for long-term performance.
The main reason for this is high turnover. Turnover is the change in positions within a portfolio. At The Motley Fool, we advocate for low turnover, so your companies can compound on themselves over the long run.
In 2019, Morningstar found the average domestic stock fund had a turnover rate of 63%. Put another way, from the beginning of the year to the end, the average fund's holdings were 63% different.
Consequences of high turnover
As fund managers chase near-term results, there are very real long-term consequences for their performance. The two main costs are a lack of compound interest and higher taxes due to short-term capital gains.
Compound earnings is the byproduct of great investing, and it should be the goal of every individual investor. Compounding occurs when you start earning interest on your interest. If you earn a 10% return on a $1,000 investment, you'll earn more dollars each year as the overall portfolio increases. Compounding is hard to notice in the early years, but the results are dramatic after a few decades.
Very few fund managers ever get to enjoy this benefit because of the constant pressure to chase hot stocks. Therein lies a very real advantage for you as a retail investor: you're accountable to no one but yourself, and you face no outside pressure to chase hot stocks for near-term results.
Additionally, high turnover results in short-term capital gains taxes. These are the highest taxes you can pay on the sale of stocks. Unfortunately for fund managers, as they chase short-term results, they are frequently forced to sell stocks , resulting in higher taxes. These taxes eat into the fund's real returns, which is yet another advantage for long-term investors.
"Outperformance lies in patience
When you extrapolate why institutional investors underperform, what you learn is that overtrading is terrible for long-term performance.
Instead of throwing in the towel because the pros can't beat the market, you should conclude that you have a massive advantage by not having clients and year-end bonuses to impact your portfolio decisions.
And finally, whether it's the short-term nature of Wall Street's investing outlook or a general lack of optimism for new and disruptive companies, the financial media's track record of missed winners should only add to your conviction in your ability to...beat the market."
<<<
---
>>> The Bogleheads' Guide to The Three-Fund Portfolio
https://www.bogleheads.org/forum/viewtopic.php?t=88005
After a lifetime of investing since 1950 trying to "beat the market," I am convinced that a simple 3-fund (or ETF) portfolio of Total Stock Market, Total International, and Total Bond Market, properly allocated, is an ideal portfolio for most investors. The advantages are many :
* Avoids wasted time and the possibility of mistakes trying to pick the best of thousands of mutual funds and ETFs.
* No individual stock risk.
* Highest return with lowest risk. Efficient.
* Very diversified with over 20,000 worldwide securities (lower risk).
* Very low expense ratios.
* Very low (hidden) turnover costs.
* Very tax-efficient.
* The many Advantages of Simplicity.
* No adviser risk.
* No fund manager risk.
* No style drift.
* No asset bloat.
* No tracking error to cause abandonment of the strategy.
* No fund overlap.
* No front-running that reduces sub-index returns.
* Automatic rebalancing within each fund.
* Less worry. Never under-performs the market.
* Easy to maintain for the owner, spouse, caregivers and heirs.
* More free time.
* Mathematically certain to outperform most investors.
<<<
---
>>> Stocks could drop 50%, Nouriel Roubini argues. Things will get much worse before they get better.
MarketWatch
by Nouriel Roubini
June 30, 2022
https://www.marketwatch.com/story/stocks-could-drop-50-nouriel-roubini-argues-things-will-get-much-worse-before-they-get-better-11656611983?siteid=bigcharts&dist=bigcharts
The global economy may get the worst of the 1970s and the Great Recession: A stagflationary debt crisis that would confound central banks and fiscal authorities
It’s dangerously naive to believe that the recession will be shallow, brief or benign.
NEW YORK (Project Syndicate)—The global financial and economic outlook for the year ahead has soured rapidly in recent months, with policy makers, investors, and households now asking how much they should revise their expectations, and for how long.
That depends on the answers to six questions.
Six questions
First, will the rise in inflation in most advanced economies be temporary or more persistent? This debate has raged for the past year, but now it is largely settled: “Team Persistent” won, and “Team Transitory”—which previously included most central banks and fiscal authorities—must admit to having been mistaken.
Regardless of whether the recession is mild or severe, history suggests that the equity market has much more room to fall before it bottoms out.
The second question is whether the increase in inflation was driven more by excessive aggregate demand (loose monetary, credit, and fiscal policies) or by stagflationary negative aggregate supply shocks (including the initial COVID-19 lockdowns, supply-chain bottlenecks, a reduced labor supply, the impact of Russia’s war in Ukraine on commodity prices, and China’s “zero-COVID” policy).
While both demand and supply factors were in the mix, it is now widely recognized that supply factors have played an increasingly decisive role. This matters because supply-driven inflation is stagflationary and thus raises the risk of a hard landing (increased unemployment and potentially a recession) when monetary policy is tightened.
Hard or soft landing?
That leads directly to the third question: Will monetary-policy tightening by the Federal Reserve and other major central banks bring a hard or soft landing? Until recently, most central banks and most of Wall Street occupied “Team Soft Landing.” But the consensus has rapidly shifted, with even Fed Chair Jerome Powell recognizing that a recession is possible, and that a soft landing will be “challenging.”
Moreover, a model used by the Federal Reserve Bank of New York shows a high probability of a hard landing, and the Bank of England has expressed similar views. Several prominent Wall Street institutions have now decided that a recession is their baseline scenario (the most likely outcome if all other variables are held constant). In both the United States and Europe, forward-looking indicators of economic activity and business and consumer confidence are heading sharply south.
The fourth question is whether a hard landing would weaken central banks’ hawkish resolve on inflation. If they stop their policy tightening once a hard landing becomes likely, we can expect a persistent rise in inflation and either economic overheating (above-target inflation and above potential growth) or stagflation (above-target inflation and a recession), depending on whether demand shocks or supply shocks are dominant.
Most market analysts seem to think that central banks will remain hawkish, but I am not so sure. I have argued that they will eventually wimp out and accept higher inflation—followed by stagflation—once a hard landing becomes imminent, because they will be worried about the damage of a recession and a debt trap, owing to an excessive buildup of private and public liabilities after years of low interest rates.
Now that a hard landing is becoming a baseline for more analysts, a new (fifth) question is emerging: Will the coming recession be mild and short-lived, or will it be more severe and characterized by deep financial distress?
Dangerously naive view
Most of those who have come late and grudgingly to the hard-landing baseline still contend that any recession will be shallow and brief. They argue that today’s financial imbalances are not as severe as those in the run-up to the 2008 global financial crisis, and that the risk of a recession with a severe debt and financial crisis is therefore low. But this view is dangerously naive.
There is ample reason to believe that the next recession will be marked by a severe stagflationary debt crisis. As a share of global GDP, private and public debt levels are much higher today than in the past, having risen from 200% in 1999 to 350% today (with a particularly sharp increase since the start of the pandemic).
Under these conditions, rapid normalization of monetary policy and rising interest rates will drive highly leveraged zombie households, companies, financial institutions, and governments into bankruptcy and default.
The next crisis will not be like its predecessors. In the 1970s, we had stagflation but no massive debt crises, because debt levels were low. After 2008, we had a debt crisis followed by low inflation or deflation, because the credit crunch had generated a negative demand shock.
Today, we face supply shocks in a context of much higher debt levels, implying that we are heading for a combination of 1970s-style stagflation and 2008-style debt crises—that is, a stagflationary debt crisis.
No help from monetary or fiscal policy
When confronting stagflationary shocks, a central bank must tighten its policy stance even as the economy heads toward a recession. The situation today is thus fundamentally different from the global financial crisis or the early months of the pandemic, when central banks could ease monetary policy aggressively in response to falling aggregate demand and deflationary pressure. The space for fiscal expansion will also be more limited this time. Most of the fiscal ammunition has been used, and public debts are becoming unsustainable.
Moreover, because today’s higher inflation is a global phenomenon, most central banks are tightening at the same time, thereby increasing the probability of a synchronized global recession. This tightening is already having an effect: bubbles are deflating everywhere—including in public and private equity, real estate, housing, meme stocks, crypto, SPACs (special-purpose acquisition companies), bonds, and credit instruments. Real and financial wealth is falling, and debts and debt-servicing ratios are rising.
Equities will drop 50%
That brings us to the final question: Will equity markets rebound from the current bear market (a decline of at least 20% from the last peak), or will they plunge even lower? Most likely, they will plunge lower.
After all, in typical plain-vanilla recessions, U.S. SPX, DJIA, COMP, and global equities GDOW, Z00, SHCOMP, tend to fall by about 35%. But, because the next recession will be both stagflationary and accompanied by a financial crisis, the crash in equity markets could be closer to 50%.
Regardless of whether the recession is mild or severe, history suggests that the equity market has much more room to fall before it bottoms out. In the current context, any rebound—like the one in the last two weeks—should be regarded as a dead-cat bounce, rather than the usual buy-the-dip opportunity.
Though the current global situation confronts us with many questions, there is no real riddle to solve. Things will get much worse before they get better.
<<<
---
>>> Stocks: Two positive signs for investors after the market's brutal first half
Yahoo Finance
by Julie Hyman
July 1, 2022
https://finance.yahoo.com/news/two-positive-signs-for-investors-161507133.html
Investors are looking for signs of relief following the worst start to the year for stocks since 1970, with the S&P 500 falling by more than 20 percent since the beginning of the year.
Most strategists are expecting more declines to come in the short term, though Evercore ISI Senior Managing Director Julian Emanuel sees two reasons for relative optimism.
“We can step back and we can say that in terms of inflation, one thing that we’re focusing on, gasoline prices, have started to decline," the veteran strategist told Yahoo Finance Live (video above). "That’s a positive. The other positive is that yields have started to decline.”
The national average price at the pump has fallen to $4.84 per gallon from over $5 in recent weeks, according to AAA data. And according to Patrick De Haan, GasBuddy’s head of petroleum analysis, and could fall to under $4.80 a gallon by July 4.
Those prices have been one of the biggest contributors to sagging consumer confidence and elevated inflation, so any decline could help.
“Consumers’ grimmer outlook was driven by increasing concerns about inflation, in particular rising gas and food prices,” Lynn Franco, Senior Director of Economic Indicators at The Conference Board, said in a statement accompanying a report showing the lowest reading for consumer expectations since 2013.
Emmanuel added that bond yields are starting to decline after a huge gain this year, dropping by 45 basis points since June 14. Treasury yields generally move inversely to price – and unusually, stock prices and bond prices have been moving in tandem in 2022.
“In a year where a lot of this volatility is being caused by the fact that stocks and bonds, for the first time in 25 years, are consistently moving together, yields declining is a positive,” Emanuel said.
And while the economic outlook is still worrisome – Emanuel said most of his clients are asking about an impending recession – that doesn’t mean that there aren’t opportunities in stocks during the second half of the year. In particular, Emmanuel added, companies that have robust cash positions on their balance sheets are a decent bet in this environment.
“If you throw off cash, you’ve got a margin of safety," he said. "You can return cash to shareholders and you can manage your business better.”
Emanuel, who recently cut his target for the S&P 500 to 4,300 for the end of the year, noted that “odds are it’s going to be better in the second half.”
The 4,300 target for the S&P represents about a 14 percent gain from Thursday’s close.
<<<
---
>>> Inflation will probably fall, but it won't be the Fed's doing: Morning Brief
Yahoo Finance
Emily McCormick
June 28, 2022
https://finance.yahoo.com/news/inflation-will-probably-fall-but-it-wont-be-the-feds-doing-morning-brief-100022403.html
The Federal Reserve is working hard to bring down inflation, raising interest rates at the fastest pace in nearly 30 years.
Recently, some analysts have begun to explore the idea that inflation may moderate in the coming months.
But this decline likely won't be due to the efforts of the Powell Fed.
It “increasingly looks like markets mistook [the] 'bullwhip' effect of supply chain (including food) for secular inflation,” Tom Lee, Fundstrat’s head of research, wrote in a note Sunday.
The “bullwhip effect” describes, roughly, the tendency of businesses to over- or under-estimate the amount of inventory they will need relative to consumer demand, resulting in volatility in orders across the supply chain.
In the case of the past year, retailers over-estimated, leading them to broadly over-order from wholesalers, who then in turn over-ordered from their own suppliers – leading, in aggregate, to a major mismatch between consumers’ actual demand and inventories on hand. The bloated inventory levels at Walmart (WMT), Target (TGT), Gaps (GPS) and other retailers this past earnings season served as recent examples of how this effect played out in real-time.
“I do not believe companies want to permanently carry higher inventory. It is expensive … and introduces huge balance sheet risk,” Lee said. “Thus, companies will want to trim inventories when supply visibility improves. The logical implication, for me, is prices will come down.”
This all may sound suspiciously similar to the Fed’s now-debunked argument from last year that inflation would prove "transitory.” And the data even earlier this year have disappointed economists looking for a peak, with May’s 8.6% CPI print unexpectedly taking out what many had expected would be the peak this year in March.
Already, however, prices for metals, commodities and energy – all raw materials in the supply chain – have fallen sharply from recent peaks. West Texas intermediate crude oil futures (CL=F) are on track to post their first monthly decline since November, and cotton futures (CT=F) have plummeted from a more than decade-high logged in May.
And this decline may come just in time.
As Jim Reid, Deutsche Bank’s head of credit strategy and thematic research, illustrates below, the Fed began raising interest rates with inflation significantly higher than seen during prior hiking cycle.
Over the past 70 years, the first rate hike has come, at the median, when the Consumer Price Index (CPI) reached 2.5%. The first rate hike this year, by contrast, occurred in March when CPI soared at an 8.5% annual clip.
The only rate-hiking cycle that resembles the current environment began in August 1980, when the Fed started raising interest rates with inflation running north of 12%.
“Where this cycle is so different … is that the first hike occurred very, very late in the inflation cycle,” Reid said. “My base case remains that the Fed will find it very difficult to ease policy notably given that inflation is going to be harder to dislodge.”
And although another ramp-up in the rate of inflation in June may be in the cards, this does not preclude a deceleration in inflation later this year.
“June is bound to see another big jump in the headline index, thanks to the surge in gas prices in recent weeks, but the abrupt drop in wholesale prices … means that retail gas prices are set to fall quite sharply over the next few weeks,” Ian Shepherdson, chief economist at Pantheon Macroeconomics, wrote in a note.
“At the same time, core pressures are starting to moderate, thanks mostly to slower wage growth at the margin, so we would be surprised to see the core CPI keep rising at the recent 0.6% per month pace.”
Shepherdson said he expects headline CPI to rise by 1.0% in June but then average an only 0.3% rise over the next few months thereafter. And this could then give the Fed leeway to slow its pace of tightening by the end of this year, he argued, even as it refuses to budge from its hawkish rhetoric for now.
“Policymakers know very well that the path of inflation, especially the core rate, over the remainder of this year mostly is baked-in and is impervious to their interest rate decisions. Monetary policy works with long lags,” Shepherdson said.
“But the Fed has constituencies other than monetary economists; they have to calm the inflation fears of the public, the markets, and politicians. That means they have no choice but to sound as tough as possible, because part of their job is to rein-in inflation expectations.”
Adding: “If inflation then falls faster than their base-case forecast—and the market’s—then so much the better.”
<<<
---
>>> Worsening business activity data is 'setting the scene' for an economic contraction this year
Yahoo Finance
by Myles Udland and Emily McCormick
June 23, 2022
https://finance.yahoo.com/news/worsening-business-activity-data-pmi-152945354.html
The U.S. economy is showing more signs of deterioration.
The preliminary S&P Global Composite Purchasing Managers' Index (PMI) for June came in at 51.2, the weakest level since January, when Omicron-related disruptions were still weighing on growth. This was also the second-weakest reading for the index since the height of the pandemic in mid-2020. Consensus economists were looking for a print of 53.0, according to Bloomberg data, following May's final reading of 53.6. Levels above 50.0 indicate expansion in the economy.
"The pace of U.S. economic growth has slowed sharply in June, with deteriorating forward-looking indicators setting the scene for an economic contraction in the third quarter," Chris Williamson, chief business economist at S&P Global Market Intelligence, said Thursday. "The survey data are consistent with the economy expanding at an annualized rate of less than 1% in June, with the goods-producing sector already in decline and the vast service sector slowing sharply."
Beneath the headline figure, both the services and manufacturing indexes registered month-on-month declines. The services PMI weakened to a five-month low of 51.6 in early June from May's 53.4 as a deceleration in new orders and rising costs stifled growth in the sector.
The manufacturing PMI registered an even larger decline, falling to 52.4 from May's 57.0 as the manufacturing output index slid into contractionary territory of 49.6 for 24-month low. Worse declines were only registered twice before in the 15-year history of the data — early on during the pandemic lockdowns of 2020, and at the height of the 2008 global financial crisis.
“Businesses have become much more concerned about the outlook as a result of the rising cost of living and drop in demand, as well as the increasingly aggressive interest rate path outlined by the Federal Reserve and the concomitant deterioration in broader financial conditions," Williamson added. "Business confidence is now at a level which would typically herald an economic downturn, adding to the risk of recession."
The report follows comments from key Federal Reserve officials, who have increasingly begun to acknowledge the risk of a recession as they work to address inflation by raising interest rates and tightening financial conditions this year. Fed Chair Jerome Powell told the Senate Banking Committee on Wednesday that it was "certainly a possibility" that the U.S. economy could slip into a recession, while underscoring it was not the central bank's "intended outcome."
Others struck a similar tone.
“We could have a couple of negative quarters" of economic growth, Philadelphia Fed President Patrick Harker told Yahoo Finance in an interview Wednesday.
The definition of a “recession” is commonly referred to by investors as two back-to-back quarters of negative economic growth. The first quarter of 2022 already saw a real GDP contraction of 1.5% on an annualized basis. An initial reading on second quarter growth is due at the end of July.
The National Bureau of Economic Research, which is in charge of “dating” recessions, clarifies that they look beyond real GDP figures when declaring a recession. The NBER looks at real income, employment, among other economic variables.
Amid the souring in some economic data and the Fed's ongoing rate hiking path, a number of Wall Street banks have also warned that risks of a recession have mounted. Deutsche Bank, which has maintained for months that the U.S. economy is headed for a recession, said it now expects the formal downturn to begin in the third quarter of 2023. Goldman Sachs economists now see a 30% probability that the U.S. economy enters a recession over the next year, up from a 15% risk seen previously.
<<<
---
>>> This idiot-proof portfolio has beaten traditional stocks and bonds over 50 years
MarketWatch
May 14, 2022
By Brett Arends
https://www.marketwatch.com/story/this-idiot-proof-portfolio-has-beaten-traditional-stocks-and-bonds-over-50-years-11652463679?siteid=yhoof2
Do you have the right portfolio for your retirement savings?
When it comes to long-term investing, the biggest issue — by far — is overall asset allocation: How much to stocks, sectors, assets and so on. Picking individual securities within those asset classes — individual stocks or bonds, for example — usually turns out to be much less important.
The most widely followed benchmark is the so-called “balanced” portfolio known as 60/40: 60% stocks, 40% bonds. It is the model followed by pension fund managers the world over. The theory is that the stocks will produce superior long-term growth, while the bonds will provide some stability.
And it’s done pretty well overall — especially in the era since the early 1980s, as inflation and interest rates have fallen, and stocks and bonds have both risen. But what about in other periods?
Doug Ramsey, the chief investment officer at Leuthold Group in Minneapolis, also tracks something different. As mentioned here before, he calls it the “All Asset, No Authority” portfolio and it consists of equal investments in 7 asset classes: U.S. large-company stocks, namely the S&P 500 index SPX, +2.39%, U.S. small-company stocks, via the Russell 2000 index RUT, +3.06%, stocks of developed international markets in Europe and Asia, via the so-called EAFE index, 10-year Treasury notes, gold, commodities, and U.S. real-estate investment trusts.
Anyone who wanted to follow this portfolio — this is not a recommendation, merely an observation — could do so easily using 7 low-cost exchange-traded funds, such as the SPDR S&P 500 SPY, +2.39%, iShares Russell 2000 IWM, +3.17%, Vanguard FTSE Developed Markets VEA, +2.81%, iShares 7-10 Year Treasury Bond IEF, -0.52%, SPDR Gold Shares GLD, -0.81%, Invesco DB Commodity Index Tracking Fund DBC, +1.37% and Vanguard Real Estate VNQ, +2.64%.
It’s a clever idea. It tries to get outside our current era, on the grounds that the future may not look like the last 40 years. And it is idiot-proof, because it takes all control out of the hands of individuals. It allocates equal amounts to all the major asset classes, while making a huge bet on none.
Ramsey has looked at how this portfolio has done (or would have done) going back to the early 1970s. You can see the results above, compared to a 60/40 portfolio of 60% invested in S&P 500 and 40% invested in 10-year U.S. Treasury notes. Both portfolios are rebalanced at the end of each year. Note: The numbers have been adjusted for inflation, showing “real” returns in constant U.S. dollars.
Several things leap out.
First, All Asset No Authority has produced higher total returns over the past half-century than 60/40. (It has trailed the much more volatile S&P 500, but by much less than you might think.)
Second, that outperformance (as you would imagine) was really due to the 1970s, when gold, commodities and real estate did well.
Third, even though AANA did better in the 1970s, it has still done pretty well even during the era of rising stocks and bonds. Since 1982 it’s earned a real return averaging 5.7% a year, compared to just under 7% for the 60/40 portfolio (and just over 8% for the S&P 500).
But fourth, and probably most interestingly: The AANA portfolio has been lower risk, at least measured in a certain way. Instead of looking at standard deviation of returns, I’ve looked at 10-year real returns because that’s what matters to real people. If I own a portfolio, how much better off will I be 10 years from now — and, crucially, what is the likelihood that I will actually end up losing ground?
Maybe that’s too gloomy a way of looking at things. Maybe it’s a reflection of the current selloff.
Nonetheless, I’ve found that in almost half a century AANA has never produced a negative real return once over 10 years. The worst performance was 2.6% a year above inflation — that was in the 10 years to 2016. That still generated a 30% rise in your purchasing power over the course of a decade. Meanwhile a 60/40 fund (and a 100% allocation to the S&P 500) has over a couple of 10-year periods actually lost you money in real terms, and on a few other occasions made you less than 1% a year above inflation. (Not counting fees and taxes, of course.)
Ramsey points out that over that entire period, this All Asset No Authority portfolio has generated average annual returns less than half a percentage point less than that of the S&P 500, with barely half the annual volatility. By my calculations the average returns have beaten a 60/40 portfolio by more than half a percentage point a year.
As usual, this is not a recommendation, merely information. Make of it what you will.
<<<
---
>>> 'Everything is halted': Shanghai shutdowns are worsening shortages
Washington Post
by Abha Bhattarai
April 26, 2022
https://www.yahoo.com/news/everything-halted-shanghai-shutdowns-worsening-103816660.html
Thousands of air fryers are stuck in factories, warehouses and ports in central China, where shutdowns have stalled millions of dollars worth of inventory for Yedi Houseware, a family-run business in Los Angeles.
How quickly those backlogged appliances make it to the United States could have wide-ranging implications across the U.S. economy, as domestic manufacturers and retailers brace for another round of disruptions from recent covid-related shutdowns in Shanghai, China's largest city. White House officials are paying close attention to the disruptions to monitor the potential impact on the U.S. economy.
"Things are getting crazy again," said Bobby Djavaheri, the company's president. "Everything is halted. There are closures this very minute that are adding to the supply chain nightmare we've been experiencing for two years."
Other executives are dealing with similar scrambles as the situation in China appears to change every day, sweeping up many different sectors.
Widespread covid outbreaks in China have bought entire cities to a standstill and hobbled manufacturing and shipping hubs throughout the country. An estimated 373 million people - or about one-quarter of China's population - have been in covid-related lockdowns in recent weeks because of what is known as the country's zero covid policy, according to economists at Nomura Holdings. There are also fears that new lockdowns could soon take hold in the capital city, Beijing, escalating the threat to the global economic recovery.
Anxiety over new disruptions has already caused the Chinese stock market to fall sharply, weighing on U.S. stock indexes as well.
And there are signs things could only get worse. Continuing lockdowns in Shanghai - a major hub for America's semiconductor and electronics supply chains - has set up automakers, electronics companies and consumer goods firms for months of delays and higher costs.
The challenges come on top of more than two years of global shipping disruptions that some had hoped would ease this year.
Tech giants and major automakers rely heavily on Shanghai-based suppliers and ports. Roughly one-half of Apple's top suppliers, for example, are based in or near the city, according to an analysis by Nikkei Asia. (Apple did not immediately respond to requests for comment.) Meanwhile, Volkswagen's chief executive said this month that the automaker is "temporarily unable to meet high customer demand" because of ongoing lockdowns. The company, which had to stop production at certain facilities for more than a month for covid-related reasons, says it is gradually resuming production now.
"If Shanghai continues being unable to resume work and production, from May, all tech and industrial players involving the Shanghai supply chain will completely shut down, especially the auto industry!" Richard Yu, head of consumer and auto business at Chinese tech giant Huawei, was reported to have said on the social media platform WeChat.
The delays and closures are adding to costs and could pose another threat to long-term inflation, which is already at a 40-year high. Yedi Housewares, for example, raised prices on all of its products, including air fryers, electric pressure cookers and bread makers, by 10 percent in January.
Costs have continued to climb since then, in part because of the war in Ukraine. The price of plastic, a major component in air fryers, is up about 5 percent this year, Djavaheri said. The company is also paying more for transportation, since it's begun moving goods by truck from Shanghai to ports in Ningbo, three hours away, in hopes of putting them on a ship there.
White House officials are closely monitoring the situation in Shanghai, with the State Department providing frequent updates on the potential impacts. New economic data from March shows Chinese exports of good rose by 15 percent relative to last year, but this data does not reflect the impact of the Shanghai lockdown that began at the end of last month, according to a White House official, who spoke on the condition of anonymity to provide internal administration assessments.
The administration is already seeing "significant impacts" to airports critical to air cargo shipments and links in the supply chain such as factories and warehouses, the person said. Despite the closure of the port, White House officials are seeing alternate ports ratcheting up their work, relieving some of the expected pressure for consumers.
Mark Beneke, who co-owns a used car dealership in Fresno, Calif., says it's become increasing difficult to secure parts for Asian-made vehicles like Hyundai Sonatas and Kia Optimas since the Shanghai lockdown began a month ago.
Used car prices are already up 35 percent from a year ago, according to the Bureau of Labor Statistics, and Beneke says he expects them to climb even higher in coming weeks as a result of new shortages and delays.
"We were expecting prices to start coming down this summer, but it looks like they're going to keep going up," he said.
In some cases, though, retailers are better positioned to weather the latest challenges than they were a year ago. Many have stashed away extra inventory in U.S. warehouses and stores to guard against supply chain delays. Roughly 90 percent of goods at grocery and drugstores are in stock, according to data analytics firm Information Resources. And the number of import containers sitting on the docks for more than nine days at the ports of Los Angeles and Long Beach has been cut by one-half since October.
At the same time, consumer demand for many goods - including clothing, toys and furniture - appears to be waning as people spend more on travel, dining out and other experiences that they largely avoided earlier in the pandemic.
"The demand just isn't there anymore," said Isaac Larian, chief executive of MGA Entertainment, the toy giant behind popular brands like Little Tikes and L.O.L. Surprise. "Sales are slowing down. Families are saying, 'I'll take my kids to Disney this summer instead of buying more toys."
The shipping time for toys from China to U.S. stores has ballooned from 21 days to 159 days during the pandemic, he said.
"All holiday toys have to ship out of China by the beginning of August, but that is not going to happen," Larian said. "The factories are having a tough time getting labor, prices are going up, China keeps closing provinces. The big picture is bad, worse than last year."
Back in Los Angeles, Djavaheri of Yedi Houseware, says he's just beginning to recover from closures in southern China earlier this year, where his company makes electric pressure cookers. The brand - which has been featured in Oprah's Favorite Things list for three years in a row - is still struggling to make enough products to meet demand.
"To be honest, I don't even want to be in China but it's the only option," Djavaheri said. "If there was a way to make air fryers or electric pressure cookers in America, I would've been there yesterday. Instead we're dealing with hurdle after hurdle: Inflation, logistics, it's a constant nightmare."
<<<
------------------
>>> Muni Bonds Are Down So Much That They’re Buys Again
Barron's
By Randall W. Forsyth
April 16, 2022
https://www.barrons.com/articles/buy-municipal-bonds-51650063058?siteid=yhoof2
A funny thing happened in the past week, as news emerged of inflation hitting a four-decade high. A few strategists started looking a bit more positively on bonds, or at least somewhat less negatively.
March consumer prices were 8.5% above their level a year earlier, while producer prices were up 11.2%. As bad as those numbers were, they essentially confirmed what we knew already and suggested that the pace of price rises might be close to a peak.
But while the major stock averages were down for the second straight week (and the third for the Dow industrials), the price slide in the bond market slowed. The yield on the benchmark 10-year Treasury (which moves inversely to its price) rose by 0.095 of a percentage point, to 2.808%, bringing the two-week increase to 0.434 of a point and the year-to-date rise to 1.312 points.
The sharp run-up in bond yields has changed the calculus between equities and fixed income.
Truist Advisory Services this past week downgraded its recommended stock exposure to neutral, its lowest level since 2010, owing to the drop in the equity risk premium (the extra return from stocks over bonds). The move reflected a downshift in global economic growth, stickier inflation trends, and ongoing geopolitical risks, as well as Federal Reserve policy tightening, which may mean that growth could suffer if inflation isn’t tamed, a research note said.
While such tactical shifts are important to institutional portfolios looking to dampen near-term risks, the absolute yields on government bonds remain relatively unenticing, even though the real yield on the 10-year Treasury inflation-protected security was approaching zero after having been below negative 1% in early March.
Much more attractive are long-maturity investment-grade municipal bonds, with tax-exempt yields hitting 4%, the highest since late 2016, according to John R. Mousseau, CEO and director of fixed income at Cumberland Advisors.
The muni market is going through one of its typical bouts of feast and now famine, he writes in a client note. Tax-free bond funds saw $4.8 billion exit in the week ended on April 6, the most since the financial market meltdown in March 2020, according to Investment Company Institute data reported by the Bond Buyer. Muni fund managers sell what they can to meet redemptions, overwhelming Wall Street dealers with supply, he adds.
The result is a buyer’s market, with those 4% tax-exempt yields equivalent to 6.35% on a taxable security, he writes. Indeed, 20-year double-A munis yield roughly the same as their fully taxable corporate counterparts in the low-4% range.
What Cumberland is trying to buy are bonds issued last year at 2% to 3%, which have suffered a “breathtaking backoff in prices,” Mousseau adds in an email.
Bonds originally offered around par now may be selling around 70 to 75 cents on the dollar with a yield to maturity of 4.15% to 4.25% for 30-year paper. That price plunge isn’t related to credit problems, just higher yields, he emphasizes. To be sure, there are tax complications with discount munis, but they still yield 0.15% to 0.20% more than new-issue par bonds, even after taxes.
If you’re looking to add bond ballast to a balanced taxable portfolio, munis might be your best bet.
<<<
________________________
>>> Investors turn to defensive stocks as economic concerns grow
Reuters
Fri, April 15, 2022
By Lewis Krauskopf
https://finance.yahoo.com/news/investors-turn-defensive-stocks-economic-100519203.html
NEW YORK (Reuters) - U.S. stock investors worried geopolitical uncertainty and the Federal Reserve's fight against inflation could dent economic growth are heading for defensive sectors they believe can better weather turbulent times and tend to offer strong dividends.
The healthcare, utilities, consumer staples and real estate sectors have posted gains so far in April even as the broader market has fallen, continuing a trend that has seen them outperform the S&P 500 this year.
Their appeal has been particularly strong in recent months, as investors worry the Fed will choke the U.S. economy as it aggressively tightens policy to combat surging consumer prices. Though growth is strong now, several big Wall Street banks have raised concerns the Fed’s aggressive measures could bring about a recession as they work their way through the economy.
The U.S. Treasury market sent an alarming signal last month, when short-term yields on some maturities of government bonds rose above longer term ones. The phenomenon, known as an inverted yield curve, has preceded past recessions. Meanwhile, fallout from the war in Ukraine remains a concern for investors.
"The reason (defensive stocks) are outperforming is people see all these headwinds to growth," said Walter Todd, chief investment officer at Greenwood Capital.
While the S&P 500 has fallen nearly 8% in 2022, utilities have gained over 6%, staples has climbed 2.5%, healthcare has dipped 1.7% and real estate has declined 6%.
With earnings season kicking into high gear next week, defensive sector companies reporting include healthcare giant Johnson & Johnson and staples stalwart Procter & Gamble. Investors will also watch earnings from streaming giant Netflix and electric-car maker Tesla.
Signs that U.S. corporate earnings are set to be stronger than expected this year could bolster the case for other market sectors including banks, travel firms or other companies that benefit from a growing economy, or high-growth and technology names that led stocks higher for most of the last decade.
Defensive stocks have proven their worth in the past. DataTrek Research found that the healthcare, utilities and staples sectors outperformed the S&P 500 by as much as 15 to 20 percentage points during periods of economic uncertainty over the past 20 years.
Lauren Goodwin, economist and portfolio strategist at New York Life Investments, said the firm's multi-asset team has in recent weeks shifted its portfolios toward staples, healthcare and utilities shares and pared back exposure to financials and industrials.
Expectations of a more hawkish Fed have “increased the risk that this economic cycle is shorter and accelerated our allocation shift toward these defensive equity sectors," Goodwin said.
The Fed – which raised rates by 25 basis points last month – has signaled it is ready to employ meatier rate hikes and speedily unwind its nearly $9 trillion balance sheet to bring down inflation. Investors have also been unnerved by geopolitical uncertainty stemming from the war in Ukraine, which has squeezed commodity prices higher and helped boost inflation.
With prices surging, defensive stocks also may be "inflationary hedges to some extent," said Mona Mahajan, senior investment strategist at Edward Jones.
"When you think about where there is a bit more pricing power, consumers will have to purchase their staples, their healthcare, probably pay their utility bills, regardless of the price increases," Mahajan said.
Not all investors are pessimistic about the economic outlook, and many believe momentum could quickly shift to other area of the market if it appears the economy will remain strong.
Art Hogan, chief market strategist at National Securities, puts the chance of a recession this year at 35%, “but it’s not our base case.”
“As concerns over an impending recession recede, I think the sponsorship of the defensives will recede with that,” Hogan said.
The surge in defensive shares has driven up their valuations. The utilities sector is trading at 21.9 times forward earnings estimates, its highest level on record and well above its five-year average price-to-earnings ratio of 18.3 times, according to Refinitiv Datastream. The staples sector is trading at about an 11% premium to its five-year average forward P/E, while healthcare is at a 5% premium.
“It would not surprise me at all to see some mean reversion on this trade for a period of time," Todd said. "But as long as these concerns around growth persist, then you could continue to see those areas relatively outperform.”
<<<
>>> Russia just made a case for owning gold — and nobody noticed
MarketWatch
April 2, 2022
By Brett Arends
https://www.marketwatch.com/story/russia-just-made-a-case-for-owning-goldand-nobody-noticed-11648415950?siteid=yhoof2
It makes sense to have at least some gold in a long-term investment portfolio
Putin wants gold, not dollars.
Here’s a strong argument for adding some gold bullion to your retirement portfolio right now, alongside those stocks and bonds.
And it comes courtesy of Pavel Zavalny, the head of the Russian parliament.
Zavalny spoke last week on the subject of all the economic and financial sanctions being levied against Russia following the invasion of Ukraine. Most of the coverage of his remarks implied that Russia might respond to the sanctions by switching from U.S. dollars to “bitcoin” BTCUSD, -0.07% BTCUSD, -0.07% for international trade.
But a look at the transcript being reported shows something quite different. Zavalny added bitcoin only at the end of a long list of other currency and trading options, almost as an afterthought.
(As you might expect. Not only is bitcoin new, ridiculously volatile, widely open to manipulation, and a massive drain on energy in a world facing an energy crisis, but it also offers no guarantee of privacy. Western authorities can track all transactions on the blockchain, with the result, for example, that they can even get back bitcoin ransoms.)
Much more interesting was Zavalny’s main point, even though it has been mostly overlooked. If other countries want to buy oil, gas, other resources or anything else from Russia, he said, “let them pay either in hard currency, and this is gold for us, or pay as it is convenient for us, this is the national currency.”
In other words, Russia is happy to accept your national currency — yuan, lira, ringgits or whatever — or rubles, or “hard currency,” and for them that no longer means U.S. dollars, it means gold.
“The dollar ceases to be a means of payment for us, it has lost all interest for us,” Zavalny added, calling the greenback no better than “candy wrappers.”
What will this mean? Maybe nothing. Or maybe a lot. Especially if Russia’s lead is followed by countries such as China, India and others — countries that may not welcome Washington’s ability to control the global financial system through its monopoly power over the global reserve currency.
And this adds to the argument for having at least some gold in a long-term investment portfolio. No, not because it is guaranteed to rise, or maybe even likely to. But because it might — and might do so while everything else went nowhere, or went down. Like in a geopolitical or financial crisis where the non-western bloc decides to challenge America’s financial hegemony and ”king dollar.”
China already has the world’s biggest economy, by some measures. More than half the world’s population live in Asia. Why should they continue to pay America for the privilege of trading among themselves?
So far this year gold and commodities are up, while pretty much everything else, including large stocks, small stocks, REITs and government bonds, is in the red.
I am gold agnostic. I am neither a fanatical believer or a denier. I have some in my portfolio. But there is no question it has its uses. Gold is completely private. It is completely independent of the SWIFT or any other banking system. And despite the rise of cryptocurrencies, it remains the most widespread and viable global currency that is not controlled by any individual country.
Ten years ago we pointed out here that Vladimir Putin and the Russian central bank were buying a lot of gold bullion.
Recent events show they should have bought a lot more. When Putin’s army invaded Ukraine last month, Western powers froze the foreign exchange reserves that the Russian government held in their banks’ vaults. That amounted to about $300 billion worth, or nearly half of all of Russia’s reserves, according to finance minister Anton Siluanov.
That has left the country’s government struggling for money and the ruble has collapsed. Putin’s foreign minister called the move “thievery” and admitted it was unexpected.
But had Russia converted all its foreign exchange reserves to gold over the years, and relocated them to vaults underneath the Kremlin, it would have had no such worries. Despite some laughable suggestions that the West might somehow sanction “Russian gold,” there is no way of tracing the identity, nationality, or provenance of bullion. American Eagle coins or South African Krugerrands can be melted down into bars. Gold is gold. And someone will always take it. Carry a Krugerrand to any major city anywhere in the world and you will find people willing and eager to take it off your hands in return for any other currency you want.
Yes, as Warren Buffett has pointed out, gold is a completely unproductive asset, unlike stocks, bonds, farmland or whatever. But so is a suitcase full of yen, dollars, euros, pounds or yuan.
According to data from the World Gold Council, the gold industry’s trade association, the world’s stock of gold is worth about $13 trillion at current prices, which is about 16 times as much as the notional value of all the world’s bitcoin. Heaven knows what would happen to the value — and the price — if it began to rival the U.S. dollar again as a reserve currency. The world’s dollars are valued at somewhere around $37 trillion.
Meanwhile, daily trading volume of gold at current prices is about $160 billion, which dwarfs the bitcoin market, even in today’s boom, by somewhere between a factor of 6 and a factor of 40, depending on whose numbers you believe.
An intriguing case for owning some gold comes courtesy of Doug Ramsey, chief investment officer at Leuthold Group. His firm monitors, as a form of intellectual exercise, what it calls the “All Asset No Authority” portfolio. It’s what they reckon you’d own if you were a portfolio manager who was told effectively to own all the liquid asset classes and make no other conscious decisions. That AANA portfolio, Leuthold argues, would consist of equal weights in 7 different assets:
1) S&P 500 index of large U.S. stocks,
2) Russell 2000 index RUT, of small U.S. stocks,
3) An index such as MSCI EAFE EFA, of large stocks in
developed international markets (meaning Europe, Japan and Australasia),
4) 10 Year U.S. Government bonds
5) Real-estate investment Trusts
6) An index of commodities…and
7) Gold.
Anyone could replicate this easily by owning 7 low-cost exchange-traded funds:
1) SPDR S&P 500 ETF SPY
2) The Vanguard Russell 2000 ETF VTWO
3) The SPDR Portfolio Developed World ex-US ETF SPDW
4) The iShares 7-10 Year Treasury Bond IEF
5) Schwab U.S. REIT ETF SCHH
6) The iShares Bloomberg Roll Select Commodity Strategy ETF CMDY
7) Aberdeen Standard Physical Gold ETF SGOL
The argument is that one or two of these assets are always doing well at some point or another. The portfolio, Ramsey argues, minimizes the risk of disaster because there has never been a time when they all failed. (Even in the Great Depression bonds and gold did well.)
(I love the elegant theory behind AANA, though I wonder about its heavy U.S. focus. But what do I know?)
Such investment luminaries as Jeremy Grantham and hedge fund titan Ray Dalio have also made the case for owning some gold in a portfolio.
Another friend, a widely followed investment guru and strategist, told me kept his retirement portfolio for years allocated to just two assets. Two-thirds of the money was in a global stock portfolio, and the other third was in gold, he said. It was a protection against international policy errors and crisis. Gold, he argued, was the one thing that would do well when everything else failed. (Incidentally he later cashed out his portfolio to buy a property.)
In other words, the argument isn’t that we want to own all gold or mostly gold or even a lot of gold, but that we want at least to own some gold, simply for diversification.
(About a decade ago I was at a conference of financial journalists. One of the speakers mocked gold, and said “everybody” was already invested in gold. I interrupted him and asked for a show of hands in the room from anyone who owned any gold at all in their retirement portfolio. In a large room just two of us — the other, a former editor of MarketWatch — raised our hands.)
The case for gold is often undermined by its own die-hard supporters, known as ”gold bugs.” They sometimes ascribe quasi-religious status to the metal or claim it is the only “true” currency. Actually, anything can be a currency, and if we end up in Cormac McCarthy’s “The Road” I’ll bet we find that food, toilet paper, painkillers and drugs all become widely accepted. (Bitcoin? I have my doubts.)
But gold deniers go to the other extreme and argue it cannot be a currency or a sound investment at all. The current crisis shows just how wrong that is.
<<<
Portfolio Rebalancing - >>> How To Invest Like A Legend
Forbes
by Randy Brown
June 2, 2021
https://www.forbes.com/sites/randybrown/2021/06/02/how-to-invest-like-a-legend/?sh=1690c6c83dd2
In the league of elite investors, few can rival the late David Swensen, former head of the Yale Endowment. As Chief Investment Officer of this multi-billion dollar fund, he delivered top performance over multiple decades, and his investing style influenced an entire industry. Swensen’s innovative and rigorous approach to asset allocation and expanding its range was revered, with others rushing to replicate it. This approach became known as the “Yale Model”, and revolutionized endowment investing.
Over the span of three decades Swensen took the Yale Endowment from $1.3 billion to over $30 billion, averaging over 12% annual returns along the way. His investment principles were built on the power of diversification to mitigate risk, something he became enchanted with when he first studied under James Tobin, the Nobel Prize winning economist.
So, what lessons can we learn from the legendary investor?
The Power of Long Term Views
From the onset, Swensen understood that an endowment’s long life significantly enhanced its ability to search for yield beyond public markets. By eliminating the constraints of a reactive, short-term approach, Swensen delved into private assets, which afford greater access to management, and insight into their strategies as well as value drivers. He realized that private assets that required rigorous research and have no active exchange, offered a premium to patient investors that could forgo the need for immediate liquidity. When he started at Yale, the endowment had 75% of its investments in public equities. Seeing higher yields in alternative assets such as private equity, hedge funds, real estate and natural resources – he aggressively shifted the asset mix.
Superior results followed and his track record outpaced peers. Today, public equities are only 16% of Yale’s portfolio with the bulk of its holdings in private equity, hedge funds and real assets.
Why This Approach Works
Swensen believed every investor has three tools: asset allocation, security selection and market timing. To him, the most critical driver was asset allocation, and the discipline to stick to an optimal asset mix was key to achieving long-term goals.
However, if left unattended, any portfolio asset mix drifts over time. If certain asset classes significantly outperform others, they will dominate the mix. Similarly as assets underperform, they lose prominence.
Accommodating these drifts requires periodic rebalancing to restore the long-term mix, which in turn requires selling some winners and buying some laggards. This all seems counterintuitive, but the essential thesis behind periodic rebalancing is that when major asset classes rise or fall more disproportionally than others, it becomes more likely they will start to revert to their long term average rather than continue to over or under shoot.
Therefore, rebalancing helps capture these price dislocations, which should improve portfolio performance over the long-term. Essentially, it encapsulates the advice to “buy low, sell high”. While there are no guarantees, Swensen stood behind this disciplined approach and was confident it could deliver value over time.
Contrarian Investment Decisions Challenge Stakeholders
Portfolio rebalancing is a contrarian strategy. In particular, when the world appears to be falling apart and markets are getting battered, it takes grit to step in and buy what’s on sale, even at deep discounts.
The nerve of even sophisticated investors and their investment teams get tested when markets implode. Swensen’s first test came in October 1987, when he was only two years into the Yale job. The U.S. stock market crashed, dropping more than 20% in a single day.
During fire sales like this, investors should be giddy to snap up bargains. However, significant market drops are terrifying and many investors become paralyzed, rushing to cash out. While Swensen rebalanced by loading up on discounted stocks, his investment committee grew queasy.
Though he was following the approved investment mandate, the committee worried about the firestorm of criticism he would face if he got it wrong and ended up in a prolonged downturn. Eventually Yale’s President weighed in and Swensen prevailed. His swift action delivered significant value as the market rebounded and ignited a long bull run.
Indeed, Yale’s fearful soul searching is natural in deep downturns. For example, Norges Bank Investment Management, the world’s largest sovereign wealth fund that manages Norway’s oil revenues, paralleled the same scene in 2008.
Back then, its investment head Yngve Slyngstad, had just taken over as the great financial crisis hit and global stocks were getting hammered. Slyngstad called for rebalancing to take advantage of the deep selloff.
As fear griped his oversight committee, the finance minister finally stepped in and supported the move to buy the equivalent of 0.5% of the total global equity market. As with Yale, this set up the fund for a long bull market. Today, Norges is one of the largest holders of equities in the world.
Adopting the Yale Model
All in all, the critical lesson in Swensen’s approach is that having a well laid out rebalancing plan is the best preparation for marshalling the courage to act, particularly when terrified. The push to restore asset mix targets as prices drop will help ease some of the paralysis that will naturally grip most investors.
Markets can turn quickly, so it’s easy to be caught off guard absent a plan. As Jeremy Grantham, another investment icon, once wrote: “Be aware that the market does not turn when it sees light at the end of the tunnel. It turns when all looks black, but just a subtle shade less black than the day before.”
Swensen and team understood this and crafted a process and philosophy that drove timely decisions, even when markets were at their worst but value was at its best.
<<<
>>> 9 Asset Classes for Protection Against Inflation
Investopedia
By KATELYN PETERS
January 07, 2022
https://www.investopedia.com/articles/investing/081315/9-top-assets-protection-against-inflation.asp?utm_campaign=quote-yahoo&utm_source=yahoo&utm_medium=referral
Gold
Commodities
60/40 Stock/Bond Portfolio
REITs
S&P 500
Real Estate Income
Aggregate Bond Index
Leveraged Loans
TIPS
Does Whole Life Insurance Hedge Against Inflation?
Are CDs a Good Hedge Against Inflation?
Are Annuities a Good Hedge Against Inflation?
What Is Inflation Protection Home Insurance?
A dollar today will not buy the same value of goods in ten years. This is due to inflation. Inflation measures the average price level of a basket of goods and services in an economy; it refers to the increases in prices over a specified period of time. As a result of inflation, a specific amount of currency will be able to buy less than before. Therefore, it is important to find the right strategies and investments to hedge against inflation.
The level of inflation in an economy changes depending on current events. Rising wages and rapid increases in raw materials, such as oil, are two factors that contribute to inflation.
Inflation is a natural occurrence in the market economy. There are many ways to hedge against inflation; a disciplined investor can plan for inflation by investing in asset classes that outperform the market during inflationary climates.
Keeping inflation-hedged asset classes on your watch list—and then striking when you see inflation begin to take shape in a real, organic growth economy—can help your portfolio thrive when inflation hits.
KEY TAKEAWAYS
Inflation occurs in market economies, but investors can plan for inflation by investing in asset classes that tend to outperform the market during inflationary climates.
With any diversified portfolio, keeping inflation-hedged asset classes on your watch list, and then striking when you see inflation can help your portfolio thrive when inflation hits.
Common anti-inflation assets include gold, commodities, various real estate investments, and TIPS.
Many people have looked to gold as an "alternative currency," particularly in countries where the native currency is losing value.
Commodities and inflation have a unique relationship, where commodities are an indicator of inflation to come; as the price of a commodity rises, so does the price of the products that the commodity is used to produce.
Here are some of the top ways to hedge against inflation:
1. Gold
Gold has often been considered a hedge against inflation. In fact, many people have looked to gold as an "alternative currency," particularly in countries where the native currency is losing value. These countries tend to utilize gold or other strong currencies when their own currency has failed. Gold is a real, physical asset, and tends to hold its value for the most part.
Inflation is caused by a rise in the price of goods or services. A rise in the price of goods or services is driven by supply and demand. A rise in demand can push prices higher, while a supply reduction can also drive prices. Demand can also rise because consumers have more money to spend.
However, gold is not a true perfect hedge against inflation. When inflation rises, central banks tend to increase interest rates as part of monetary policy.1 Holding onto an asset like gold that pays no yields is not as valuable as holding onto an asset that does, particularly when rates are higher, meaning yields are higher.
There are better assets to invest in when aiming to protect yourself against inflation. But like any strong portfolio, diversification is key, and if you are considering investing in gold, the SPDR Gold Shares ETF (GLD) is a worthwhile consideration.2
The SPDR Gold Shares ETF
2. Commodities
Commodities are a broad category that includes grain, precious metals, electricity, oil, beef, orange juice, and natural gas, as well as foreign currencies, emissions, and certain other financial instruments. Commodities and inflation have a unique relationship, where commodities are an indicator of inflation to come. As the price of a commodity rises, so does the price of the products that the commodity is used to produce.
Fortunately, it's possible to broadly invest in commodities via exchange traded funds (ETFs). The iShares S&P GSCI Commodity-Indexed Trust (GSG) is a commodity ETF worth considering.3
Before investing in commodities, investors should be aware that they are highly volatile and investor caution is advised in commodity trading. Because commodities are dependent on demand and supply factors, a slight change in supply due to geopolitical tensions or conflicts can adversely affect the prices of commodities.
The iShares S&P GSCI Commodity-Indexed Trust
3. A 60/40 Stock/Bond Portfolio
A 60/40 stock/bond portfolio is considered to be a safe, traditional mix of stocks and bonds in a conservative portfolio. If you don’t want to do the work on your own and you're reluctant to pay an investment advisor to assemble such a portfolio, consider investing in Dimensional DFA Global Allocation 60/40 Portfolio (I) (DGSIX).4
Dimensional DFA Global Allocation 60/40 Portfolio
A 60/40 stock/bond portfolio is a straightforward, easy investment strategy. But like all investment plans, it does have some disadvantages. Compared to an all-equity portfolio, a 60/40 portfolio will underperform over the long term. Additionally, over very long time periods, a 60/40 portfolio may significantly underperform an all-equity portfolio because of the effects of compounding interest.
It's important to keep in mind that a 60/40 portfolio will help you hedge against inflation (and keep you safer), but you'll likely be missing out on returns compared to a portfolio with a higher percentage of stocks.
4. Real Estate Investment Trusts (REITs)
Real estate investment trusts (REITs) are companies that own and operate income-producing real estate. Property prices and rental income tend to rise when inflation rises. An REIT consists of a pool of real estate that pays out dividends to its investors. If you seek broad exposure to real estate to go along with a low expense ratio, consider the Vanguard Real Estate ETF (VNQ).5
Vanguard Real Estate ETF
REITs also have some drawbacks, including their sensitivity to demand other high-yield assets. When interest rates rise, Treasury securities generally become attractive. This can draw funds away from REITs and lower their share prices.
REITs must also pay property taxes, which can make up as much as 25% of total operating expenses. If state or municipal authorities decided to increase property taxes to make up for their budget shortfalls, this would significantly reduce cash flows to shareholders. Finally, while REITs offer high yields, taxes are due on the dividends. The tax rates are typically higher than the 15% most dividends are currently taxed at because a high percentage of REIT dividends are considered ordinary income, which is usually taxed at a higher rate.6
5. The S&P 500
Stocks offer the most upside potential in the long term. In general, businesses that gain from inflation are those that require little capital (whereas businesses that are engaged in natural resources are inflation losers).
Currently, the S&P 500 has a high concentration of technology businesses and communication services. (They account for a 35% stake in the Index.) Both technology and communication services are capital-light businesses, so, theoretically, they should be inflation winners.
If you wish to invest in the S&P 500, an index of the 500 largest U.S. public companies—or if you favor an ETF that tracks it for your watch list—look into the SPDR S&P 500 ETF (SPY).78
The SPDR S&P 500 ETF
However, like any investment, there are disadvantages to investing in the S&P 500 Index. The main drawback is that the Index gives higher weights to companies with more market capitalization, so the stock prices for the largest companies have a much greater influence on the Index than a company with a lower market cap. And the S&P 500 index does not provide any exposure to small-cap companies, which historically produced higher returns.
6. Real Estate Income
Real estate income is income earned from renting out a property. Real estate works well with inflation. This is because, as inflation rises, so do property values, and so does the amount a landlord can charge for rent. This results in the landlord earning a higher rental income over time. This helps to keep pace with the rise in inflation. For this reason, real estate income is one of the best ways to hedge an investment portfolio against inflation.
For future exposure, consider VanEck Vectors Mortgage REIT Income ETF (MORT).9
VanEck Vectors Mortgage REIT Income ETF
Like any investment, there are pros and cons to investing in real estate. First, when purchasing real estate, the transaction costs are considerably higher (as compared to purchasing shares of a stock). Second, real estate investments are illiquid, meaning they can’t be quickly and easily sold without a substantial loss in value. If you are purchasing a property, it requires management and maintenance, and these costs can add up quickly. And finally, real estate investing involves taking on a great deal of financial and legal liability.
7. The Bloomberg Aggregate Bond Index
The Bloomberg Aggregate Bond Index is a market index that measures the U.S. bond market. All bonds are covered in the index: government, corporate, taxable, and municipal bonds. To invest in this index, investors can invest in funds that aim to replicate the performance of the index. There are many funds that track this index, one of them being the iShares Core U.S. Aggregate Bond ETF (AGG).10
iShares Core U.S. Aggregate Bond ETF
There are some disadvantages to investing in the Bloomberg U.S. Aggregate Bond Index as a core fixed-income allocation.
First, it is weighted toward the companies and agencies that have the most debt. Unlike the S&P 500 Index, which is market-capitalization-weighted—the bigger the company, the bigger its position in the index—the largest components of the Bloomberg U.S. Aggregate Bond Index are the companies and agencies with the most debt outstanding. In addition, it is heavily weighted toward U.S. government exposure, so it is not necessarily well-diversified across sectors of the bond market.
8. Leveraged Loans
A leveraged loan is a loan that is made to companies that already have high levels of debt or a low credit score. These loans have higher risks of default and therefore are more expensive to the borrower.
Leveraged loans as an asset class are typically referred to as collateralized loan obligations (CLOs). These are multiple loans that have been pooled into one security. The investor receives scheduled debt payments from the underlying loans. CLOs typically have a floating rate yield, which makes them a good hedge against inflation. If you're interested in this approach at some point down the road, consider Invesco Senior Loan ETF (BKLN).11
Like every investment, leveraged loans involve a trade-off between rewards and risks. Some of the risks of investing in funds that invest in leveraged loans are credit default, liquidity, and fewer protections.
Borrowers of leveraged loans can shutter their business or reach a point where they are unable to pay their debts. Leveraged loans may not be as easily purchased or sold as publicly traded securities. And finally, leveraged loans generally have fewer restrictions in place to protect the lender than traditional loans. This could leave a fund exposed to greater losses if the borrower is unable to pay back the loan.
9. TIPS
Treasury inflation-protected securities (TIPS), a type of U.S. Treasury bond, are indexed to inflation in order to explicitly protect investors from inflation. Twice a year, TIPS payout at a fixed rate. The principal value of TIPS changes based on the inflation rate, and so the rate of return includes the adjusted principal. TIPS come in three maturities: five-year, 10-year, and 30-year.
If you favor using an ETF as your vehicle, the three choices below might appeal to you.121314
The iShares TIPS Bond ETF (TIP)
The FlexShares iBoxx 3-Year Target Duration TIPS Index ETF (TDTT)
Even though TIPS may appear like an attractive investment, there are a few risks that are important for investors to keep in mind. If there is deflation or the Consumer Price Index (CPI) is falling, the principal amount may drop. If there is an increase in the face value of the bond, you will also have to pay more tax (and this could nullify any benefit you may receive from investing in TIPS). Finally, TIPS are sensitive to any change in the current interest rates, so if you sell your investment before maturity, you may lose some money.
Does Whole Life Insurance Hedge Against Inflation?
Whole life insurance is a contract designed to provide protection over the insured’s entire lifetime. Because whole life insurance is a long-term purchase, the guaranteed return on this type of policy provides little inflation protection. However, it is sometimes referred to as a hedge against inflation because the dividends paid on participating policies—which reflect the favorable mortality, investment, and business expense results of the insurer—can act as a partial hedge against inflation.
Are CDs a Good Hedge Against Inflation?
A certificate of deposit (CD) is a short- to medium-term deposit in a financial institution at a specific fixed interest rate. Typical CDs are not protected against inflation. If you would like to reduce the impacts of inflation on your CD investments, consider buying a CD that is higher than the inflation rate so that you can get the most value for your money. The longer the term of the CD, the higher the interest rate will be.
Are Annuities a Good Hedge Against Inflation?
Annuities are not often considered a good hedge against inflation; in fact, the primary risk of most annuity payouts is inflation. This is because commercial annuities generally pay a fixed monthly income, rather than an inflation-adjusted income. If your annuity pays a fixed $3,000 per month for life, and inflation increases 12%, the buying power of your annuity payments decreases to $2,640. Variable annuities that adjust with interest rates may offer better inflation protection than fixed annuities.
What Is Inflation Protection Home Insurance?
Some insurance policies have a feature called insurance inflation protection, which stipulates that future or ongoing benefits to be paid are adjusted upward with inflation. Inflation protection home insurance is intended to ensure that the relative buying power of the dollars granted as benefits does not erode over time due to inflation.
Strategies to Help Minimize Investment Taxes
A strategic approach to investing can help you maximize your retirement income while minimizing your investment taxes. With no commissions and no financial incentives, Vanguard Personal Advisor Services® can develop a goal-driven plan to help you do just that. You’ll also have access to personal service at a low cost. Learn more about how you can access personal financial advice and start the conversation.
<<<
>>> Best Performing Sector ETFs Of The Year
Yahoo Finance
by Sumit Roy
December 30, 2021
https://finance.yahoo.com/news/best-performing-sector-etfs-021500432.html
In a year in which the S&P 500 has surged as much as it has, it’s tough to find a group of stocks that has done poorly.
Sure, there are pockets of weakness, such as in the ARK Innovation ETF (ARKK), which is down 23% year-to-date. But if you look at the big, broad indices and the major sectors that lie beneath them, there is no weakness to speak of.
That’s not a surprise considering the S&P 500 is up 29.2% on the year with only a few trading days left to go. No matter how you slice it, that’s a monster return—the third-largest of the past 10 years.
Four sectors have performed even better than the large cap index, while seven have done worse. In this article, we take a look at the performance for the 11 sectors under the Global Industry Classification Standard (GICS), using the SPDR suite of sector ETFs as a proxy.
Energy: From Boom To Bust
At the top of the 2021 sector rankings is energy, with a nearly 55% gain. Left for dead in 2020, the sector has made a stunning comeback this year thanks to oil’s rebound from a low of less than $20 last year (based on Brent crude oil prices) to more than $80 this year.
Natural gas prices have also surged, from $1.5/mmbtu last year to more than $6 at one point this year.
No wonder energy stocks got a boost this year—though they remain well off their all-time highs set in 2014, and the sector remains very much out of favor with increasingly ESG-focused investors and those who see the obsolescence of fossil fuels in the not-too-distant future.
Real Estate Comeback
Energy’s outperformance in 2021 was a surprise, as was the stellar performance of the No. 2 sector of the year, real estate, which is up 44.3%.
The real estate sector, which predominantly comprises real estate investment trusts (REITs), has benefited from low interest rates and a comeback in commercial restate.
For instance, even though the outlook for brick-and-mortar retail is still challenged, mall operator Simon Property Group recovered all of its losses from last year and more.
Meanwhile, other REITs, such as the REIT Prologis and wireless communications infrastructure provider American Tower Corporation, have benefited from the continued growth of e-commerce and 5G, respectively.
Relentless Tech Rally
The only two other sectors to beat the S&P 500 this year are technology and financials. Tech’s outperformance needs little explanation. It’s the same story investors have heard for years.
The relentless growth of companies like Apple, Microsoft and Nvidia (which account for half of the tech’s market capitalization) has fueled consistent gains for the sector. Under GICS, Google parent company Alphabet and Facebook parent company Meta aren’t considered technology stocks anymore—though many investors would argue otherwise.
Google has performed fantastically this year, gaining 67%. Meta has delivered a more modest 27%. The communication services sector in which they both reside lagged in 2021, returning 17.7%.
Some of the top holdings in XLC outside of Alphabet and Facebook—such as AT&T, Verizon and Comcast—have lagged the market significantly, weighing on the sector’s performance.
Financials Outperform, Safe Sectors Lag
The aforementioned financials sector has been another outperformer this year thanks to the solid showing in names like Berkshire Hathaway, J.P. Morgan, Bank of America and Wells Fargo, among others.
Interest rates are still low, but they are up from last year’s record-low levels and are anticipated to rise further as the Fed begins tightening monetary policy. That may help bolster the profitability of banks, insurance companies and other financials.
Finally, consumer discretionary, materials, health care, industrials, consumer staples and utilities are the sectors with below-market returns this year, which we haven’t yet touched on.
Utilities and consumer staples are the bottom two sectors, both relatively safe groups that have been neglected amid a booming stock market.
For a full breakdown of this year’s sector performance, see the table below:
Ticker
Sector
YTD Return (%)
XLE
Energy
54.86
XLRE
Real Estate
44.25
XLK
Technology
36.18
XLF
Financials
35.48
SPY
S&P 500
29.20
XLY
Consumer Disc.
28.45
XLB
Materials
26.81
XLV
Health Care
25.60
XLI
Industrials
20.79
XLC
Communication Services
17.68
XLP
Consumer Staples
16.24
XLU
Utilities
16.23
Data measures total returns for the year-to-date period through Dec. 28, 2021.
<<<
>>> Diversify your portfolio the right way ?— here are 5 assets with little connection to the stock market’s wild swings
MoneyWise
by Clayton Jarvis
December 19, 2021
https://finance.yahoo.com/news/diversify-portfolio-way-5-assets-140000363.html
Diversify your portfolio the right way ?— here are 5 assets with little connection to the stock market’s wild swings
If your idea of a diversified portfolio is one that only needs growth and value stocks, it’s a good thing you’re reading this.
With prominent investors like Michael Burry, Jeremy Grantham and Charlie Munger expecting a historic correction to hit the stock market, it’s an opportune time to take a long, thoughtful look at your portfolio.
Specifically, you need to make sure it holds the kinds of assets that can help offset any potential losses associated with your stock market exposure.
Let’s look at five assets that can help grow your portfolio, even in the midst of market chaos. We’ll start with three traditional asset classes and then dig into two overlooked examples that show just how interesting — and profitable — alternative investments can be.
1. Bonds
When inflation is making short work of fixed-income returns, bonds can seem even less attractive than usual.
But elevated inflation won’t be around forever, and if the stock market truly is in for a reckoning, the guaranteed income associated with bonds, modest as it is, may be easier to stomach than a historic decline in share values.
In addition to the lower risk, investors also opt for bonds at times of economic uncertainty because decreases in consumer spending can lead to weakening profits and lower share prices.
The bond market is vast, so you should be able to find products that meet your needs as an investor.
U.S. savings bonds, mortgage-backed securities and emerging market bonds are a few examples. And getting exposure is now as easy as purchasing established bond ETFs such as the iShares U.S. Treasury Bond ETF, SPDR Long Term Corporate Bond ETF, and VanEck Investment Grade Floating Rate ETF.
2. Real estate
Real estate is detached from the stock market to such an extent that it provides one of the best hedges against falling share prices.
There hasn’t been a period in recent American history where millions of people weren’t willing to pay for shelter, either by renting or buying properties of their own.
Demand for housing may fluctuate from neighborhood to neighborhood, but its overall ceaselessness should continue to push prices and rent higher, no matter what’s happening on Wall Street.
Purchasing an investment property — a condo, a detached home, a triplex — is the ideal for most investors. Others are happy to keep updating their own residence with an eye toward a future sale.
You can also purchase shares in a real estate investment trust, or REIT, which distributes rental income to shareholders. Names like Realty Income, Digital Realty Trust, and Public Storage should provide a good starting point for investors who'd like to investigate the space.
3. Commodities
Commodities can help shield your portfolio from a declining stock market, but they come with their own unique risks.
When investing in commodities, you’re buying the raw materials used to produce consumer goods and reselling them at (hopefully) a higher price. Cotton, coffee, metals, cattle and petroleum products all qualify as commodities.
Commodity prices are a reflection of supply and demand dynamics in individual markets, so their performance isn’t tied to the stock market. Commodities tend to have a low to negative correlation to both stocks and bonds.
That said, commodities investing is inherently volatile. Unfavorable weather could ruin an investment in chickpeas; new regulations could kill your investment in coal. But if everything falls into place, the returns can be great.
These days, a practical way to invest in commodities is through well-established, broad-based commodity ETFs, such as the Invesco DB Commodity Index Tracking Fund.
If you want to invest in a specific commodity, there are ETFs for that too. For instance, gold bugs have long loved the SPDR Gold Shares ETF for easy access to the market.
Meanwhile, gold mining companies like Barrick Gold and Newmont should also do well if the price of the yellow metal goes up.
4. Fine art
Like commodities, art values depend on supply and demand; it’s just that supply, when it comes to art, means a one-of-a-kind display of genius — something people regularly pay millions for.
In addition to being uncorrelated with the stock market, fine art has the ability to kick off healthy returns.
Between 1995 and 2020, contemporary art has outperformed the S&P 500 by 174% — that’s nearly three times the returns — according to the Citi Global Art Market chart.
Fine art used to be an investment for wealthy aficionados with access to the capital and insight required to make smart purchases.
But new platforms are helping everyday investors get into the fine art market by selling shares in modern masterpieces that could one day be sold for solid gains.
“Those artists tend to appreciate at single-digit to low-double-digit rates, but they're very good stores of value,” says Scott Lyn, CEO of art investing platform Masterworks. “It's very unlikely that you lose money investing in one of those paintings.”
5. Sports cards
In the same investable, collectible vein as fine art lie sports cards, some of which can be worth a fortune.
In October, a rare Michael Jordan Upper Deck card was auctioned off for $2.7 million. Earlier this year, a Tom Brady rookie card was sold for $2.25 million.
Social media and a whole lot of pandemic-related free time spent digging through old collections have helped trigger a new wave of interest in sports cards.
They’re like a meme stock alternative — they don’t always pay off, but when they do, look out.
You can play the sports card game in many ways:
Buy individual cards you think will maintain their value.
Buy boxes of cards and go hunting for one-of-a-kind items that can sell for ridiculous amounts.
Pool your money with other investors to purchase high value cards and resell them at some point in the future.
Find a broker who, for a fee, will help you buy, sell and trade sports cards like stocks.
Just be careful.
The bottom fell out of the sports card market in the mid-90s — too many companies, too many cards. With all the money the space is attracting today, expect more companies to try and get a piece of it.
<<<
>>> The 9 best Vanguard funds for retirees
Market Watch
Oct. 16, 2021
By Paul A. Merriman
https://www.marketwatch.com/story/the-9-best-vanguard-funds-for-retirees-11634221899?siteid=yhoof2
If you’re retired or on the brink of retirement and you want a relatively simple low-cost investment that won’t lead you astray, your search should start with Vanguard mutual funds.
Let me be clear: This article isn’t a sales pitch. I don’t work for Vanguard and I have no affiliation with the company except as a shareholder in their funds.
Why Vanguard
Vanguard has more than $7 trillion under its management and is the only mutual fund company with a financial structure built to benefit the shareholders in its mutual funds.
The company’s funds are known for low expenses and the lower tax exposure that comes from low turnover. It should go without saying that Vanguard funds are no-load funds. No sales commission, no sales pressure.
From Vanguard’s offering of excellent funds, here are nine that I like for retirees.
Vanguard Short-Term Investment Grade Fund VFSUX, -0.09%
This is the first fund my wife and I invest in every year. In January, we make our annual withdrawal from long-term investments to cover our expenses for the year ahead. This fund is also where we keep our emergency cash.
Because this fund holds no stocks, our finances are remarkably emotion-free. No matter what’s happening in the stock market at any given moment, we know that won’t affect us until the following calendar year. If you’ve never tried managing your money like this, I recommend it.
You won’t get rich in this fund, but you’ll probably earn nearly 100 times as much as you’d get in a typical bank savings account paying (this is really disgusting!) 0.01% interest.
Over the past 15 years, this fund appreciated at 3.27%. (Average effective bond maturity 2.8 years)
Balanced funds: boringly beautiful
Balanced funds hold both stocks and bonds. Over the years their shareholders are statistically likely to have above-average success as investors.
Why is that? Not because the funds themselves have any magic. It’s because the combination of growth and stability make you more likely to be content to leave your money where it is instead of trying to figure out when to buy and when to sell.
None of the following eight balanced funds is designed to normally hold much more than about 60% in equities. That means they aren’t likely to suffer the sort of major losses of all-equity funds.
Any one of these could make a good one-fund portfolio for a retiree. But don’t choose at random; the differences matter.
Vanguard Target Retirement 2015 VTXVX, +0.06%
If you’re already retired, this fund of funds has your back. With an equity stake of only about 35% and the diversification of (indirectly) owning more than 10,000 stocks and 24,000 bonds, you just won’t go very far wrong. You’ll get some growth plus a good measure of stability.
If you like the target date concept but want a bit more equity exposure, it’s easy to pick a variation focused on a later year such as 2020 or 2025.
Vanguard LifeStrategy Funds
These funds of funds come in varying combinations of equity exposure, from 20% to 80%, though I’m excluding the most aggressive one from this discussion. All the bonds in these funds, by the way, are investment grade. No junk.
LifeStrategy Income Fund VASIX, -0.12% typically holds only about 20% of its portfolio in equity funds, with the rest in bonds, perhaps a good fit for investors with ample resources (more than they think they’ll ever need, in other words) and those who are very skittish about the stock market.
LifeStrategy Conservative Growth VSCGX, +0.13% doubles that equity stake to about 40%, perhaps the right choice for conservative retirees who want some growth but are not willing to go very far out on a limb to get it.
LifeStrategy Moderate Growth VSMGX, +0.29% is very similar, but with a 60/40 split of equities and bonds. This provides more growth, although still without much excitement.
Two funds for retirees who don’t know a lot about investing
Often over the past 20 years I have recommended Vanguard Wellesley Income Fund VWIAX, +0.04% and/or Vanguard Wellington Fund VWENX, +0.42%.
For conservative retirees that I don’t know well, Wellesley has become what I regard as my best piece of advice.
Wellesley has been taking good care of investors since 1970. Its portfolio is normally 40% in equities, 60% in bonds. This is a low-cost actively managed fund, holding about 70 large-cap stocks (mostly value stocks) and about 1,300 bonds.
For those who are less conservative, Wellington is my go-to suggestion, especially for people who value a very long track record.
Wellington has been in business since 1929 and was the industry’s very first balanced fund.
Wellington’s typical 60/40 split of equities and bonds mirrors the way the trustees of many large pension funds invest. They know they need reliable long-term growth and that their portfolios must, in all circumstances, be able to pay their pensioners.
Wellington is actively managed, with about 60 large-cap stocks and about 1,100 bonds.
Note: My wife and I prefer an overall 50/50 allocation of equities and bonds. If that appeals to you, you could achieve that by splitting your money evenly between Wellesley and Wellington.
Two other Vanguard balanced funds are worth considering.
Vanguard Balanced Index Fund VBIAX, +0.27% is index driven, holding about 60% of its portfolio in 3,300 U.S. mostly growth-oriented stocks and the rest in about 10,700 bonds.
Vanguard Tax-Managed Balanced Fund VTMFX, +0.34% is managed to minimize capital gains distributions and other taxable income, with a typical equity/bond split closer to 50/50. If you like that allocation along with lower tax bills, this fund could be for you.
Returns and risks
As you can see in the table below, levels of risk and return are indeed linked, but not always exactly what you would expect.
Funds are listed in order of their trailing 15-year compound annual growth rate (as of early October). For each, you’ll also see its performance during 2008, the worst calendar year for investors in a long time.
Table 1: Vanguard funds compared
Fund 15-year return 2008
Wellington 8.7% -22.2%
Balanced Index 8.33% -22.1%
Tax-Managed Balanced 7.51% -18.32%
Wellesley Income 7.26% -9.79%
LifeStrategy Moderate 6.65% -26.5%
Target Retirement 2015* 5.99% -24.1%
LifeStrategy Conservative 5.69% -19.52%
LifeStrategy Income 4.73% -10.53%
Short-Term Investment Grade 3.27% -4.65%
*Statistics for this fund reflect a period when the fund had a more aggressive allocation than it does now.
<<<
>>> Your 'safe' investing bets could turn out to be a gamble in retirement
Money Wise
by Sigrid Forberg
October 3, 2021
https://finance.yahoo.com/news/safe-investing-bets-could-turn-143000901.html
Your 'safe' investing bets could turn out to be a gamble in retirement
The older investors get, the more conservative they tend to be with their money. That's not the bravado of youth fading away — that's sound strategy.
After all, it's one thing to play fast and loose when you're young, but investors nearing retirement don't have a lot of time to make up for bets gone bad.
Unfortunately, many Americans today don't have the luxury of doing what worked for their parents and grandparents. In fact, shifting to ultra-conservative investments could be the riskiest thing you can do.
Sure, you probably won't lose money by playing it safe, but in the current environment you may not generate enough cash to last through your retirement.
What’s changed?
The first problem Americans face is a good one to have: We’re living longer. The current life expectancy in the U.S. is about 79 years old. Thirty-five years ago, when you might have started planning for your retirement, life expectancy was under 75.
Government data shows that seniors are spending an average of $50,000 per year — so if you still want to retire on schedule, your investments will need to make up the difference.
The second problem doesn’t have as much of a silver lining: weakening returns on safer investments.
Historically, people nearing retirement have funnelled more of their money into ultra-conservative options like bonds, certificates of deposit or even just a money market account. None of these pay out like they used to.
Consider the 10-year Treasury note. Back in 1981, the yield reached a high of 15.84%. No one would scoff at putting your retirement money into an investment like that.
But by the end of the decade, it had fallen to 9.5%. Now, it’s under 1.5% — not much better than some savings accounts.
The same is true of CDs. Savers had access to double-digit yields back in the 1980s, and even as recently as the 2000s, a one-year CD could return between 1.5% and 5%. Now you’d be lucky to find a yield as high as 0.45%.
What options do you have?
Luckily, living longer also gives retirees and people nearing retirement more time to entertain slightly riskier investments.
Here are five options to consider that can offer reasonable returns — without taking a gamble you can’t afford.
Whole life insurance
Whole life insurance provides you with lifelong coverage for your family — and in addition to the actual insurance component, you’ll have a “cash value” to bank on.
Part of your premiums go toward the cash value component, which is invested and grows at a guaranteed, steady rate. The earnings on your money are tax-deferred.
When you buy whole life insurance, you can borrow against the cash value, tap it as a source of income, use it to pay policy premiums and even trade it for a larger death benefit for your loved ones.
And if you choose a “participating” policy, you’ll also share in the company’s profits in the form of dividends.
Annuities
Annuities are contracts sold by financial institutions or insurance companies. They’re designed to help people deal with the prospect of outliving their savings in retirement.
Once they’ve reached the payout phase, you’ll receive a stream of income for either a predetermined period of time or your entire life. They do come with various fees, so you’ll want to read all the terms and conditions before you choose to invest in one.
If you run into trouble early on, you won’t be able to access the funds without penalty, so make sure you have other sources of income during that time.
Farmland
Investing in farmland has proven to be a successful strategy for one of the richest men on the planet, so it’s definitely worth a look.
The great thing about this asset is its intrinsic value: Even when the economy is in shambles, people still need to eat. Yet studies have also shown farmland can offer better returns than bonds, gold and often the stock market.
With the help of a new investment platform, you can pool your funds with other investors to buy stakes in individual farms without the responsibility of running it yourself. In exchange for your investment, you’ll get a cut from the leasing fees and crop sales — earning a tidy sum while the asset continues to grow in value.
Dividend-paying stocks
Dividend-paying stocks offer investors a relatively stable source of income. The companies that offer this type of stock will distribute a portion of the company’s profits to shareholders on a regular basis, usually once a quarter.
You have two ways to get them: either through dividend funds or as individual stocks.
There is a certain amount of risk you take on investing in stocks, but there’s also a nice payoff if the stock price rises. If you’re especially risk-averse, dividend funds help offset the chance of a big loss by ensuring you have other stocks to fall back on within the fund if one takes a dive.
Real estate investment trusts
The real estate market is only getting hotter, but buying a second property takes an enormous amount of capital. Plus, you’re trying to retire — not take on the part-time job of being a landlord.
Real estate investment trusts (or REITs) offer everyday investors the chance to effectively crowdfund the purchase of residential homes or commercial properties.
With as little as $500, you can start building a real estate portfolio and reap the profits.
<<<
>>> Ray Dalio: I have more gold than crypto
MarketWatch
Sept. 15, 2021
By Frances Yue
https://www.marketwatch.com/story/ray-dalio-i-have-more-gold-than-crypto-11631734752?siteid=yhoof2
‘You don’t want to commit cash. You don’t want a bond… You want stocks, you want gold, you want tangible assets, you want real estate,’ Dalio said.
Though holding some bitcoin and admitting the cryptocurrency’s attraction as “alternative gold,” Ray Dalio disputed Cathie Wood’s view that bitcoin BTCUSD, 0.55% will rise tenfold in five years.
“That doesn’t make any sense to me,” the billionaire and founder of hedge fund Bridgewater Associates on Wednesday said at the SALT conference held in New York. The tenfold rise could be “very much a stretch,” Dalio said.
“There’s a certain amount of reflation turn-around for those kinds of things going up to make a price increase, and there’s a certain market share that gold might have, that bitcoin might have and other things might have,” Dalio said.
In a different panel of the SALT conference, Ark Invest’s ARKK, +0.83% Wood said on Monday that she expected bitcoin’s price to top $500,000.
Dalio also said he had more gold than crypto. “I would say diversification is a good thing. We could get into the merits of one versus the other,” he said.
Meanwhile, Dalio reiterated his view that the U.S. has “bad finances,” spending more than it is earning. “You can fill that in by printing money and continue to create debt. But that’s not sound finances.”
It means “you don’t want to commit cash. You don’t want a bond, it’s going to have a negative real return.” Dalio said. “You want stocks, you want gold, you want tangible assets, you want real estate, you want the things that are basically anti-money…you want to get into those things that have more of those intrinsic values accompanying it.”
When asked about his personal plans, Dalio said he expects to “go quiet” and “do the things I like to do” after a year or two.
“My goal is not anymore to be more successful myself but just to try to pass along. And then I’ll do that for a year or two. And then I’m done,” Dalio said.
<<<
>>> The Ray Dalio All Weather Portfolio can be replicated with the following ETFs:
http://www.lazyportfolioetf.com/allocation/ray-dalio-all-weather/
Weight Ticker ETF Name Investment Themes
30.00 % VTI Vanguard Total Stock Market Equity, U.S., Large Cap
40.00 % TLT iShares 20+ Year Treasury Bond Bond, U.S., Long-Term
15.00 % IEI iShares 3-7 Year Treasury Bond Bond, U.S., Intermediate-Term
7.50 % GLD SPDR Gold Trust Commodity, Gold
7.50 % GSG iShares S&P GSCI Commodity Indexed Trust Commodity, Broad
<<<
>>> Gundlach: We're running our economy 'like we're not interested in maintaining global reserve currency status'
Yahoo Finance
Julia La Roche
August 24, 2021
https://finance.yahoo.com/news/jeffrey-gundlach-view-on-the-us-dollar-decline-154813067.html
Billionaire bond investor Jeffrey Gundlach, the founder and CEO of $137 billion DoubleLine Capital, says his number one conviction over several years is that the U.S. dollar will decline as a consequence of current economic policies, resulting in the U.S. losing its sole reserve currency status.
"My number one conviction looking forward a number of years — I'm not talking about the next few months at all, I'm talking about several years — is that the dollar is going to go down," Gundlach told Yahoo Finance Live in an exclusive interview on Monday afternoon.
It's Gundlach's view that the "places to be in the long-term" are emerging markets and "non-U.S entities." While Gundlach has already rotated into European equities, the investor expects to "aggressively rotate into emerging markets," but notes it's "too early for that right now."
"So the dollar is going down is another reason why ultimately — we touched on gold — I think ultimately gold is going to go a lot higher, but it's really in hibernation right now," he added.
The 61-year-old "Bond King" later highlighted that the United States' status of the global reserve currency is in jeopardy.
"[The] U.S. has enjoyed the status of sole reserve currency globally for decades, and it's an incredible benefit," Gundlach said.
He pointed that in the aftermath of the global coronavirus pandemic and lockdowns, China's economy has been "the strongest economy in the world by far." While U.S. GDP has "bounced back with a lot of consumption, a lot of that consumption is going to China," he added.
"That's one of the reasons why China has such a strong economy. So, what we're seeing in the United States is starting to fall behind in economic growth. That's not a new thing. That's been going on for a generation, the U.S. falling behind," Gundlach said.
The investor also pointed out that estimates for when China's economy will be the largest "keep getting pulled forward," noting some economists' projections show China's economy will surpass the U.S. by 2028.
"We have debt-to-GDP that is fueling the majority of our so-called economic growth. So, is it really economic growth when you borrow money or print money, send checks to people who turn around and buy goods on Amazon in addition to maybe paying down debt and speculating and these goods come in from China?" Gundlach said.
He added: "We're running our economy in a way that is almost like we're not interested in maintaining global reserve currency status or the largest military or global call it superiority or control. As long as we continue to run these policies, and we're running them more and more aggressively, we're not pulling back on them in any way, we are looking at a road map that is clearly headed towards the U.S. losing its sole reserve currency status."
According to Gundlach, with the current economic policies in place, it's "almost certain" the U.S. dollar should be going down.
"The value of the dollar is so high because we enjoy global reserve currency status, and we don't really respect it enough. We take it for granted, I guess. We seem to take a lot of things for granted these days in the United States relative to how we thought about things in prior decades and generations. And, I believe we are setting the stage for us to, unfortunately… experience the consequences of our actions the way we have been running a non-serious economic program now, really since 1980, but it's really accelerated so much in the past decade and there's no signs of it abetting," he said.
It's Gundlach's view that the U.S. dollar has "already peaked" when the U.S. Dollar Index hit 103.
"I believe the dollar will take out the lows of the past down cycle. The dollar has been in a series of declining highs for decades — it goes back to the '80s. For that reason, I think when we get to the next break to the lower level, the dollar will go past the most recent low of around 80 and even take out the low of 70. So, I think there's easily 25% downside in the U.S. dollar."
<<<
>>> Fed Minutes Show Most Officials See Taper Starting This Year
Bloomberg
By Craig Torres
August 18, 2021
https://www.bloomberg.com/news/articles/2021-08-18/fed-minutes-show-most-officials-see-inflation-goal-in-hand
Most participants saw standard on price stability achieved
Fed releases minutes of its policy meeting held in late July
Most Federal Reserve officials agreed last month they could start slowing the pace of bond purchases later this year, judging that enough progress had been made toward their inflation goal, while gains had been made toward their employment objective.
“Various participants commented that economic and financial conditions would likely warrant a reduction in coming months,” minutes of the Federal Open Market Committee’s July 27-28 gathering, released Wednesday, said. “Several others indicated, however, that a reduction in the pace of asset purchases was more likely to become appropriate early next year.”
The minutes also showed that most participants “judged that it could be appropriate to start reducing the pace of asset purchases this year.”
U.S. central bankers next meet September 21-22. While the record shows that they don’t yet have agreement on the timing or pace of tapering asset purchases, most had reached consensus on keeping the composition of any reduction in Treasury and mortgage-backed securities purchases proportional.
“The FOMC minutes again reveal a wide spread of opinion on the question of the timing, speed and structure of the upcoming tapering,” Ian Shepherdson, chief economist at Pantheon Macroeconomics Ltd. said after the release.
The minutes showed split views on the durability of faster inflation as well as on key areas of policy making.
Inflation Debate
While the recent surge in consumer prices has grabbed policy makers’ attention and prompted wide agreement on pulling back on asset purchases, “several” meeting participants were still worried that inflation could slump back into the pre-pandemic trend of running below the 2% target.
On the labor front, officials saw progress -- yet the late-July discussion also showed uncertainty over both near- and medium-term labor market slack, given the job destruction tied to the pandemic.
Policy choices going forward are also likely to be influenced by new appointees to the Fed Board as the Biden administration moves to fill as many as four positions by early 2022.
“Several participants emphasized that employment remained well below its pre-pandemic level and that a robust labor market, supported by a continuation of accommodative monetary policy, would allow further progress toward” labor-market goals, the minutes said. “Several participants also commented that price increases concentrated in a small number of categories were unlikely to change underlying inflation dynamics sufficiently to overcome the possibility of a persistent downward bias in inflation.”
Stocks Slide
Treasuries advanced after the release, though remained down for the session, with 10-year yields at 1.28% as of 3:47 p.m. in New York, compared with about 1.29% before the release. The S&P 500 Index of equities slumped 0.8%.
Fed policy makers have differed publicly in the weeks since the meeting over when the central bank should start tapering, with some, like Minneapolis Fed President Neel Kashkari, wanting to a see a “few more” strong jobs reports and others, such as Boston Fed President Eric Rosengren, saying he’s open to announcing plans for a reduction at the next meeting if employment figures come in well.
“Many participants saw potential benefits” in ending the Fed’s bond buying before targets were hit for raising interest rates, the minutes showed. Policy makers also discussed the importance of disassociating moves on asset purchases from a decision on an eventual rate hike.
St. Louis Fed President James Bullard said Wednesday that he would like to see the tapering of the asset-purchase program done by the first quarter of 2022 -- a much faster pace than prior wind-downs.
Fed’s Kashkari Wants ‘Few More’ Strong Job Reports Before Taper
On the composition of bond-buying purchases, “most participants remarked that they saw benefits in reducing the pace of net purchases of Treasury securities and agency MBS proportionally.”
The minutes indicate that officials still see room for labor-market improvement. Job gains have been strong, averaging 617,000 a month through July. The unemployment rate stood at 5.4% last month, but broader measures still show slack.
The employment-to-population ratio for workers between 25 and 54 years old was 77.8% last month compared to 80.5% at the start of 2020, while Hispanic and Black unemployment rates remain high at 6.6% and 8.2%.
The recovery has been strong with both supply and demand imbalances pushing prices higher. The Fed’s inflation indicator rose at a 4% pace for the 12 months ending June compared with the Fed’s 2% target.
The minutes showed that “most participants” remarked that their standard for progress had been achieved with respect to the price stability goal.
Fed officials cut their benchmark lending rate to zero in March 2020 and announced they would buy $200 billion of agency mortgage-backed securities and $500 billion of Treasuries to support market functioning. By December 2020, they realigned their guidance saying they would purchase $80 billion a month in Treasuries and $40 billion a month on mortgage securities “until substantial further progress has been made toward its maximum employment and price stability goals.”
The asset purchases have lowered longer-term interest rates and helped fuel a rise in housing prices and other financial assets, with one-month gains in home price indices breaking records while stock indexes trade around record highs.
<<<
Rickards - >>> A Disaster
BY JAMES RICKARDS
AUGUST 2, 2021
https://dailyreckoning.com/a-disaster/
A Disaster
Last week, the U.S. Commerce Department reported second-quarter GDP for the U.S. rose at a 6.5% annualized rate.
From 2009 to 2019 (the recovery from the 2008 global financial crisis), the average annual growth in GDP for the U.S. was 2.2%. So, in comparison with the previous recovery, 6.5% seems like exceptionally strong growth.
Of course, champagne corks were flying at The New York Times and other mainstream media outlets because Q2 output has regained 2019 levels. But the recession was over in April 2020. It’s now August 2021, and they’re celebrating that we’re back to 2019 levels? That’s a pathetic rebound and really nothing to celebrate.
Let’s take a closer look at the numbers…
Less Than Meets the Eye
First, most analysts and media projected the Q2 number to be 7.5% or 8.0%, so it fell below expectations. Second, the Federal Reserve Bank of Atlanta GDPNow tracker for Q2 GDP fell from 13% in April, to 10% in May, and then 7.5% in June.
With allowance for noise, this means that growth weakened considerably over the course of the quarter. It also means if growth was stronger in April and May, and if growth for the quarter overall was 6.5%, then June must have been well below 6.5%. It’s simple math.
That means Q3 is off to a weak start. With the Delta variant of the virus out there, the situation is even worse. Finally, there was some highly troubling data in the fine print that comes along with the headline number.
Imports were healthy because Americans have been on a bit of a buying binge, using government handout checks. But exports were awful, a reflection of the fact that the rest of the world is not doing nearly as well as the U.S. Simply put, foreigners are not buying our goods because they’re in bad shape themselves.
Most dramatically, personal income fell 30% on an annualized basis. This is a measure of private income that does not include government handouts. Most of this 30% drop was based on revisions to prior data, which had been updated by the Commerce Department using more reliable surveys.
Statistical adjustments aside, the bottom line is that private income (both wages and proprietor allocations) has been flat for eight months going back to October 2020.
Not a Recovery, But a Disaster
That’s not a recovery; that’s a disaster. It makes the forecast more dire because one-by-one the government subsidies are running out.
The U.S. economy fell about 35% (annualized) in the first half of 2020 and then staged a strong comeback, rising 33.4% in the third quarter of 2020 with a more modest 4.3% gain in the fourth quarter.
For the full-year 2020, the economy fell by the greatest amount since 1946, but the second-half recovery kept that from being far worse.
Why wasn’t the 2020 economy much worse? The answer is that a huge number of financial rescue programs were put in place, backed up by tens of trillions of dollars of either money printing or deficit spending.
The Fed expanded its balance sheet by over $4 trillion in the immediate aftermath of the collapse. Congress approved trillions of dollars of checks sent directly to the American people. Unemployment benefits were extended and increased. Student loan repayments were deferred. Payroll Protection Plan loans were made to small businesses (and most were later forgiven).
The Gravy Train Has Stopped
But expanded unemployment benefits are mostly done. The Payroll Protection Plan loans are over. No additional checks are going to be mass-mailed, as happened last February and December.
With government handouts mostly over, private income stagnant and exports falling, it’s not clear what will drive GDP growth at all in the second half of 2021. To top it all off, the rent eviction moratorium is over.
One of the most effective and least reported programs was the moratorium on evictions of renters. This was a federal program, although there were many local equivalents.
Once renters knew they could not be evicted, they stopped paying rent. The program was so widespread that 14.7% of all renters in America now owe back rent. That moratorium expired as of last Saturday. What happens next?
It would be one thing if the renters had put the monthly rent money in escrow so that it would be available when the moratorium expired. That’s unlikely to have happened for more than a few of the six million families covered by the program.
A three or four-month moratorium on eviction starting in April 2020 might have made some sense. But running the program for 15 months with no plan for a smooth exit has led to another crack-up for an economy still not up to speed.
Landlords Have Bills to Pay Too
People naturally sympathize with the renters who were affected by COVID. However, little consideration is given to landlords. Many landlords have mortgages and had to pay principal and interest to banks, plus maintenance and property taxes while their tenants were paying no rent.
Now those landlords want to collect the back rent in order to get caught up on their own obligations. Many tenants just don’t have the money. What comes next is a wave of evictions.
This will put an enormous number of Americans out on the street looking for new places to live without much money in their pockets. It could also lead to a depressed housing market in certain cities as a surge of rental properties comes on the market while people are fleeing the cities to move to suburbs or more attractive states like Florida.
This will be one more headwind for the economy, as both tenants struggle with housing costs and landlords struggle with a surplus of property for rent. It’s one more example of the unintended consequences of government intervention.
Of course, the stock market is still in bubble-land and in denial about all of this technical data. That won’t last. The stock market may continue to float for another month or two, but by October, a severe correction may be in the cards as new data make it impossible to ignore reality.
Regards,
Jim Rickards
for The Daily Reckoning
<<<
>>> This underperforming part of the stock market should be a red flag to investors
Yahoo Finance
Brian Sozzi
July 15, 2021
https://finance.yahoo.com/news/this-underperforming-part-of-the-stock-market-should-be-a-red-flag-to-investors-172603429.html
While the S&P 500 and Dow Jones Industrial Average have continued to power to new highs seemingly everyday this summer, the small-cap Russell 2000 Index has been OK with sitting the dance out completely.
After peaking in March, strategists at Renaissance Macro Research note the Russell 2000 Index is now at new year-to-date relative lows versus the S&P 500. Over the last six months, the Russell 2000 Index — which houses smaller U.S. focused companies — is up a mere 1.9%. The S&P 500 and Dow have rallied to the tune of 15% and 10%, respectively.
"The divergence is notable, and we are starting to see bearish interval signals develop," says RenMac strategist Jeff deGraaf.
Underneath the hood of the Russell 2000, the trends are perhaps even more alarming.
Only 62% of Russell 2000 issues are trading above their 200-day moving average, RenMac notes. Roughly 27% of small-cap pharma and biotech stocks — which tend to dominate the Russell 2000 — are above their 200-day moving averages.
The relative underperformance of the Russell 2000 Index could be viewed as a red flag for market bulls.
In effect, the message from the small-caps may be that U.S. economic growth is poised to slow into the end of the year amid the spreading COVID-19 Delta variant and elevated inflation. Whereas these macro effects would initially harm profits at smaller companies the most, bottom lines at bigger companies that comprise the S&P 500 would hardly be immune (and by extension, neither would-be investors).
For now, RenMac's deGraaf believes it's safe to long the Russell's underwhelming posture. But the index warrants greater attention among investors moving forward.
"We’ll need to see further internal deterioration and a break below absolute support before turning outright bearish on the index. Until then, the way we would be playing this neutral outlook in small-caps is by focusing on owning relative breakouts and leadership while cutting loose relative breakdowns. We also see opportunity for pair trading large-cap longs vs small-cap shorts," deGraaf says.
<<<
Equal Weighting + Reverse Indexing the S+P 500 -
>>> S&P ETF Fortunes Reverse In 2021
ETF.com
Jessica Ferringer
June 23, 2021
https://finance.yahoo.com/news/p-etf-fortunes-reverse-2021-163000936.html
While FAANG stocks have lost much of the bite that drove the S&P 500 outperformance last year, that doesn’t mean S&P 500 ETFs are being held hostage by a handful of tech stocks.
ETFs with alternative strategies that don't mirror market cap weighting are outperforming the traditional S&P 500 Index. This reverse indexing, if you will, is having a significant impact on returns this year.
The SPDR S&P 500 Trust (SPY) is the largest ETF by assets under management, with more than $353 billion in assets. One alternative to the market-cap-weighted SPY is the Arrow Reverse Cap 500 ETF (YPS). This fund weights holdings inversely to their market cap, allocating more weight to the smaller members of the index.
What Drives Performance
By using our ETF Comparison Tool, we can see that the difference in weighting schemes can have a significant impact on portfolio characteristics for each ETF.
The market-cap-weighted SPY leans heavily toward technology, at more than 33% of the portfolio. Meanwhile, YPS has the greater exposure to financials, with tech making up just 12% of the portfolio.
The difference in the number of holdings between the two funds can be explained through their investment strategies. Per SPY’s prospectus, “minor mis-weighting generally is permitted” if transaction costs would exceed the expected impact.
YPS has a similar disclaimer within its prospectus, noting that the fund will generally use a replication strategy, but may use a representative sampling strategy. This means the fund can invest in a sample of the securities of the index as long as the fund remains aligned with the risk, return and other characteristics of the index as a whole.
This can lead to a discrepancy in the number of holdings compared to the index, especially for the smallest holdings, with minimal impact on returns.
SPY Vs. YPS 2020
But performance is where the rubber meets the road, and a look at the last two years is a tale of two different return sets. With these differences in portfolio composition, it is not surprising that SPY outperformed YPS in 2020 by more than 10%.
The largest names in the index, such as Apple, Microsoft and Amazon, vastly outperformed the S&P 500.
Financials, on the other hand, underperformed the broad market, as companies such as banks were battered by falling interest rates, punishing YPS more so than SPY because of weightings.
SPY Vs YPS 2021 YTD
However, 2021 has been a different story so far. Compared to YPS, SPY is underperforming this year as tech stocks have struggled. Some of the same companies that led the market last year are this year’s laggards.
Apple Inc. currently the largest holding in the S&P 500, has struggled to eke out a positive return for much of the year even though the broad index is up double digits. And as last year’s tech rally drove up the weighting to these holdings, it has further amplified the negative impact these names had on the portfolio as these companies have struggled.
Market Cap Matters
In addition to sector differences, performance has also been driven by market cap. Midcap names tend to be more sensitive to investor sentiment about the U.S. economy. On the other hand, the larger, multinational companies that make up a large portion of the S&P 500 are more sensitive to global growth expectations.
As the weighted average market cap of YPS is only slightly higher than that of many U.S. midcap ETFs, it stands to reason that this weighting methodology would do well in environments like the one we are in.
The U.S. is reopening faster than international countries, and the expected growth of the U.S. economy is projected to be faster than that of the rest of the world. That benefits midcap and small cap companies that derive the majority of their revenue in the U.S.
Another Way To Skin The S&P 500
In addition to market cap weighting and reverse market cap weighting, another way for investors to play this segment of the market is to use an equal-weight ETF such as the Invesco S&P 500 Equal Weight ETF (RSP) .
As the name suggests, this ETF gives equal weight to all constituents regardless of market cap. This reduces the exposure to the largest cap names but avoids tilting the portfolio toward the smaller cap names. RSP, too, is outperforming SPY.
Performance this year has been in between that of SPY and YPS, which is to be expected, as the weighting methodology ensures that neither larger nor smaller names are given precedence.
The Big Picture
Comparing these three ETFs since common inception, SPY still comes out ahead, even in light of its recent underperformance.
Though certain time periods might prove to be friendlier to alternative weighting methodologies, SPY’s performance so far remains on top over the long term, though data is limited since YPS’ launched less than four years ago.
SPY’s Clear Benefit: Cost
Though each weighting methodology has its pros and cons, SPY’s dominance in terms of AUM gives it one clear benefit. The ETF has an expense ratio of 0.09%—less than half the cost of the other options. And since it is so heavily traded, with an average daily volume of nearly $26 billion, the average spread is essentially 0.00%.
Compare that to YPS, with an expense ratio of 0.29% and average spread of 0.21%, and RSP, with an expense ratio of 0.20% and average spread of 0.01%, and you can see how SPY benefits from its sheer size.
Investors can control cost, which should be as much of a factor in investment selection as last year’s returns.
For more information on S&P 500 ETFs, check out our S&P 500 ETFs channel.
<<<
>>> Rickards: They’re Wrong About Inflation
BY JAMES RICKARDS
JUNE 23, 2021
https://dailyreckoning.com/rickards-theyre-wrong-about-inflation/
Rickards: They’re Wrong About Inflation
Sometimes new data can shed light on an uncertain situation, especially in financial markets. Other times it simply adds to the confusion. Such was the case with the most recent U.S. employment report released June 4 for the month of May.
The analyst world was glued to their news feeds, anxiously awaiting the latest report. The result was — bafflement.
The report showed job gains of 559,000. That’s a strong number, but it was below expectations. The market was looking for 670,000 jobs or higher. While strong April gains were revised up slightly, the stronger March gains had earlier been revised down by 131,000 jobs over the course of April and May.
The overall impact of the March-April-May data was a cooling off in new job creation.
The unemployment rate for May declined from 6.1% to 5.8%. That sounds like good news until you notice that the reason for the decline was not strong job creation but rather a decline in labor force participation.
That statistic declined from 61.7% to 61.6%; not a material drop, but still part of a long-term decline that has moved labor force participation back to levels not seen since the 1970s.
Simply put, the overall size of the labor force shrank.
The Glass Half Empty
You can be unemployed in the traditional meaning of the term without being counted as unemployed by the Labor Department. The difference has to do with whether you are actively looking for a job or not. Only the former are officially counted as unemployed. The problem is that the ranks of the latter are growing.
There are always some in the prime-age working population (ages 25 – 54) who are not looking for jobs because they are homemakers, students, early retirees, or are undergoing various life transitions. Still, the percentage of potential workers who have dropped out of the labor force is disturbingly high.
Some have given up looking for jobs because they’re sure they can’t find any that match their skills or interests. Others are content to collect the generous unemployment benefits the government keeps handing out. Some are still living in fear of COVID and don’t want to return to the workplace.
I’m not passing judgment; I’m just making the point that a low unemployment rate doesn’t mean much when it’s driven by a low labor force participation rate.
We have an army of perhaps ten-to-twenty million prime-age workers who don’t have jobs and aren’t looking. As long as that slack in the labor market is out there, the official unemployment rate doesn’t tell the whole story.
So, the bottom line on the May employment report was, meh. It wasn’t horrible, and it wasn’t great. It did point to persistent slack in labor markets and possible slowing growth. It did not point to inflation or anything close.
The Inflation Narrative
Since late last summer, the main driver of rates has been an inflation narrative. The narrative is straightforward:
The economy is recovering. Unemployment is declining. Employers can’t find enough workers. Wages are going up to attract help. Stimulus spending is coming by the trillions of dollars. The Fed is printing money. The economy is pushing up against capacity constraints.
Add it all up, and inflation is right around the corner. Therefore, rates must go up. And when rates go up, the price of gold goes down.
Markets have adopted this narrative. The yield-to-maturity on the 10-year Treasury note went from 0.508% on August 4, 2020 (about when gold peaked) to 1.745% on March 31, 2021. Gold prices went from over $2,021 per ounce to $1,686 per ounce over the same period. That’s a 16.5% drop in gold prices.
What if every part of the economic narrative is wrong?
The Numbers
The economy was bound to recover from the pandemic recession of 2020, the worst since 1946. But, it appears the recovery is now running out of steam. For the record, the economy was weak before the pandemic hit.
What if that weak growth trendline is now returning to form?
The unemployment rate is declining, but real unemployment is not. We still have 7.6 million fewer jobs than before the pandemic, not counting the 10 million or more prime-age workers out of the labor force as described above.
It’s true that wages are going up in some service industries such as restaurants and that workers are hard for some businesses to find. (McDonald’s is now offering $35,000 per year plus benefits and training for entry-level hires).
Still, overall wage levels are not rising significantly, and slack in the labor market is producing a powerful disinflationary overhang.
It’s the Velocity, Stupid
Money printing is practically irrelevant because the velocity (or turnover) of money is still declining. What good is new money if the banks just give it back to the Fed as excess reserves, so the money is never spent or lent?
Fiscal policy and handouts are not producing stimulus because debt levels are so high (the U.S. debt-to-GDP level is now 130%, the highest ever). Americans respond with precautionary savings and deleveraging.
Data shows that 75% of the government handouts have either been saved or used to pay down debt (economically the same as saving). Only 25% have been used for consumption. That’s a pathetic amount of bang-for-the-buck.
We are seeing some supply-chain disruption and capacity constraints, especially in semiconductors, which affects automobile manufacturing. Still, manufacturers have not been able to pass through those constraints in the form of higher consumer prices.
Inflation remains low once base effects from last year’s deflation are stripped out. Those base effects will disappear in the third quarter when the year-over-year comparison looks at the 2020 recovery rather than the recession.
Inflation is dead in the water.
I know that analysis puts me in the minority, but that’s OK; I’m used to that. I was also in the minority when I predicted Brexit and that Trump would win the 2016 election. The bottom line is, the consensus is often wrong.
Look to the Bond Market
The bond market already senses this, and so does gold. Rates peaked on March 31 and have been coming down since, albeit with the usual volatility. The rate on the 10-year Treasury note is 1.487% as of this writing, some 0.20% below the peak.
That’s a huge drop given how low rates are overall. The bond market is signaling that the inflation narrative is wrong.
Gold is saying the same thing. Gold hit an interim bottom of $1,678 per ounce on March 8, 2021, and has been trending up ever since. Gold is trading at $1,774 per ounce today and had a recent interim high of $1,918 per ounce on June 1, 2021.
Again, gold is signaling that the narrative is wrong, growth is slowing, and rates are coming down. That makes gold more attractive to asset allocators because gold competes with notes for investor dollars.
Stocks are forward-looking in theory, but they do an awful job of getting the forecast right in practice. Stocks missed the coming crashes of 2000, 2007 and 2020. They’ll miss the next crash too (until it’s too late to get out whole).
Bonds and gold are much better indicators of where the economy is going.
The signals are clear. The economy is slowing, labor markets are weak, disinflation and even deflation are on the horizon, rates are going down, and gold prices are at a great entry price.
Reality is catching up with the narrative. If you understand what’s going on, you’re more informed than the “experts.”
Regards,
Jim Rickards
for The Daily Reckoning
<<<
>>> Fed Shocks Stocks With Blow to Dreams of Value Investor Nirvana
Bloomberg
By Katherine Greifeld and Vildana Hajric
June 18, 2021
https://www.bloomberg.com/news/articles/2021-06-18/fed-shocks-stocks-with-blow-to-dreams-of-value-investor-nirvana?srnd=premium
Hawkish Fed tilt delivered ‘gut check’ to value trade: Lerner
Large-caps best equal-weighted index by most since January
All it took was a few dots from the Federal Reserve to put the nascent value-stock revival in doubt.
Cyclical companies tied to reopening and reflation bore the brunt of the reversal, posting some of the worst returns of the year this week, while the Nasdaq 100 emerged -- as it did in 2020 -- as a beneficiary. Volatility broke out in equities following Wednesday’s Fed decision, where policy makers projected raising interest rates twice by the end of 2023. The tech rally was accompanied by a violent flattening of the 5-year to 30-year Treasury yield curve, which narrowed by the most since 2011 on a weekly basis.
Fueling the action is the idea that the Fed -- contrary to the narrative of the last few months -- won’t actually allow the U.S. economy to run too hot for too long. That drove long-term inflation expectations lower, delivering a harsh blow to cyclical sectors, with financials and energy bringing up the rear. It also sent value-investing diehards back into retreat, just six months into what was thought to be their long-awaited renaissance.
“You’re getting a bit of a gut check for the value trade. You have these sectors that have really outperformed, it was an area of the market that got crowded and you saw that tech became under-loved,” said Keith Lerner, the chief market strategist at Truist Advisory Services. “That means you get more vulnerable to unexpected news -- even though it was a marginal shift from the Fed -- I think that was a catalyst to exacerbate the rotation.”
Nasdaq 100 advances for five straight weeks
The Nasdaq 100 rose 0.4% en route to its longest weekly winning streak since last August. Every other major stock benchmark fell, with the Dow Jones Industrial Average -- populated primarily by value names -- dropped 3.5% in its worst weekly showing since January.
That shifting appetite is evident in exchange-traded fund flows as well. The $170 billion Invesco QQQ Trust Series 1 ETF (ticker QQQ) absorbed $3.9 billion through Thursday, on pace for its best week of inflows since September. Meanwhile, the $82 billion Vanguard Value ETF (ticker VTV) suffered its biggest one-day outflow since January in the wake of the Fed meeting.
The reversal to mega-cap tech companies narrowed the number of potential market winners. That was illustrated this week by the outperformance of capitalization-weighted versus equal-weighted indexes, which was the biggest since September. Such concentrations were the rule in 2020 and threaten to end a brief revival in the fortunes of active stock managers, who feast when rally participation is broad.
In the first half of 2020, fears of rapidly rising inflation knocked tech stocks from their top spot as investors fretted that higher yields would sully growth names. Meanwhile, energy and financials boomed as bets built that red-hot economic growth would breathe life into cyclical sectors.
Tech-heavy QQQ is on pace for best week of inflows since September
That worked for a while, but the calculus abruptly shifted on Wednesday. St. Louis Fed President James Bullard accelerated the move on Friday, backing an even-earlier liftoff than current Fed projections, seeing the central bank beginning to hike rates in late 2022.
“At the long-end, bond yields tumbled lower as bond traders unwound their reflationary, curve-steepening bets,” said Candice Bangsund, vice president and portfolio manager at Montreal-based Fiera Capital Corp. “Investors are once again questioning the outlook for inflation and growth given the Fed’s expedited timeline for rate hikes, with performance leadership rotating from cyclical-value.”
<<<
>>> Gundlach: The Fed has been manipulating markets for a long time
Yahoo Finance
Julia La Roche
May 17, 2021
https://finance.yahoo.com/news/gundlach-on-the-markets-and-opportunities-144019630.html
Billionaire bond investor Jeffrey Gundlach, founder and CEO of $135 billion DoubleLine Capital, says, "the Fed has been manipulating markets for a long time," and on top of that, valuations have crept up thanks to "incredible amounts" of stimulus.
"We've had a relationship between the Fed growing its balance sheet and the value of the S&P 500 (^GSPC) that's been in place for years now ever since they started quantitative easing, and it's almost like a law of physics. It's like if you take the capitalization of the S&P 500 and you divide it by the Fed's balance sheet, it looks a lot like a constant," Gundlach said in a wide-ranging interview with Yahoo Finance from the firm's investor days.
The 61-year-old bond investor added that even though the stock market is high by historical comparisons, it looks below average in terms of its valuation versus bonds, which have a very low yield relative to inflation, Gundlach explained.
On Wednesday, the Bureau of Labor Statistics reported that the Consumer Price Index (CPI) jumped 0.8% in April compared to March, well ahead of economists' expectations. Excluding food and energy, core inflation rose 0.9% last month, the largest monthly increase since 1982. Moreover, on a year-over-year basis, headline consumer prices surged by faster-than-expected 4.2% in April, the largest gain since September 2008.
The latest CPI print was higher than DoubleLine predicted. Gundlach said DoubleLine Capital's model suggests inflation "is probably going to go higher in the next couple of months" and might peak in July.
"If we keep going higher from there, then I think people are going to be seriously worried because the concept of transitory has everything to do with what they call the base effects," Gundlach said.
Gundlach later said he believes "we're one really bad day away from going to a new high yield on the 30-year" Treasury bond, where yields have been creeping up in the face of the recovery. "I think that that's something to watch out for as a risk factor."
In terms of opportunities, Gundlach, who had been "very bullish" on commodities, said they "look overextended."
"I think we're going to be taking a pause in the short term, probably, on commodities," he said.
Gundlach thinks the U.S. dollar "might have a little bit of strength for the rest of the year."
Since January, the bond investor's recommendation he's held floating-rate corporate debt, like bank loans, like the Invesco Senior Loan (BKLN) ETTF.
BKLN was "having nothing but outflows during 2020 because people thought interest rates were going to be at zero for the rest of their lifetime, but now they're starting to factor in the idea that maybe interest rates even on the short end will ultimately go up. And the bank loans actually yield about the same as longer duration or longer maturity below other investment-grade credit. So I kind of like that."
DoubleLine also recently purchased European stocks for the first time.
"We never owned any European stocks. We hated them. We didn't like their negative interest rates. We thought they're all kinds of structural problems in the eurozone."
DoubleLine's longer-term view is for the dollar to move lower, which will bode well for European equities.
"They've performed this year exactly the same or slightly better than U.S. stocks. That's another one of these trends that seems to be changing. Just like the Nasdaq (^IXIC) is no longer outperforming the S&P 500, suddenly, non-U.S. stocks are not lagging anymore. They are in Japan and in China, but not in Europe. Europe is actually slightly outperforming. That's another sigh.
While it's still too early, Gundlach likes emerging market equities in the longer term.
<<<
>>> Could the Fed Actually Be Right?
BY JAMES RICKARDS
MAY 17, 2021
https://dailyreckoning.com/could-the-fed-actually-be-right/
Could the Fed Actually Be Right?
You can’t have it both ways, but that doesn’t mean you can’t try. That’s what Joe Biden is doing right now.
On the one hand, Biden policies are, at least, partly responsible for the recent rise in unemployment and might be largely responsible.
They’re also responsible for the inability of employers to hire employees so they can reopen their businesses and return to full capacity. If that sounds like a contradiction, it’s not.
The unemployment rate is rising, and job losses are still high. In addition to those actually counted as unemployed, there’s a huge group of Americans, perhaps ten million or more individuals, who don’t have jobs but are not technically counted as unemployed because they’re not looking for jobs.
There are always some people in this category who may be retired, homemakers, students or have other duties that keep them out of the workforce. But that does not account for the steep decline in labor force participation in recent years.
So, if unemployment is high and labor force participation is low, why are employers having difficulties finding employees?
Why Work When You Can Make More Sitting at Home?
There are literally millions of able-bodied Americans between the ages of 25-59 who are sitting around without jobs. Why won’t they take the jobs being offered?
The reason is that millions of Americans make more money on unemployment and other benefits than they could make working. Unemployment benefits have been increased and extended with a $300 per week supplement on top of regular benefits.
Other benefit programs come into play, including childcare tax credits, low-income tax credits, Obamacare credits, etc. It’s not difficult to make up to $40,000 per year with such benefit programs (and with very low tax liabilities).
Why work for McDonald’s or Walmart for $31,200 per year (that’s a full-time job at $15.00 per hour with benefits and training) when you can get $40,000 per year to stay home?
People can do the math, and they choose to stay home. And by the way, you can expect to pay more for a McDonald’s hamburger if they’re going to pay entry-level workers $15 per hour. They’ll try to pass along their increased labor costs to customers, as businesses generally do.
One way to solve this problem is to cut the benefits and programs. Then people would take up the job openings available, and the country would move closer to self-sustaining growth.
Instead, Biden is proposing more “rescue” benefits, continued high unemployment payouts and other goodies that gave rise to the labor shortage in the first place.
Biden’s plan will be a headwind to growth in the year ahead. But it’s music to the ears of the progressives, who are actually in charge behind the scenes, calling the shots.
Inflation: The Biggest Financial Story Today
Economists had expected over one million jobs to be created in April. The actual number was 266,000, and March’s numbers were revised lower.
Do last month’s woeful unemployment numbers undercut the mainstream theory that falling unemployment will lead to inflation?
The biggest financial story today is fear of inflation. Inflation has spooked the bond market and raised expectations that the Fed will soon have to raise interest rates to fight inflation.
Any increase in rates will also hurt stocks because stocks and bonds compete for investor dollars. If yields on bonds go up, prices on stocks will go down.
Growth stocks, like many leading tech stocks, are especially vulnerable to inflation because much of their valuation comes from future earnings. As inflation rises, the present value of their futures earnings can fall dramatically.
There’s no doubt that inflation expectations have been rising. This is especially true after a spike in the reported CPI core and non-core data on May 12. This inflation spike roiled the bond markets.
From the low yield of 0.508% on August 4, 2020, the 10-year note yield peaked at 1.745% on March 31, 2021, and hit a recent peak of 1.704% on May 13 (intraday) on the CPI news before backing down a bit to the current level (1.640%).
The dollar price of gold moved down in lockstep as the yield on the 10-year note rose. Still, there’s less than meets the eye in the recent increase in rates.
“Transitory”
As recently as November 4, 2018, the yield on the 10-year note was 3.238%. On November 4, 2019, the yield was 1.942%. The fact is today’s “high yields” are actually quite low and are much lower than the two interim peaks of the past three years.
In fact, real inflation is as elusive as it’s been for over a decade.
The surge in CPI reported on May 12 was driven predominately by base effects and energy prices. The Fed isn’t right often, but in this case, I believe they got it right. Year-over-year price gains off the low 2020 base are to be expected.
April 2020 marked one of the steepest output declines in U.S. history. Consumer prices plunged. In April 2021, many of those prices recovered, especially in travel, airfares, hotels, restaurants and other services that were almost completely shut down in 2020.
They are also transitory because the 2020 output collapse was transitory. As we move into the third quarter of 2021, the new base will reflect the strong growth in Q3 2020. That’s a much steeper hill to climb for inflation metrics.
Inflation will come down sharply, and the ten-year note yield will come down with it. Gold will rally, and stocks will breathe a sigh of relief.
This does not mean all is well in the stock market. Bubble dynamics persist, although it’s impossible to know exactly when a bubble will burst.
But, at least in the short run, inflation fears are a false alarm. Inflation will arrive eventually, maybe in 2022 or later, but for now, the disinflationary dynamic is fully intact.
Don’t believe the hype.
Regards,
Jim Rickards
for The Daily Reckoning
<<<
>>> Billionaires Are Selling Mega-Sized Stock Blocks After Surge
Bloomberg
By Devon Pendleton and Benjamin Stupples
May 14, 2021
https://www.bloomberg.com/news/articles/2021-05-14/wealthy-insiders-reap-24-billion-by-cashing-in-their-stock?srnd=premium
Corporate insiders sold $24.4 billion of shares this year
Brin’s Alphabet sales were his first disposal in four years
Corporate insiders including Amazon.com’s Jeff Bezos and Google co-founder Sergey Brin have ramped up stock sales recently, cashing in on a 14-month long bull market that’s helped boost fortunes to the tune of trillions.
U.S. public company insiders offloaded shares worth $24.4 billion this year through the first week of May, with about half sold through trading plans, according to data compiled by Bloomberg. That’s almost as much as the $30 billion total they disposed of in the second half of 2020.
Large shareholders frequently sell stock in planned intervals, often through pre-arranged trading programs. Yet the prolonged rally in equities markets has made the value of these disposals, whether planned or opportunistic, strikingly high.
There are multiple reasons an investor of any size might be motivated to sell. After the pandemic-defying rally, valuations are increasingly under pressure from rising inflation. Investors are wary the post-Covid recovery could prompt tightening measures from the Federal Reserve. And President Joe Biden’s proposed tax hikes -- including a near doubling of the capital gains rate -- have created uncertainty.
Bezos, Ellison
Whatever the reason, the sales are flooding the market with yet more liquidity, the consequences of which will ripple through philanthropy, the art market, real estate and other niches.
Bezos has sold $6.7 billion worth of Amazon shares this year. While a relative pittance for the world’s richest person, it’s more than two-thirds the value of shares he sold in 2020. Larry Ellison unloaded 7 million Oracle shares in the past week for total proceeds of $552.3 million. Charles Schwab has sold $192 million worth of shares of his eponymous brokerage this year.
Brin, who has signaled that he intends to sell as many as 250,000 Alphabet Inc. shares, has disposed of $163 million worth of stock in recent days, his first sales in more than four years, filings show.
Mark Zuckerberg and his charitable foundation, the Chan Zuckerberg Initiative, meanwhile, accelerated their sales of Facebook stock in the fall. Zuckerberg or his charity has divested shares at a near-daily clip since November, for a cumulative total exceeding $1.87 billion.
The surging markets have exacerbated the concentration risk of the single-stock-dominated fortunes typical of many tech billionaires, said Thorne Perkin, president of Papamarkou Wellner Asset Management.
“From a portfolio-management perspective, it makes sense to spread it around,” he said.
Also among the biggest sellers are some noteworthy beneficiaries of the Covid economy. Zoom Video Communications founder Eric Yuan and used-car retailer Carvana Co.’s Ernest Garcia II have together received more than $1.75 billion from stock sales since March 2020, according to the Bloomberg Billionaires Index. George Kurtz, chief executive officer of cybersecurity firm CrowdStrike, has sold shares worth at least $250 million over that period.
Eric Yuan
Zoom founder Yuan -- the poster child, in many ways, for the coronavirus economy -- has stepped up his sales this year as the firm’s share price slumped. In 2020, he typically offloaded about 140,000 shares a month through a trading plan, which generated more than $350 million over the course of the year.
Since March, he’s sold almost 200,000 shares a month on average, yielding him about $185 million. He also donated more than a third of his stake in the San Jose-based company as part of “typical estate planning practices,” according to a spokesman. Some of the cash from his share sales fund donations to unspecified “humanitarian causes.”
<<<
>>> I Put Half Of My Net Worth Into These Hard Asset Investments
Seeking Alpha
Nov. 14, 2020
by Jussi Askola
https://seekingalpha.com/article/4388468-i-put-half-of-net-worth-hard-asset-investments
Summary
Most investors put their net worth in financial assets like stocks, bonds and cash.
I prefer to invest mine in hard assets.
You can get exposure to hard assets through publicly-traded vehicles.
Below I explain why I have 60% of my net worth in hard assets, and why you should do the same.
Most investors have the vast majority of their net worth in financial assets. Typically stocks, bonds and cash. These assets are extremely easy to invest in, which explains their popularity. But they come with a lot of downside too. From volatility to returns that barely beat inflation, they come with various disadvantages, depending on which asset class you’re talking about.
Let’s take each of the three most popular financial assets one by one.
Cash. This is like throwing money down the drain. The average savings account has only a 0.06% interest rate according to the FDIC. With inflation running at 2%, you’re losing purchasing power at that rate.
Bonds. They pay nothing or next to nothing after inflation and taxes. They’re better than cash, don’t get me wrong. But all you’re doing with bonds is maintaining your net worth, you’re not growing it. Long-term corporate bond ETFs (VCLT - BLV) yield just around 3%.
Stocks. Stocks tend to outperform cash and bonds over time. But they’re extraordinarily complex. To truly understand a stock, you need to understand all the moving pieces of a business that may have dozens of subsidiaries, subsidiaries with subsidiaries of their own, foreign operations, and more. And the risk is significant. Putting a large chunk of your net worth in the next Enron is a sure way to evaporate your savings. Finally, today's valuations are astronomically high with the S&P 500 (SPY) trading at 36x earnings, which is over 2x its historical average. Put differently, stocks are now priced at a 2.7% earnings yield even as we go trough a major crisis:
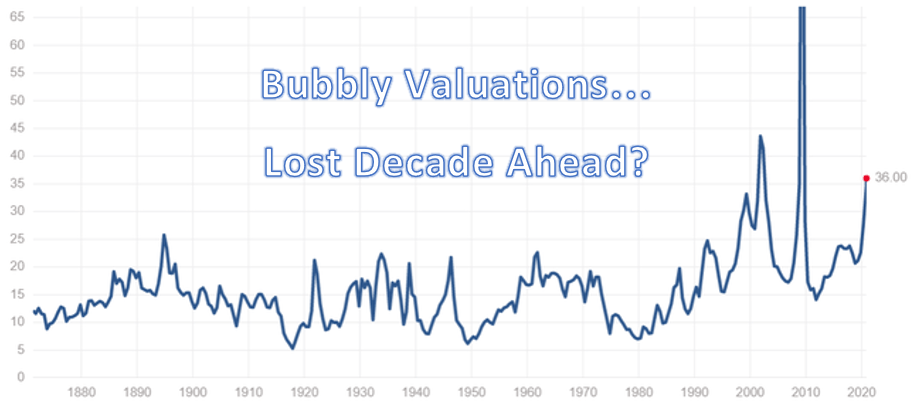
So, if all of the above assets have major problems with them, where do you put your net worth?
Hard Assets.
“Hard assets” is a term for tangible assets that have physical substance. Hard assets physically exist in the world and typically have some practical real-world use. The total list of hard assets would be far too long to reproduce here. But some good examples include:
Real estate.
Pipelines.
Farmland.
Timberland.
Airports.
Toll roads.
Other miscellaneous types of infrastructure.
All of these assets fulfill a real-world need and therefore often have stable, dependable cash flows. Not all hard assets are equal in terms of their income potential. Some are more dependable than others. But as a class, they offer high yield with relatively lower risk.
You might say: “sure, hard assets are good, but I can’t afford a second mortgage… so how do I get my exposure?”
The answer is simple: Through publicly-traded vehicles like REITs. REITs trade on exchanges like stocks but are built on portfolios of hard assets. They typically have mandates specifying that they pass a certain amount of their net income on to investors in the form of dividends. And they’re run by management teams, so you don’t need to worry about physically managing the properties yourself. By buying REITs and other REIT-like entities, you can get quick exposure to a diversified portfolio of hard assets. This is where I have over half of my net worth today, and I don’t plan on changing that any time soon.
Why Favor Hard Assets Over Stocks, Bonds, and Cash?
Reason #1: Yield
The cold hard truth is that there’s just not a lot of yield out there these days. The 10-year Treasury yields a minuscule 0.83%, while the SPDR S&P 500 ETF (SPY) yields 1.6%. The Nasdaq, meanwhile, is lagging both: The Invesco QQQ Trust ETF (QQQ) yields just 0.51%. In this market, the yield is hard to come by.
Unless that is, you look into REITs. REITs as measured by the Vanguard Real Estate ETF (VNQ) yield around 4%. That’s the market as a whole. Individual REITs can yield anywhere from 6% to 8%. If you’re really adventurous, you can find REITs yielding as much as 10%.
Our Core Portfolio is heavily invested in REITs and other hard assets. We target an ~8% yield a ~75% payout ratio. Generally, our actual portfolio yield and payout ratio are close to these targets.
Reason #2: Higher Total Returns
It’s possible to generate very high total returns with hard assets. If you buy real estate with a 6%-7% cap rate and finance half at 3%-4%, you get a 10% yield. That’s a strong return even with no price appreciation in the equation. Throw in a modest 2%-3% annual gain in there, and you’ve got a 15% a year investment.
You can do the same by buying hard assets through REITs and other publicly traded hard asset companies. Case in point: Brookfield Asset Management (BAM). Over the past 30 years, it has earned a 16% annualized return, compared to just 7% for the S&P 500.
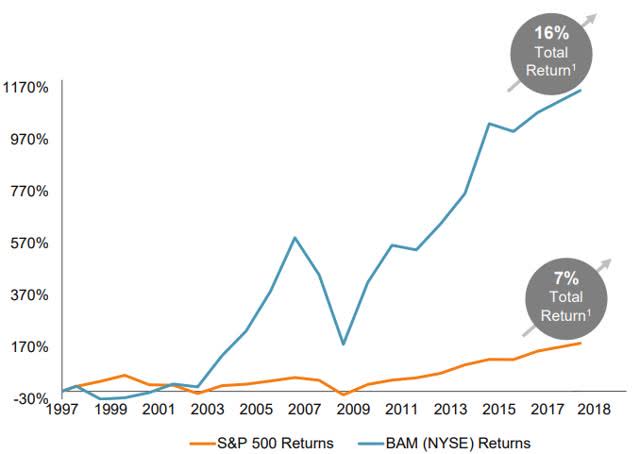
Another example: Realty Income (O) has nearly quadrupled the returns of the S&P500 since its IPO in 1994:
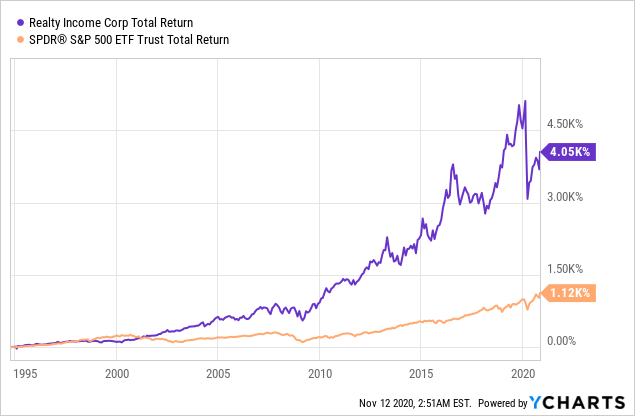
On average, REITs have outperformed nearly every other asset class over the past 20 years leading up the COVID-19 crisis. When you earn high dividends, not much growth is needed to earn double-digit total returns:
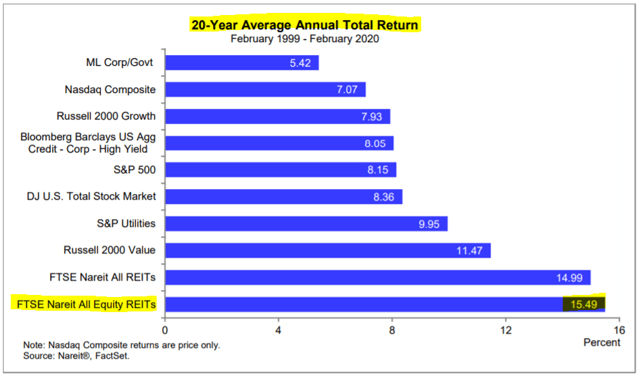
Reason #3: Valuation
Finally, we get to valuation. The sad truth about the markets these days is that steep valuations are starting to become the norm. The vast majority of tech stocks trade at more than 10 times book value. Big players like Netflix (NFLX) and Amazon (AMZN) trade at anywhere from 70 to 120 times earnings. These kinds of valuations can’t persist forever. Even with strong earnings growth, it’s hard to justify a 120X multiple. And with tech making up an ever-larger percentage of the S&P 500’s market cap, we’re really talking about “stocks” as a whole here.
Hard assets, by contrast, are cheap relative to cash flow at the moment, particularly if you get your exposure through REITs. In many cases, REITs are down for the year in 2020, and priced at up to 50% discounts to the underlying value of their assets. To be sure, REITs ran into some collections problems that dampened earnings early in the pandemic. But they’re beginning to turn that around even as valuations remain opportunistic.
Smart Money is Rushing into Hard Assets
If you want to know where to invest, you need to look at where institutional investors are putting their money. Institutional investors own about 80% of the public equity market, and a growing share of investments in hard assets.
That institutional investors are increasing in clout is obvious. From 2008 to 2018, institutional capital nearly tripled. It’s expected to rise to $100 trillion by 2030.
That a large share of this capital is going into hard assets also is evident. Many pension funds and other big institutions favor yield in their portfolios as income is paramount for institutions with regular cash expenses. As mentioned above, there’s barely any yield these days in stocks and Treasuries. So yield-hungry institutions will likely move into hard assets in the years ahead. That may include direct investments as well as positions in REITs.
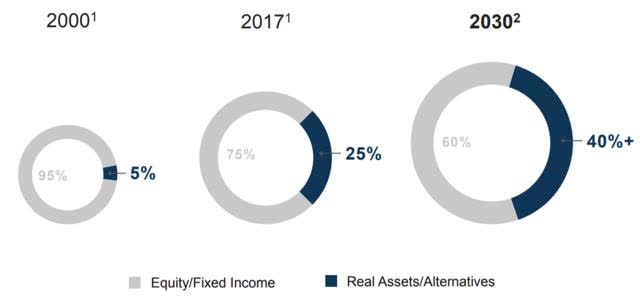
How to Profit from Hard Assets
Once you’ve decided you want exposure to hard assets, there are several asset classes you can look into. In no particular order:
Commercial real estate. Investments in apartment communities, e-commerce warehouses, data centers, or even casinos. AvalonBay Communities (AVB) and Digital Realty (NYSE:DLR.PK) would be classic examples.
Airports. Believe it or not, there are publicly-listed airports you can buy today on equity markets. Grupo Aeroportuario del Pacifico (PAC) is an example of one.
Timberland and farmland. You can invest directly in Timberland and Farmland through LPs and REITs like Gladstone Land (LAND) and Catchmark Timber (CTT).
Energy pipelines. Companies that transport oil and gas by pipe systems. Examples include the 10%-yielding Enterprise Product Partners (EPD) and Energy Transfer (ET).
Windmills. You can invest in alternative energy projects through partnerships like Brookfield Renewable Partners (BEP).
All of the hard assets listed above have high-income potential and have delivered steady growth over time. With a diversified portfolio consisting of these types of assets, you could outperform the markets.
That’s not to say there aren’t risks with hard assets. On the contrary, there are several you need to look out for. Retail REITs are vulnerable to industry trends like e-commerce, which has wreaked havoc on lower quality mall REITs CBL (CBL) and Washington Prime Group (WPG). Pipelines are subject to regulatory scrutiny and often find their projects delayed for long periods. Airports see revenue dip during recessions. The value of windmills decreases over time.
Because of these risk factors, you need to be careful about which hard assets you invest in. It’s not a simple matter of buying any hard asset and hoping it will deliver a good return. Nor is it as simple as buying a REIT ETF (VNQ) — with VNQ, you won’t get the 6%-8% yields mentioned earlier. Instead, you need to be selective and build a reasonably diversified portfolio of hard assets with the desired characteristics.
Our Hard Asset Portfolio
Over the years, we have built a portfolio of REITs and REIT-like entities that delivers on three key metrics:
High Yield
Low Payout Ratio
Substantial Discount to NAV
With this portfolio, we generate approximately $10,000 in annual income on just $160,000. You can see how this breaks down in the table below.
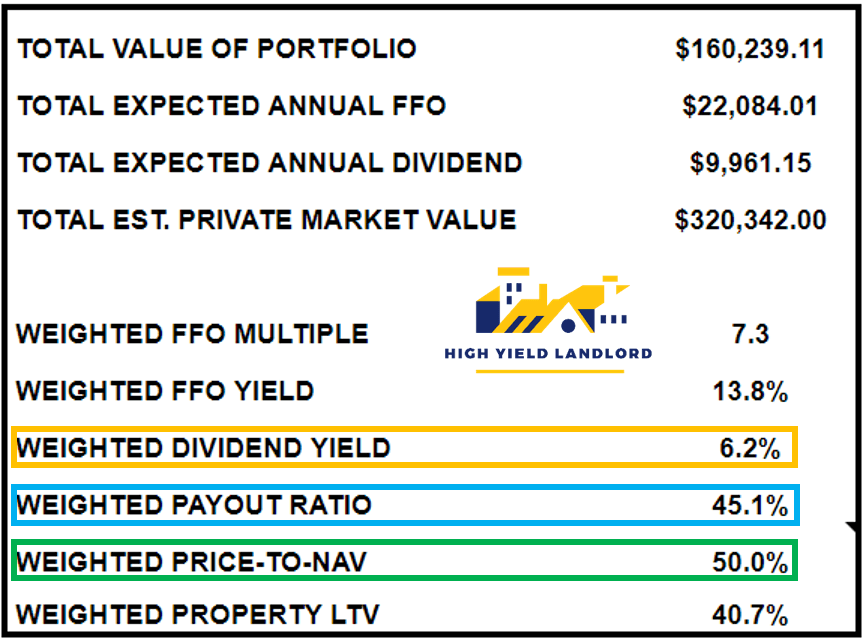
These are the characteristics of our Core Portfolio in November 2020. In today’s market, this is quite achievable. However, you may struggle to build a portfolio with these characteristics if you wait too long. With ultra-low interest rates, capital will flood into hard assets. Valuations will surge and yields will compress. Put simply, the smart money is getting into hard assets today — not waiting for tomorrow.
<<<
| Name | Symbol | % Assets |
|---|---|---|
| Apple Inc | AAPL | 3.23% |
| Microsoft Corp | MSFT | 2.88% |
| Amazon.com Inc | AMZN | 2.43% |
| Facebook Inc A | FB | 1.14% |
| Alphabet Inc Class C | GOOG | 0.78% |
| Alphabet Inc A | GOOGL | 0.77% |
| Johnson & Johnson | JNJ | 0.71% |
| Berkshire Hathaway Inc Class B | BRK.B | 0.68% |
| Procter & Gamble Co | PG | 0.62% |
| Visa Inc Class A | V | 0.61% |
| Volume | |
| Day Range: | |
| Bid Price | |
| Ask Price | |
| Last Trade Time: |


