


Wednesday, July 03, 2019 9:29:41 AM
>>> Sector investing using the business cycle
It may be possible to enhance returns over an intermediate time horizon.
FIDELITY VIEWPOINTS
5/31/2019
https://www.fidelity.com/viewpoints/investing-ideas/sector-investing-business-cycle?ccsource=email_weekly
Key takeaways
The business cycle can be a determinant of sector performance over the intermediate term.
The phases of the economy provide a framework for sector allocation.
For example, the consumer discretionary and industrials sectors tend to outperform in the early cycle.
Over the intermediate term, asset performance is often driven largely by cyclical factors tied to the state of the economy, such as corporate earnings, interest rates, and inflation. The business cycle, which encompasses the cyclical fluctuations in an economy over many months or a few years, can therefore be a critical determinant of equity market returns and the performance of equity sectors. This article demonstrates Fidelity’s business cycle approach to sector investing, and how it potentially can enhance returns over an intermediate time horizon.
Asset allocation framework
Fidelity’s Asset Allocation Research Team (AART) conducts economic, fundamental, and quantitative research to produce asset allocation recommendations for Fidelity’s portfolio managers and investment teams. Our framework begins with the premise that long-term historical averages provide a reasonable baseline for portfolio allocations. However, over shorter time horizons—30 years or less—asset price fluctuations are driven by a confluence of various short-, intermediate-, and long-term factors that may cause performance to deviate significantly from historical averages. For this reason, incorporating a framework that analyzes underlying factors and trends among the following 3 temporal segments can be an effective asset allocation approach: tactical (1–12 months), business cycle (1–10 years), and secular (10–30 years).
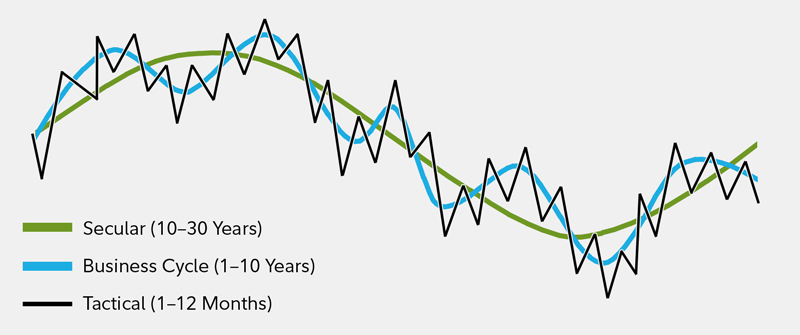
Asset performance is driven by a confluence of various short-, intermediate-, and long-term factors
This chart shows that asset performance is driven by a confluence of various short-, intermediate-, and long-term factors.
For illustrative purposes only. Source: Fidelity Investments, Asset Allocation Research Team (AART).
Understanding business cycle phases
Every business cycle is different in its own way, but certain patterns have tended to repeat themselves over time. Fluctuations in the business cycle are essentially distinct changes in the rate of growth in economic activity, particularly changes in 3 key cycles—the corporate profit cycle, the credit cycle, and the inventory cycle—as well as changes in the employment backdrop and monetary policy. While unforeseen macroeconomic events or shocks can sometimes disrupt a trend, changes in these key indicators historically have provided a relatively reliable guide to recognizing the different phases of an economic cycle. Our quantitatively backed, probabilistic approach helps in identifying, with a reasonable degree of confidence, the state of the business cycle at different points in time. Specifically, there are 4 distinct phases of a typical business cycle (see chart).
Early-cycle phase: Generally, a sharp recovery from recession, marked by an inflection from negative to positive growth in economic activity (e.g., gross domestic product, industrial production), then an accelerating growth rate. Credit conditions stop tightening amid easy monetary policy, creating a healthy environment for rapid margin expansion and profit growth. Business inventories are low, while sales growth improves significantly.
Mid-cycle phase: Typically the longest phase of the business cycle. The mid-cycle is characterized by a positive but more moderate rate of growth than that experienced during the early-cycle phase. Economic activity gathers momentum, credit growth becomes strong, and profitability is healthy against an accommodative—though increasingly neutral—monetary policy backdrop. Inventories and sales grow, reaching equilibrium relative to each other.
Late-cycle phase: Often coincides with peak economic activity, implying that the rate of growth remains positive but slows. A typical late-cycle phase may be characteristic as an overheating stage for the economy when capacity becomes constrained, which leads to rising inflationary pressures. While rates of inflation are not always high, rising inflationary pressures and a tight labor market tend to crimp profit margins and lead to tighter monetary policy.
Recession phase: Features a contraction in economic activity. Corporate profits decline and credit is scarce for all economic actors. Monetary policy becomes more accommodative and inventories gradually fall despite low sales levels, setting up for the next recovery.
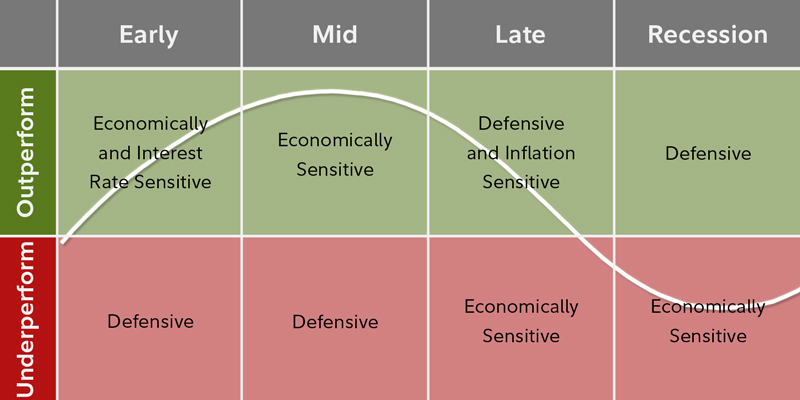
The performance of economically sensitive assets such as stocks tends to be the strongest during the early phase of the business cycle, when growth is rising at an accelerating rate, then moderates through the other phases until returns generally decline during the recession. In contrast, more defensive assets such as Treasury bonds typically experience the opposite pattern, enjoying their highest returns relative to stocks during a recession, and their worst performance during the early cycle.
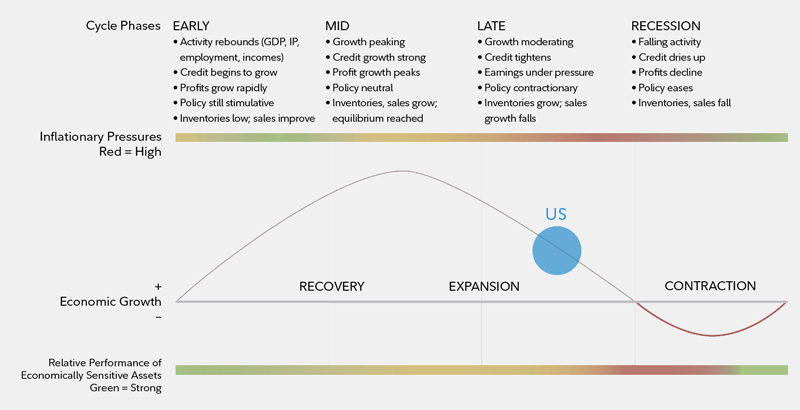
The business cycle has 4 distinct phases. The US is firmly in the late cycle as of 2019.
This graphic shows that the US is firmly in the late cycle as of 2019.
Note: The diagram above is a hypothetical illustration of the business cycle. There is not always a chronological, linear progression among the phases of the business cycle, and there have been cycles when the economy has skipped a phase or retraced an earlier one. Economically sensitive assets include stocks and high-yield corporate bonds, while less economically sensitive assets include Treasury bonds and cash. We use the classic definition of recession, involving an outright contraction in economic activity, for developed economies. Source: Fidelity Investments (AART), as of March 31, 2019.
Equity sector performance patterns
Historical analysis of the cycles since 1962 shows that the relative performance of equity market sectors has tended to rotate as the overall economy shifts from one stage of the business cycle to the next, with different sectors assuming performance leadership in different economic phases.1 Due to structural shifts in the economy, technological innovation, varying regulatory backdrops, and other factors, no one sector has behaved uniformly for every business cycle. While it is important to note outperformance, it is also helpful to recognize sectors with consistent underperformance. Knowing which sectors of the market to reduce exposure to can be just as useful as knowing which tend to have the most robust outperformance.
Early-cycle phase
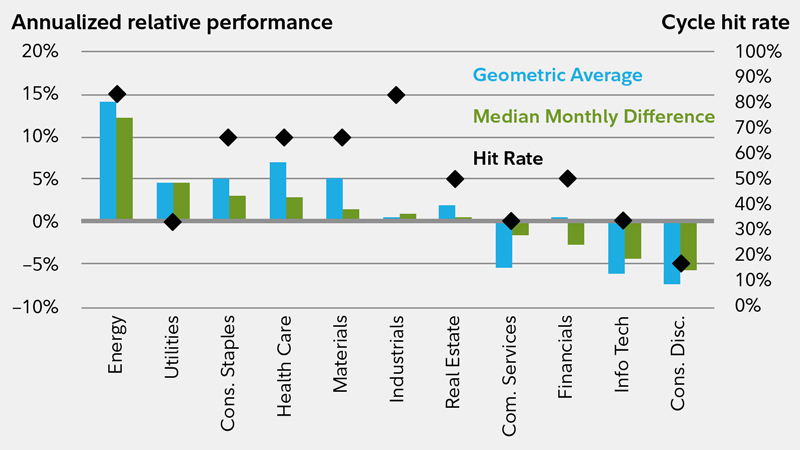
Historically, the early-cycle phase has featured the highest absolute performance. Since 1962, the broader stock market has produced an average total return of more than 20% per year during this phase, and its average length has been roughly one year. On a relative basis, sectors that typically benefit most from a backdrop of low interest rates and the first signs of economic improvement have tended to lead the broader market’s advance. Specifically, interest-rate-sensitive sectors—such as consumer discretionary, financials, and real estate—historically have outperformed the broader market (see chart). These sectors have performed well, due in part to industries within the sectors that typically benefit from increased borrowing, including diversified financials and consumer-linked industries such as autos and household durables in consumer discretionary.
Elsewhere, economically sensitive sectors—such as industrials and information technology—have been boosted by shifts from recession to recovery. For example, the industrials sector has some industries—such as transportation and capital goods—in which stock prices often have rallied in anticipation of economic recovery. Information technology and materials stocks typically have been aided by renewed expectations for consumer and corporate spending strength.
Laggards of the early-cycle phase include communication services and utilities, which generally are more defensive in nature due to fairly persistent demand across all stages of the cycle. Energy sector stocks also have lagged during the early phase, as inflationary pressures—and thus energy prices—tend to be lower during a recovery from recession. From a performance consistency perspective, consumer discretionary stocks have beaten the broader market in every early-cycle phase since 1962, while industrials also have exhibited impressive cycle hit rates. The financials and information technology sectors both have had healthy average and median relative performance, though their low hit rates are due in part to the diversity of their underlying industries. The communication services sector has historically underperformed in the early-cycle phase, but its evolving mix of industries provides less confidence in the persistence of this pattern moving forward.
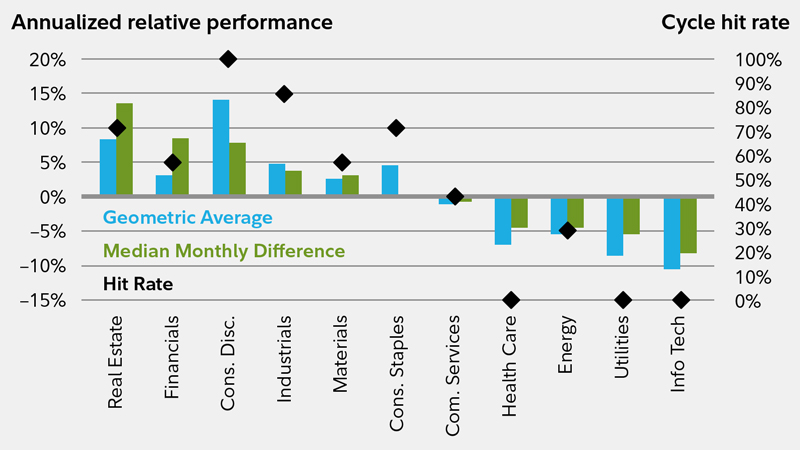
Sectors that have performed well in the early cycle are interest-rate sensitive and economically sensitive sectors
This chart shows sectors that have performed well in the early cycle.
Includes equity market returns from 1962 through 2016. Returns are represented by the top 3000 US stocks ranked by market capitalization. Sectors as defined by GICS. Source: Fidelity Investments (AART), as of March 31, 2019. Past performance is no guarantee of future results.
Mid-cycle phase
As the economy moves beyond its initial stage of recovery and as growth rates moderate, the leadership of interest-rate-sensitive sectors typically has tapered. At this point in the cycle, economically sensitive sectors still have performed well, but a shift has often taken place toward some industries that see a peak in demand for their products or services only after the expansion has become more firmly entrenched. Average annual stock market performance has tended to be fairly strong (roughly 15%), though not to the same degree as in the early-cycle phase. In addition, the average mid-cycle phase of the business cycle tends to be significantly longer than any other stage (roughly 3.5 years), and this phase is also when most stock market corrections have taken place. For this reason, sector leadership has rotated frequently, resulting in the smallest sector-performance differentiation of any business cycle phase. No sector has outperformed or underperformed the broader market more than 75% of the time, and the magnitude of the relative performance has been modest compared with the other 3 phases.
Information technology has been the best performer of all the sectors during this phase, having certain industries—such as semiconductors and hardware—that typically pick up momentum once companies gain more confidence in the stability of an economic recovery and are more willing to make capital expenditures (see chart). We also expect the new communication services sector to outperform during the mid-cycle phase, largely due to the strength of the media industry at this point in the cycle.
From an underperformance perspective, the materials and utilities sectors have lagged by the greatest magnitude. Due to the lack of clear sector leadership, the mid-cycle phase is a market environment in which investors may want to consider keeping their sector bets to a minimum while employing other approaches to generate additional active opportunities.
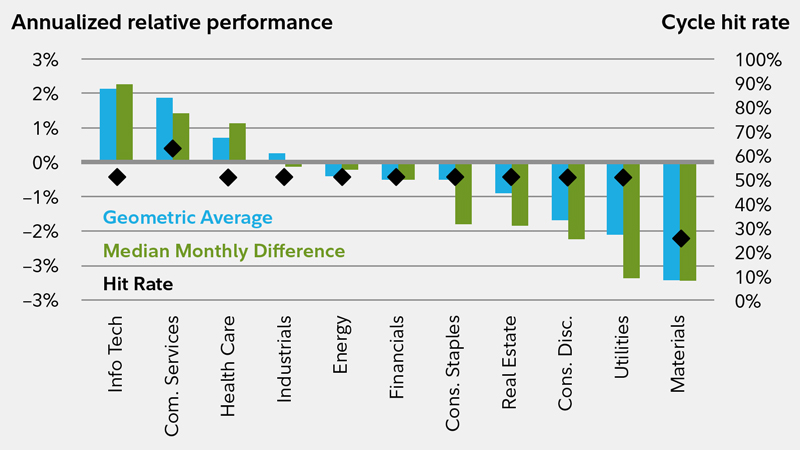
Sector leadership has rotated frequently in the mid-cycle phase, resulting in the smallest sector performance differentiation of any business cycle phase
This chart shows how sector leadership has rotated frequently in the mid-cycle phase.
Sectors as defined by GICS. Source: Fidelity Investments (AART), as of March 31, 2019. Past performance is no guarantee of future results.
Late-cycle phase
The late-cycle phase has had an average duration of roughly a year and a half, and overall stock market performance has averaged 6% on an annualized basis. As the economic recovery matures, the energy and materials sectors, whose fate is closely tied to the prices of raw materials, previously have done well as inflationary pressures build and the late-cycle economic expansion helps maintain solid demand (see next chart below).
Elsewhere, as investors begin to glimpse signs of an economic slowdown, defensive-oriented sectors—those in which revenues are tied more to basic needs and are less economically sensitive, particularly health care, but also consumer staples and utilities—generally have performed well. Looking across all 3 analytical measures, the energy sector has seen the most convincing patterns of outperformance in the late cycle, with high average and median relative performance along with a high cycle hit rate.
Information technology and consumer discretionary stocks have lagged most often, tending to suffer the most during this phase, as inflationary pressures crimp profit margins and investors move away from the most economically sensitive areas.
As the economic recovery matures, the materials and energy sectors have typically performed well, as have defensive-oriented sectors
This chart shows which sectors have performed well as the economic recovery matures.
Sectors as defined by GICS. Source: Fidelity Investments (AART), as of March 31, 2019. Past performance is no guarantee of future results.
Recession phase
The recession phase has historically been the shortest, lasting slightly less than a year on average—and the broader market has performed poorly during this phase (-15% average annual return). As economic growth stalls and contracts, sectors that are more economically sensitive fall out of favor, and those that are defensively oriented move to the front of the performance line. These less economically sensitive sectors, including consumer staples, utilities, and health care, are dominated by industries that produce items such as toothpaste, electricity, and prescription drugs, which consumers are less likely to cut back on during a recession (see next chart below). These sectors’ profits are likely to be more stable than those in other sectors in a contracting economy. The consumer staples sector has a perfect track record of outperforming the broader market throughout the entire recession phase, while utilities and health care are frequent outperformers. High-dividend yields provided by utility and telecom companies also have helped these sectors hold up relatively well during recessions. On the downside, economically and interest-rate-sensitive sectors— such as industrials, information technology, and real estate—typically have underperformed the broader market during this phase.
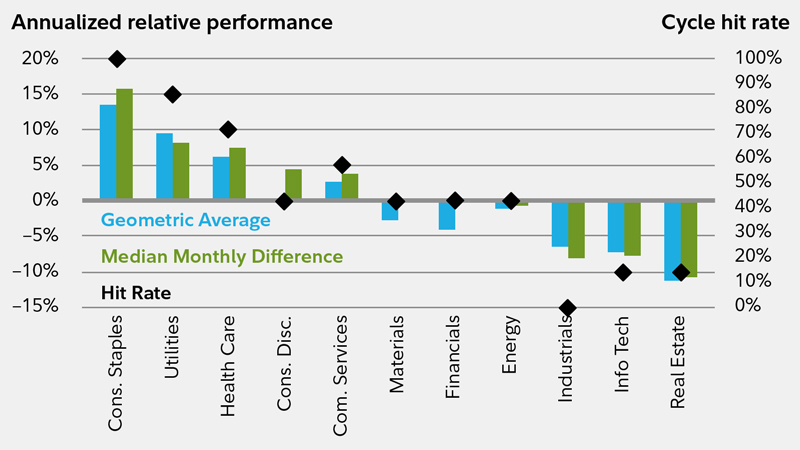
This chart shows that defensive-oriented sectors tend to outperform during the recession phase.
Sectors as defined by GICS. Source: Fidelity Investments (AART), as of March 31, 2019. Past performance is no guarantee of future results.
The merits of the business cycle approach
For those interested in a more active approach to managing their equity exposure, the business cycle approach offers considerable potential for taking advantage of relative sector-performance opportunities. As the probability of a shift in phase increases—for instance, from mid-cycle to late-cycle—such a strategy allows investors to adjust their exposure to sectors that have prominent performance patterns in the next phase of the cycle (see next chart below). Our views on these phase shifts are presented in recurring monthly updates on the business cycle.2 By its very nature, the business cycle focuses on an intermediate time horizon (i.e., cycle phases that rotate on average every few months to every few years). This may make it more practical for some investors to execute than shorter-term approaches.
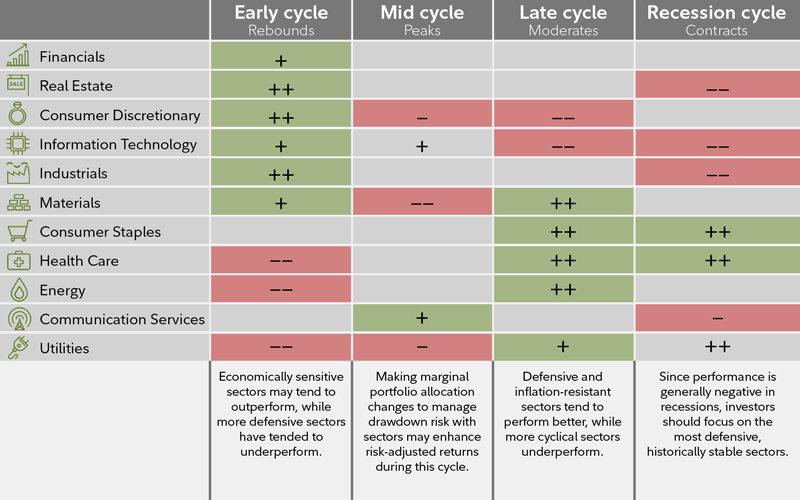
Looking at sectors throughout the business cycle
Note: The typical business cycle shown above is a hypothetical illustration. There is not always a chronological progression in this order, and in past cycles the economy has skipped a phase or retraced an earlier one.
Source for sector performance during business cycle: Fidelity Investments (AART). Unshaded (white) portions above suggest no clear pattern of over- or underperformance vs. broader market. Double +/– signs indicate that the sector is showing a consistent signal across all three metrics: full-phase average performance, median monthly difference, and cycle hit rate. A single +/– indicates a mixed or less consistent signal. Returns data from 1962 to 2016. Annualized returns are represented by the performance of the largest 3,000 US stocks measured by market capitalization, and sectors are defined by the Global Industry Classification Standard (GICS®). Past performance is no guarantee of future results. See below for important information.
Additional considerations for capturing alpha in sectors
Incorporating analysis and execution at the industry level may provide investors with greater opportunities to generate relative outperformance (“alpha”) in a business cycle approach. Industries within each sector can have significantly different fundamental performance drivers that may be masked by sector-level results, leading to significantly different industry-level price performance (see next chart below).
In addition, there are other strategies that can be incorporated to complement the business cycle approach and potentially capture additional alpha in equity sectors. Consider the following:
Macro-fundamental analysis: Macro-fundamental industry research can identify—independently of typical business cycle patterns—variables specific to the dynamics of each industry that may affect performance. For example, a significant change in the cost of key raw material inputs—such as oil prices for airlines—can drive a deviation in an industry's performance.
Bottom-up analysis: Company-specific analysis— through individual security selection—can identify unique traits in individual companies that may outweigh the impact of the typical business cycle pattern on that company’s future performance.
Global business cycle analysis: The US stock market has global exposure, which may warrant allocating toward or away from domestically focused sectors, depending on the phase of the US business cycle relative to the rest of the world. When the US business cycle is more favorable than the global cycle, sectors with more global exposure are likely to face greater headwinds to revenue growth, while more domestically linked sectors could fare relatively well.
Inflation overlay: The inflation backdrop can heavily influence some sectors’ profitability. Short-term inflation trends tend to ebb and flow with the movement of the business cycle, but longer-term inflation trends sometimes move independently of the business cycle.
Secular overlay: Long-term secular trends that are expected to unfold over multiple business cycles can warrant a permanently higher or lower allocation to a given sector than a pure business cycle approach would suggest.
This graphic shows that each industry within a sector has specific drivers that may affect performance.
Investment implications
Every business cycle is different, and so are the relative performance patterns among equity sectors. However, using a disciplined business cycle approach, it is possible to identify key phases in the economy and to use those signals in an effort to achieve active returns from sector allocation.
Analyzing relative sector performance
Certain metrics help evaluate the historical performance of each sector relative to the broader equity market (all data are annualized for comparison purposes):
Full-phase average performance: Calculates the (geometric) average performance of a sector in a particular phase of the business cycle, and subtracts the performance of the broader equity market. This method better captures the impact of compounding and performance that is experienced across full market cycles (i.e., longer holding periods). However, performance outliers carry greater weight and can skew results.
Median monthly difference: Calculates the difference in the monthly performance of a sector compared with the broader equity market, and then takes the midpoint of those observations. This measure is indifferent to when a return period begins during a phase, which makes it a good measure for investors who may miss significant portions of each business cycle phase. This method mutes the extreme performance differences of outliers, and also underemphasizes the impact of compounding returns.
Cycle hit rate: Calculates the frequency of a sector’s outperforming the broader equity market over each business cycle phase since 1962. This measure represents the consistency of sector performance relative to the broader market over different cycles, removing the possibility that outsized gains during one period in history influence overall averages. This method suffers somewhat from small sample sizes, with only 7 full cycles during the period, but persistent outperformance or underperformance still can be observed.
We updated our Business Cycle Sector Framework as a result of the September 2018 changes to the Global Industry Classification Standard (GICS) structure. This framework was last refreshed in 2016, following the elevation of real estate as the 11th GICS sector.
As of September 2018, the newly formed communication services sector combined the legacy telecommunication services sector with entertainment software, traditional media, and internet media companies. As a result, this new sector is more cyclical than its more-defensive predecessor, telecom, and we expect it to perform well in the mid cycle and underperform during recessions. Our assessment of communication services is more qualitative than that of the other sectors, given its evolving mix of industries.
Other sectors were also impacted by the shift in the GICS structure. Consumer discretionary lost some large internet media companies and gained online marketplaces. The departure of internet companies made the outlook for consumer discretionary less favorable in the mid cycle. Information technology was also affected by losing some internet and entertainment software companies, but the overall business cycle playbook for information technology companies did not change as a result.
<<<
It may be possible to enhance returns over an intermediate time horizon.
FIDELITY VIEWPOINTS
5/31/2019
https://www.fidelity.com/viewpoints/investing-ideas/sector-investing-business-cycle?ccsource=email_weekly
Key takeaways
The business cycle can be a determinant of sector performance over the intermediate term.
The phases of the economy provide a framework for sector allocation.
For example, the consumer discretionary and industrials sectors tend to outperform in the early cycle.
Over the intermediate term, asset performance is often driven largely by cyclical factors tied to the state of the economy, such as corporate earnings, interest rates, and inflation. The business cycle, which encompasses the cyclical fluctuations in an economy over many months or a few years, can therefore be a critical determinant of equity market returns and the performance of equity sectors. This article demonstrates Fidelity’s business cycle approach to sector investing, and how it potentially can enhance returns over an intermediate time horizon.
Asset allocation framework
Fidelity’s Asset Allocation Research Team (AART) conducts economic, fundamental, and quantitative research to produce asset allocation recommendations for Fidelity’s portfolio managers and investment teams. Our framework begins with the premise that long-term historical averages provide a reasonable baseline for portfolio allocations. However, over shorter time horizons—30 years or less—asset price fluctuations are driven by a confluence of various short-, intermediate-, and long-term factors that may cause performance to deviate significantly from historical averages. For this reason, incorporating a framework that analyzes underlying factors and trends among the following 3 temporal segments can be an effective asset allocation approach: tactical (1–12 months), business cycle (1–10 years), and secular (10–30 years).

Asset performance is driven by a confluence of various short-, intermediate-, and long-term factors
This chart shows that asset performance is driven by a confluence of various short-, intermediate-, and long-term factors.
For illustrative purposes only. Source: Fidelity Investments, Asset Allocation Research Team (AART).
Understanding business cycle phases
Every business cycle is different in its own way, but certain patterns have tended to repeat themselves over time. Fluctuations in the business cycle are essentially distinct changes in the rate of growth in economic activity, particularly changes in 3 key cycles—the corporate profit cycle, the credit cycle, and the inventory cycle—as well as changes in the employment backdrop and monetary policy. While unforeseen macroeconomic events or shocks can sometimes disrupt a trend, changes in these key indicators historically have provided a relatively reliable guide to recognizing the different phases of an economic cycle. Our quantitatively backed, probabilistic approach helps in identifying, with a reasonable degree of confidence, the state of the business cycle at different points in time. Specifically, there are 4 distinct phases of a typical business cycle (see chart).
Early-cycle phase: Generally, a sharp recovery from recession, marked by an inflection from negative to positive growth in economic activity (e.g., gross domestic product, industrial production), then an accelerating growth rate. Credit conditions stop tightening amid easy monetary policy, creating a healthy environment for rapid margin expansion and profit growth. Business inventories are low, while sales growth improves significantly.
Mid-cycle phase: Typically the longest phase of the business cycle. The mid-cycle is characterized by a positive but more moderate rate of growth than that experienced during the early-cycle phase. Economic activity gathers momentum, credit growth becomes strong, and profitability is healthy against an accommodative—though increasingly neutral—monetary policy backdrop. Inventories and sales grow, reaching equilibrium relative to each other.
Late-cycle phase: Often coincides with peak economic activity, implying that the rate of growth remains positive but slows. A typical late-cycle phase may be characteristic as an overheating stage for the economy when capacity becomes constrained, which leads to rising inflationary pressures. While rates of inflation are not always high, rising inflationary pressures and a tight labor market tend to crimp profit margins and lead to tighter monetary policy.
Recession phase: Features a contraction in economic activity. Corporate profits decline and credit is scarce for all economic actors. Monetary policy becomes more accommodative and inventories gradually fall despite low sales levels, setting up for the next recovery.
The performance of economically sensitive assets such as stocks tends to be the strongest during the early phase of the business cycle, when growth is rising at an accelerating rate, then moderates through the other phases until returns generally decline during the recession. In contrast, more defensive assets such as Treasury bonds typically experience the opposite pattern, enjoying their highest returns relative to stocks during a recession, and their worst performance during the early cycle.

The business cycle has 4 distinct phases. The US is firmly in the late cycle as of 2019.
This graphic shows that the US is firmly in the late cycle as of 2019.
Note: The diagram above is a hypothetical illustration of the business cycle. There is not always a chronological, linear progression among the phases of the business cycle, and there have been cycles when the economy has skipped a phase or retraced an earlier one. Economically sensitive assets include stocks and high-yield corporate bonds, while less economically sensitive assets include Treasury bonds and cash. We use the classic definition of recession, involving an outright contraction in economic activity, for developed economies. Source: Fidelity Investments (AART), as of March 31, 2019.
Equity sector performance patterns
Historical analysis of the cycles since 1962 shows that the relative performance of equity market sectors has tended to rotate as the overall economy shifts from one stage of the business cycle to the next, with different sectors assuming performance leadership in different economic phases.1 Due to structural shifts in the economy, technological innovation, varying regulatory backdrops, and other factors, no one sector has behaved uniformly for every business cycle. While it is important to note outperformance, it is also helpful to recognize sectors with consistent underperformance. Knowing which sectors of the market to reduce exposure to can be just as useful as knowing which tend to have the most robust outperformance.
Early-cycle phase
Historically, the early-cycle phase has featured the highest absolute performance. Since 1962, the broader stock market has produced an average total return of more than 20% per year during this phase, and its average length has been roughly one year. On a relative basis, sectors that typically benefit most from a backdrop of low interest rates and the first signs of economic improvement have tended to lead the broader market’s advance. Specifically, interest-rate-sensitive sectors—such as consumer discretionary, financials, and real estate—historically have outperformed the broader market (see chart). These sectors have performed well, due in part to industries within the sectors that typically benefit from increased borrowing, including diversified financials and consumer-linked industries such as autos and household durables in consumer discretionary.
Elsewhere, economically sensitive sectors—such as industrials and information technology—have been boosted by shifts from recession to recovery. For example, the industrials sector has some industries—such as transportation and capital goods—in which stock prices often have rallied in anticipation of economic recovery. Information technology and materials stocks typically have been aided by renewed expectations for consumer and corporate spending strength.
Laggards of the early-cycle phase include communication services and utilities, which generally are more defensive in nature due to fairly persistent demand across all stages of the cycle. Energy sector stocks also have lagged during the early phase, as inflationary pressures—and thus energy prices—tend to be lower during a recovery from recession. From a performance consistency perspective, consumer discretionary stocks have beaten the broader market in every early-cycle phase since 1962, while industrials also have exhibited impressive cycle hit rates. The financials and information technology sectors both have had healthy average and median relative performance, though their low hit rates are due in part to the diversity of their underlying industries. The communication services sector has historically underperformed in the early-cycle phase, but its evolving mix of industries provides less confidence in the persistence of this pattern moving forward.

Sectors that have performed well in the early cycle are interest-rate sensitive and economically sensitive sectors
This chart shows sectors that have performed well in the early cycle.
Includes equity market returns from 1962 through 2016. Returns are represented by the top 3000 US stocks ranked by market capitalization. Sectors as defined by GICS. Source: Fidelity Investments (AART), as of March 31, 2019. Past performance is no guarantee of future results.
Mid-cycle phase
As the economy moves beyond its initial stage of recovery and as growth rates moderate, the leadership of interest-rate-sensitive sectors typically has tapered. At this point in the cycle, economically sensitive sectors still have performed well, but a shift has often taken place toward some industries that see a peak in demand for their products or services only after the expansion has become more firmly entrenched. Average annual stock market performance has tended to be fairly strong (roughly 15%), though not to the same degree as in the early-cycle phase. In addition, the average mid-cycle phase of the business cycle tends to be significantly longer than any other stage (roughly 3.5 years), and this phase is also when most stock market corrections have taken place. For this reason, sector leadership has rotated frequently, resulting in the smallest sector-performance differentiation of any business cycle phase. No sector has outperformed or underperformed the broader market more than 75% of the time, and the magnitude of the relative performance has been modest compared with the other 3 phases.
Information technology has been the best performer of all the sectors during this phase, having certain industries—such as semiconductors and hardware—that typically pick up momentum once companies gain more confidence in the stability of an economic recovery and are more willing to make capital expenditures (see chart). We also expect the new communication services sector to outperform during the mid-cycle phase, largely due to the strength of the media industry at this point in the cycle.
From an underperformance perspective, the materials and utilities sectors have lagged by the greatest magnitude. Due to the lack of clear sector leadership, the mid-cycle phase is a market environment in which investors may want to consider keeping their sector bets to a minimum while employing other approaches to generate additional active opportunities.

Sector leadership has rotated frequently in the mid-cycle phase, resulting in the smallest sector performance differentiation of any business cycle phase
This chart shows how sector leadership has rotated frequently in the mid-cycle phase.
Sectors as defined by GICS. Source: Fidelity Investments (AART), as of March 31, 2019. Past performance is no guarantee of future results.
Late-cycle phase
The late-cycle phase has had an average duration of roughly a year and a half, and overall stock market performance has averaged 6% on an annualized basis. As the economic recovery matures, the energy and materials sectors, whose fate is closely tied to the prices of raw materials, previously have done well as inflationary pressures build and the late-cycle economic expansion helps maintain solid demand (see next chart below).
Elsewhere, as investors begin to glimpse signs of an economic slowdown, defensive-oriented sectors—those in which revenues are tied more to basic needs and are less economically sensitive, particularly health care, but also consumer staples and utilities—generally have performed well. Looking across all 3 analytical measures, the energy sector has seen the most convincing patterns of outperformance in the late cycle, with high average and median relative performance along with a high cycle hit rate.
Information technology and consumer discretionary stocks have lagged most often, tending to suffer the most during this phase, as inflationary pressures crimp profit margins and investors move away from the most economically sensitive areas.

As the economic recovery matures, the materials and energy sectors have typically performed well, as have defensive-oriented sectors
This chart shows which sectors have performed well as the economic recovery matures.
Sectors as defined by GICS. Source: Fidelity Investments (AART), as of March 31, 2019. Past performance is no guarantee of future results.
Recession phase
The recession phase has historically been the shortest, lasting slightly less than a year on average—and the broader market has performed poorly during this phase (-15% average annual return). As economic growth stalls and contracts, sectors that are more economically sensitive fall out of favor, and those that are defensively oriented move to the front of the performance line. These less economically sensitive sectors, including consumer staples, utilities, and health care, are dominated by industries that produce items such as toothpaste, electricity, and prescription drugs, which consumers are less likely to cut back on during a recession (see next chart below). These sectors’ profits are likely to be more stable than those in other sectors in a contracting economy. The consumer staples sector has a perfect track record of outperforming the broader market throughout the entire recession phase, while utilities and health care are frequent outperformers. High-dividend yields provided by utility and telecom companies also have helped these sectors hold up relatively well during recessions. On the downside, economically and interest-rate-sensitive sectors— such as industrials, information technology, and real estate—typically have underperformed the broader market during this phase.

This chart shows that defensive-oriented sectors tend to outperform during the recession phase.
Sectors as defined by GICS. Source: Fidelity Investments (AART), as of March 31, 2019. Past performance is no guarantee of future results.
The merits of the business cycle approach
For those interested in a more active approach to managing their equity exposure, the business cycle approach offers considerable potential for taking advantage of relative sector-performance opportunities. As the probability of a shift in phase increases—for instance, from mid-cycle to late-cycle—such a strategy allows investors to adjust their exposure to sectors that have prominent performance patterns in the next phase of the cycle (see next chart below). Our views on these phase shifts are presented in recurring monthly updates on the business cycle.2 By its very nature, the business cycle focuses on an intermediate time horizon (i.e., cycle phases that rotate on average every few months to every few years). This may make it more practical for some investors to execute than shorter-term approaches.

Looking at sectors throughout the business cycle
Note: The typical business cycle shown above is a hypothetical illustration. There is not always a chronological progression in this order, and in past cycles the economy has skipped a phase or retraced an earlier one.
Source for sector performance during business cycle: Fidelity Investments (AART). Unshaded (white) portions above suggest no clear pattern of over- or underperformance vs. broader market. Double +/– signs indicate that the sector is showing a consistent signal across all three metrics: full-phase average performance, median monthly difference, and cycle hit rate. A single +/– indicates a mixed or less consistent signal. Returns data from 1962 to 2016. Annualized returns are represented by the performance of the largest 3,000 US stocks measured by market capitalization, and sectors are defined by the Global Industry Classification Standard (GICS®). Past performance is no guarantee of future results. See below for important information.
Additional considerations for capturing alpha in sectors
Incorporating analysis and execution at the industry level may provide investors with greater opportunities to generate relative outperformance (“alpha”) in a business cycle approach. Industries within each sector can have significantly different fundamental performance drivers that may be masked by sector-level results, leading to significantly different industry-level price performance (see next chart below).
In addition, there are other strategies that can be incorporated to complement the business cycle approach and potentially capture additional alpha in equity sectors. Consider the following:
Macro-fundamental analysis: Macro-fundamental industry research can identify—independently of typical business cycle patterns—variables specific to the dynamics of each industry that may affect performance. For example, a significant change in the cost of key raw material inputs—such as oil prices for airlines—can drive a deviation in an industry's performance.
Bottom-up analysis: Company-specific analysis— through individual security selection—can identify unique traits in individual companies that may outweigh the impact of the typical business cycle pattern on that company’s future performance.
Global business cycle analysis: The US stock market has global exposure, which may warrant allocating toward or away from domestically focused sectors, depending on the phase of the US business cycle relative to the rest of the world. When the US business cycle is more favorable than the global cycle, sectors with more global exposure are likely to face greater headwinds to revenue growth, while more domestically linked sectors could fare relatively well.
Inflation overlay: The inflation backdrop can heavily influence some sectors’ profitability. Short-term inflation trends tend to ebb and flow with the movement of the business cycle, but longer-term inflation trends sometimes move independently of the business cycle.
Secular overlay: Long-term secular trends that are expected to unfold over multiple business cycles can warrant a permanently higher or lower allocation to a given sector than a pure business cycle approach would suggest.

This graphic shows that each industry within a sector has specific drivers that may affect performance.
Investment implications
Every business cycle is different, and so are the relative performance patterns among equity sectors. However, using a disciplined business cycle approach, it is possible to identify key phases in the economy and to use those signals in an effort to achieve active returns from sector allocation.
Analyzing relative sector performance
Certain metrics help evaluate the historical performance of each sector relative to the broader equity market (all data are annualized for comparison purposes):
Full-phase average performance: Calculates the (geometric) average performance of a sector in a particular phase of the business cycle, and subtracts the performance of the broader equity market. This method better captures the impact of compounding and performance that is experienced across full market cycles (i.e., longer holding periods). However, performance outliers carry greater weight and can skew results.
Median monthly difference: Calculates the difference in the monthly performance of a sector compared with the broader equity market, and then takes the midpoint of those observations. This measure is indifferent to when a return period begins during a phase, which makes it a good measure for investors who may miss significant portions of each business cycle phase. This method mutes the extreme performance differences of outliers, and also underemphasizes the impact of compounding returns.
Cycle hit rate: Calculates the frequency of a sector’s outperforming the broader equity market over each business cycle phase since 1962. This measure represents the consistency of sector performance relative to the broader market over different cycles, removing the possibility that outsized gains during one period in history influence overall averages. This method suffers somewhat from small sample sizes, with only 7 full cycles during the period, but persistent outperformance or underperformance still can be observed.
We updated our Business Cycle Sector Framework as a result of the September 2018 changes to the Global Industry Classification Standard (GICS) structure. This framework was last refreshed in 2016, following the elevation of real estate as the 11th GICS sector.
As of September 2018, the newly formed communication services sector combined the legacy telecommunication services sector with entertainment software, traditional media, and internet media companies. As a result, this new sector is more cyclical than its more-defensive predecessor, telecom, and we expect it to perform well in the mid cycle and underperform during recessions. Our assessment of communication services is more qualitative than that of the other sectors, given its evolving mix of industries.
Other sectors were also impacted by the shift in the GICS structure. Consumer discretionary lost some large internet media companies and gained online marketplaces. The departure of internet companies made the outlook for consumer discretionary less favorable in the mid cycle. Information technology was also affected by losing some internet and entertainment software companies, but the overall business cycle playbook for information technology companies did not change as a result.
<<<
Join the InvestorsHub Community
Register for free to join our community of investors and share your ideas. You will also get access to streaming quotes, interactive charts, trades, portfolio, live options flow and more tools.


