Register for free to join our community of investors and share your ideas. You will also get access to streaming quotes, interactive charts, trades, portfolio, live options flow and more tools.
Thats a cool information chart, have not seen that before
ALL STOCKS SORTED BY CCI 10
Symbol	Close	CCI(10)
 XLU	54.065	108.547
 AAPL	160.62	91.482
 EXEL	27.41	74.558
 XLK	57.875	57.627
 CHGG	14.99	53.333
 XLI	68.76	49.32
 $INDU	22037	38.803
 BAC	24.71	27.574
 GTLS	34.48	8.801
 MU	28.81	-3.911
 XLF	25.223	-6.573
 QQQ	144.12	-25.752
 AMAT	44.01	-28.747
 XLP	55.284	-32.949
 WRD	12.46	-35.246
 TQQQ	111.778	-37.17
 UCTT	22.222	-41.354
 SPY	247.12	-88.108
 MNKD	1.16	-93.73
 APRN	5.92	-93.972
 XLE	64.96	-95.377
 $RUT	1401	-113.285
 SPXL	36.23	-116.638
 $SPX	2472.54	-120.973
 TNA	54.212	-122.308
 IJR	69.62	-125.488
 GOOG	925.074	-127.591
 XLRE	32.46	-147.657
 XLV	79.37	-148.756
 XLY	90.77	-195.251
SCAN 2 SELLS
Symbol	Close	CCI 10
 XLF	25.355	87.783
 CHGG	15.125	72.809
ART HILL SAYS 240 = BEARISH 7/28/17
Last correction was NOV 2016
over bought cci 14
wed =54
thur =48
fri = 22
--------------------------------------
over sold cci 14
wed =1
thur =4
fri = 6
STOCKS MAY BE OVERDUE FOR A 5% PULLBACK ... The ziz-zag lines in Chart 2 mark pullbacks of 5% or more in the S&P 500 since the bull market started in spring 2009. Pullbacks of at least 5% occurred in each of those years (using closing prices). Except for the past year. That's the period in the gray circle at the upper right of the chart. If you compare the length of that last upleg to prior years, you'll see that it's length seems unusual. And it is.
I haven't confirmed it, but I read somewhere that this may be only the third time since the 1960s that the SPX has gone more than a year without a 5% pullback.
The up arrow at the start of 2016 marked the end of a 15% correction that started the previous spring. The second arrow marks the end of a 5% pullback following the Brexit vote that June. It's been an uninterrupted rise since then. All of which suggests that the SPX is due for a 5% pullback. If one is going to occur, the seasonal bars in Chart 1 suggest the most likely period would be during the August/September period. BY JOHN MURPHY

Using an EMA Ribbon to Define the Trend BY ART HILL
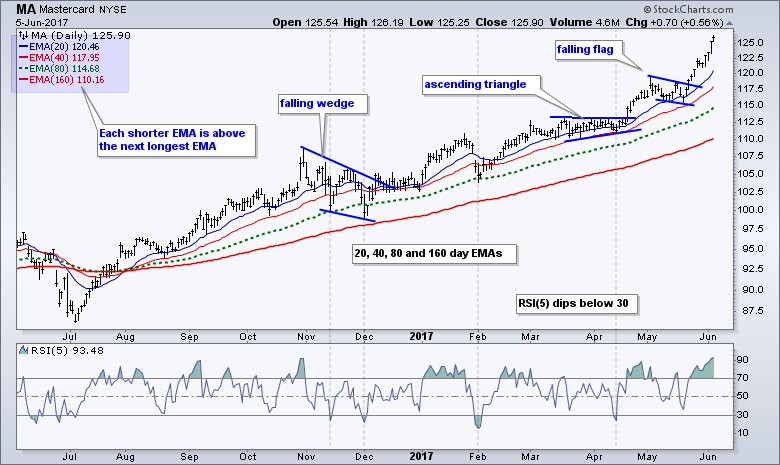
There are numerous ways to determine the trend with the humble moving average providing the simplest means. The length of the moving average depends on the trend you wish to capture. The chart below shows Mastercard (MA) with four EMAs that become progressively longer (20, 40, 80 and 160 days). This moving average ribbon provides a great example of a strong uptrend from August 2016 until now. Notice that the shorter EMA has been above the next longer EMA since August (20-day above 40-day, 40-day above 80-day etc...).
5/25 ART HILL
Test 3 buys when the 5-day EMA crosses above the 50-day EMA
and sells when the 50-day EMA crosses below the 200-day EMA.
This wider sell signal improved the returns and Win% significantly, but this system had the fewest trades of all (341 or 1.4 per month).
Backtest Results for Seasonality Plus Timing
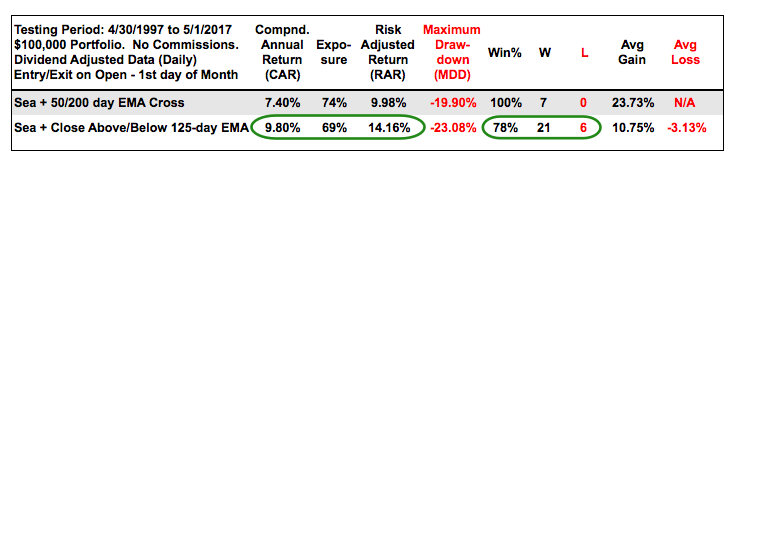
The table below shows the results for seasonality and timing. The golden cross with seasonality worked a little better than the golden cross without seasonality (first table). Seasonality combined with the 125-day EMA cross returned almost 10% per year over the last twenty years. There were two big drawdowns during this period (-23.08% in 2002 and -18.76% in 2008). The five largest drawdowns averaged 16.3%, which is not too bad for a 9.8% Compound Annual Return and a 14.16% Risk-adjusted Return.
Conclusions
There is clearly something to be said for the worst four-month period, which includes the dog days of summer and September. The S&P 500 SPDR is up some 15% from its November low and still in bull mode with the worst four month period right around the corner. Even so, the trend is clearly up and the trend holds more sway than seasonality. Chartist can watch two things as June nears. First, a break below the April low (support) would be negative. Second, a close below the 125-day EMA during June would suggest that a correction is underway and the fish are biting. In other words, that might be the signal that it is a good time to go fishing!
A Year of Frustration for IJR
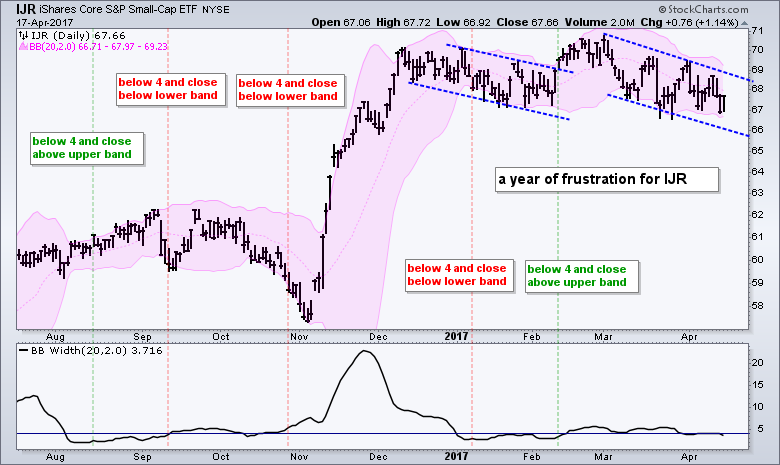
The next chart shows the S&P SmallCap iShares (IJR) with the Bollinger Bands and BandWidth. Notice that I chose 4 as the level for low BandWidth and the indicator has been hovering around this level the entire year. This reflects the fact that IJR has gone nowhere in 2017. It looked like a breakout was underway in mid February when the ETF closed above the upper band and broke channel resistance, but this failed to hold as IJR fell back to the 67 area. Another channel is taking shape with resistance marked around 69.
For this coming week 4/17/17 to 4/21/17
BY ART HILL
And finally, RSI(10) is nearing oversold and this usually means I should be on alert for a bounce or bullish reversal.
Instead of an alert, I am calling an audible here and ignoring short-term oversold conditions because I think the market is currently correcting and that correction has yet to end.
Only 22% of the SP 1500 have 50 ema below 200 ema .
That is a bull market. IMHO
Criteria:
001 RSI(5) X 30 ..........BUYS TODAY
• For the last intraday update:
[[FAVORITES LIST IS 60] AND [CLOSE > .1] AND [RSI(5) X 30] ]
Available Actions:
Matching Results: 3
6 Apr 2017, 12:38 PM
Columns
Entries:
Symbol
Name
Exchange
Sector
Industry
SCTR
U
Close
Volume
Daily RSI(5,Daily Close)
IWM
iShares Russell 2000 ETF
NYSE
51.9
etf
134.930
18946368
40.003
TNA
Direxion Daily Small Cap Bull 3x Shares
NYSE
99.790
2131914
39.440
X
USX-US Steel Group, Inc.
NYSE
Materials
Steel
97.8
mid
32.850
11269296
35.278
Criteria:
003 TREND TURNED BULLISH TODAY
• For the last intraday update:
[[FAVORITES LIST IS 60] AND [CLOSE > .1] AND [ PPO SIGNAL (1,50,1) X 0.00] ]
zero
Criteria:
001 RSI(5) X 30 ..........BUYS TODAY
zero
Still in Corrective Mode by ART HILL
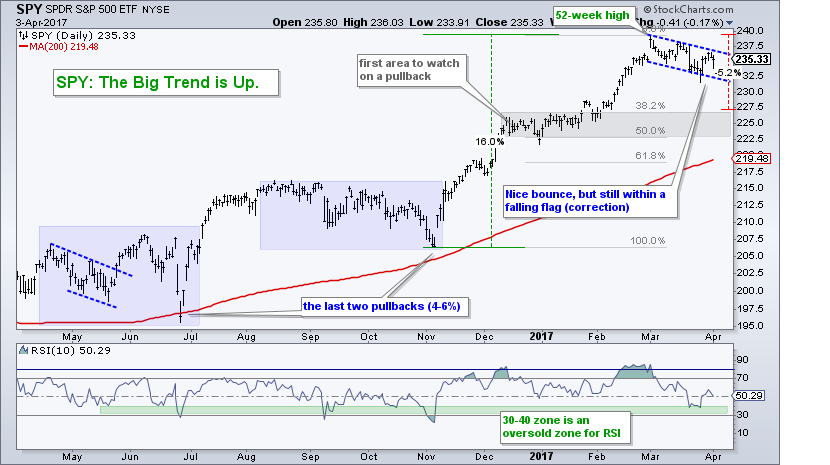
I have a few stocks and setups to show below, but first I should confirm that I remain in the correction camp. The long-term trend for the S&P 500 (market) is up, but I think we are in the midst of a correction within that uptrend. The rationale for this correction call was first detailed in a commentary on March 22nd and I put forth some correction targets on March 24th. We never know how long a correction will last or how far it will extends. The last two shaved around 5% from the S&P 500 SPDR and lasted two to three months. They were actually quite choppy affairs as the index moved sideways most of the time. I am using the S&P 500 SPDR to monitor the correction targets.
The minimum expectation is a 5% pullback from the highs or a 38% retracement (227).
The maximum is a return to the rising 200-day EMA or a 61.8% retracement (220).
Note that most stocks and equity ETFs follow the S&P 500 so it would be a difficult period for trading should the current correction deepen.
*****Score one for the machines.
The largest fund company in the world, BlackRock, has faced a thorny challenge since it acquired the exchange-traded-fund business from Barclays in 2009.
These low cost, computer-driven funds have exploded in growth, leaving in the dust the stock pickers who had spurred an earlier expansion for the firm. The rise of passive investing — exchange-traded funds, index funds and the like — has revolutionized the investment world, providing Main Street investors with greater opportunities at lower fees while putting pressure on even Wall Street’s biggest money managers.
Now, after years of deliberations, Laurence D. Fink, a founder and chief executive of BlackRock, has cast his lot with the machines.
On Tuesday, BlackRock laid out an ambitious plan to consolidate a large number of actively managed mutual funds with peers that rely more on algorithms and models to pick stocks.
Continue reading the main story
The initiative is the most explicit action by a major fund management firm in reaction to the exodus of investors from actively managed stock funds to cheaper funds that track every variety of index and investment theme.
Some $30 billion in assets (about 11 percent of active equity funds) will be targeted, with $6 billion rebranded BlackRock Advantage funds. These funds focus on quantitative and other strategies that adopt a more rules-based approach to investing.
“The democratization of information has made it much harder for active management,” Mr. Fink said in an interview. “We have to change the ecosystem — that means relying more on big data, artificial intelligence, factors and models within quant and traditional investment strategies.”
As part of the restructuring, seven of BlackRock’s 53 stock pickers are expected to step down from their funds. Several of the money managers will stay on as advisers. At least 36 employees connected to the funds are leaving the firm.
While BlackRock is proceeding gradually, in many ways the new plan is a direct attack on the cult of the brainy mutual fund manager, popularized in the 1980s and 1990s by Peter Lynch, a stock-picking wizard at the fund giant Fidelity.
Today, asset managers like Pimco, Franklin Templeton, Aberdeen and, of course, Fidelity continue to make the case that their bond and equity managers can outsmart the broader market — and charge a premium price for doing so.
Since 2009, however, as the performance of these funds has suffered, millions of investors have rejected this proposition, abandoning their expensive mutual funds for better-performing funds that track various indexes at a fraction of the cost.
Now the biggest fund companies are Vanguard, the indexing pioneer, and BlackRock, which together oversee close to $10 trillion in assets.
BlackRock, with its fleet of iShares E.T.F.s, has certainly benefited from the investor revolution — one that threatens to disrupt the mutual fund industry in the years ahead.
Still, the monster in the mutual fund room by far has been Vanguard, which, via index funds and exchange-traded funds, has had historic inflows.
Last year, for example, $423 billion left actively managed stock funds and $390 billion poured into index funds, according to Morningstar. Of that amount, Vanguard captured $277 billion, nearly tripling the amount that went to its nearest rival, BlackRock.
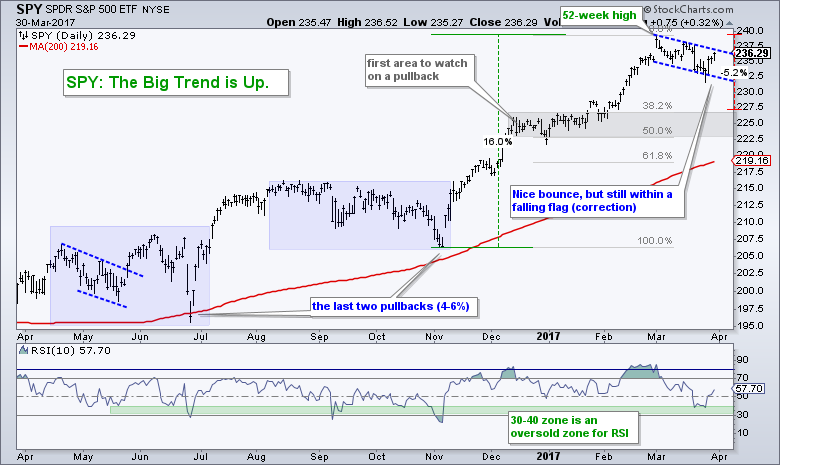
SPY Remains in Corrective Mode BY ART HILL
The S&P 500 SPDR (SPY) is used as my benchmark for the stock market. I am also working under the assumption that most indexes, sectors, industry groups and stocks will eventually follow the S&P 500. In any case, SPY surged to the 236 area this week, but remains within a clearly defined decline since early March. This four-week correction could be a bull flag and a breakout would signal a continuation of the January-February advance. As noted above, I do not think breadth was strong enough this week to suggest a sustainable breakout. Thus, I think playing upside breakouts could be dangerous with SPY still up around 15% from its early November low. Disclaimer: Always be careful when I begin a sentence with "I think" because thinking sometimes gets me in trouble (wrong).
Is One Week of Risk-On Enough? by ART HILL
Stocks caught a big bid this week as Treasury bonds fell. We also saw money moving into oil and industrial metals as gold fell back. Overall it was a clear risk-on week for the markets. Even though I see a reversal in oil and resistance in bonds, I have my doubts on this return to risk in the stock market.
I moved to the correction camp a week ago Wednesday and I remain in that camp.
Note that I am NOT calling a top and I am certainly not turning long-term bearish on stocks.
I am simply staying in the correction camp for the S&P 500.
Using the 50-day SMA to Compare Charts
The chart below shows a broad range of ETFs with the 50-day SMA for reference. I do not think moving averages offer support or resistance levels, but they can be used to compare performance and generalize the trend. The 50-day SMA is a medium-term indicator. The trend is generally up when above and down when below. Note that SPY and QQQ are above, but IJR and MDY are below. Large-caps and large-techs are holding up better than small-caps and mid-caps.
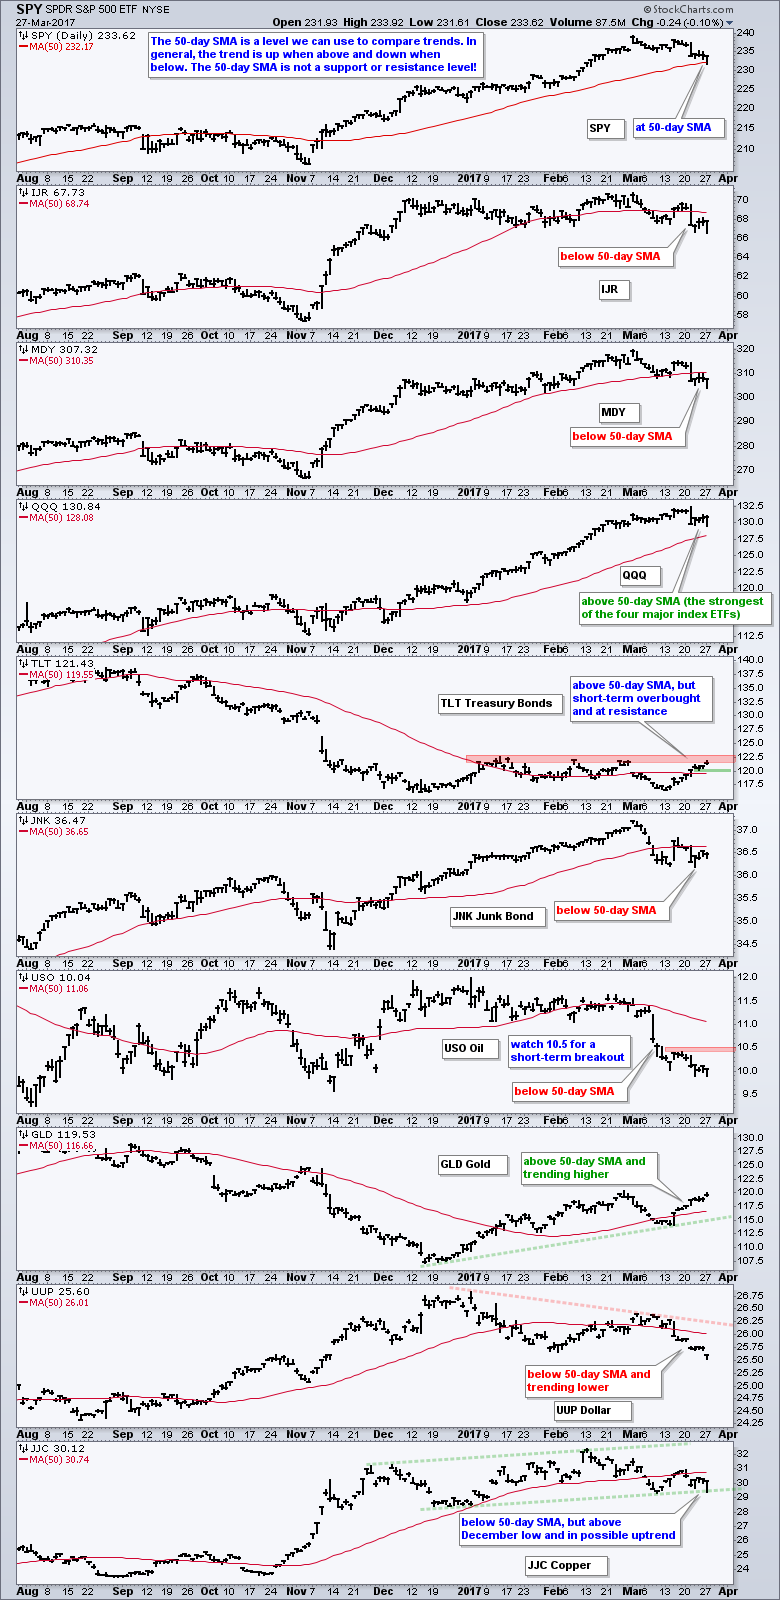
TLT is above the 50-day SMA, but in a trading range and near range resistance. A break below 120 would reverse the upswing and this would be positive for banks. USO remains weak with short-term resistance set at 10.50. A break above this level is needed before getting interested in energy-related stocks and ETFs. GLD is trending up as the Dollar trends down. Note, however, that it could still be a bear market rally for GLD and a correction for the Dollar
STOCKS AWAIT HEALTHCARE VOTE... Early stock gains evaporated late in the day on postponement of the House vote on healthcare. The consensus view seems to be that a "no" vote on the Republican healthcare package would likely postpone legislation on tax reform an infrastructure spending. Market gains since the election have been built largely on expectation for that fiscal stimulus. Tuesday's heavy volume selloff also damaged the market's short -term trend. Chart 5 shows the S&P 500 SPDR (SPY) in danger of dropping to its 50-day average. That would be the first serious test of the post-election rally that started in early November. A Friday vote is still possible.
SPY has not Done This since October
The S&P 500 SPDR (SPY) did something it hasn't done since October 11th, over 100 days ago. The ETF fell over 1%. We have been hearing a lot about this 1% thing so let's see what happened in the past. The chart below shows 7 declines greater than 1% since April, which is when the 50-day EMA crossed above the 200-day EMA. I marked five with red lines. The early April decline foreshadowed a flat correction for the next three months. The late June decline was a reaction to Brexit and marked a bottom. After hitting a new high in August, the index declined 1+ percent in early September. A two month correction then followed and there was another 1+ percent decline in early October. This brings us to the present 1+ percent decline
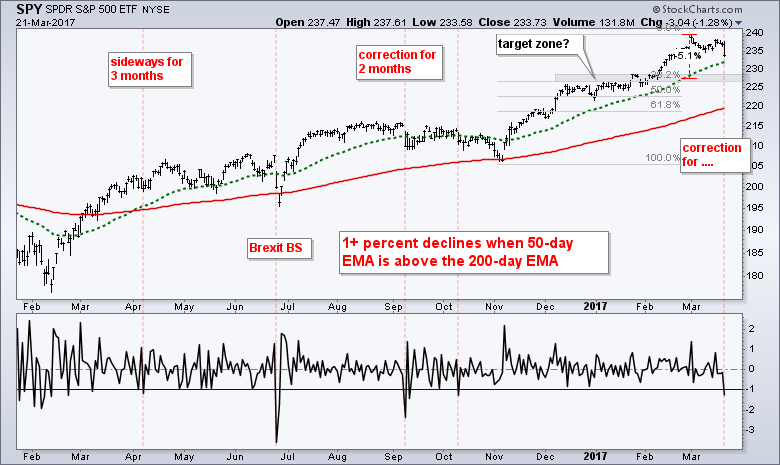
On the face of it, Tuesday's decline reflects the most selling pressure in five months, which is significant. It also suggests that the long awaited correction could finally be here. We never know how far or how long a correction will extend. We also do not know the path that price will take (sharp decline, trading range or zigzag decline). A garden variety 5% correction would extend to the 227 area. This area also marks broken resistance and a 38% retracement of the prior advance (November to March). A deeper correction could extend to the 61.8% retracement and the 200-day EMA.
|
Followers
|
163
|
Posters
|
|
|
Posts (Today)
|
0
|
Posts (Total)
|
17387
|
|
Created
|
07/03/08
|
Type
|
Free
|
| Moderators | |||
TADEING TNA AND TZA .... (1) No penny stocks (2) No Politics nor religion (3) No one who sells on
| Volume | |
| Day Range: | |
| Bid Price | |
| Ask Price | |
| Last Trade Time: |
