Using an EMA Ribbon to Define the Trend BY ART HILL
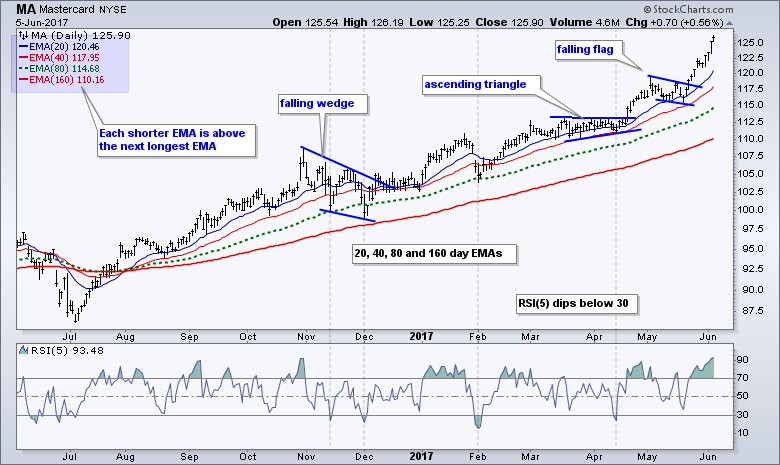
There are numerous ways to determine the trend with the humble moving average providing the simplest means. The length of the moving average depends on the trend you wish to capture. The chart below shows Mastercard (MA) with four EMAs that become progressively longer (20, 40, 80 and 160 days). This moving average ribbon provides a great example of a strong uptrend from August 2016 until now. Notice that the shorter EMA has been above the next longer EMA since August (20-day above 40-day, 40-day above 80-day etc...).
Register for free to join our community of investors and share your ideas. You will also get access to streaming quotes, interactive charts, trades, portfolio, live options flow and more tools.
 News
News  Market Data
  Discover