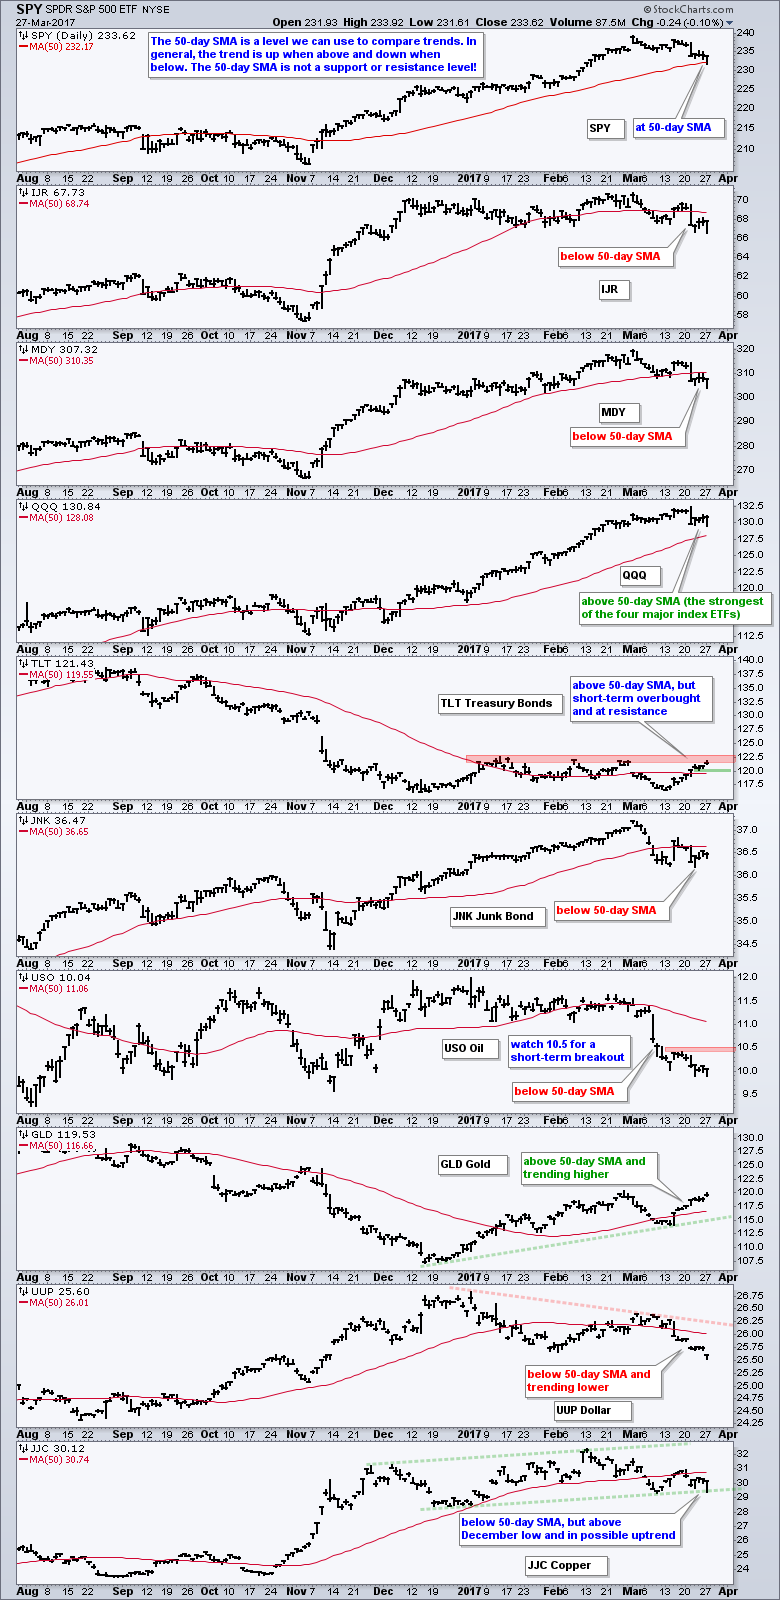
The chart below shows a broad range of ETFs with the 50-day SMA for reference. I do not think moving averages offer support or resistance levels, but they can be used to compare performance and generalize the trend. The 50-day SMA is a medium-term indicator. The trend is generally up when above and down when below. Note that SPY and QQQ are above, but IJR and MDY are below. Large-caps and large-techs are holding up better than small-caps and mid-caps.
TLT is above the 50-day SMA, but in a trading range and near range resistance. A break below 120 would reverse the upswing and this would be positive for banks. USO remains weak with short-term resistance set at 10.50. A break above this level is needed before getting interested in energy-related stocks and ETFs. GLD is trending up as the Dollar trends down. Note, however, that it could still be a bear market rally for GLD and a correction for the Dollar
Register for free to join our community of investors and share your ideas. You will also get access to streaming quotes, interactive charts, trades, portfolio, live options flow and more tools.
 News
News  Market Data
  Discover