Register for free to join our community of investors and share your ideas. You will also get access to streaming quotes, interactive charts, trades, portfolio, live options flow and more tools.
The choice of indicator depends on what you are trying to measure.
1 Momentum is best measured with momentum oscillators like Rate-of-Change and MACD.
2 Overbought/oversold levels are best measured with banded oscillators like Stochastics and RSI.
3 Trend is best measured with trend-following indicators like moving averages and Kelter Channels.
4 Volatility is best measured by using Standard Deviation or Average True Range.
Nice work. IJR chart looks like a big sideways consolidation before next wave up...67.5-70.5. Have to give respect on either end
Feel free to post your charts with buys and sells.
Larry, I have a few trading systems I use that are very similar to this. I use them on SPY and AMZN. I am travelling right now but when I get home I am going to tweak them a bit to use these parameters. One thing you might try for a stop is to stop out on a cross back below the 30 on RSI 5. I have also found that different stocks, I think largely due to the individual stocks beta, respond differently to changing the RSI. 5, 10, 14 etc.
I use the 65 min chart myself. If you can test intraday you might like the results once you optimize it.
Backtesting Two Short-term Mean-Reversion Strategies
The table below shows backtest results for two strategies. The first buys when RSI(5) crosses above 30 and sells when RSI(5) crosses below 70. The second buys when RSI(5) crosses above 30 and sells when price closes below the Chandelier Exit (22,1). There are no stop-losses, just exits. The backtest runs a little over 16 years and includes two bear market periods. The strategy only trades long positions and only trades when the S&P 500 is in a long-term uptrend (50-day EMA is above 200-day EMA). Short positions DO NOT add value and the S&P 500 is the ONLY index we need for broad market timing.

The results are pretty good, especially for the strategy using the Chandelier Exit (Compound Annual Return of 11.46% and a Maximum Drawdown of 17.84%). The Win% was high (~80%) and the system was exposed to the market 37% of the time. Note that the S&P 500 was in an uptrend 69% of the time (50-day EMA above 200-day EMA). This means the system was in the market 53% of the tradable timeframe, which was 69%. This may not seem like much, but it was enough to produce good returns with modest drawdowns.
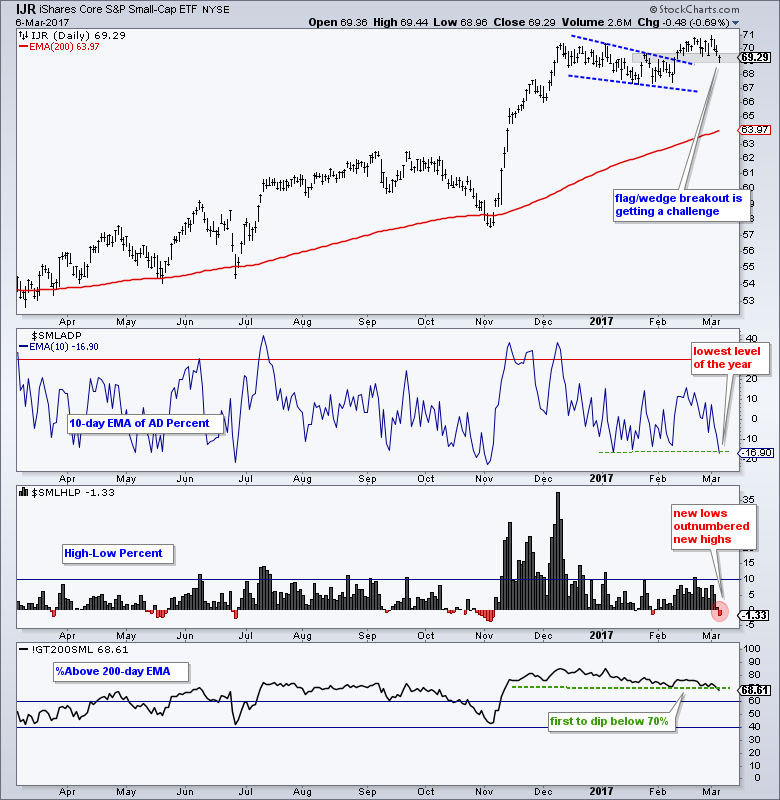
Small-cap Breadth Deteriorates
Stocks declined for the, gasp, third day running as the S&P 500 SPDR (SPY) fell a whopping .30% on the day. SPY is down .86% over the last three days and now trading in Wednesday's gap zone. QQQ is down a horrendous half percent in three days and also in the gap zone. IJR is down 2.05% and trading below last week's low. Small-caps are clearly not performing well right now and we can see this with a deterioration in the breadth indicators.
Exhaustion gaps according to Bulkowski:
Happens at the end of a trend on high volume.
The gap is not followed by new highs or lows, and the gap may be unusually wide.
After the gap, price consolidates or reverses direction.
Commonly occurs after continuation gaps.
Exhaustion gaps usually close within a week.
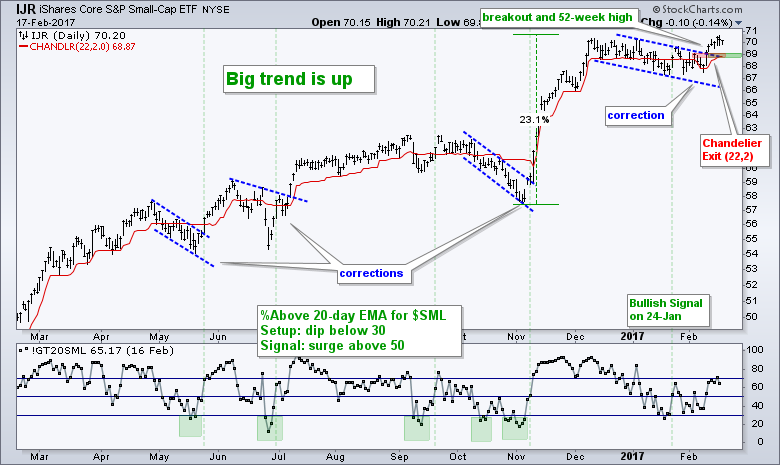
Watching the Breakout Zone in IJR
The S&P SmallCap iShares (IJR) finally caught fire with a surge and flag breakout. Even though small-cap High-Low Percent is lagging, I will treat the breakout as bullish until there is evidence to the contrary. The breakout zone around 69 becomes the first area to watch for a breakout failure. I would not view a breakout failure as bearish. It would just suggest that IJR may need more time correcting within the bigger uptrend.
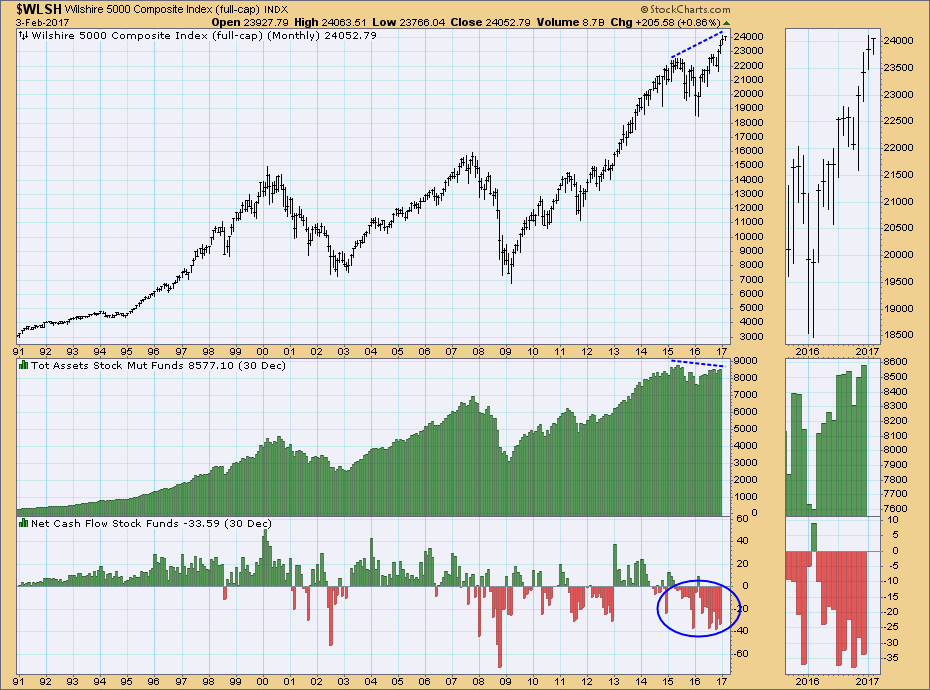
***** With some broad market indexes making record highs, one would think that total mutual fund assets would be following suit. But no. As of the end of December Total Stock Mutual Fund Assets were still below the record highs set in 2015, and are failing to confirm record price highs. (These data are collected by the Investment Company Institute and are published a month in arrears. January's totals won't be available until the end of this month.)
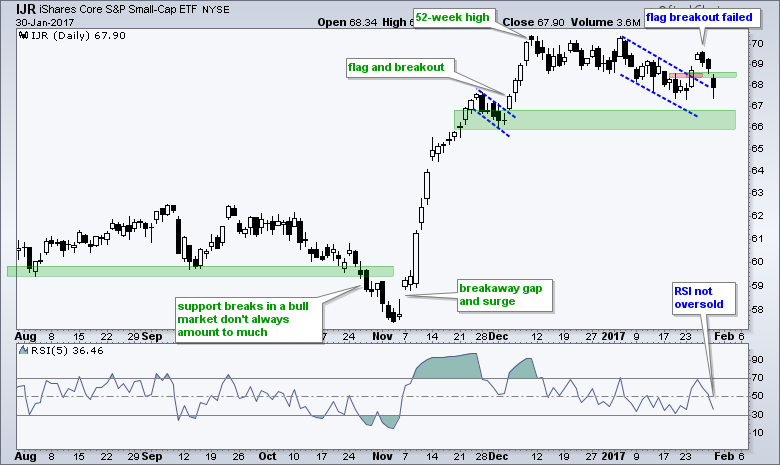
IJR Fails to Hold Flag Break BY ART HILL
IJR fell by more than 1% as high-beta stocks led the sell off. On the price chart, IJR failed to hold its flag breakout as it moved back below the breakout zone. This is the challenge with playing breakouts. Compared to a mean-reversion strategy, risk is almost always higher when playing a breakout strategy because the entry price is invariably higher. As far as a mean-reversion strategy is concerned, the next setup will trigger when RSI(5) moves below 30.
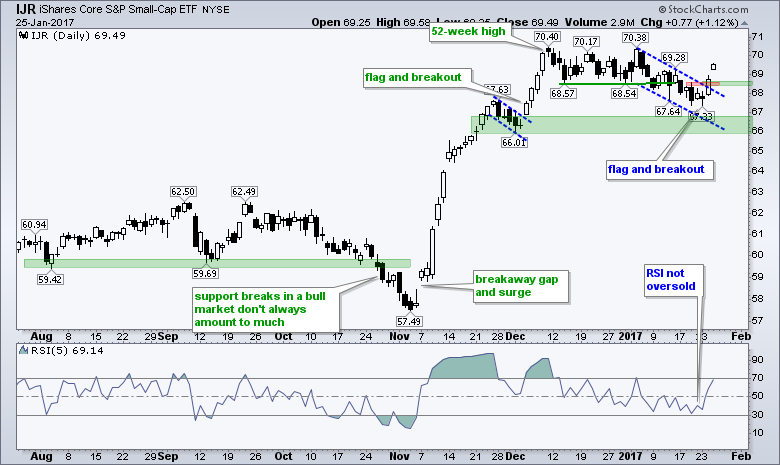
IJR Breaks Flag Resistance
The S&P SmallCap iShares (IJR) was lagging this year because it corrected with a falling flag. RSI dipped to 32.18 last week, but did not become "oversold". Sometimes RSI does not fully cooperate and provide a nice oversold signal. This is when I look to the price chart for clues. First and foremost, the pullback over the last few weeks was always viewed as a correction within a bigger uptrend. IJR closed below 68 with a black candlestick last Thursday, firmed on Friday-Monday and then broke out on Monday. This is a four-candlestick reversal pattern - decline, stall and reverse. The breakout zone becomes the first area to watch for a failure. Thus, I think a close below 68.2 would call for a reassessment.
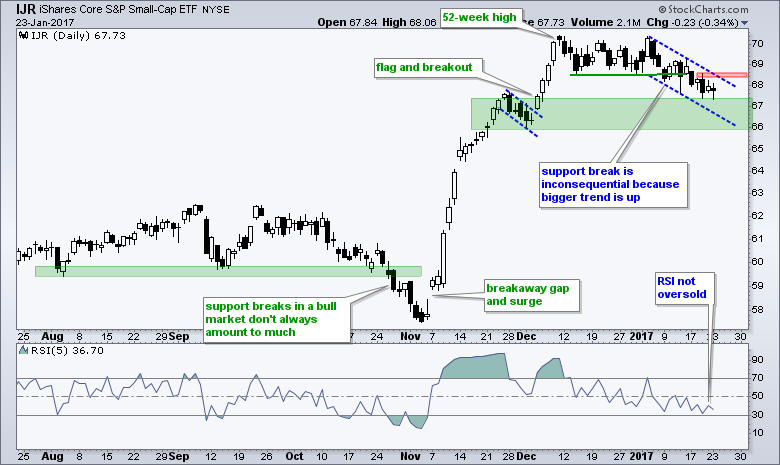
IJR Corrects with Bull Flag BY ART HILL
Led by weakness in retail and banks, the S&P SmallCap iShares (IJR) corrected with a falling flag over the last 12 days. I am not concerned with the break below the mid December lows because the bigger uptrend is the dominant force. Instead, I am more interested in catching an oversold bounce within this bigger uptrend. RSI is nearing oversold levels (~30) and the ETF is near a potential reversal zone (green). A move above 68.5 would break flag resistance.
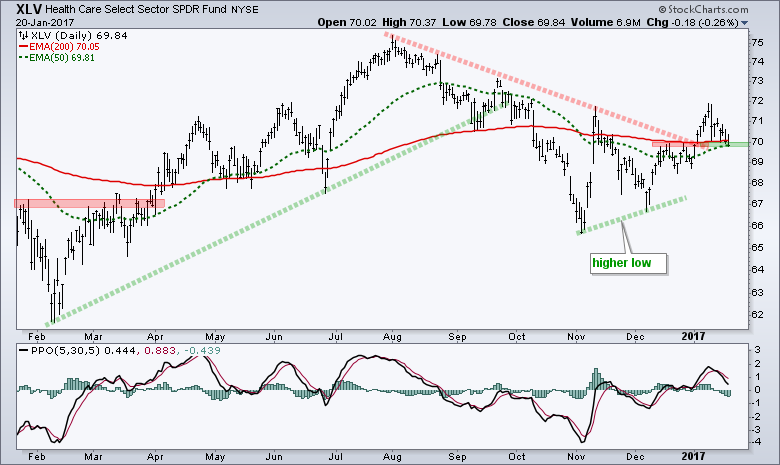
Healthcare Remains an Enigma BY ART HILL
The HealthCare SPDR (XLV) is a difficult call because a few choice words could send the sector lower. It is also the weakest of the nine sectors and this means there are better choices out there right now. On the price chart, the 50-day EMA is just below the 200-day EMA, but the ETF is trading right at both EMAs. There is a slight uptrend since the November low and I am watching the breakout near 70 quite closely. A close below 69.8 would call for a re-evaluation.
Dow 25,000 coming in next 2 years!!
TQQQ going to $300/ share!
The gift that keeps giving!!
TQQQ
Thoughts on GDX / NUGT? Looking like a trend change possible. Weekly printing it's 4th green candle possibly this week and it's broken out of and retested the downward channel it's been in. Looks like a buy would have triggered on your CCI RSI trade and would already be up to 9.50 from @ a 7.00 entry.
Technical analysis is an art form and the eye grows keener with practice.
Study both successes and failures with an eye to the future.
|
Followers
|
163
|
Posters
|
|
|
Posts (Today)
|
0
|
Posts (Total)
|
17387
|
|
Created
|
07/03/08
|
Type
|
Free
|
| Moderators | |||
TADEING TNA AND TZA .... (1) No penny stocks (2) No Politics nor religion (3) No one who sells on
| Volume | |
| Day Range: | |
| Bid Price | |
| Ask Price | |
| Last Trade Time: |
