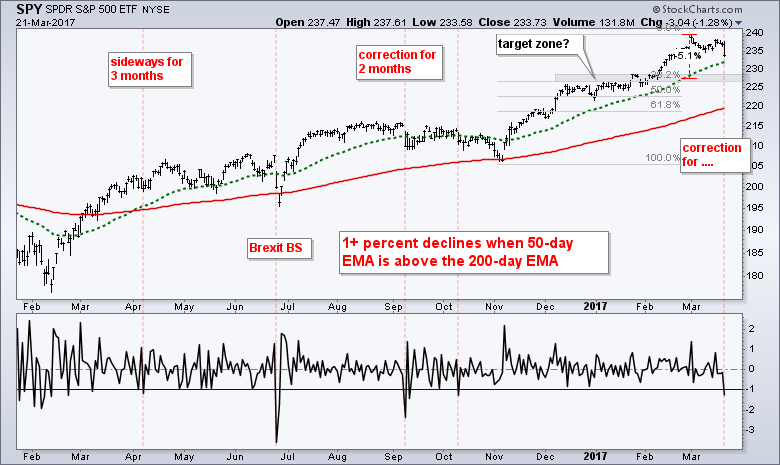
The S&P 500 SPDR (SPY) did something it hasn't done since October 11th, over 100 days ago. The ETF fell over 1%. We have been hearing a lot about this 1% thing so let's see what happened in the past. The chart below shows 7 declines greater than 1% since April, which is when the 50-day EMA crossed above the 200-day EMA. I marked five with red lines. The early April decline foreshadowed a flat correction for the next three months. The late June decline was a reaction to Brexit and marked a bottom. After hitting a new high in August, the index declined 1+ percent in early September. A two month correction then followed and there was another 1+ percent decline in early October. This brings us to the present 1+ percent decline
On the face of it, Tuesday's decline reflects the most selling pressure in five months, which is significant. It also suggests that the long awaited correction could finally be here. We never know how far or how long a correction will extend. We also do not know the path that price will take (sharp decline, trading range or zigzag decline). A garden variety 5% correction would extend to the 227 area. This area also marks broken resistance and a 38% retracement of the prior advance (November to March). A deeper correction could extend to the 61.8% retracement and the 200-day EMA.
Register for free to join our community of investors and share your ideas. You will also get access to streaming quotes, interactive charts, trades, portfolio, live options flow and more tools.
 News
News  Market Data
  Discover