 News
News  Market Data
  Discover
Support: 888-992-3836
Copyright © 2023 InvestorsHub Inc.


In the markets, what goes down must go up
sharpshorts
![]()
In the markets, what goes down must go up
Register for free to join our community of investors and share your ideas. You will also get access to streaming quotes, interactive charts, trades, portfolio, live options flow and more tools.
Register for free to join our community of investors and share your ideas. You will also get access to streaming quotes, interactive charts, trades, portfolio, live options flow and more tools.
In the markets, what goes down must go up
A 20% point drop will never happen again
After all, we have circuit breakers now and have learned a thing or two since '87
Haven't we?


Have been reading some comparisons to 1987 ...
In '87, price dropped 100 points from ~2800 on a Friday which led to an add'l 500 point drop (20%) the following Monday...
Last Friday futures dropped 1200 points from ~35000 so today expect a 20% price drop of 7000 points...

Often a reversal happens when price and indicators diverge

5 year weekly rounded top
How significant is Friday's one day 1200 point DJIA futures drop....
- just another dip or is the end finally here?

Take out bits-and-pieces at a time . . . while avoiding giving back too much.
BUY stops don't guarantee your lower bracket stop-loss won't get hit after entry
but there's no guarantee that your entry limit order will get a fill either...

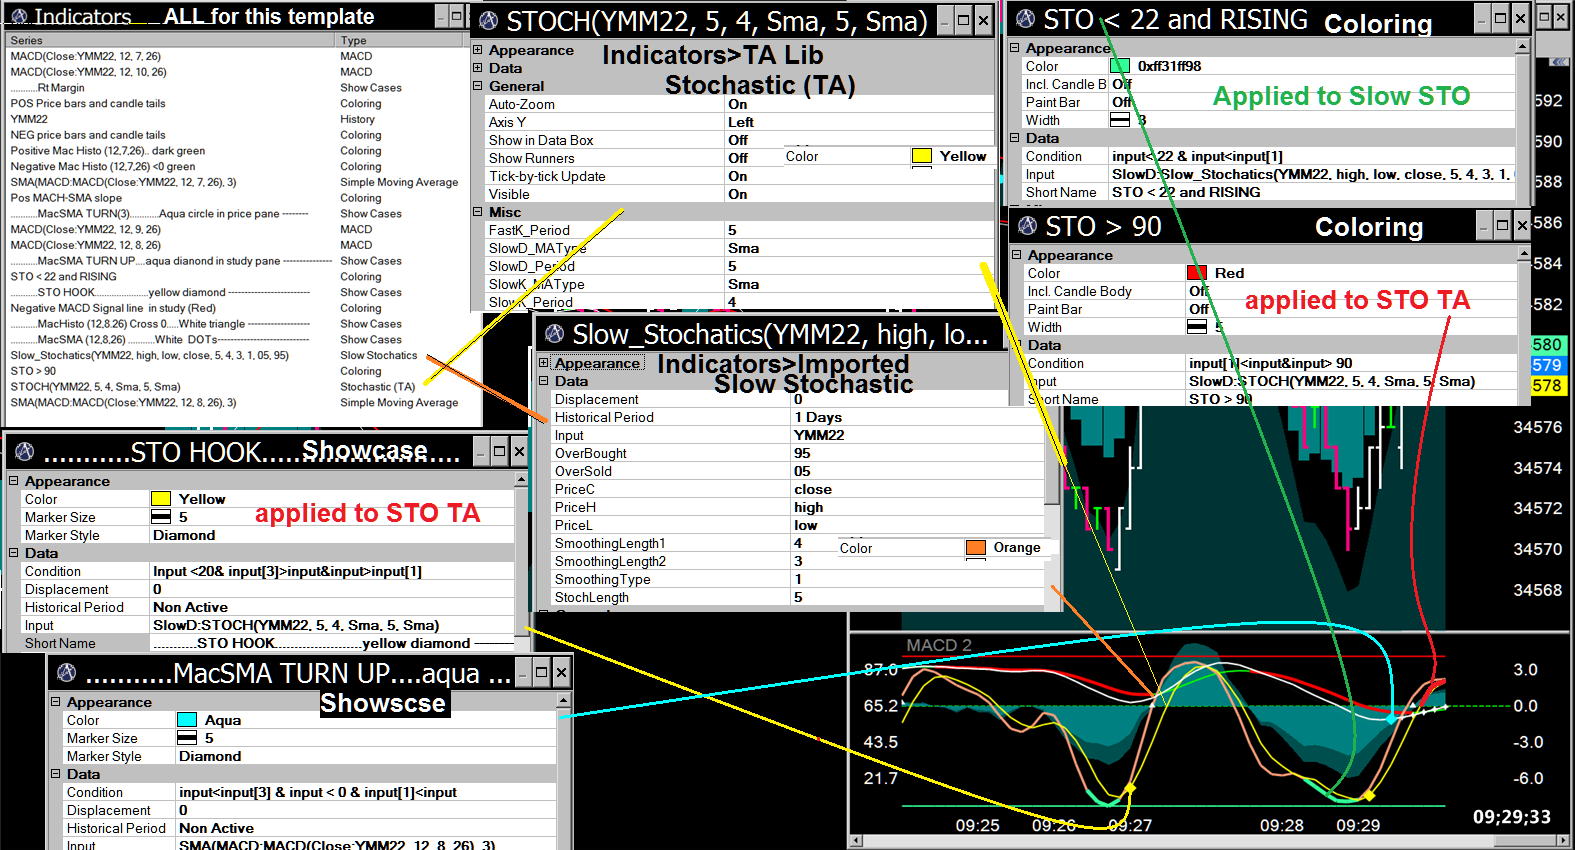
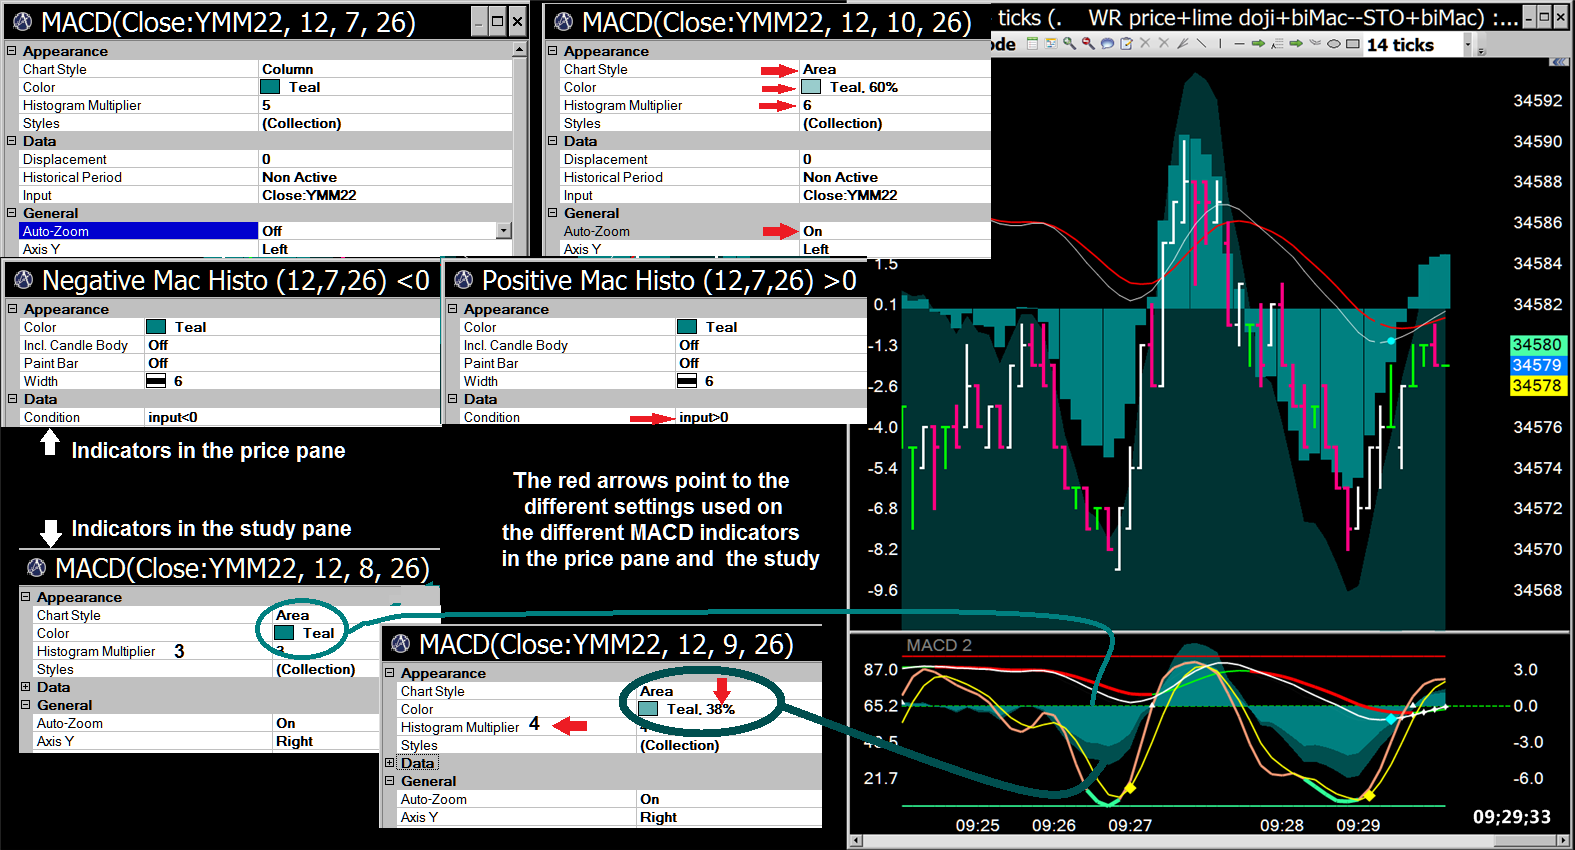
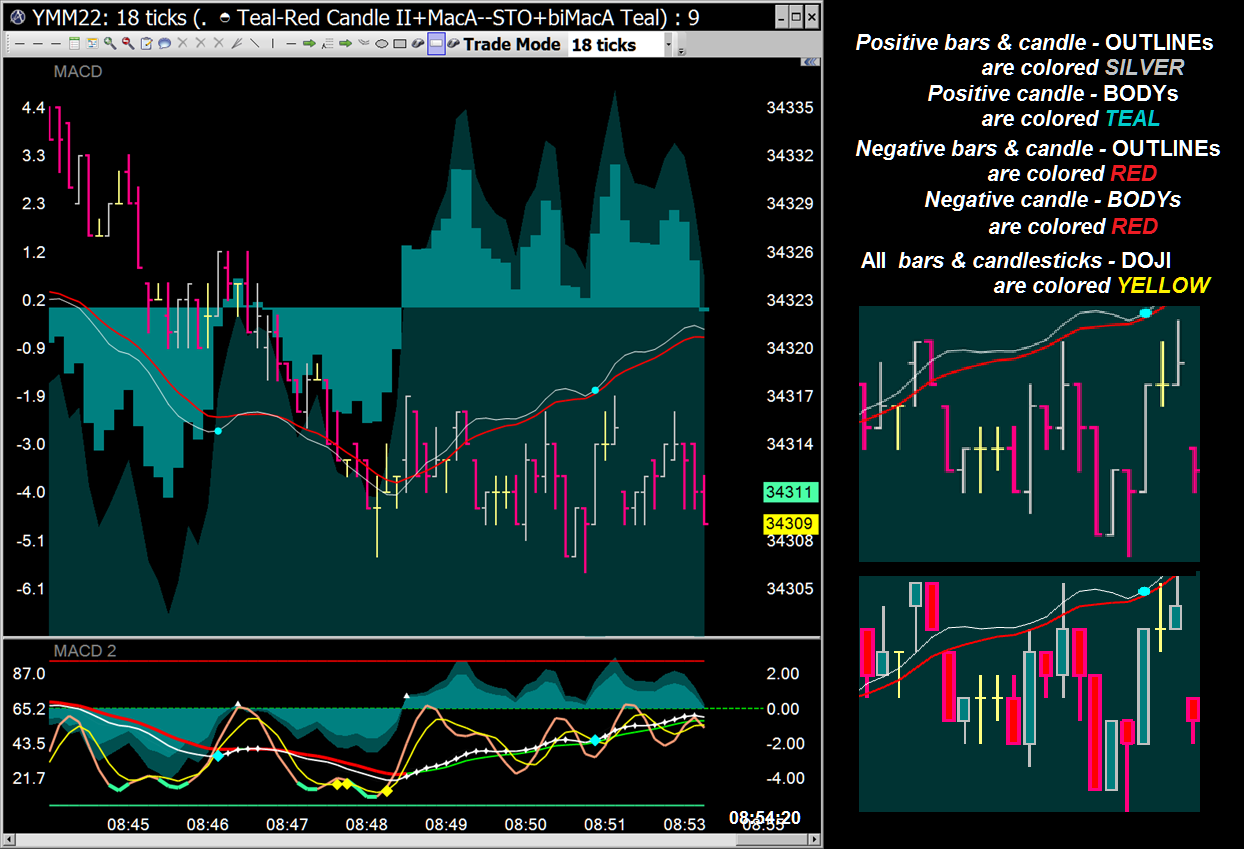
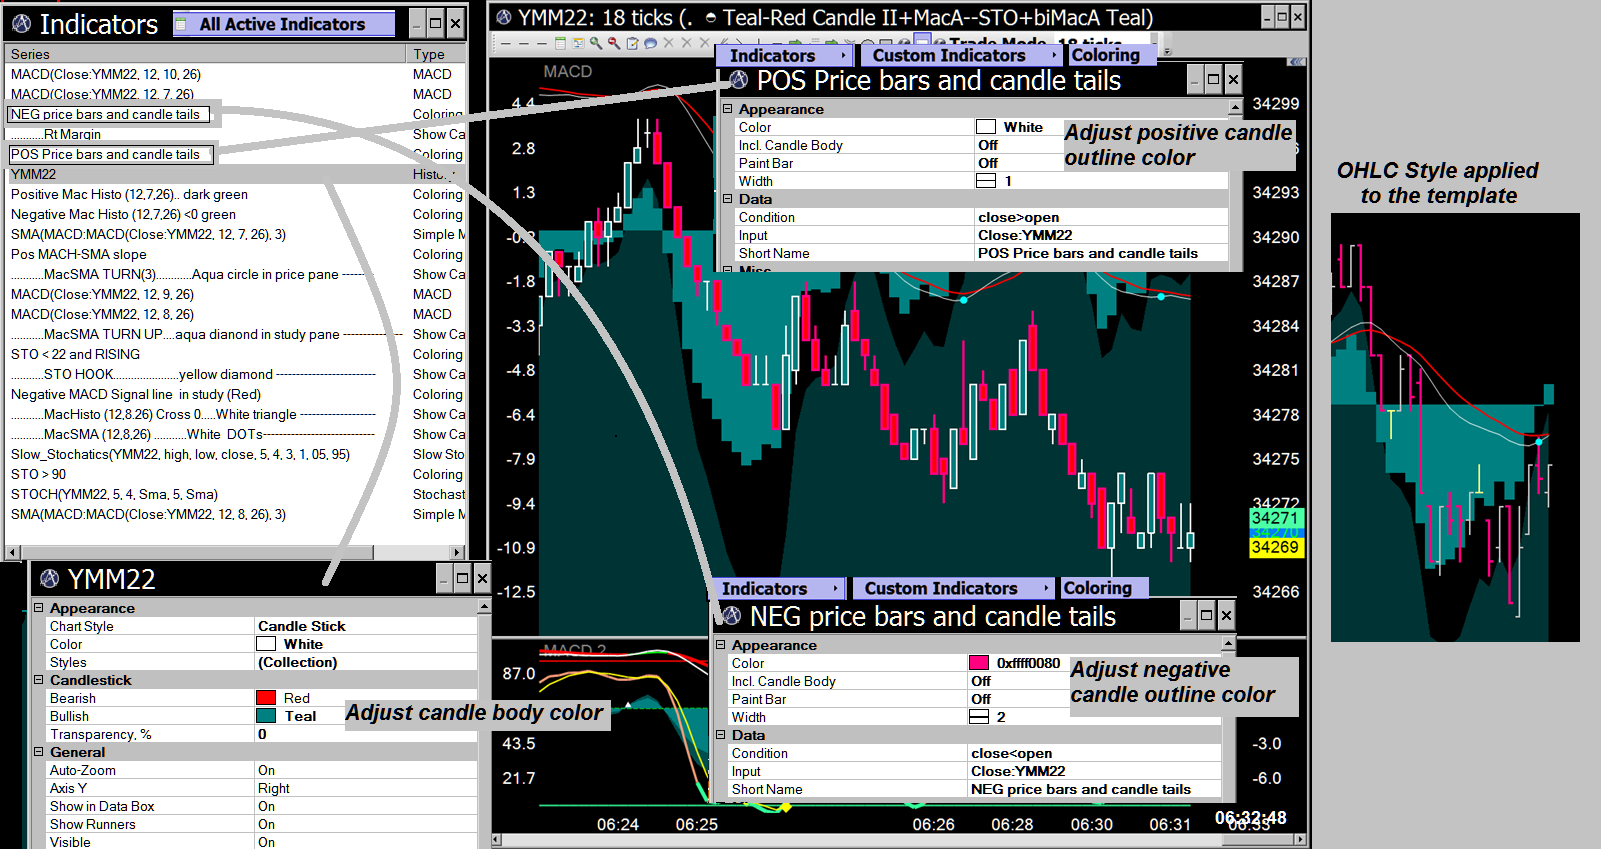
'Some" of the settings used creating this template ...
Taking out bits & pieces at a time

Multiple good rationals to take a position ...

Patterns to pay attention to ... that PAY ! ! !
Is it time to abandon the negative patterns?
Should we reject the red H&S pattern and uncompleted BZ retrace level?
Price did break up from the down channel and has retested that area.
...is it too early to embrace the aqua measured move projection?
Stochastic and MACD moving averages disagree again.
... but the fast MACD moving average is hinting at turning up again...

Updated views of 7 monitor trade station array:
(Click here for complete build specs, costs etc.)
Monitors 1 thru 6 are Samsung 27" LED curved screens set to 1920 x 1080 resolutions.
Monitor 7 is a HP 32" LED flat screen set to 1080 x 1920 resolution with Portrait (flipped) orientation.
Here's how the charts on monitors 6 & 7 compare - they all have the same
templates applied but have slightly different time frames and different chart widths.

Here's my latest 7 monitor layout

To paraphrase Andre Agassi ... "Adjust-ability is EVERYTHING" ,,,
Here are some chart setting properties possibilities with ApexTrader software
Stochastic 1-2 Punch pattern...often precedes a price-action reversal :
Price makes a lower low while stochastic makes a higher low (price to indicator divergence)
Also note the MACD moving averages are trending upwards as the pattern developes.
The pattern often happens across multiple time frames and is a great entry signal.


Back to back Slingshots in an uptrend . . .

Playing the long bar after signals print ...

Stochastic and MACD MA's agree...futures heading down...
DOW 30 is lagging the S&P, NAZ and the RUT e-mini futs


Sometimes it seems too easy...should it be illegal?

The Stochastic and MACD indicators indicators...all you need
Slightly different short time frame charts - either or both print good entry rationals for entries
A divergent 1-2 stochastic punch pattern prints on the 16 tick
while the divergent histogram is easier to see on the 10 tick.

Seems every time I get a little greedy ... I get burnt
11;58;13 AM... -$25 -5 Stopped (plus commish)
Did not raise the stop order - was giving it every chance to hit
the initial target but it ended up costing me extra $$$ in losses.

ApexTrader order acceptance irregularities today . . . . 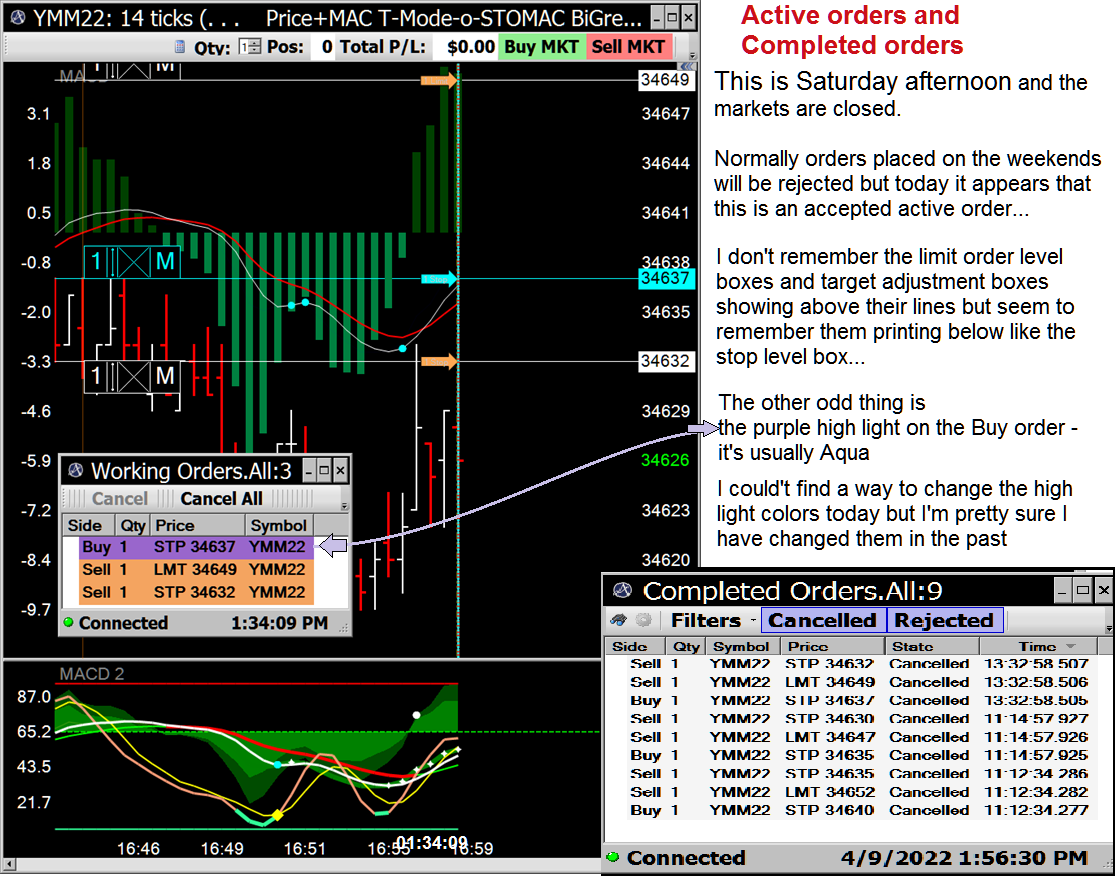
Limit vs Buy-Stop entry orders . . . .

Expanding bars as signals

Sometimes the market doesn't cooperate...was expecting a re-dip for the fill...
(or I was just late to place my order)

In the markets, what goes down must go up
Charts tell you when the odds are favorable for a successful trade.
All ya gotta do is listen to them.

The type of order makes a big difference to your bottom line ...
I like using BUY STOP brackets with Targets and Trailing Stops
that are automatically placed IF & WHEN an order gets filled...
IF price goes my way ---
1st manage the Stop level once the stop has achieved break-even
then raise the Target level if it's warranted

Divergence is a powerful tool...as a leading indicator
The dip afterwards shows a good price action pattern for placing an entry order...
the MACD moving averages were rising and the stochastic was forming a slingshot

Using longer term charts to spot potential entries...
Divergence could be seen on the higher time frame 256 tick chart
so begin to look for a good entry area on the lower time frame chart:

Don't sweat the amounts that might get left on the table ...they are could'a should'a teases.
This chart set illustrates a decent buy stop entry order and a decent exit... with gains

Nanoese ...everybody in crypto-land speaks a foreign language
Here's a few freeware utilities you may find useful...
X Mouse button control
Assign one click functions to your multi-button mouse
Gadwin Printscreen 4.7 ...and... Gadwin Printscreen 6.5
These two image capturing programs capture the images that are under the cursor with a single click:
4.7 captures the open window image, names it and saves it to a file of your choosing
6.5 captures the entire screen image, names it and saves it to a file of your choosing
All three freeware utilities can be setup to operate automatically whenever Windows starts
and need no further monitoring for their operations to perform...
I use X Mouse to assign the scroll wheel button to Gadwin 4.7 and assign a side button to Gadwin 6.5.
Multiple clicking is not required nor is opening Microsoft Paint, pasting, naming and "Saving to File"
(such as when you use the Windows Print Screen key or the Windows Snipping Tool. )
These single click functions are especially useful if you are running multiple monitors
with a lot of open windows (such as a Trade Station layout).
Gadwin 4.7 -- Just the open window that's under the cursor

Gadwin 6.5 -- the monitor screen under the cursor

Print Screen key...paste to Paint

Recurring entry patterns... they can overlap at times or occur separately

Recurring entry patterns...take out bits-&-pieces at a time
Slingshot...horizontal or rising MACD MAs and oversold stochastic
! - 2 Punch...consecutive stochastic lows with divergence to price lows

...a missed opportunity... not paying attention...it happens ...

+7 points = $35 with $10 max draw-down ...
...ya don't always make a killin' when buying the dips...
so you take out what you can until you can see what's happening

"Buy the dips" ... take $100 out ...

Also note the divergent 1-2 Punch pattern that formed before the blue line in the above charts
"Buy the dips" and manage the trade ...

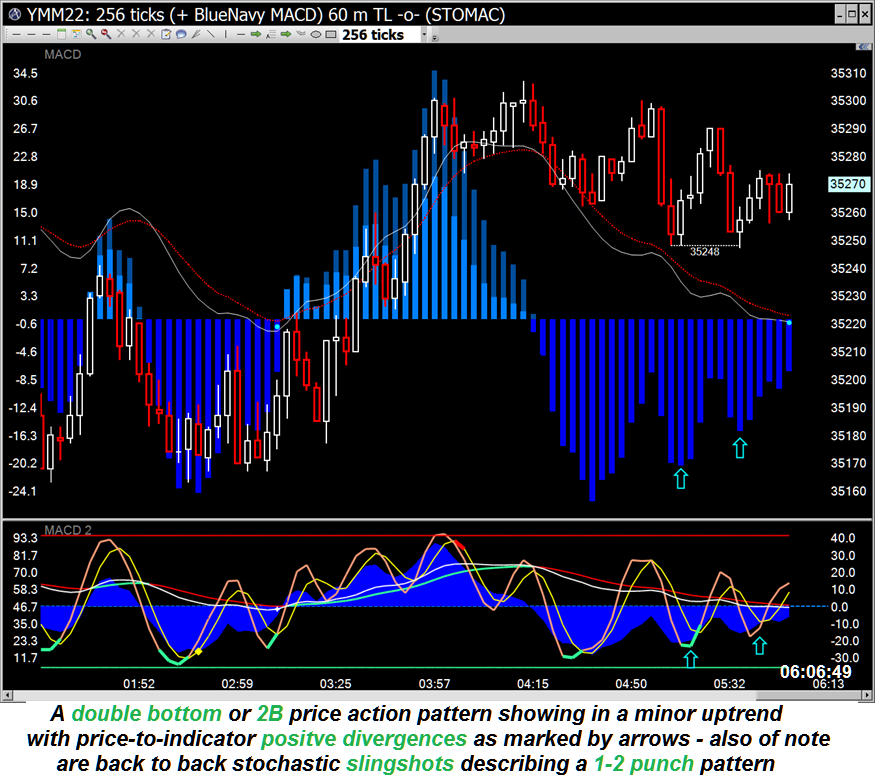
The 2B double bottom with indicator divergence ...
Before the blue line -- a Slingshot with rising MACD MAs and stochastic %D lines

The better ENTRY was had on the lower time-frame chart on the right...
Remember "buy-the-dip"?
Call this "trail a buy-stop" down -- above the dip for an even better entry...

Stochastic dipping down meeting the rising MACD Moving Averages ...
A very common pattern that forms after a bounce off a bottom -- Easy to recognize and reliably traded...
The vertical arrows mark the pattern and the entry area on these two time frames.
Good for a 20 to 30 point scalp...($100 to $150)

Why I NEVER cancel or lower STOPS

Stranger things have happened...back to back Measured Moves ...
just to test 2022's high and screw everybody who's thinking the END is NEAR.
What happens when Putin's rejection of fiat money ploy fails to destroy the deep state?

It was just a week ago when the decision may have been made...

To use STOPs or not to use STOPS -- that is the question
How much draw-down are you comfortable with? Price could just as easily gone down as much as it went up.
You've got to ask yourself a question - - Do you feel lucky?


