 News
News  Market Data
  Discover
Support: 888-992-3836
Copyright © 2023 InvestorsHub Inc.


ls7550
![]()
Register for free to join our community of investors and share your ideas. You will also get access to streaming quotes, interactive charts, trades, portfolio, live options flow and more tools.
Register for free to join our community of investors and share your ideas. You will also get access to streaming quotes, interactive charts, trades, portfolio, live options flow and more tools.
Hi Adam.
I use a more simplistic model. Real yields (cash interest minus inflation) will tend to be either positive or negative. When positive even cash is expanding your wealth, stocks, bonds, cash do OK. When negative investors may flight to gold or seek to be in debt.
Gold's dividend comes from trading it, volatility capture. Stocks tend to provide rewards through price appreciation. Bonds reward via interest. At very long dated bonds there's little difference between stocks and bonds, both are volatile, some stocks are more bond like than some bonds. There can be a degree of shorter term inverse correlation between the two however. Check out this example and since 1972 50/50 stock/gold has compared to all-stock in total rewards.
So counting mid/longer term as stocks=bonds, then fundamentally that leaves stocks and gold as having variable multi-year inverse correlations.
Owning a home avoids having to find/pay rent, you are in effect both landlord and tenant, liability matched. A home can also serve as late life care home costs cover/insurance. Home + imputed is similar to share price + dividends, however house prices tend to correlate more with gold than stocks i.e. is somewhat centrally between stock and gold. When mortgage yields are negative in real terms people are in effect being paid to hold a mortgage/debt and that is a attractor when real yields are negative.
Pre 1972 when still on the gold standard, money could be converted to gold at a fixed rate, it made more sense to hold money deposited and paying interest, as at year end that higher amount of money could be exchanged back for more ounces of gold. In effect the state (Treasury) paid you (T-Bills/whatever interest) for it to store your gold. The ending of that standard meant a transition from a very very low volatility asset (constant price) to a very high volatility asset, that is best partnered with stocks, a barbell of two polar opposites that's like how a 1 and 20 year treasury bond barbell combines to a central 10 year bond bullet, stock/gold combines to be like a central currency unhedged global bond bullet. Much of historic advice however is to partner stocks and bonds/cash i.e. aligns more with pre 1972 and money being exchangeable for gold at a constant/fixed rate. No harm however if you still stick with the original pre 1970's 50/50 stock/bond choice as that blends high and low volatility assets rather than two highly volatile with a element of inverse correlation assets (stock and gold).
Clive.
AIM gold with stock as 'Cash'
As you've noted many indicators are suggesting that stocks look relatively high. However applying AIM to gold where stock total returns are its 'cash', applied to real price changes (after inflation) is recently showing gold to be considered as toppy also (85% cash indicated so 85/15 stock/gold being suggested).


So a situation where gold has made good real gains, and AIM is suggesting reduction, but where stocks are also perhaps expensive. Little wonder given all of the trillions of Quantitative easing across US, Japan, Europe, UK that yields are so low, prices high.
One or the other will break (stocks or gold), so the more neutral choice would be to 50/50 the risks. Which if all your liquid wealth, along with owning a home, is as TooFuzzy indicated a Talmud style (third each in land (home), commerce (stocks) and reserves (gold). It's also along the lines of Old Money, generational wealth that suggest 'a third, a third, a third' - land, art, gold. Cambridge University did a study of Keynes' art collection that provide a long term comparison of art versus stocks and found that in total return terms to two yielded comparable real gains, so substituting art (a very specialist field) with stocks aligns that to the Talmud advocated choice.
For a UK investor, Home in Pounds, Stocks in US Dollars, gold (global currency) is nice currency diversification. Whilst asset diversified across land, stocks and commodity assets. Concentration risk is one of the major risk so that diversification reduces that risk. Earlier years sequence of returns risk is another major risk factor and the diversify/correlations of those assets are such that SoR risk is reduced.
Put aside home value, and looking at just 50/50 stock/gold and for a newly retired investor at the end of 1999 after stocks had done well a all-stock choice with a 5% SWR (5% of initial portfolio value - where that value is uplifted by inflation each year as the amount drawn in subsequent years) might have seen like a reasonable choice.This however indicates otherwise. Click the 'inflation adjusted' tickbox in the chart and the 2003 run down (dot com bubble burst) had their portfolio more than halved. 2009 financial crisis pretty much finished off the portfolio (halved it again). But it did still manage to battle on until 2018 before totally being spent/lost. 50/50 stock/gold however was fine.
Over other periods stock/gold 50/50 and a 5% SWR failed. If for instance you'd started that back in 1980 when the Dow/Gold ratio was near 1.0 levels (gold very expensive/stocks cheap). Pick a more neutral year such as a 1985 start date and both 50/50 and all stock were OK, but where all stock netted a higher overall gain.
Lowering SWR, even a little can make a big difference. 3% is pretty safe, 2% is pretty bullet proof. My own SWR is a low % and I'm pretty much home to cover otherwise having to find/pay rent, along with a equal split between UK stocks, US stocks and gold.
For those in a accumulation phase, sequence of returns is pretty much irrelevant, large drops are opportunities for savings to buy/accumulate at cheaper prices. Low risk, even a positive benefit.
AIM gold with with stock as "cash" suggesting to be lighter on gold, and AIM of stock (or Relative Valuation etc.) suggesting to lighten up on stock, combined could be interpreted as passing it down to see cash reserves being expanded. But equally cash is at risk of being eroded by inflation/taxation. In retirement a 'beneficial' factor is that it doesn't really matter too much, as long as you have enough to see you through perhaps 20 years then beyond that it might not matter at all, where your home value might cover late life care home costs. More of a risk for heirs.
Regards. Clive.
Hi Tom. RE leverage
As you know I'm a keen user of leveraged ETF's. Prefer to hold 50/50 in 2x/cash rather than all in 1x.
Example
In the UK Investment Trusts are more common than ETF's. Stocks that solely trade in stocks. Many are just closet index trackers where the alpha they add is lost in management fees, but with differences. Such as at times they're priced to premium/discounts to NAV so you might try and time such. They also have the flexibility to scale - maybe at times being 80/20 stock/bonds, at other times maybe 120 stock (leveraged). 100% stock is just a figure, at times it maybe more appropriate to be 110% long stock/whatever. And as you note times of real leverage can be relatively short.
In using/holding leveraged ETF's that better ensures you can continue using them. Much negativity has been directed towards retail holdings of leverage and barriers have been instated. Each time I trade for instance I have to jump through hoops first - that exempts the provider from losses that may arise.
Fundamentally when trading it just boils down to shifting half as much 2x capital value as 1x otherwise indicates.
Also tends to get you looking more at the return on 'cash'
For example 33 in each of stock/gold/bonds as a 'cash' proxy.
Regards. Clive
Hi Ken.
I used the link that Vitaali posted in #45100 to watch the Robert Lichello in person video on Youtube - and it's nice to put a actual face to the figure, and in which he showed/mentioned the worksheets at the back of the AIM study material.
Regards. Clive.
Hi Tom
I periodically update a AIM of the S&P since 1871 as sourced from Robert Shiller's data http://www.econ.yale.edu/~shiller/data.htm
AIM monthly of the inflation adjusted price (rather than the more conventional nominal share price), no dividends or cash interest included (assumed both are spent) and as we're using inflation adjusted share price changes we also discount the AIM cash figure by inflation (cash deflated (more usually)), as that way better reflects the overall real (after inflation) total AIM portfolio gain (excluding cash interest and dividends).

Broadly that's provided a 2.2% annualised real portfolio gain, where historic 4.25% average cash interest/dividends might have been spent, so of the order of a 6.5% overall annualised real gain.
Recent indicated percentage cash is up at 55% levels, quite high by historic levels over the last century. Around as high as the mid 1960's that subsequently saw relatively poor rewards for investors, and approaching the highs of the dot com bubble peak and Roaring 20's peak (late 1920's).
Today's ceiling however can become tomorrows floor, but when a turn does occur they tend to be hard and fast. If stocks take a 33% haircut even cash earning nada sees its stock purchase power rise +50%.
BTW the charts/figures are all US$ based (US CPI etc.).
3% real (synthetic) inflation bond recipe
All in TIPS/inflation bonds is a high concentration risk. Best never to be all-in on anything. With a current era of negative real yields even on 'safe' inflation bonds I thought I'd share this Easter recipe (in the UK our fiscal years still align with the Catholic calendar years so we're more inclined to rebalance at end of March/early April years so we can opt to make changes in the old or new year (or a combination of both) according to whatever might be the more tax efficient).
Ingredients :
World stock tracker fund
Gold tracker fund
Treasury bonds
Preparation :
Divide the total $ amount being invested by three and drop one third into stocks, one third into gold.
With the remainder put 3% of the total portfolio amount aside as your first years income (cheque/check account), that's a perpetual inflation adjusted withdrawal amount i.e. at the start of the 2nd year you adjust that $ amount by inflation as the amount drawn from the portfolio for the second years income, and so on. That's commonly called a SWR (safe withdrawal rate) and is a nice inflation pacing amount (consistent).
With the rest (30% of total amount) divide that by 10 and buy 1, 2, 3 .... 10 year treasury bills/notes/bonds in equal $ amounts. i.e. a simple 10 year ladder.
Cook : for a year i.e. until a bond matures, that's the time to 'rebalance' the portfolio. Rebalancing involves putting 3% of the then total portfolio value into another 10 year Treasury bond purchase, draw your SWR amount and sell/buy holdings to bring all three of stocks/gold/bonds back close to a third each capital values. That may involve adding to or reducing treasury bond holdings, when so just use discretion as to which ladder rungs are drawn-from/added-to. If the differences in weightings are relatively small its perfectly acceptable to not bother making any portfolio changes. Primarily you're looking to not have too much in any one asset as concentration risk is a major risk.
Rinse and repeat.
Reasoning/Concept :
A 50/50 barbell of Stock and gold are two polar opposites. One (stocks) will tend to do well during prosperity when real yields are positive, the other tends to do well when stocks falter and real yields are negative. Combined they form the equivalent of a currency unhedged global bond, similar to how a barbell of 1 and 20 year treasury bonds combine to form a central 10 year bond bullet. When that is combined weighted 66% and supplemented with 33% cash the overall portfolio gain progression is inclined to be relatively linear and upward sloping over time. Example here
Primarily for retirees. When your young and still adding savings then declines are buying opportunities that help cost average down the average cost of stock. When you're retired and drawing income you don't want for instance a decade long period of negative total real (after inflation) returns (with dividends/interest reinvested) when you're also drawing income from that portfolio as the two combined can pull down the portfolio value to critical/fatal levels. Check out this link for example and click the inflation adjusted tickbox in the chart. That shows a 3% SWR rate applied to the above and compared to all-stock. After just a couple of years the all-stock portfolio had lost more than half its inflation adjusted value.
Here's yet another more recent example for 2000 to 2009 where at the end of Feb 2009 just 32% of the inflation adjusted 2000 start date portfolio value remained.
Yes over other periods when stocks do well, it will lag, but still provide OK rewards, meet its 3% inflation bond type objective.
Beneath the seemingly simple concept of diversifying equally across stocks, commodity and bonds and holding some foreign currency (gold is also a form of global currency), there's some interesting characteristics. You're in effect using 3% of the current portfolio value to buy some income in 10 years time. If the portfolio had done well then the 10 year income being bought would be a higher amount than if the portfolio had performed poorly. More often after a portfolio has endured a bad decade, either the preceding or subsequent decade tends to do relatively well. So whilst a maturing bond after 10 years that was relatively lightly loaded due to poor portfolio performance a decade earlier may fall short on providing the SWR type withdrawal, likely portfolio gains since will be inclined to have been good. Similarly if a maturing bond was relatively heavily weighted i.e the portfolio had done well when that bond was purchased a decade earlier, then the current portfolio value may be relatively poor (bad decade), but where there may be sufficient capital arising from the maturing bond to cover the SWR. A form of time-shifting to average out performance and overlap good/bad times to yield more 'average' result.
I'd go as far as suggesting that is actually safer that TIPS due to not having high single asset concentration. If for instance TIPS were withdrawn, or taxation policies changed adversely, 10% inflation, 10% TIPS yield, 40% taxation = -4% real net outcome, perhaps compounded over a number of years. And at present negative inflation bond yields in many cases, more rewarding also.
With recent good stock gains, now might also be a appropriate time to consider taking some off the table. Buffett for instance who typically AIM's with 10% cash reserves, is more recently aligned to more like 30% reserves.
Happy Easter and merry cooking.
Clive.
Long time since I tried downloading and running Newport as per the prior posting in this thread, but seeing a recent revival I gave it a try. The sticky thread at the top points to a old no longer existing link to the files, you have to follow that thread to get to the posting where the links are still valid, i.e. the prior post in this thread to which I've attached this reply.
Downloaded the files and extracted the .zip file and viewed the html file using a browser (that calculates/shows the current stock.npt date). Edited the stock.npt file within the NEWPORT sub directory to change the value to that latest indicated stock.npt date.
Installed DOS box (you'll have to do that for whatever platform you use, for me (I run Linux) it was available in the package manager).
Started dosbox and then within dosbox I ran
mount c: C
and then
c:
to cd to that mounted drive and then ran
windows
i.e. typed windows.bat and pressed ENTER.
Password is not set i.e. just press Enter when prompted for the password.
Alt-Enter maximises the Window to full screen for me (alt-enter again to restore the window size).
Remember when you add a stock it has to have 5 characters and historically most have opted to just append underscore characters to fewer than 5, so for instance MSFT_
Should say that personally I prefer the pencil and paper choice. Sooner or later data issues or corruption/failure may occur, typically at the worst possible time. Pencil and paper records that you periodically digitally scan/copy and email to yourself to keep a off-site backup copy is the more resilient choice IMO.
I think the title should be updated because of inflation.....
A.I.M. For A Billion!!!!
How's your Mum's hip healing?
Hi Tom. Re Vaccinations
I had Shot 1 last Friday. No side effects other than a bit of soreness at the site.
Hi Tom
A while back you discussed having Investments, Land and Gold
Hi Toofuzzy
I would be happy to be holding 50% or MORE cash now.
Re: AIM's propensity for accumulating lots of cash
Nowadays we're pretty much well blocked from buying US ETF's/funds thanks to the European Union
If I were the other side of the pond I'd probably opt for something like this as the 'cash' element. A 50/50 cash/Permanent Portfolio combination. Nowadays we're pretty much well blocked from buying US ETF's/funds thanks to the European Union (a fraudulent name IMO - yes its Europe based, but far from representative of Europe as a whole (UK alone has a population that is larger than the combined population of 15 EU member states)) and its pathetic rules (that also annoyingly has nearly every web page requiring a 'accept cookies' button). Glad that we'll soon be outside of that (come January). The current UK plan is to absorb EU FATCA type rules at day 1, but I can see rapid divergence if the EU starts blocking UK financials - which I anticipate it will. A 15% smaller EU economy this year (Covid), another 15% next year (after UK leaves), and it will be seeking to stamp some degree of authority recognition anywhere it can. 75% of Russians live within Europe, so maybe it might turn in that direction to welcome Putin in LOL! He opines it is like the former USSR - but even worse.
Hi Toofuzzy
if you had the 20/20 foresight to buy 30 year zero coupon bonds in 1975
1965 to 1985 was a pretty dire time for investors, a large part of the reason why Robert Lichello devised AIM. A decade or two of flat or even down total investment real (after inflation) rewards when all of interest and dividends are being reinvested, does not bode well for those also drawing a income. Looking at UK data over those years for the no rebalance/draw 2.4% SWR from highest valued asset

and the remainder capital value just about paced inflation. But that as a remarkably good outcome compared to the alternatives. Yes nominal gains looked OK'ish over those years, but after you factor in high/rising inflation - well it was that inflation that was the killer.
And the UK endured more severe inflation than did the US.
Yearly UK inflation rate (1975 ... ouch!)
1965 4.50%
1966 3.70%
1967 2.50%
1968 5.90%
1969 4.70%
1970 7.90%
1971 9.00%
1972 7.70%
1973 10.60%
1974 19.10%
1975 24.90%
1976 15.10%
1977 12.10%
1978 8.40%
1979 17.20%
1980 15.10%
1981 12.00%
1982 5.40%
1983 5.30%
1984 4.60%
1985 5.70%
Not that we're likely to see such inflation any time soon, the main concern is that of deflation. But you never know. Early years sequence of returns risk tends to be the greater risk. Take a big hit early on and recovery + providing a income ... can be illusive.
Cash by the way in those charts = one year treasury bill yields i.e. assumes you bought a 1 year T-Bill at the start of each year. In practice Cash Deposits tend to reward more, but may not be fully protected if the bank hits problems.
Currently I'm looking at a senile asset allocation. Allocate initially equally between stocks, gold, cash; Pick a SWR such as 2.4% (0.2%/month), set stock to auto reinvest dividends and just draw the SWR each month/quarter/year from whatever asset is the highest value at the time and otherwise nothing else to do.
The drift in weightings provides some indication of which asset fed you the income over time, which varies according to start date. Started in the 1970's and again from 2000 and its mostly been gold. Started in 1980 and it was mostly stock.

In each of those cases after 20 years there had also been modest real gains on top .. around 2% real, which might have supported additional 'top-slicing' for the one-off expenses/costs. So could still leave sufficient for late life care home fees/costs.
Hi Tom
The Permanent Portfolio, 25% each in stock, gold, short dated treasury, long dated treasury, might alternatively be considered as a form of stock/bond 50/50 and a gold/bond 50/50, held equally
A 10 year treasury bond bullet is similar to a 1 year and 20 year treasury bond barbell
Looked at from that aspect...

and there's a degree of visual inverse correlation where the two might zigzag around each other. Will it be stocks down/gold up; Or stocks down; Or just gold up ???
Clive
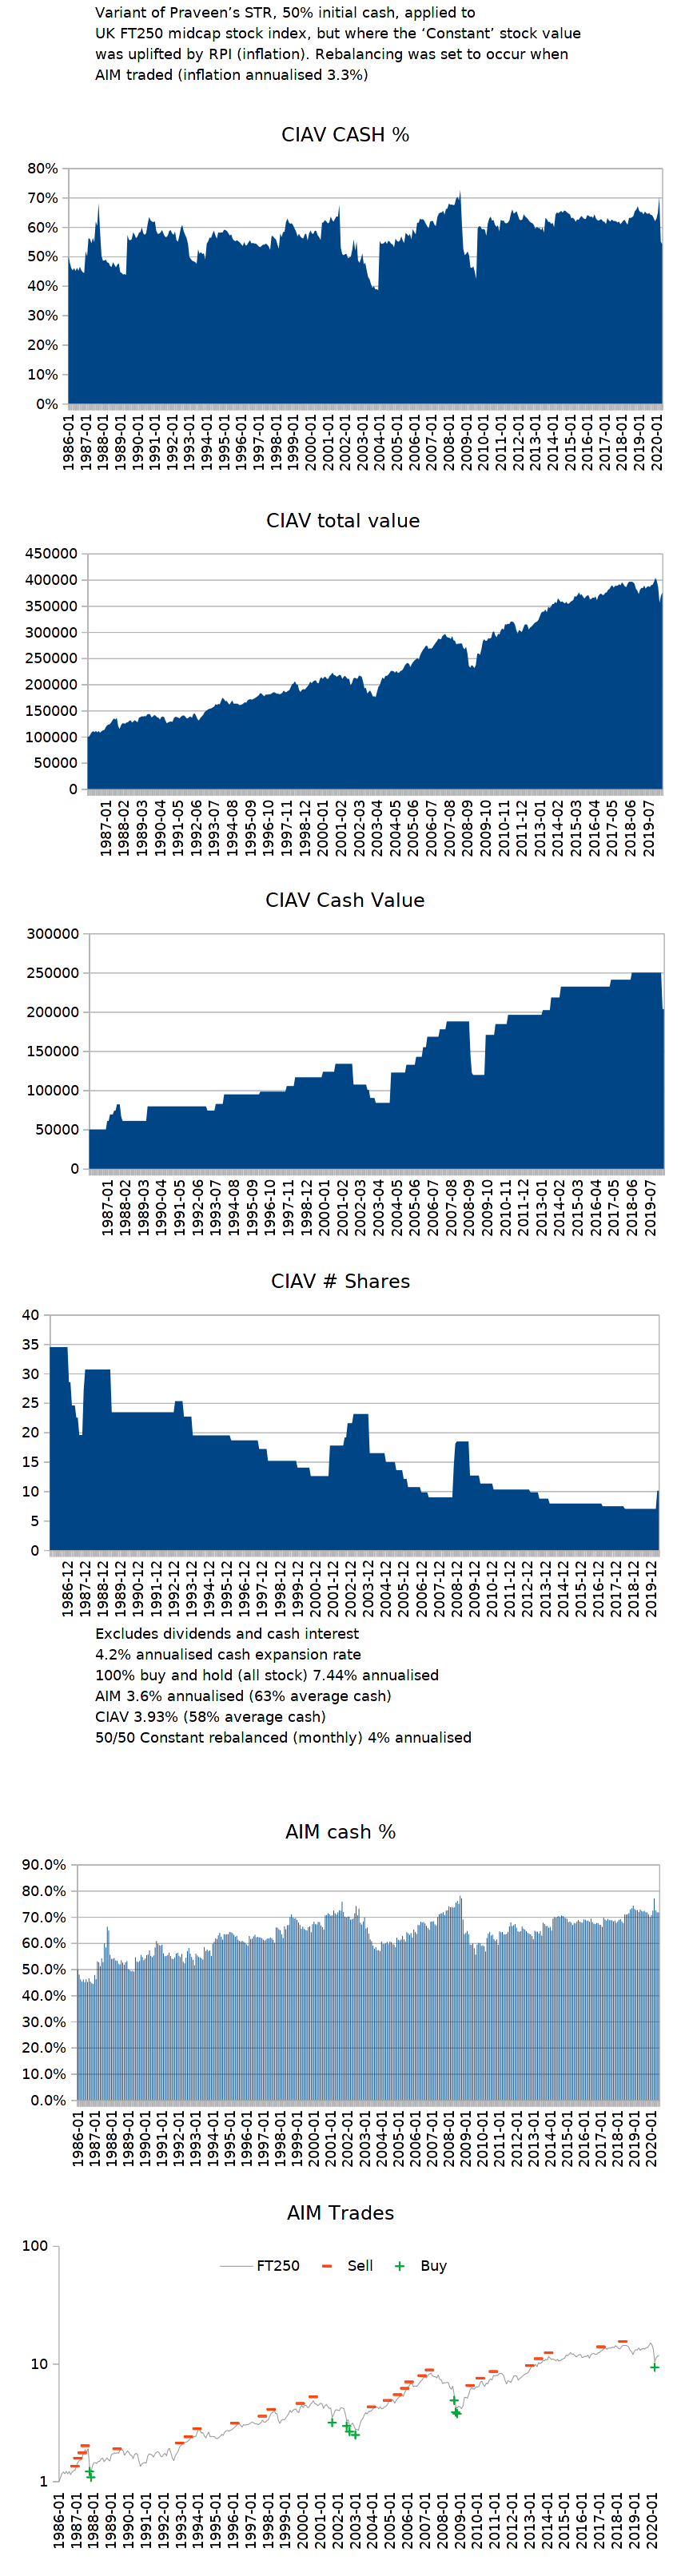
Hi Nick
Looking at that backtest data, and its the combined gain + cash expansion growth rate that is the figure that should be compared. Buy and hold all stock 7.44% versus 3.93% constant inflation adjusted value (CIAV) along with a 4.2% cash expansion rate = 8.13%, so around 0.69% more. For the AIM that accumulated more cash (less average stock) the figure is around the same, broadly comparable (less growth, more cash).
Fundamentally income being provided from stock dividends, cash interest and possible real gains on top (ahead of inflation) that might be top-sliced/spent.
A difficulty with top slicing is identifying when and how much to top slice. We might however for instance just run CIAV purely against the stock price (exclude dividends) and cash without interest included, and spend all of the dividends and cash interest. That CIAV will have a dynamic stock/cash weighting over time and if our actual cash to stock ratio has a higher percentage cash level than the CIAV then we can also spend the difference. Thereby providing a automatic means to determine how much 'top-slicing' is appropriate (the 'how much' element). The 'when' element could be as simple as - whenever a fixed rate bond/holding had matured and we had actual cash in hand.
On the assumption/basis that AIM and CIAV can yield comparable rewards/benefits, of the two CIAV/Praveen's STR method is the easier to grasp/manage IMO. Keeps things simpler for heirs that may have little/low interest to pick up and run with.
Fundamentally with buy and hold you compound more gains as that retains more shares. With CIAV and more so with STR and perhaps even more with AIM you see greater levels of cash throw off/spending. Where CIAV/STR/AIM are broadly similar, and that yield a better overall benefit than buy and hold in combined growth + income terms. But perhaps little different to just simple 50/50 yearly rebalancing (that will tend in contrast to accumulate more growth, provide less income). All very broadly speaking.
When you're spending dividends, cash interest and surplus real gains (top-sliced) then your income streams are diversified. It's only natural at times that those individually will rise and fall. With lower cash interest so stock prices might be expected to have relatively risen, such that real gain top slicing might have risen, but where cash interest had fallen. Yes, maximising cash interest is also beneficial. Reasonable choices for 'cash' IMO are the likes of the Permanent Portfolio, or a third each in stock, gold and cash.
https://tinyurl.com/y9qghjjm
I visualise stock/gold 50/50 as being a barbell of two extremes. Stocks tending to more reflect changes in nominal yields, gold tending to reflect changes in real yields, that equally weighted combine to a central 'bullet' type holding, somewhat similar to how 20 year Treasury and 1 year Treasury in equal measures barbell combines to being comparable to a central 10 year bond bullet. But where at times both stock and gold can move in the same direction such that cash helps dilute down the negative cases, and where more often after such high correlation (both stocks and gold down) more often a adjacent year will see one or the other tending to snap sharply upward (compensate for the bad year ... and more).
If you consider stock to be a form of very long (undated) conventional bond, and gold to be a undated inflation bond, then pairing that with long dated conventional bond and TIPS/inflation bond would seem to be reasonable. The Permanent Portfolio however opts to hold cash instead of TIPS. Since 2001 a PP with TIPS has compared to a third each in stock/gold/cash, however the conventional PP with short term treasury has outperformed both of those. Going back further however and a third each stock/gold/cash has been better overall, but with moderately higher volatility. Overall I like that stock/gold/cash choice as for me as a UK investor I can hold domestic Pound cash, US Dollar stocks, and gold is a form of global currency ... so nice currency diversification. Whilst being asset diversified across stocks, commodity (gold) and 'bonds' (cash). Each to their own.
Regards.
Clive (a.k.a Clean Bee :)).
Hi Jack
As per the intro/header over on Praveen's STR board
The basic Stock Trading Riches system is to build a portfolio of many positions. Each individual position is assigned a constant value (which never changes) and is rebalanced once a year. Growth happens at the portfolio level. The portfolio consists of the individual positions and a cash balance.
Happy ID
Yoda's definition of a IDIOT : Independence Day and In Oval office is Trump.
We have our barmy PM Johnson lookalike over here in the UK, and apparently they get on well with each other. Whodathought.
Actually I'm sure they're great guys doing there best, but in the present era anyone getting onto TV automatically becomes a celebrity, and that automatically appoints them to being open to get hit by all of the celebrity dirt-slinging. Sign of my age, I don't even recognise the majority of proclaimed celebrities in the news these days.
Hi Toofuzzy.
Good points. Thanks.
Clive.
My age will require me to start mandatory withdrawal soon from my "retirement accounts." So, such discussion is of interest to me on a personal level.
Hi Praveen
Applying a variant of STR that instead revises the Constant Value upwards by inflation, so that the stock value is biased towards having offset inflation, with no dividends or cash interest included, did a reasonable job overall. All Constant Value methods tend to throw off copious amounts of cash over time, which is nice for those in drawdown/retirement when supplemented with dividends and cash interest.
I started that - what I'm calling Constant Inflation Adjusted Value (CIAV) with 50/50 stock/cash (applied to the UK's midcap FT250 index) as earlier years sequence of returns risk is the most dangerous time to endure a big drop.
Instead of yearly reviews/rebalancing I opted to use the same months that AIM traded, more just for comparison purposes. In practice rebalancing as and when bonds (cash) mature is more ideal (liquidity).
Fundamentally some/many investors invest in stocks in anticipation of a share price that offsets inflation, along with providing dividends on top. And if the share price does rise broadly with inflation so the dividend value also increases broadly with inflation. Invest just in cash, and perhaps the interest might offset inflation, but leave no surplus income (broadly/generally).
With 50/50 CIAV the trading saw cash-throw-off expand at a rate greater/faster than inflation, whilst having the constant value set to rise with inflation would also tend to ensure that the stock value rose with inflation over time. Leaving dividends and cash interest earned free to be spent.
The following image outlines the results, along with the results from a standard AIM (again just price only, no interest or dividends included).
Overall I like your STR as it better caters for matching bonds maturing with trade/rebalance time points. It's also easier to manage IMO, teaching others AIM and that has more quirks/stumbling points whereas STR is a much easier concept that seems to generate comparable rewards.
With age, I've become more indolent, a greater tendency towards keeping actual holdings/investments as simple as possible, as such I'm more in the simple once/year rebalancing a portfolio back to target weightings and with a asset allocation that has capital preservation more utmost in mind over that of maximising potential rewards. So I'm largely indifferent as to which may or may not be the better overall portfolio management choice and looking at the above results the differences are negligible. AIM tends to accumulate more cash which the likes of Vealies can negate; Standard STR will also have a tendency to accumulate cash if just being applied to a single holding - that multiple holdings and deploying spare cash (>30%) negates; So also however does yearly rebalancing to target weightings; So more a question of whichever portfolio management method/tools one feels most comfortable using. So this posting is intended more as a general observation, isn't intended as any form of critique of any of the individual choices/methods.
I do hope you are keeping well. I lost my father 12 years ago and still miss him dearly every day. As a only child I can't even begin to imagine the loss of both a father and brother at near the same time.
Kind regards.
Clive.
Hi Tom
I've struggled with the idea of what weight each sector should have in the total portfolio
For standard AIM, 50% initial cash, 10% of stock value minimum trade size over the same period, looks to me that AIM opted to migrate to a overall 40/60 type average weighting. Only had 1 trade, a sell trade.
Whilst less rewarding than both Buy and Hold (all stock) and 50/50 constant weighted the rewards were still acceptable i.e. pretty much supported a 4% Safe Withdrawal Rate (SWR) and still had (most of the) inflation adjusted portfolio value having kept up with inflation.
Under other circumstances it could have been quite different. Sequence of Returns (SoR) risk tends to he highest in yearly years, if for instance stocks and dividends halve shortly after buying then a former 4% withdrawal rate intent in effect becomes a 8% withdrawal rate desire in order to compare - which is far far less likely to succeed.
If you look for instance at AIM of SPY (S&P500), 50% initial cash, dividends and cash interest excluded (standard AIM) since 2000
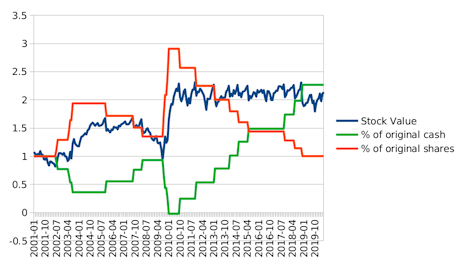
and how it varied things over time in terms of the increase/decrease in cash and shares relative to the start date i.e. cash could also be considered as being a 'share' of $1 value/price and AIM revises how many of cash 'shares' it holds over time. Basically AIM over doubled up on the number of cash shares it held, and ended with around the same number of stock shares as at the start. It sort of constant weights the stock value, but with interim/periodic increases in that level. In the above case that constant value rose and then sideways ranged at around the 2 times level ... which pretty much offsets inflation.
2000 was somewhat a bad time to have started. Over another period AIM can direct the portfolio to another overall balance. This for instance moves the start back back 5 years to 1995 i.e. during a Bull run (up to 1999 highs).
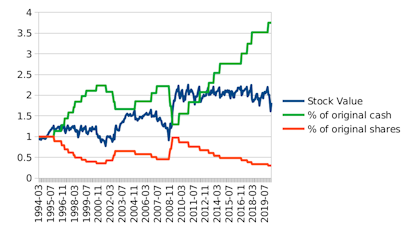
In that case AIM opted to end up holding only around 30% of the number of shares it started off with, and it also opted to massively expand cash 'shares'. More so as those values exclude also having dividends and cash interest added on top.
If you have been retiring back in 2015 and opted for all in on IYH then so far that would have been OK at supporting a 4% SWR, but that would be high risk. Yes you'd have been rewarded more for having taken on that risk, however AIM could have provided the same income with considerably less risk. If IYH had endured a bad SoR following purchase it was far better placed to achieve the 4% withdrawal income goal than might a all in buy-and-hold of IYH that (could have) endured a dive/dip in the earlier years/period.
A tendency with AIM is that it improves (reduces) risk even more over time, it has the tendency to be a constant stock value type method, but where that is periodically stepped up to a higher level (that tends to offset inflation), which broadly tends to result in large amounts of cash being accumulated and where cash accumulation/expansion can exceed its burn rate (withdrawals for spending). So you can either start a new AIM when cash reserves are considered too high, or Pull Vealies, or simply just sit back on holding a portfolio with less risk (relatively high levels of cash/low levels of stock).
Health/pharmaceuticals have tended to hold up well across the Covid-19 period - likely due to potential anti-virus drug/procedures potentials. Others such as banking and oil (at least in the UK) have been dismal, halving down type movements, along with dividends also being totally cut in many cases (UK state policy is to 'assist' firms financially but not if the intent is to pay dividends (reward shareholders) potentially with those sums. Very likely is that buy and hold of a oil stock would have seen a serious hit, whereas AIM would likely have made the best it could under the circumstances and been vastly better for the investor.
Less so in the US due to the greater tendency to retain more of earnings, but in the UK broadly you might anticipate price appreciation, dividends and cash interest to all broadly compare to inflation. So you might consider share price only as being the inflation offset, and a income that broadly might compare to inflation. Or you could flip that around and assume that cash interest and dividends would offset inflation and the share price appreciation was the real (after inflation) reward. AIM without dividends and cash interest considered might typically see something like cash and stock values doubling up perhaps over 20 year periods which equates to a 3.5% annualised rate. Separately there will be cash interest and dividends being provided, along with AIM throwing off cash by reducing down the number of shares it holds. I guess investors could opt to use AIM either way, i.e. pure AIM without cash interest and dividends included (spending the interest/dividends) and leaving the AIM to offset inflation, or investors could spend the AIM gains, and leave the dividends/interest as the inflation offset 'growth' element (and adding new AIM's along the way as part of that, or pulling Vealies). Fundamentally they're the same, just mental accounting/partitioning.
Clive.
PS whilst IYH under standard AIM traded very little since 2015, Lichello was OK with that. He even dedicated a chapter indicating such for the Retired Individual, where IIRC he indicates that balanced funds are OK for the retired AIM'er even under AIM-HI (20% initial cash). I guess if the balanced fund you AIM is a 50/50 stock/bond blend then that halves the volatility so AIM trades less frequently, but where it throws off much more cash (dividends and bonds). AIM HI against a 50/50 stock/bond asset would be somewhat like a 40/60 stock/bond holding initially, in contrast to being a 25/75 stock/bond holding if standard AIM (50% initial cash) was being applied. Again both of those are likely to be very safe for a retired investor. Better than all in bonds/cash, with way less risk than a stock heavy portfolio. Whilst the rewards might still be reasonable. Perhaps 3% type real gains, such that a all bond investor that drew down bonds over 33 years to zero and had nothing remaining, even with a standard AIM against a balanced fund that perhaps generated 3% real could have the investor still sitting on a portfolio similar to the start date inflation adjusted amount after the 33 years, despite perhaps just having held relatively little stock (low risk).
Going back to 1972 and looking at the difference between a 3% SWR applied to 25/75 stock/cash compared to all cash https://tinyurl.com/ydbn4sc5 i.e. a time when high inflation and drawdown was a considerable danger (one of the main reasons why Lichello devised AIM) and in inflation adjusted terms even to date that would still be chugging along quite nicely whilst the all-cash investors money would have been exhausted in 2015 (which in itself wasn't too bad) i.e. lasted around 43 years. All stock also survived through that 3% SWR rate, but a couple of years after starting in 1972 were seeing their portfolio value down more than half in inflation adjusted terms (-52% down at the end of December 1974). Likely some would have capitulated at around that point, such that whilst they would have been better to stick with it, instead capitulation would have left them with bonds of less than half of the value of their lifetime savings after just a couple of years of having been hoping for stocks to cover their retirmeent.
When interest rates were modest the Central Banks/Fed could revise interest rates up/down at monthly reviews. Nowadays they've resorted to printing/buying assets on a daily reactive basis. Might be best if the Fed/CB's just published a daily figure that they think the market value should be, so they didn't have to bother buying/selling, the simple act of stating a figure that they would buy/sell assets to achieve that level would have the market automatically adjust prices to that level. The EU (Euro) in contrast looks increasingly more inclined to just continue printing money to buy up all assets, a form of grand nationalisation.
350 years ago Feudalism evolved into Capitalism and increasingly its looking like Capitalism is evolving into Post-Capitalism, but where that transition will involve conflicts between post capitalism abundant free goods, services and information, and the 'old' capitalist system of monopolies, banks and governments trying to keep things private, scarce and commercial. What might post capitalism look like ??? With capitalism obsolete, individuals contributing to the whole according to whatever their skills/abilities, where most might 'work' in a occupation purely to keep themselves occupied and robots/technology fills in the gaps.
"Old-money" (generational wealth) style asset allocation (a third, a third, a third ... such as land, art, gold) might win out during such transition. A interesting read is Art as an Asset: Evidence from Keynes the Collector (David Chambers, Elroy Dimson, Christophe Spaenjers) Published: 29 January 2020.
Executive Summary :
John Maynard Keynes (economist (1883–1946)) started building his art collection in 1918, buying works by Cezanne and Delacroix. In later years, he added pieces by Cezanne, Degas, Matisse, Modigliani, Picasso, Renoir and Georges-Pierre Seurat. A study valued the collection over time by using various insurance appraisals conducted over the years as well as estimates commissioned by the authors from specialists in 2013 and 2019. If the combined works had kept pace with inflation, they would have been worth about 500,000 pounds. Instead, they were worth 76.2 million pounds, not too far short of the 90.2 million pounds the authors calculate Keynes would have generated in the U.K. stock market. “The long-term returns from the Keynes collection are substantial,” according to the report’s authors, David Chambers and Elroy Dimson of the University of Cambridge’s Judge Business School and Christophe Spaenjers of HEC Paris. However, the ten most valuable items of the works he amassed account for 88% their total value — and just two of the works account for almost half of the entire collection’s valuation.
“...This translates into a nominal internal rate of return (IRR) of 10.4% (6.1% in real terms). The year 2019 value of the art collection is only 16% lower than what it would have been if Keynes had instead invested his outlays in U.K. equities, reinvesting dividends (costlessly) back into the portfolio; the annualised underperformance relative to the equity market is just 0.2%. The collection performed especially well shortly after purchase, suggesting that Keynes was able to buy art at attractive prices. Yet, even over the last six decades the collection continued to appreciate at an annualised real rate of 4.8%. After procuring additional valuations for the collection’s most important works in both 2013 and 2019, we conclude that our estimate of its performance is robust to averaging across idiosyncratic elements in the valuation of individual artworks.”
In the real world, average private investors tend to be below the AIM users average.
The reason ... in images ...

... and consequence ...
 .
.
Whilst mathematically AIM might appear to be 'average' (middle road), the realities in practice is that mathematical average is 'good enough', whilst in practice most private investors don't achieve anywhere near that mathematical average. Often after having bought high (greedy), capitulated when low (fear). AIM'ers are happy to provide liquidity to those "investors", even though its like shooting ducks in a barrel - not much fun, but with investing you're not in it for the fun.
RE: More Twinvest
Say someone inherits $1.5M, is content to drawdown $500K of that over the subsequent 16 years, would rather not invest into stocks at the present time at relatively low yields, low inflation (high prices) and would rather time/cost average in over the 16 years.
$500K set aside for the drawdown over 16 years, $2600/month, and where if that 'cash' paces inflation so the $2600/month income also rises with inflation. Money ($1M) destined to be added to stocks is also deposited/invested into a inflation pacing cash deposit/account, and they set their TWINVEST to add £5200 to stocks each month (which over 16 years = $1M).
Discounting the drawdown $500K amount, that's $1M of cash that will be added to stock on a regular monthly time/cost averaging into stocks, for/over 16 years.
If the stock gains achieve a 4% annualised real rate of return, then at the end of the 16 years they'll have a all stock position of inflation adjusted value comparable to the combined $1.5M start date amount. They started with 0/100 stock/bond, ended with 100/0 stock/bond, so over the 16 years averaged 50/50 stock/bond overall stock/bond (ignoring the bonds that were being held for drawdown/spending).
That's without any benefit that Twinvest might add through its relative valuation based adding (or not) into stock each month.
Sequence of return risk is shifted so as to be zero at the front end, full head on at the tail end. If anything front end has positive sequence of returns 'benefit', in that if stocks halved the week after having started, then there's the option to forego using Twinvest and lump into stocks heavily after such share price declines.
That twinvest would have to be adapted to account for inflationary increases in the monthly amount being added, but that's easily resolved by just adapting Twinvest to flag percentages of stock and cash each month instead of hard capital values. And as Tom indicated, its best to stop/restart Twinvest after the share price had doubled (restart with a new Twinvest CODE).
Whether that might be better or worse than had they 50/50 AIM'd the $1M constantly instead ??? Fundamentally it would likely be a case of the particular sequence of returns seen over those years. Which often equates to relative valuations at both the start and end dates. If you opine that valuations are high at the start date then Twinvest could prove to be the better, if valuations were low then something like AIM-HI would likely be the better. If you're indifferent then classic AIM (50/50) is the middle road choice.
Hi Tom. RE: TWINdeVEST
Don't take this as reliable, very quick and dirty first cut spreadsheet
... but looks promising what applied against real world cases.
I ran two tests, comparing TWINdeVEST against all stock (S&P500, US inflation/$ values) with a 4% Safe Withdrawal Rate applied ($333/month, inflation adjusted withdrawals), one starting at the start of 2000 i.e. prior to the dot com bubble burst/down market, and another starting at the start of 2009, close to the Financial Crisis lows.
Both saw TWINdeVEST perform reasonably well. For the 2000 start date version it did run of of cash (was all in stock) at near the 2009 lows, so I just assumed it was stopped at that point. At that time all-stock was down to £34.2K from a original $100K start date value, whilst TWINdeVEST was down at $46.6K.
For the 2009 start date run, TWINdeVEST ended May 2020 with $301.1K (and 94% % stock) whilst all-stock stood at $320K. Considering TWINdeVEST started at 75% stock it did a reasonable job of keeping up with all-stock in a strong Bull phase.
75/25 yearly rebalanced constant weighted with the same withdrawals saw the 2000 to 2009 run with $50.9K, whilst the 2009 started run had $255.5K at the end of May 2020; So a modest amount better than TWINdeVEST in the Bear case, but considerably less in the Bull case.
Clive.
PS : Multiplying the bad case by the good case values (gains), had TWINdeVEST ahead of 75/25 which in turn was ahead of All-Stock.
i.e. 0.466 x 3.01 ... for TWINdeVEST versus 0.34 x 3.20 ... for all stock (and 0.509 x 2.55 for constant weighted 75/25). Such that over full cycles (both types of cycles, Bull and Bear) TWINdeVEST came out ahead).
Hi Tom. RE: Twinvest
Reminds me of some old notes - adapting Twinvest to cost average out. Same arrangement for calculating the CODE, but where you start with 75/25 stock/cash and use the Twininvest figure as the amount to be taken from cash, taking the rest from stock. My testing notes at that time indicate that the figure can exceed the actual desired withdrawal rate, so for instance if drawing (rather than adding as per standard Twinvest) $100/month, and the current figure indicates $107 (and shows -$7 from stock), then just revise that to $100 from cash, $0 from stock. My notes for that also indicate that if that were used as a indicator of a reasonable time to add to stock, so -$7 from stock being indicated relative to $100 withdrawal amount, then increasing stock value by 7% at that time (moving some of cash over to stock) did improve overall results, but only marginally. Hardly worth the bother, so that idea was discounted (on re-reading my notes with a fresh mind however not so sure I should have so lightly dismissed that idea, as it seems to very much align to when AIM would tend to be increasing % stock).
Overall, in mildly zigzagging around break-even share price my records/notes indicate all methods compared similarly (all-cash, all-stock, 50/50 and taking half of income from stock, half from cash and TwinDEvest). Similar for if the SP dived 30% and then recovered, not much difference between the choices. Where TwinDEvest shined was in a stock Bull run, where after a 60% rise, 10, 11, 12, 13, 14, 15, 16 type share prices for instance, TwinDEvest that started with 75/25 stock/cash ended up with over 90% of the gains achieved by all stock (so disproportionately high/good) value, considerably more than both 50/50 and all-cash. After a 30% share price decline series it held more value than all-stock. Overall it mathematically exceeded all-stock over all cycles, and where in holding some cash equates to having done so with less risk. i.e. all stock had 1.58 good case, 0.69 bad case, product 1.09, whilst TwinDEvest had 1.44 good case, 0.77 bad case, product 1.11. Other zigzagging cases tending to generally compare no matter what asset allocation/method.
For the good case, of starting with 75/25 stock/cash and seeing the share price repeatedly rise, then initially you took 75% of the income from cash, 25% from stock, but as the share price rose so more was taken from stock, less from cash. After a 50% rise in share price from the start date level you were down to 50% of income being taken equally from cash and stock.
Revising your http://web.archive.org/web/20120609071154id_/http://www.aim-users.com/twinvest.htm ...
To determine your "TwinDEvest Code" you take the intended periodic withdrawal amount and multiply by 0.75. This value is then multiplied by the share price of the mutual fund or stock in which you are interested. So if you were to choose $100 per month and a stock worth $20/share,
1) $100 X 0.75 = 75
2) 75 X $20 = 1500 which is your TwinDEvest Code.
You won't have to calculate the Code again. Just write it down someplace where you'll remember it.
Load 75% into stock, 25% into cash
Your first withdrawal takes the 1500 Code value and divides it by the share price of $20 giving you $75 taken from cash, leaving $25 being taken from stock value.
Next month the share price is $22. So you take 1500/$22 = $68 from cash and $32 from equity. Etc......
If the amount indicated to be taken from cash is greater than the actual intended withdrawal amount, then just draw the full $100 withdrawal amount from cash, nothing taken from stock.
Cash is reduced from 44700 - 20,000 = 24,700
How to do the above? can you elaborate?
Starting a retirement period at the likes of 1980's/1990's Bull phase and typically rewards were good/great, didn't really matter if you were 50/50 or 100/0 (stock heavy would have seen more gains, but if rewards are 'enough' either way = success).
Starting in the 1970's or even from 2000 is a different matter. The sequence of returns were harsh for some (stock heavy).
AIM of S&P500, price only, no dividends or cash interest considered, and in real (after inflation) terms that rose by around 33% since 2000. Over those years cash as 10 year Treasury Bond, along with S&P dividends, combined 50/50 averaged 3.2%. The AIM started and ended with around 50% cash, i.e. AIM identified that as the 'optimal' choice over those years. Which is nice outcome, as a 50/50 stock/10yrT investor by luck also hit that appropriate choice. Looking at how AIM, 50/50 constant weighted (yearly rebalanced), and all stock performed since 2000, with a similar 3.2% inflation adjusted income being drawn, and ...

All-stock down from $10,000 start date value down to $3000 at the 2009 financial crisis lows ... Ouch! Some, confident in seeing the 1980's/1990's great gains/rewards, ten years into retirement 2000 retirement, panicked and capitulated to 'save what little was left' (30% left of their original retirement pot).
The 'by luck' constant weighted 50/50 investor did much better. And at the end of September 2019 date was seeing their portfolio up nearly 20% in inflation adjusted terms relative to the January 2000 start date level. AIM in contrast was up over 33% :)
So even when a near optimal constant weighted (50/50 yearly rebalanced) investor by chance had selected the appropriate 50/50 choice, AIM still bettered them. AIM in being variable/dynamic weighted adjusted the weightings appropriately over time, 50/50 wasn't always the best choice and AIM revised things accordingly, to good effect.
Robert Lichello expressly stated that with AIM, safety is paramount.
Clive
PS AIM did run out of cash at the 2009 lows, didn't have cash enough to fulfil AIM buy suggestions and the above AIM includes not having enough cash, i.e. didn't buy more shares than what it had the cash to buy shares with. If surplus cash could have been found/used - then the AIM result would have been even better.
Safety of AIM.
AIM is safe by nature/default. For many, too safe. If you want to increase risk and tendency to average more stock exposure then you could uplift PC by the amount of dividend value of dividends received, or by inflation ... or whatever.
AIM is better for retirement than accumulation. For accumulation more often simply buying more stock/shares out of surplus wages as and when that money becomes available will tend to generate the highest value.
Consider Alice who in coming up to retirement might opt to solely hold cash (deposited to earn interest that might broadly offset inflation), and spend 1/33 of the value in the first year, 1/32 in the second year, 1/31 in the third year ...etc. A form of 3%/year spending rate, and where after 33 years the money is all spent. Bob in contrast might opt to hold all stock, spending the dividends, and where the dividends might also provide a 3% inflation adjusted type income, but where the stock value also tends to broadly rise with inflation such that after 33 years they might still have their entire start date value still intact in inflation adjusted terms.
Carol might opt for a choice somewhere between Alice and Bob’s choices, some stock, some cash. But how much? Common choices are 50/50, 60/40, 66/33 ...etc. and they’ll often constant weight to those levels - for instance rebalance back to 50/50 once/year. If you measure outcomes over historic periods there will be a optimal choice, such as 46/54 or whatever – but that cannot be known in advance. With Lichello’s AIM however the results over time tend to see AIM converge towards that overall historic average optimal level. If 45/54 was the optimal historic measure, then AIM over that same period might see its actual average stock/cash over the period close to those figures. AIM is a form of ‘Variable Weighting’ style – rather than using a Constant (fixed) Weighting, and where more often AIM’s overall actual average Variable Weighting level is near optimal in reflection of how stock prices actually moved over that period.
Another factor is timing of rebalancing. When to reset back to 50/50 or whatever proportions. Once yearly perhaps? Not at all? Well again AIM tends to be better than average, it indicates amounts to be added/sold at times and in a manner that was better than had you not rebalanced or used fixed yearly rebalancing. AIM is not always the best, but more often than not it is. Yet another benefit of AIM is that its trades are modest enough to be more inclined to actually be followed. Many investors who for instance are due to yearly rebalance at coinciding time of deep stock price declines more often opt, due to fear, to not rebalance. They fear greater stock losses to come, and in failing to rebalance they often lose out and look back with regrets of the missed rewards from having failed to rebalance. AIM has us more inclined to have appropriately rebalanced, albeit more often via several trades one after another rather than a single large amount at a single point in time.
A significant risk for a investor who opts for all-stock/spend dividends is what they call Sequence of Returns (SoR) risk. If you were hoping to draw $40,000/year from a $1M portfolio i.e. 4%, but soon after lumping into stocks, share prices halved, then to support the same desired levels of income the portfolio has to support a 8% withdrawal rate – which is much more inclined to result in failure. SoR risk tends to be more critical in earlier years than in later years. Standard (original) AIM of 50/50 initial stock/cash has SoR risk much less of a risk.
In the broad average case the characteristic of AIM is to start with 50/50 stock/cash, and end perhaps 3 decades later with 25/75 stock/cash. Averaging around 37/63 stock/cash overall. i.e. it tends to be a ‘cash cow’, tends to be more of a constant stock value type character. It’s often suggested to hold less stock, more bonds (cash) with age, and AIM broadly tends to do that. But again not always. If SoR risk becomes a reality in earlier years so AIM will tend to increase stock exposure - potentially significantly, perhaps even at times moving all-in on stock (no AIM cash remaining). If the historic optimal choice of stock/cash over the years tends to be for a high stock proportion, so AIM will naturally have tended towards that.
For AIM here, we assume a standard approach of ignoring cash interest and ignoring dividends - we spend those. Our AIM just looks at stock price only, and a fixed cash level of cash (and where AIM trades periodically add to that cash by selling some shares, or uses some of that cash to add more shares). That combined stock value and cash will broadly tend to keep up with inflation over time, even though the natural/average tendency for AIM is to see fewer number of shares being held over time. AIM stock value and cash broadly keeping up with inflation is similar to what a all-stock investor might expect/achieve when they are spending dividends, but where AIM achieved that outcome without the level of early year SoR risk that a all-stock investor endured and in holding less overall average stock exposure, and after having spent all dividends and cash interest.
For retirement AIM is a great portfolio manager. It better ensures you ‘rebalance’ in a appropriate manner and at times that more often were better than periodic rebalancing or not rebalancing; Has significantly lower early year SoR risk; And will steer the portfolio towards what later proves to be near the optimal overall stock/cash weightings.
50/50 initial stock/cash AIM weightings; 10% SAFE, 5% to 10% Minimum Trade Size settings; Review monthly or even quarterly, monitor the share price only; Trade (rebalance) whenever AIM indicates; Spend/withdraw any dividends/cash interest into your cheque/check account for spending. And in 20, 30, whatever years time likely you’ll have a AIM portfolio with comparable inflation adjusted value as at the start.
Clive.
Hi Toofuzzy
“Let every man divide his money into three parts, and invest a third in land, a third in business, and a third let him keep by him in reserve.” So it is written in the Talmud, a record of debates among rabbis about Jewish law dating as early as 220 C.E "
Land ( your home and REITS )
Business ( your own or stocks )
RESERVE ( cash, bonds, gold )
I need a 54% increase to get back to even on this year... I will do it!
... modelling further ...
Assume a crude general motion of a -32% share price drop from former highs, AIM signals a buy and we move all-in, as I defined a couple of posts ago. Thereafter AIM progressively sells around 12% of stock value per trade, until it's down to 36% %stock at which point another Bear hits (-32% price drop that triggers another AIM buy signal that has us move all-in). That's a compound 8 trades of -12% %stock reductions in a row to move from 100% %stock to 36% %stock. Assuming during the Bull period stocks achieve a 8% annualised real (after inflation) reward, then due to declining %stock during that Bull phase (AIM sell trades) we see reduced gains compared to all-stock, my figures suggest being up 56% compared to all-stock being up 100%. We miss part of the Bull gains, but then the next -32% Bear share price drop hits, where all-stock endures the full hit of that decline whilst AIM being at 36% %stock sees less of a loss, 1.56 former value dropping to 1.39 whereas all-stock is down from 2.0 value down to 1.36. Over the full cycle AIM ended marginally ahead 39% up versus 36% up for all-stock. Negligible difference but where AIM got there by holding a stock/cash type blend rather than 100% stock all of the time. Also, measuring the standard deviations in yearly changes indicates AIM having a standard deviation of 4.5% whilst all-stock's standard deviation was 10.9%. So primarily it looks like over full cycles the AIM based method achieved similar overall reward to all-stock, but did so with less risk ... i.e. the typical Sharpe like measure (that in effect is like dividing the annualised gain by the standard deviation).
That all assumes that cash just paced inflation.
Most of the time, during the Bull period, AIM lagged all-stock, its over the full cycle where AIM ends up with around a similar reward as all stock, but whilst having endured lower overall volatility and having been a stock/cash asset allocation blend rather than all stock. All stock buy and hold investors might opine that they care not about interim volatility and see it as just the same overall broad reward, where more often they had pulled relatively ahead of other stock/cash asset allocations, and they'd rather not be 'faffing around with all of that AIM monitoring/trading stuff'. However for those drawing a income stock/cash blends provide the opportunity to draw that income from the cash side when stocks are doing poorly, or from the stock side when stocks have performed well - optionality. And if 'cash' is invested whereby it achieves a > inflation rate of return, so those additional gains will enhance the overall portfolios rewards.
Clive.
Presenting that last chart in my previous post as a line/bar chart looks better IMO.

Fundamentally it moved all-in after a -32% MaxDD (-32% drawdown from prior highest high i.e. first (after a series of AIM sell trades) AIM buy trade), and remained at all-in until the next AIM sell trade; And thereafter progressively reduced stock during the next Bull phase (additional AIM sell trades). Which of course means that you progressively reduce how much of the Bull run gains you capture as shares are sold/cash accumulated, but in having reduced stock exposure you also relatively reduce the losses incurred during the next dip/dive.
Would work well with something like small cap stock as the 'stock' holdings (that tends to rebound early/more-strongly following dips (tendency to see bad stocks die and are replaced with baggage free fresh/clean upstarts, whilst by comparison large cap stock indexes are still carrying 'baggage')), along with something like the Permanent Portfolio (defensive/resilient to dropping in value) as the 'cash' holdings.
So for example back at January 2020 year start 70% cash was being indicated, so if that cash was invested in the Permanent Portfolio, along with 30% in stock then the monthly granularity based Corona virus dip looked like ...

$10,000 year start portfolio value at the end of March 2020 had dipped down to $9576 (-4%), compared to all-stock dipping down to $8037 (nearly -20% down).
Clive.
Experimenting with using AIM as a pure portfolio trade engine.
Combined the UK FT250 (UK mid cap, small cap in US scale) price only index, with US S&P500 index in Pound adjusted price only terms (dividends excluded), rebalanced once yearly at end/start of the tax year back to 50/50 weightings. That portfolio/index provides the source 'Price' input into standard AIM.
AIM run with 50/50 stock/cash initial settings (cash % is actually irrelevant here as we'd still generate/record a AIM buy signal even if cash were negative, we're just looking at pure AIM trade signals here), 10% SAFE, 10% minimum trade size. Each time AIM trades the trade is recorded as the percentage amount of current stock value to be traded (rather than the more usual $ amount to be traded). Again no dividends or cash interest considered.
With those trades ... date and % of stock value to buy/sell data recorded as per the image below, I mapped out a tactical play of .... Start with 100% stock. Whenever a AIM indicated sell trade, scale down existing stock value by the AIM indicated % stock value to be sold. Whenever AIM indicates a Buy trade, set % stock back to 100%.

The result was a total gain when dividends/cash interest was factored in comparable to 100% stock buy and hold total return (including dividends), but that averaged 67% stock exposure. What was apparent that AIM often scaled down stock exposure progressively until the next 'dip' occurred, such that it was relatively light on stock exposure and accordingly saw less downside loss due to the dive. But in having moved 100% all-in at the first AIM indicated buy trade whilst it missed part of the decline it partook in all of the subsequent post dive rebound, at least until the next AIM sell trade was being indicated.
The Corona dip wasn't deep enough to trigger a AIM buy, so it continues with around 30% stock exposure rather than AIM having indicated a buy resulting to moving to 100% stock. So it has ridden the Corona wave (dip/rebound) as-is rather than having traded it - at least so far.
(Clearly bored) Clive.
PS the last two charts in the above image are point to point based, i.e. whenever AIM traded, so they miss out the additional noise between those point in time. When charted that way it does look like AIM signals were perfectly timed/traded at the turning point - which isn't the case i.e. after a sell trade the price might have continued on up for a while before dipping down to a buy trade, and similarly continued on down before turning around to hit the next sell trade.

