 News
News  Market Data
  Discover
Support: 888-992-3836
Copyright © 2023 InvestorsHub Inc.


gratitude
![]()
Register for free to join our community of investors and share your ideas. You will also get access to streaming quotes, interactive charts, trades, portfolio, live options flow and more tools.
Register for free to join our community of investors and share your ideas. You will also get access to streaming quotes, interactive charts, trades, portfolio, live options flow and more tools.
no idea, but i doubt they will make any money on them
The same here, I sold my 24.4 mil shares that I held for almost a decade. Glad to get rid of them.
Hi N :)
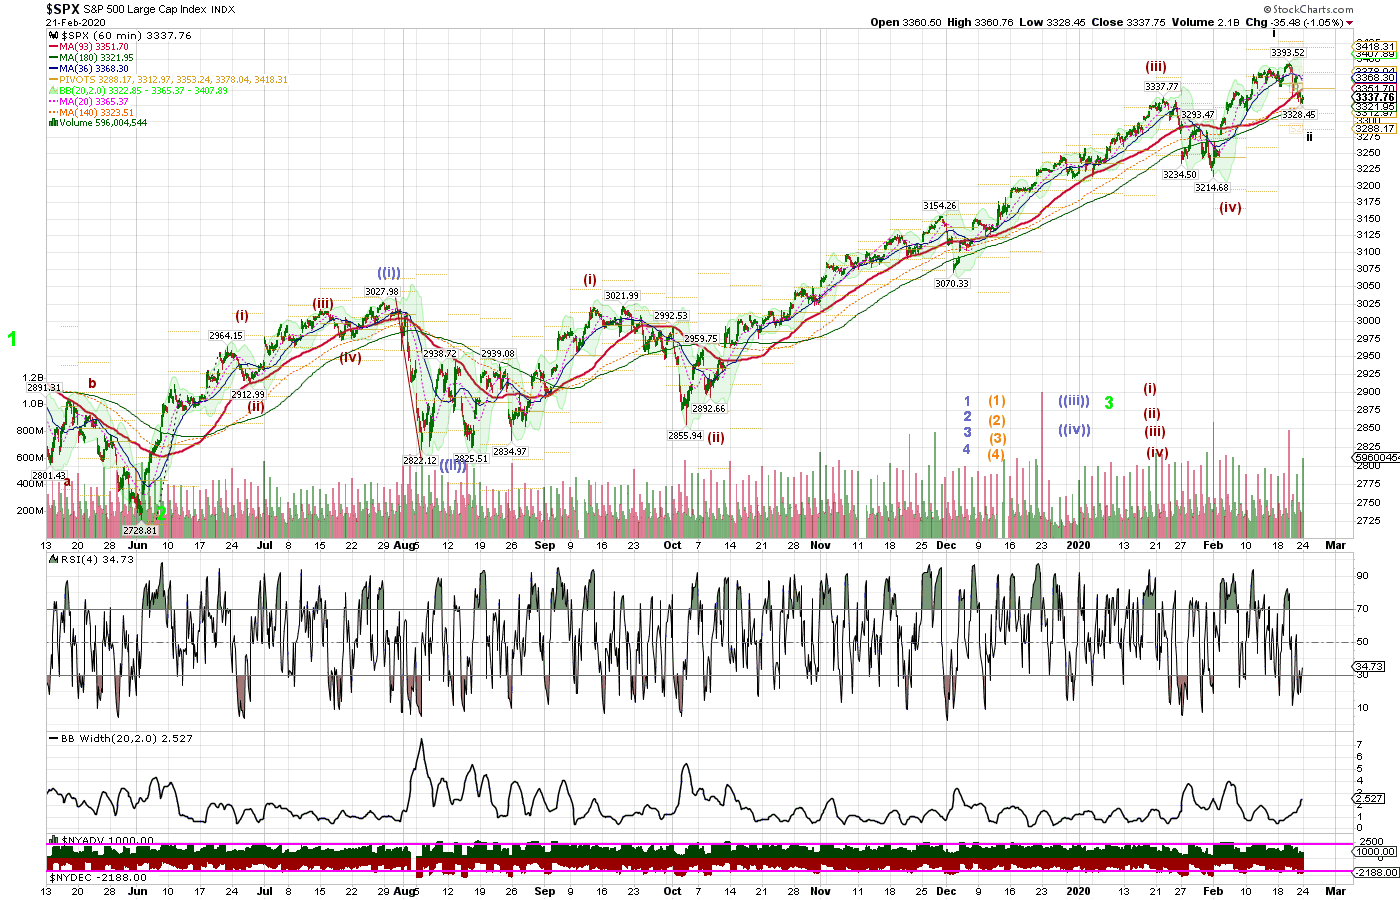
All my indicators, 3 min and hourly turned positive so i believe that it either gaps up from here in a wave 3, or it goes down to 3320 and goes up from there in a wave 3. That's why i believe a black wave 3 is coming. As for target, who knows? 100-150 points from here? The entire red wave 5 should be done by the end of March.
However, you might be also right, and it might go in a zig-zag down - none of these options would invalidate the Elliott waves theory.....
Current Elliott Waves - The spx drop in January of about 123 points I feel that it was not big enough to be blue wave 4, so I reverted to the old count, and i will consider the January drop as red wave 4, one degree lower than the blue one. In February, spx started red wave 5 up, and so far it did black subwaves 1 and 2. I expected black subwave 2 to go a little bit lower today, to 3320, but 3328 is good enough.
Current Elliott Waves - spx made a new high this week, so the probability of having a complex wave 4 down decreased substantially. It is possible that spx started wave 5 up which could take few months. Next week should clarify the count.
Current Elliott Waves - spx is taking a long time to do the correction, so I revisited the count to align it with the latest developments. It seems that spx completed green wave 3 in January at 3338. From there, it started green wave 4 down, which I expect to be a flat (3-3-5). So far, spx did legs A, B and started leg C down.
As I said last week, my daily indicators pointed to down, while the hourly ones kept pointing up. That's rare, and it resolved by changing the expected ABC zig-zag to a ABC flat.
The flat will be invalidated if spx makes a new high before it does the leg C down.

we might get a flat rather than the expected ABC - chart tomorrow
could go either way - it is just ridiculous how they prop up the market for political reasons
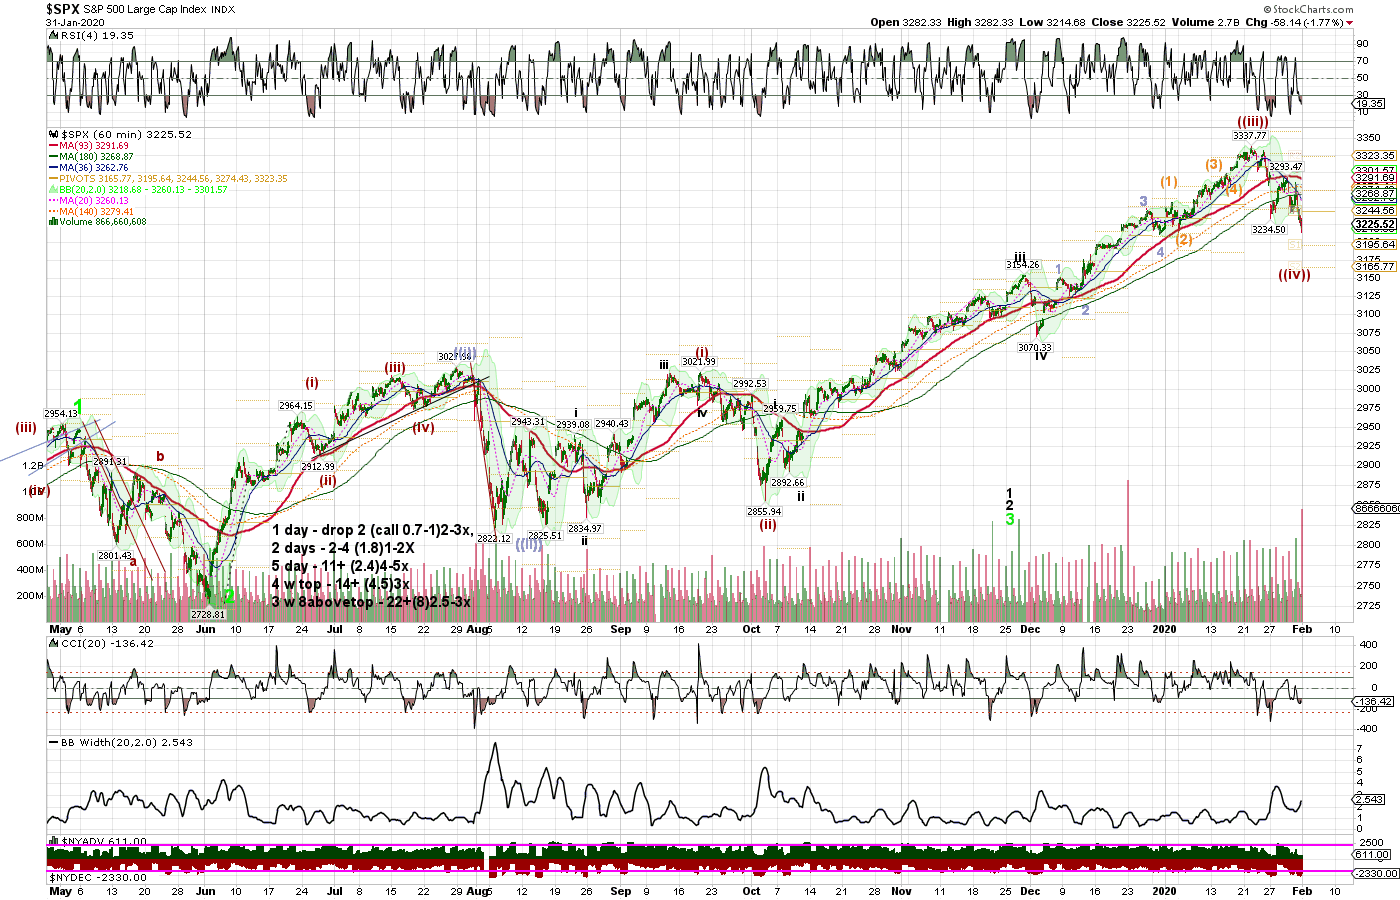
It is possible the correction is over; however i still feel that another leg down should happen soon. Going well above 3338 which is the current top would probably indicate the correction is over. If we do get a leg down, i expect a drop of about 140 points.
Market is doing this ABC down in a hurry, so see below an update:
Spx finished leg A at 3214 and is doing now leg B up, which might be done. From here, if my count is right, it should head down to about 3170 area to finish leg C down by the end of next week, which will also be the end of the wave 4 down.
Current Elliott Waves - From 2855.94, spx completed red wave 3 last week at 3338. From there, it started red wave 4 down, which I expect to be an ABC down. So far, spx is working on leg A down, and so far it did subwaves 1,2 and 3 (in progress or complete - Monday will tell the story). Leg A I expect to be finished by the end of the week.
It is interesting that my daily indicators (proprietary, not on chart) point to down, while the hourly ones keep pointing up. That's rare, and usually, when I get contradicting indicators means that the trend is down but the move is choppy (unlike the August one) with bursts of up moves in order for the hourly indicators to reset, which could frustrate traders because would take their stops out.
Bonds never recovered these 2 last days - thats a big tell of whats coming
If there was a way to figure out whether this is second wave up and then 3,4,5 to go, ppl would all be billionaires :)
My feeling is that the market correction just started, and I am playing it accordingly (I scalled into puts today, also i will buy more tomorrow if it goes up, and i also got some calls for protection).
So, spx went down and now up to test suport which became resistance. The down wave was wave 1 and now doing wave 2 up. When wave 2 is done i expect spx to do waves 3,4 and 5 of leg A down. In plain words, if my count is right, the drop we got yesterday is just the beginning.....
Current Elliott Waves - From 2855.94, it started red wave 3, and so far it finished black waves i, ii, iii, iv and v. This count might be invalidated if spx goes above 3338.
At this point, it finished red wave 3 and it should correct at least 100-150 points as red wave 4, probably in the shape of an ABC down. I won't be surprised to see spx going a little bit down and a little bit up to test support, and then it should head down if my count is correct.

yeah, it is running out of steam, so sooner or later will roll over and drop at least 100-150 points. As for tops, there will be many along the way with the last one mid 2021 before it rolls over in a big correction (similar with 2008).
Current Elliott Waves - From 2855.94, it started red wave 3, and so far it finished black waves i, ii, iii and iv, and now it is doing black wave v. In my opinion, spx finished already blue subwaves 1, 2, 3 and 4 and it is doing now blue subwave 5. Out of blue subwave 5, it finished orange subwaves 1, 2, 3 and 4 so far, in my opinion.
Last week, spx did orange subwave 5, and it was a week long because it was an extended one (who knew?). So far, it is equal to orange subwave 3, so it can head down anytime. And of course, if it wants, it can go even higher, without invalidating Elliott waves theory.
However, the important part is that when orange subwave 5 is done, it will also complete the red wave 3, and then it should correct at least 100-150 points as red wave 4, probably in the shape of an ABC down.

Power, where are you? spy feels toppy here, you need to make an entrance again before spy heads down early next week....
Current Elliott Waves - From 2855.94, it started red wave 3, and so far it finished black waves i, ii, iii and iv, and now it is doing black wave v. In my opinion, spx finished already blue subwaves 1, 2, 3 and 4 and it is doing now blue subwave 5. Out of blue subwave 5, it finished orange subwaves 1, 2, 3 and 4 so far, in my opinion.
So, probably by now you are confused with so many waves and subwaves, and you are wondering what it means and what's next. Well, look at the chart below - if my count is right, all spx has to do is one more small run up to finish orange subwave 5 (unless some ugly weekend news take it down directly), which will also complete the red wave 3, and then it should correct at least 100 points. I expect spx to finish orange subwave 5 in a day or so. From there, I expect a sizeable drop (at least 100 points on spx) as red wave 4, probably in the shape of an ABC down.

SPX is doing now subwave 3 of blue subwave 5; sometimes it cuts subwave 5 short, so it is in my opinion a good time to scale into some long term puts (31jan and beyond) in preparation for the >100points drop.
Spx can drop 150 points from here and recover all of them before February
This recovery is a gift for buying long term puts. Jan 31 puts look very appealing......
Monthly Elliott waves Chart showing my forecast for the next years - Updated to account for the latest evolution of spx, which suggests that the spx is rushing toward the top faster than before, which brings the top closer. I see a top in spring-summer of 2021 to finish the larger degree wave 1 which started in 2009, followed by a wave 2 down in the end of 2021-2022, and then a wave 3 up until at least 2042.
I expect wave 2 to go down to ma(200) on monthly, which probably will be around 1900-2000 by then.
You won't find this prediction anywhere on the net other than here. Enjoy!

Current Elliott Waves - From 2855.94, it started red wave 3, and so far it finished black waves i, ii, iii and iv, and now it is doing black wave v. In my opinion, spx finished already blue subwaves 1, 2, 3 and 4 and it is doing now subwave 5. When blue subwave 5 is done (one week or so), it will finish red wave 3, so I expect a sizeable drop (at least 100 points on spx), probably in the shape of an ABC down.

we are doing a subwave 5 now, which might last another week or so. Then, i expect it to drop either 100-150 points (high probability) or 230-280 points (low probability) on spx, depending on the degree of the subwave. This drop will probably take at least 1 week, and it will be an ABC down. Chart tomorrow as usual.
Power should wait a little bit. It might take another week or so until it drops big.
re "How high will this BULL go in 2021? The BEAR correction should come to 1800-2346 area." - probably anywhere between 3500 and 4000, closer to 4000 if i have to guess. And yes, i see the correction going down to the same levels 1800-2200.
Long term Elliott Waves count
https://investorshub.advfn.com/boards/read_msg.aspx?message_id=153018968
Current Elliott Waves - Not much to add for this week. From 2855.94, it started red wave 3, and so far it finished black waves i, ii, iii and iv, and now it is doing black wave v. I expect black wave v to be an extended one, which means it will probably last until mid-end of January. See post #353 for chart.
Monthly Elliott waves Chart showing my forecast for the next years. I see a top in 2021 (or the very beginning of 2022) to finish the larger degree wave 1 which started in 2009, followed by a wave 2 down in 2022-beginning of 2023, and then a wave 3 up until at least 2050. You won't find this prediction anywhere on the net.
Recently, my short term count has been close to that of OEW group. However, on longer term count, OEW group believes that wave 1 from 2009 ended in 2016 and we are in wave 3 up now. I believe that wave 1 will come to an end toward the end of 2021, and the drop in 2016 was just subwave 4. The major difference is that they see spx going up and up for the next 20-30 years while i see a big drop in 2022. Time will tell who is right.

Current Elliott Waves - From 2855.94, it started red wave 3, and so far it finished black waves i, ii, iii and iv, and now it is doing black wave v. I expect black wave v to be an extended one, which means it will probably last for another about 1 month or so (mid January-beginning of February). The black wave v will have 5 subwaves, and so far is doing the first subwave which could have been completed on Friday, so a small pullback before trending up again in subwave 3 won't surprise me.

Current Elliott Waves - Not much to add at this point. As mentioned in the previous post, from 2855.94, it started red wave 3, and so far it finished black waves i, ii, iii and iv, and now it is doing black wave v. I expect black wave v to be an extended one, which means it will probably last for about 1.5 months or so (mid January-beginning of February). The black wave v will have 5 subwaves, and so far is doing the first subwave.
Current Elliott Waves - This week, we got the drop I have been waiting for all along; it was a decent ~85 points drop which makes it black wave iv.
From 2855.94, it started red wave 3, and so far it finished black waves i, ii, iii and iv, and now it is doing black wave v. I expect black wave v to be an extended one, which means it will probably last for about 1.5 months or so (mid January-beginning of February). The black wave v will have 5 subwaves, and so far is doing the first subwave.
Bottom line, I do not expect a bigger correction than the one this week before mid January - beginning of February, which tells me that the Christmass rally is on (wich some small corrections along the way to account for subwaves ii and iv of course).

Is there any article showing the pipeline and estimated income from each product? Thanks
yeah, 3650-4000 is possible.
Current Elliott Waves - From 2855.94, it started red wave 3, and so far it finished black waves I and II, and the question is if black wave III is done. Its length would suggest that it is done but the drop in the week of Nov. 18 seems rather shallow. While many other ppl consider it black wave iv, I am going to take the risk and say that it seems more like a drop of a smaller degree than black waves, so I will consider than we are still doing black wave III for now.
So, if we get a drop next week, I expect it to be again a shallow one, and then Christmas run should start to finish black wave iii.

Current Elliott Waves - From 2855.94, it started red wave 3, and so far it finished black waves I and II, and the question is if black wave III is done. If it is done, I expect spx to go down a little bit more (maybe another 50 points or so) and then it will resume the trend up for Christmas rally. If black wave III is not done, it will go up a little bit more, and then i expect it to correct (black wave IV) before it starts the Christmas rally.
Bottom line, and that's the most important thing for today, I do not expect a deep correction like the August or October ones this time because this correction is of a smaller degree - so do not fall in love with the downside.

Current Elliott Waves - As I said last weekend, black subwave 2 was outstanding, and the market refused to correct. Which makes me believe that probably black subwave 2 was a shallow one. Therefore, I updated the chart with a potential black subwaves 1 and 2 - next week will show if this count is right, or black subwave 2 is still to happen.
To recap, from 2855.94, it started red wave 3, and so far it finished black waves I and II, and is doing black wave III now (so far it probably did black subwaves 1 and 2, and it started subwave 3).

Current Elliott Waves - Not much to add this weekend, as I said last weekend SPX seems to be on steroids lately because it doesn't want to correct in a subwave 2 as it should be. Black subwave 2 is outstanding (see previous post for chart) and I will give it another week to resolve before I start recounting the waves.
From 2855.94, it started red wave 3, and so far it finished black waves I and II, and is doing black wave III now (so far it did black subwave 1, and back subwave 2 to follow).
Is he ok? He hasnt posted for the last days

