 News
News  Market Data
  Discover
Support: 888-992-3836
Copyright © 2023 InvestorsHub Inc.


Myst
![]()
Register for free to join our community of investors and share your ideas. You will also get access to streaming quotes, interactive charts, trades, portfolio, live options flow and more tools.
Register for free to join our community of investors and share your ideas. You will also get access to streaming quotes, interactive charts, trades, portfolio, live options flow and more tools.
Hey MS! I tore apart the AIM formula countless times until I modified it for optimal performance. Then X_DEV was born. That was over 20 years or so ago. Since then I’ve simplified and revised X_DEV into its current form using a variant of the detrended price oscillator.
Are you well versed with spreadsheets?
Tell me about yourself.
Where is the script? Wealthscript? I remember someone trying to work in wealthscript with it back then.
Hi Slim! I don't understand your post. Do you mean created an account here on ihub? If so, that's cool! If not, where is the script located?
Hi Aimagic! Glad you are still here! Shoot me your gmail address again so I can send you the Fisher sheet. Thanks!
Hi AIMagic! You still alive out there? I've developed a simplified version of X_DEV that so far has bested X_DEV in ROI. I'm hoping you'd like to take a look at the spreadsheet and tell me your thoughts. It uses the Fisher Transform indicator to generate the buy and sell signals. I use a tuning mechanism and similar cash management to X_DEV.
Screen shot below:

Hi AIMagic! You still alive out there? I've developed a simplified version of X_DEV that so far has bested X_DEV in ROI. I'm hoping you'd like to take a look at the spreadsheet and tell me your thoughts.
Screen shot below:
MSTR just hit a buy signal on the Fisher system at $395
Anything is possible but this is still an otc pink sheet stock. Wise to keep expectations in check.
competition

close at $1.93... only .02 cents off...lol!
Private placement:

chart below:

Watch the last third of this video. This guy has 109,000 subscribers. He recs Hypercharge which is one possible reason for the volume price performance today. It's how I found it.
Bitcoin 12/7/2022

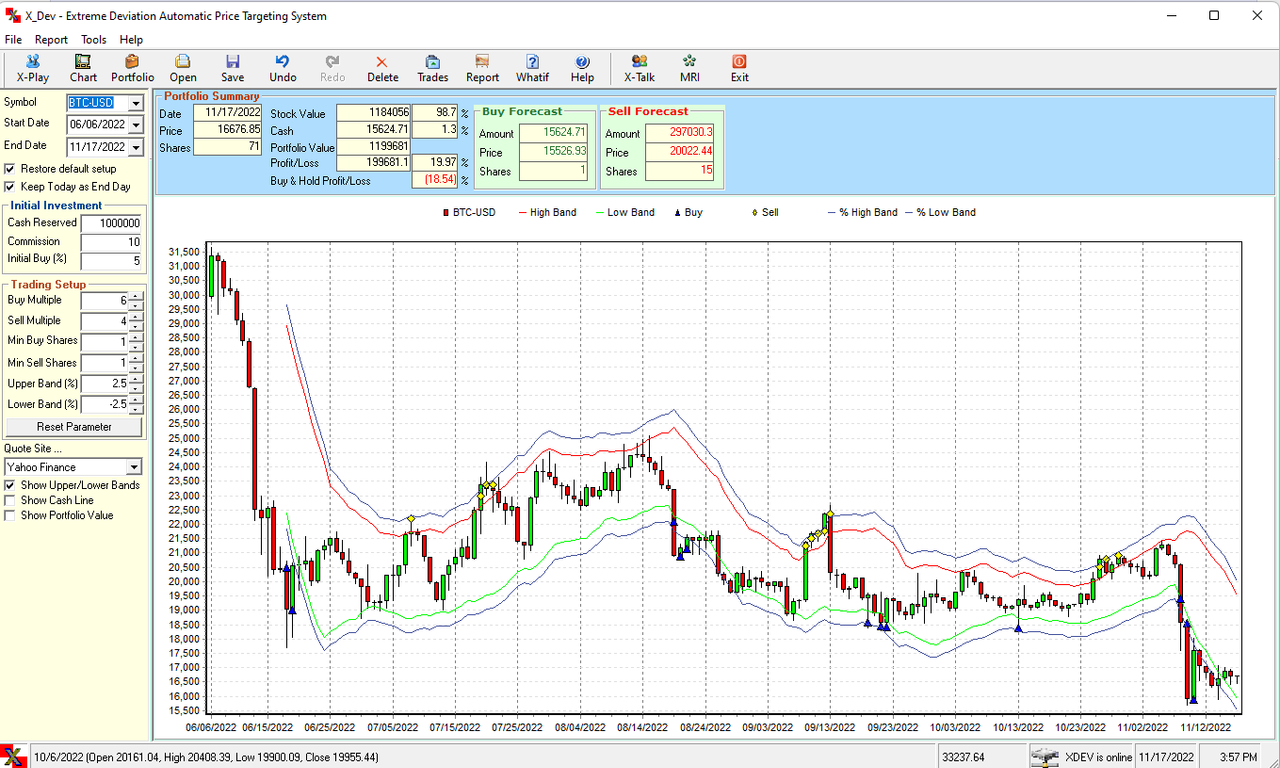
Bitcoin 11/17/2022
Updated BTC Chart...

Crystal ball is in the dishwasher. For now just follow the XDEV signals.
Ding, Ding, Ding.... Bitcoin had a partial sell yesterday! First one since September.

Make bank in a crab market

HI AIMagic!
I'm sorry for these long delays in responses! It's these summer months that keep me occupied with so many different things that I forget to check back in here.
But once again your eye is sharper than an eagles! Yes, I've modified the Williams%R to suit my purposes. My formula gives me a higher range than zero to -100 in the standard W%R formula. Since I like to use the histogram for visualization it's just easier for me to see the extremes in movement. The exact numbers for W%R in the standard method don't matter as much as the high and low bars on my histogram chart. I'm still getting the gist of price extremes and overbought/oversold conditions as measured by W%R, but in a way I can visualize easier. The 8 day sma just works best for this method. I'm sure I've experimented with other sma's in the past but it's been so long I can't give you a precise breakdown of those results.
Thanks again for the penetrating study of the spreadsheet and please keep the questions coming. Keeps me sharp. 

Never buy and hold. Buy low and sell high in partial amounts via the use of an optimized algorithm.
+61% gain compared to -56% loss
Simple math
Between now and the next inflation print I’m thinking a retest of the lows then sideways boring churn. I doubt big money will commit anytime soon until they see a decent reversal in inflation. Still a good time to dca into bitcoin, Ethereum and maybe Cardano for the long term at these levels.
+137% better than buy and hold
XDEV is outperforming a buy and hold strategy by +137%.
Bitcoin decreased in value -50% while the XDEV system of buying extreme lows and selling extreme tops in the Daily Time frame trend increased +87%.
Show me anything that performed better and more safely than this system..
Anyone?
Penloci,
I meant that the more you go down the rabbit hole and gain knowledge about Bitcoin the more you will understand its value, which will give you more confidence in investing in it. There is not one person I know of that has spent more than 100 hours studying bitcoin that has come away with a negative view. Most come to realize that with almost mathematical certainty it is the future of this planets monetary system. It is simply better technology and better technology always wins. There is always resistance and fear, uncertainty and doubt at first.....then people eventually come around. Think automobile, electricity, and the internet for examples. All had their detractors at first and all of those people look extremely foolish now.
If you are looking for knowledge, go to YouTube and view any of Michael Saylors interviews on Bitcoin,
Hi Aimagic!
Yes, it was intentional. I think of it as a kind of "smoothing factor". A bit of special sauce if you will...haha. The formula provides for a bit of delay in selling out too fast as in many situations the right choice would have been to hold a bit longer. It helps when human emotions are extreme and /or if cascading liquidations occur in the highly leveraged crypto space. There have been many instances where this formula has kept me in profitable long positions where otherwise I may have sold too early, so I kept it as is.
Aimagic,
How is using the LONG and SHORT size factor different then using the X_DEV factor for sizing trades? Is this not a redundancy?
Note the header window above. X_DEV has been nailing entries and exits. Profits continue to build!

This sounds promising...
I will have a look right after dinner.
Thanks again Alex!
Aimagic,
Once, again great job on the minimum buy/sell coding! I like the way you made it adjustable as well. The speadsheet is nearly identical in functionality to the X_DEV program, so I can't thank you enough!
Those are some great results on CELO!
The minimum $ amount is there to prevent very small $dollar amounts from being signaled. Doesn't make sense to trade $5 - $150 or whatever if your portfolio size is over say $20,000. But to each his own. Now that you have made it adjustable (like the program) the user can choose whatever suits his needs.
The minimum signal is something I brought over from the AIM algorithm. It is extremely useful for tuning the X_DEV algorithm to produce the best signals. I could probably describe the intricate math that causes this functionality but I doubt it's necessary. It would be like describing how the intricate electrical components of a TV function to produce the signal. I rather just turn the damn thing on and watch a movie...lol.
As far as choosing which assets are best for X_DEV. I just go with high quality high volatility plays. I need to have confidence the asset will not collapse into obscurity in a black swan event or a prolonged bear market.
Penloci,
Sheets have been sent. Check your gmail.
penloci....
Preparing the sheets now. Will send shortly. Sorry again for the delay!
Thanks for your patience!
Aimagic....thanks again for your efforts.
Let me look over your sheet and get to your questions.
Thanks for your patience! Life has been hectic these past few days.
penloci....sorry for the delay.
Which sheets would you like?
MSTR - X_DEV Update
Still crushing buy and hold...

Hi penloci,
I just need a valid email address...preferably gmail.com and I'll send you the spreadsheet.
Good eye as usual Alex.....yea, we need to change that so both have $150 as a minimum.
Thanks again for your continued interest and updates.
Much appreciated!
Alex, I have updated the following sheet:
XDEV - YINN - DAILY - 21 4 21 - PRESENT - V2 - RL
Note that while the ROI is still negative it is beating the B&H'r by over +48%
I found something interesting as well. Not sure if it's a formula error but wondering if you could check.
Input 2,000% into the SELL multiple and 30,000% into the BUY multiple and see what you come up with in the % gain cells. Then check the "Suggested shares" column. Error?
Yes...it is all corrected. Working great!
Generally speaking I've noticed in strong uptrends you want to buy more and sell less, and vice versa in downtrends....ie, buy less and sell more. Therefor the buy multiple settings on uptrends will generally be higher than the sell multiple, and vice versa for downtrends (sell multiple higher than buy multiple).
I've traded in all scenarios, so yes....I've achieved results similar to what the sheet is displaying.
I have a good feel for when an optimization is good enough....or is actually optimal. The data charts at the bottom of the sheet are very useful. Things to look for are a good clean uptrend in the "B&H vs. XDEV chart" and also a good turnover between stock and cash on the Portfolio chart. The ethereum examples below are good examples of this:


