 News
News  Market Data
  Discover
Support: 888-992-3836
Copyright © 2023 InvestorsHub Inc.


Register for free to join our community of investors and share your ideas. You will also get access to streaming quotes, interactive charts, trades, portfolio, live options flow and more tools.
Hey MS! I tore apart the AIM formula countless times until I modified it for optimal performance. Then X_DEV was born. That was over 20 years or so ago. Since then I’ve simplified and revised X_DEV into its current form using a variant of the detrended price oscillator.
Are you well versed with spreadsheets?
Tell me about yourself.
This is amazing. I just picked up AIM and was thinking it would work great on crypto. You did it. Thank you. Can I get a copy of your spreadsheet?
This is amazing. I just picked up AIM and was thinking it would work great on crypto. You did it. Thank you. Can I get a copy of your spreadsheet?
Good morning Myst
Could i get a copy of your Fisher Transform spreadsheet?
( I still have a copy of Xdev but that no longer works )
John Henderson
Where is the script? Wealthscript? I remember someone trying to work in wealthscript with it back then.
yes i just created an account here .
the picture shows a scirpt that been created on 2002 with the description stating
"This Script is a modification of XDev system being developed by Myst on Investors Hub."
i'm still using it today ><
Hi Slim! I don't understand your post. Do you mean created an account here on ihub? If so, that's cool! If not, where is the script located?
Hello Myst !
i created an account here just to thank you .
 " rel="nofollow" target="_blank" >insert-text-here
Hi Aimagic! Glad you are still here! Shoot me your gmail address again so I can send you the Fisher sheet. Thanks!
Hi Myst! Yes, still experimenting with XDEV! Your Fisher Transform version sounds interesting. If you send over the spreadsheet I'll take a look! I hope you are well. Best regards,
Hi AIMagic! You still alive out there? I've developed a simplified version of X_DEV that so far has bested X_DEV in ROI. I'm hoping you'd like to take a look at the spreadsheet and tell me your thoughts. It uses the Fisher Transform indicator to generate the buy and sell signals. I use a tuning mechanism and similar cash management to X_DEV.
Screen shot below:

Hi AIMagic! You still alive out there? I've developed a simplified version of X_DEV that so far has bested X_DEV in ROI. I'm hoping you'd like to take a look at the spreadsheet and tell me your thoughts.
Screen shot below:
Updated BTC Chart...

Ding, Ding, Ding.... Bitcoin had a partial sell yesterday! First one since September.

HI AIMagic!
I'm sorry for these long delays in responses! It's these summer months that keep me occupied with so many different things that I forget to check back in here.
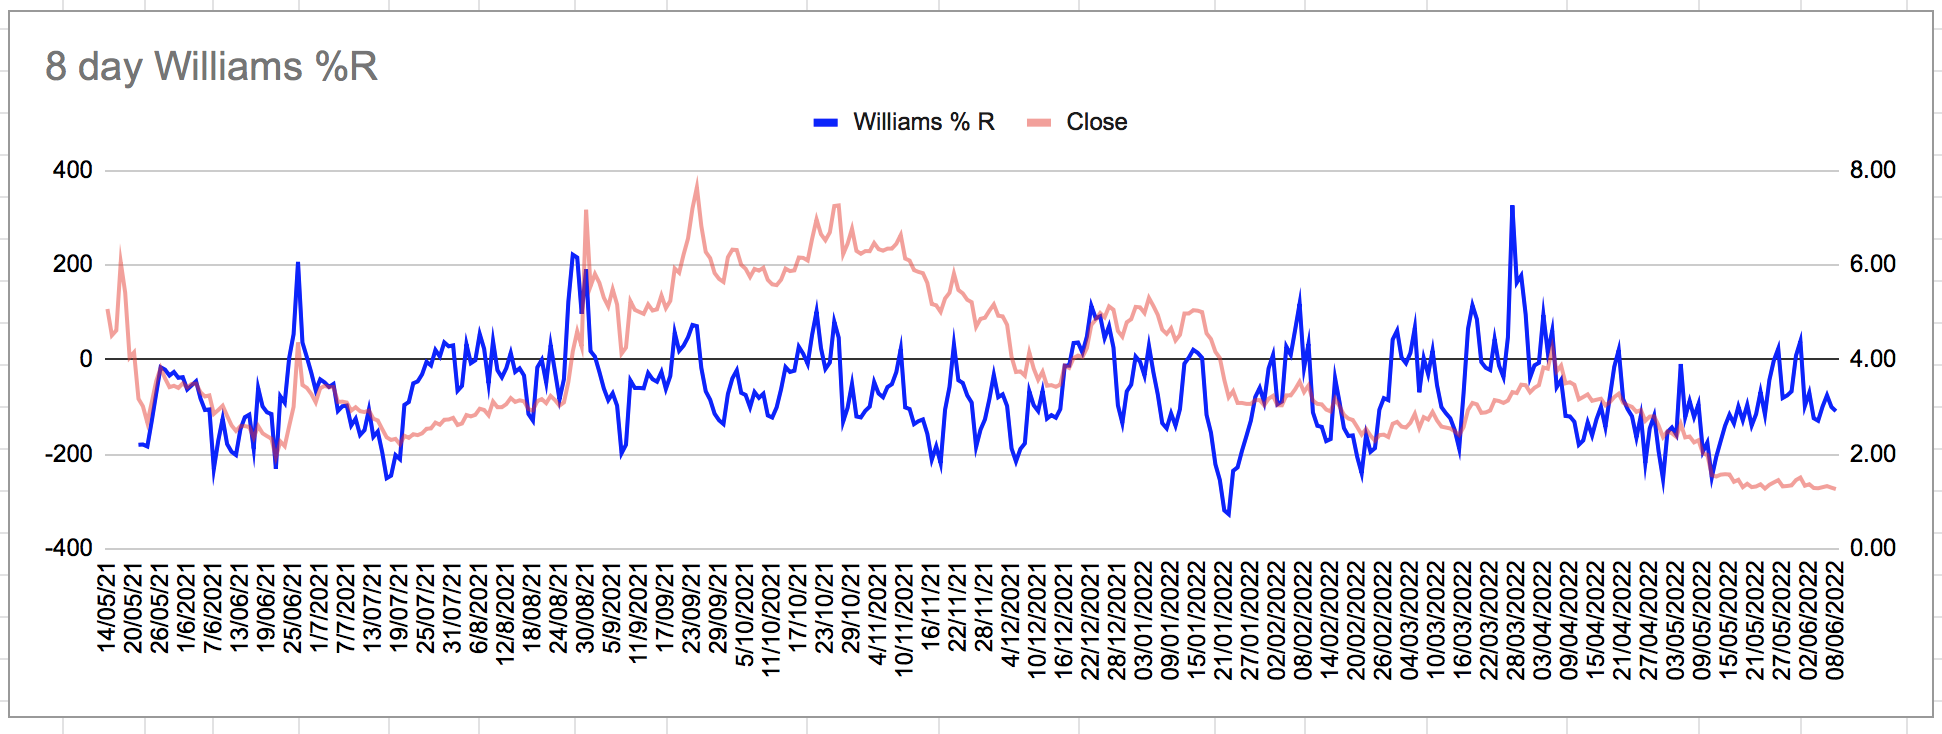
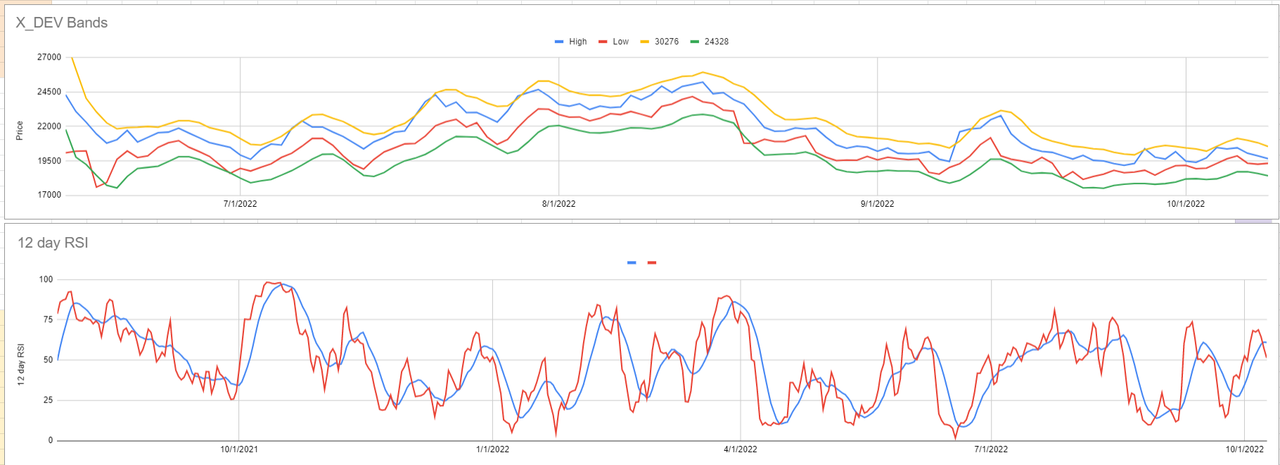
But once again your eye is sharper than an eagles! Yes, I've modified the Williams%R to suit my purposes. My formula gives me a higher range than zero to -100 in the standard W%R formula. Since I like to use the histogram for visualization it's just easier for me to see the extremes in movement. The exact numbers for W%R in the standard method don't matter as much as the high and low bars on my histogram chart. I'm still getting the gist of price extremes and overbought/oversold conditions as measured by W%R, but in a way I can visualize easier. The 8 day sma just works best for this method. I'm sure I've experimented with other sma's in the past but it's been so long I can't give you a precise breakdown of those results.
Thanks again for the penetrating study of the spreadsheet and please keep the questions coming. Keeps me sharp. 
Hi Myst,
I hope you're well. I will try to share my experiences trading XDEV in the coming weeks. In the interim, did you arrive at 8 days look back period for the Williams %R for a reason?
Additionally, I noticed, when calculating Williams %, you are using the 8 day SMA of the HIGH and LOW and not the MAX and MIN of the HIGH the LOW.
You use AVERAGE(BD2:BD9)
Others use MAX(BD2:BD9) and MIN(BE2:BE9)
Did you find using the 8 day SMA rather than the MAX or MIN better? Did you choose to use the 8 SMA of the HIGH and the LOW instead of the MAX and MIN for a reason?
I think your way of calculating Williams %R contains more information by distinguishing between overbought and oversold and REALLY overbought and oversold periods.
Calculation using AVERAGE:
Calculation using "MIN" and "MAX":

All the best,
Alex
Between now and the next inflation print I’m thinking a retest of the lows then sideways boring churn. I doubt big money will commit anytime soon until they see a decent reversal in inflation. Still a good time to dca into bitcoin, Ethereum and maybe Cardano for the long term at these levels.
What do you see now?
A pump to 31k or a wick down to 28k?
I'm waiting on futures open for an indication
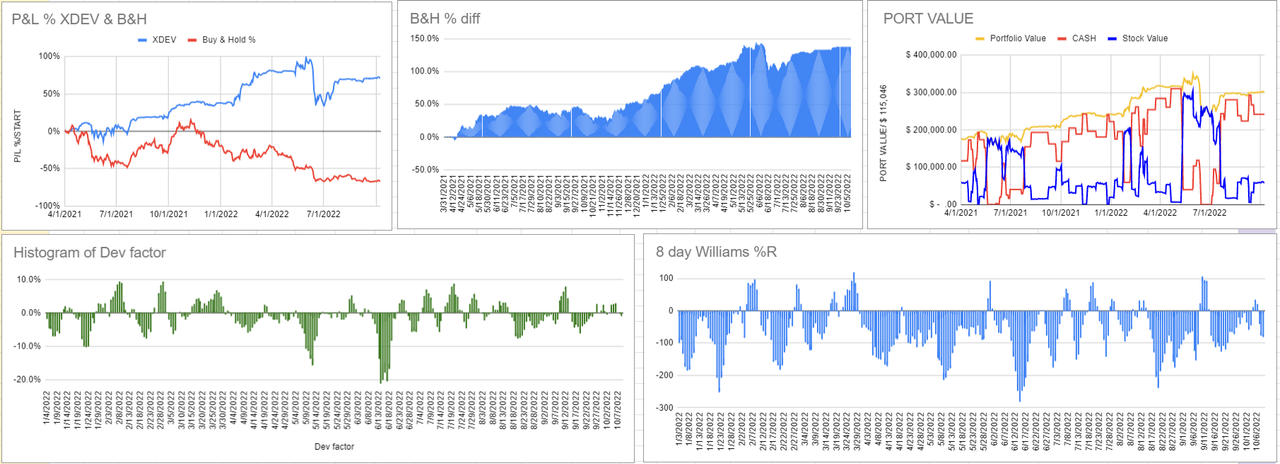
+137% better than buy and hold
XDEV is outperforming a buy and hold strategy by +137%.
Bitcoin decreased in value -50% while the XDEV system of buying extreme lows and selling extreme tops in the Daily Time frame trend increased +87%.
Show me anything that performed better and more safely than this system..
Anyone?
Penloci,
I meant that the more you go down the rabbit hole and gain knowledge about Bitcoin the more you will understand its value, which will give you more confidence in investing in it. There is not one person I know of that has spent more than 100 hours studying bitcoin that has come away with a negative view. Most come to realize that with almost mathematical certainty it is the future of this planets monetary system. It is simply better technology and better technology always wins. There is always resistance and fear, uncertainty and doubt at first.....then people eventually come around. Think automobile, electricity, and the internet for examples. All had their detractors at first and all of those people look extremely foolish now.
If you are looking for knowledge, go to YouTube and view any of Michael Saylors interviews on Bitcoin,
Hi Aimagic!
Yes, it was intentional. I think of it as a kind of "smoothing factor". A bit of special sauce if you will...haha. The formula provides for a bit of delay in selling out too fast as in many situations the right choice would have been to hold a bit longer. It helps when human emotions are extreme and /or if cascading liquidations occur in the highly leveraged crypto space. There have been many instances where this formula has kept me in profitable long positions where otherwise I may have sold too early, so I kept it as is.
Hi Myst,
I am wondering whether the formula in the Actual Shares Bot column is correct. See below:

I understand the logic of the formula to mean that if the (Absolute) suggested shares sold is greater than the actual shares held (in column X309), then the formula returns the value “0”.
Should it not be the case that if the (absolute) indicated shares bot / sold is greater than the actual shares held the amount to be sold should be (- / minus) * X309 not “0”?
Interestingly, as it currently stands, the formula, has had the effect of keeping us LONG an asset a little longer because every time the suggested shares sold is greater than the amount of actual shares held nothing happens (the formula returns “0”) and we stay LONG for longer than we otherwise would. So, if the asset rises, we continue to benefit. Then, after keeping us LONG, if the price increases sufficiently, when the value of the shares held is once again greater than the value of the suggested shares sold, the formula once again returns the suggested shares sold (AD309). Was this intentional?
Regards,
Alex
Hello, Myst
I've been reading the Investorshub X_DEV board to better understand the XDEV spreadsheet. AIMagic and you have done a very interesting work.
I'm writing you because of two of your posts in the A.I.M. Users Bulletin Board (AIMUSERS):
post #45576 (https://investorshub.advfn.com/boards/replies.aspx?msg=166487775) and
post#45581 (https://investorshub.advfn.com/boards/replies.aspx?msg=166489444)
Both posts caught my eye...
Regarding the first one (post #45576) could you pass me the link for the video "FACTS: CRYPTO ADOPTION", it's seems the link it's broken or the video has been deleted (I hope this's not the case). And regarding the second one (post #45580) you wrote to Jaiml:
<<If you understand what you are investing in conviction becomes easier.>>
What do you mean with "If you understand what you are investing..."? What do you mean with "understand"? It seems that you have investigated a lot about cryptos/Blockchain and you are very informed, do you recommend any specific blog/book/ "so-called" "guru"?
Kind regards
Aimagic,
How is using the LONG and SHORT size factor different then using the X_DEV factor for sizing trades? Is this not a redundancy?
Note the header window above. X_DEV has been nailing entries and exits. Profits continue to build!

Hi Myst,
I have shared another Nat Gas play (V.3), which incorporates the improvements from the CELO play. Ignore V.1 and V.2.
Kind regards,
Alex
Hi Myst,
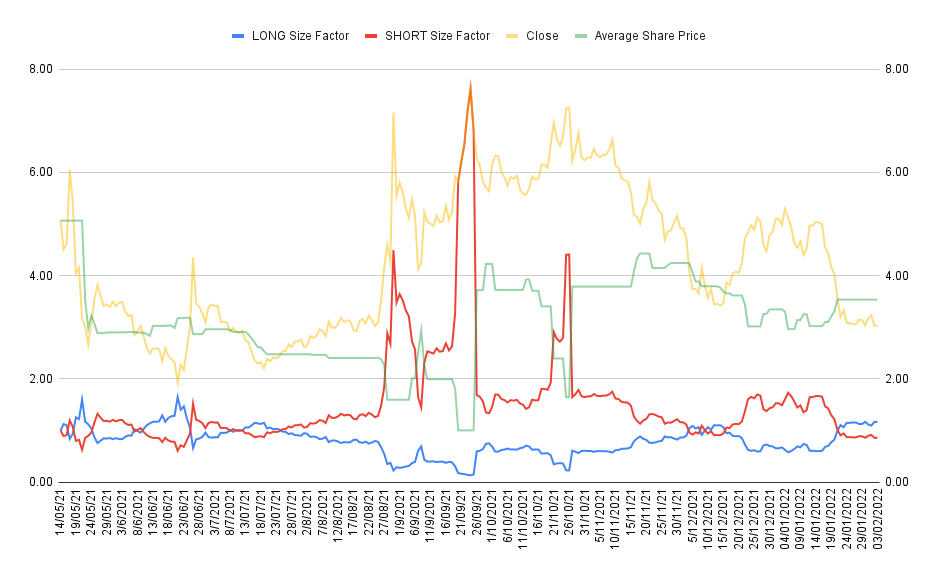
Here is a chart of the LONG and SHORT Size Factors and XDEV's Average Share Price and CELO Close.
Peaks in either the LONG or SHORT Size Factor nicely correlate with local Highs and Lows.
Hi Myst,
I’ve shared a CELO sheet with the same updates as I sent you yesterday. The CELO spreadsheet highlighted occasions where the price rise was so extreme, our average share price effectively became zero. I had to tweak the Average Share Price formula due to the extreme volatility of the play. The zero average share price lead to a divide by zero error in the LONG Size Factor and SHORT Size Factor columns. So, for the time being, to deal with this, on occasions where price rises so much that the shares held by XDEV are effectively free, I have chosen to use the last average price per share on occasions when the average share price effectively becomes zero, from the row above. It isn’t perfect. But, it may be good enough. Certainly, it means we no longer get the divide by zero error in the Short Size Factor column. Instead of an “infinitely high” zero value we now get a very high number. A high value, along with a SELL signal, can then be interpreted as a good occasion to go SHORT.
We can decide how to use the LONG and SHORT Size Factor. One way, as I said to you, yesterday, might be to only refer to the Factor on starting a new play and scale our initial position size accordingly.
Another way might be to scale each individual BUY or SELL Market Order by the Size Factor. For example, one way might be to scale into an asset by multiplying the indicated BUY Market Order by the LONG Size Factor when scaling back into an asset after going 100% into cash. In theory, these first BUYS after going 100% to cash are made at a moment when an asset is expensive and so caution is warranted. The probability, at these moments, is that an asset will fall more. And so scaling in conservatively may be wise.
We could try to establish a threshold LONG or SHORT Size Factor value that indicates a particularly high probability or high return trade. Then, choose to take the Market Order BUY or SELL or multiply the Market Order by the Size Factor when the Size Factor value is particular high, sort of like using leverage at moments when price is a long way above or below the share price held on XDEV’s books. For example, look through the SHORT Size Factor values and see what you think would have happened had you gone SHORT on occasions when the SHORT Factor value is particularly high. Either using a trade sized by the Market Order indicated or, perhaps, multiplying the Market Order by the SHORT Size Factor. Then, perhaps, simply, covering the short, either fully or partially, in line with the Market Order given by the next BUY signal.
Best regards,
Alex
This sounds promising...
I will have a look right after dinner.
Thanks again Alex!
Hi Myst,
Further to my earlier message, I have re-sent the same spreadsheet but with corrected charts, which had all come out of synch in the version sent to you earlier today.
In this version (V.2), the Size Factor column AG has now been named "LONG Size Factor". I added a "SHORT Size Factor". I will raise this with you in another message later.
Best regards,
Alex
Hi Myst,
I have shared an XDEV sheet with you. First, I added a column “AF” which I titled “Average Share Price” which shows the cumulative average share price held at the time, taking into account BUYS and SELLS. So, in cell AF2 you see that the Average Share Price = 5.62, this equates to the closing price in E2 at the start of the play. After a BUY signal on 19 10 21, in cell CF14, we have lowered the Average Share Price to 5.4. Again, 26 10 21, after the price has risen and a SELL signal is given, in cell AF19, the Average Share Price = 4.59. And so on…
Knowing the cumulative Average Share Price may be useful for a number of reasons. However, I would like to focus one today. It may be useful in estimating when to start a play. If you see that the average share price of the shares held by XDEV is significantly lower than the share price on the day you want to start a play, you might be better of waiting, for the two to come more in line.
More interestingly, perhaps, is a column I added AG, named “Size Factor”. This column simply divides the cumulative average share price held on XDEV’s books by the, then, current CLOSE price.
When starting a play, this would mean you would simply multiply the given STOCK % in column U by the Size Factor thereby scaling down or up your initial exposure depending on how cheap or expensive the then current CLOSE price is relative to the stock held on XDEV’s books.
Rather like the zone % you had shared with me previously, this could allow us to under-weight or over-weight our exposure by this factor at the time of starting a play.
Best regards,
Alex
Good day, Myst
Checked. Thank you so much for sending me the spreadsheets.
This is a great week since I'm receiving a copy of Mr. Lichello Syncrovest book too. I feel I've got a lot to study from the best (including @AIMAGIC, @lostcowboy and @OldAIMGuy).
Your IHub Board and your spreadsheets shall be a great help for understanding/improving Mr. Lichello system.
Best regards.
Aimagic,
Once, again great job on the minimum buy/sell coding! I like the way you made it adjustable as well. The speadsheet is nearly identical in functionality to the X_DEV program, so I can't thank you enough!
Those are some great results on CELO!
The minimum $ amount is there to prevent very small $dollar amounts from being signaled. Doesn't make sense to trade $5 - $150 or whatever if your portfolio size is over say $20,000. But to each his own. Now that you have made it adjustable (like the program) the user can choose whatever suits his needs.
The minimum signal is something I brought over from the AIM algorithm. It is extremely useful for tuning the X_DEV algorithm to produce the best signals. I could probably describe the intricate math that causes this functionality but I doubt it's necessary. It would be like describing how the intricate electrical components of a TV function to produce the signal. I rather just turn the damn thing on and watch a movie...lol.
As far as choosing which assets are best for X_DEV. I just go with high quality high volatility plays. I need to have confidence the asset will not collapse into obscurity in a black swan event or a prolonged bear market.
Penloci,
Sheets have been sent. Check your gmail.
penloci....
Preparing the sheets now. Will send shortly. Sorry again for the delay!
Thanks for your patience!
Hi, Myst
I hope you're doing well!!!
Don't worry, I'm sure you've been busy.
Could it be possible you could kindly send me the X_DEV-BTC and AIM (BTB)-BTC?
Thank you so much in advance.
Myst,
Don't worry at all. Good to hear from you.
Best regards,
Alex
Aimagic....thanks again for your efforts.
Let me look over your sheet and get to your questions.
Thanks for your patience! Life has been hectic these past few days.
penloci....sorry for the delay.
Which sheets would you like?
Hi Myst,
I have shared a spreadsheet in which the minimum $150 size rule is applied to both BUYS and SELLS. I have made the minimum $ amount “optimisable” in cell P3 so it can be set to $0 or anything else a user wants. Now, the BUY Forecast and SELL Forecast columns show 0 if the amount recommended is less than the $ amount shown in cell P3. The SELL Market Order and BUY Market Order columns will continue to show the recommended trade no mater what the size. The MARKET ORDER column will show 0 when the recommended SELL or BUY is less than the minimum % amount in cell P3.
Can you help me understand one more time why you incorporated this “hardcoded” minimum $ amount in the spreadsheet in addition to the Minimum Signal %?
I have included two further additions to the sheet. Since I am experimenting with trying to enumerate what matters most in choosing assets for trading with XDEV, in cells S4 to T8, I added some measures derived from the XDEV Factor and, in cells O5 to Q7, a way of counting the number of “crossovers” between STOCK and CASH that have occurred over the backtest period in order to turn this into a rough estimation of the no. of crossovers per year so that the number of “crossovers” can be compared between assets.
From my initial comparisons, the MIN / MAX / RANGE / STDEV information derived from the XDEV Factor alone, while interesting, are not so helpful in establishing which assets to choose. Poorly performing assets and better performing assets cannot be distinguished by looking at these measures alone. The main parameter which has the greatest effect on the suitability of an asset for trading with XDEV is the number of crossovers the asset triggers. Interestingly, it looks like starting CASH % seems to have the biggest impact on the number of crossovers over the backtest.
Best regards,
Alex
Hi Myst
Thank so much for your response.
Here's the email address: penloci@gmail.com
Best regards!!!
Hi penloci,
I just need a valid email address...preferably gmail.com and I'll send you the spreadsheet.
Good eye as usual Alex.....yea, we need to change that so both have $150 as a minimum.
Thanks again for your continued interest and updates.
Much appreciated!
Good day, Myst:
I hope you're doing well!!!
My name's Pedro (AIM follower from Spain). I'm just writting to ask you where I can get some information to get the X_DEV spreadsheets, if available.
Thanks in advance.
Hi Myst,
I hope you are feeling better.
I have noticed that while the minimum $150 size “rule” is being applied to SELL trades, it is currently not being applied to BUY trades. Do you want the rule only to apply to SELLs or is it something we want to change?
Best regards,
Alex
Hi Myst,
How are you feeling? I hope a lot better.
I have sent you an XDEV sheet in which I updated the SELL Forecast column to include your $150 minimum limit on the number of dollars that can be sold to initiate a sell signal. So that the SELL Forecast column will show “0” if the signal calls for less then $150 dollars to be sold.
Best regards,
Alex
Hi Myst,
The mistake happens because cell AA4 in the Suggested Shared Bot/Sold formula rightly refers to cell H4 but as a result wrongly references the High % Dev Band multiple 5.53% in cell H4 in the yellow box.
Try manually entering "0" into Cell AA4. Do you agree that the problem is then resolved?
We might have to make that a hard coded "0" in all future sheets.
Best regards,
Alex
Hi Myst,
I have shared an updated version of the XDEV “1-day lag” sheet with you in which I have made one small change to formula in the BUY Forecast column. I altered the formula to show “0” when the forecast trade is smaller than the minimum signal % shown in cell AB2.
All the best,
Alex
Compounding gains by buying low and selling high in partial amounts is the best way to achieve exceptional returns over time and can lead to financial freedom/independence.
Below is the X_DEV program. It is an algorithmic trading system (similar to A.I.M.) that automatically finds the best buy and sell targets of any stock, index, mutual fund, or cryptocurrency and also recommends the amount of money to buy or sell based on your initial investment, usually in partial amounts. It will also list (in advance) the next best buy or sell opportunity based on the parameters the user sets up. This is not a "blackbox", set it and forget it system. It is meant to be an interactive, adaptible system utilizing sound mathematical principles and the users trading/investing experience. It is my belief that this type of symbiotic relationship is the best possible method for achieving much better returns than is otherwise possible.
The X_DEV Program - (Bitcoin below)
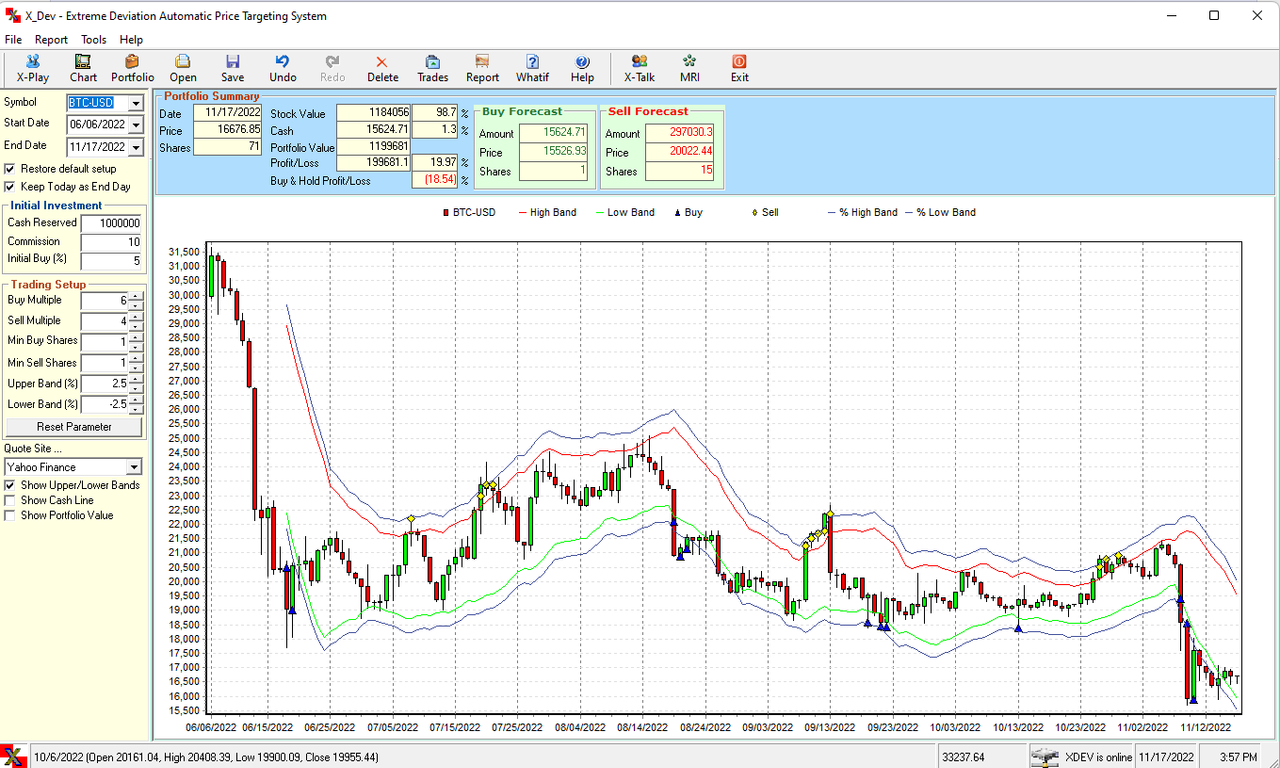
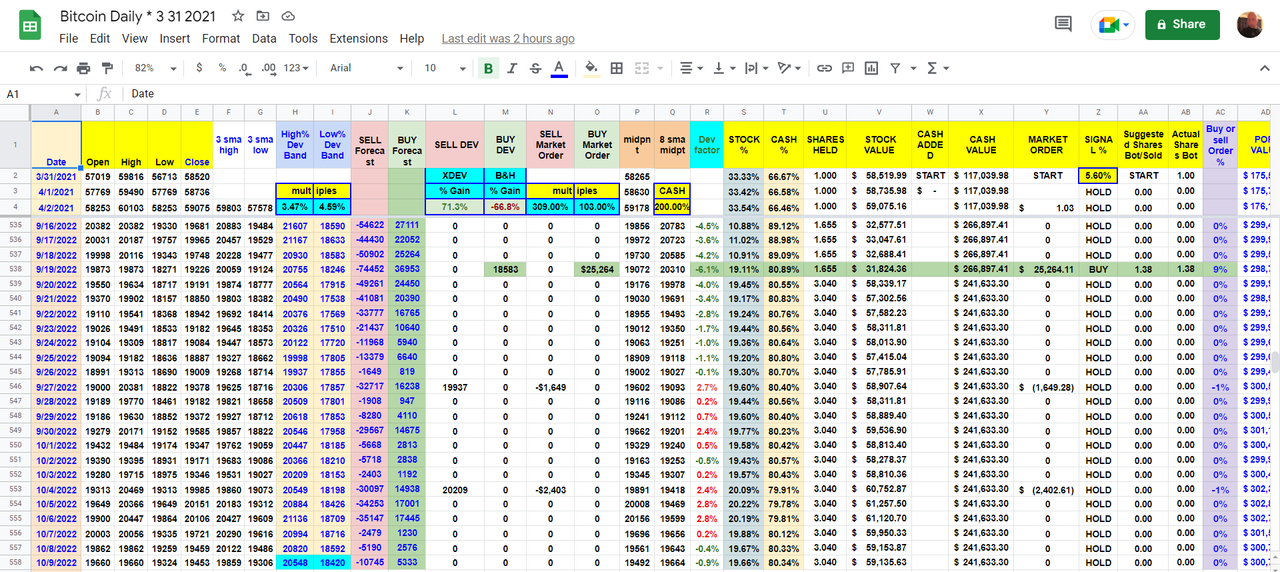
Below is my spreadsheet for trading Bitcoin. The algorithm used for it's construction was created back in 2002 which is when this board was created. Inspiration for the algorithm arose from reading Robert Lichello's book on A.I.M. From this spreadsheet a windows based program which I called X_DEV (above) was developed with the help of a genius programmer friend. Unfortunately my programmer friend became unavailable to support X_DEV development so the program faded into obscurity. Just recently (8/2021) my programmer friend resurrected a copy for me. The program is no longer for sale, though who knows what the future holds if programmer friend finds the time and interest again. I never lost interest in X_DEV as I believe it is an invaluable tool for trading/investing. I hope all who visit this board will develop an interest in X_DEV and are willing to discuss it's features or flaws (if any), in a polite, positive friendly way. Any other topics related to trading/investing are welcome as well. If you have a stock or a crypto that you would like run through the X_DEV program just ask on the board below. Cheers!
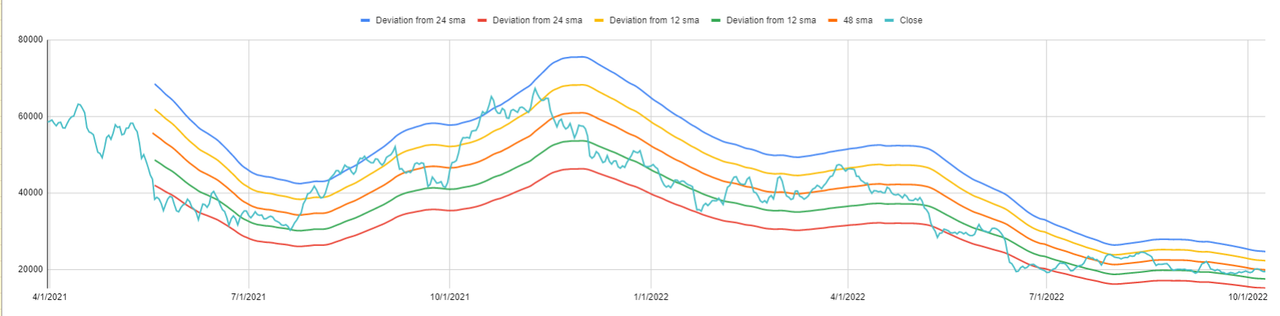
X_DEV Bitcoin - Note the High % DEV Band and Low % Dev Band for targets.
X_DEV Bands
For anyone that wants to post images in your messages I highly recommend using https://postimages.org/. It's free and extremely easy and fast.
Important posts:
X_Dev vs. AIM : Post 4097 https://investorshub.advfn.com/boards/read_msg.aspx?message_id=652928
Quick guide to optimization : Post 4318 https://investorshub.advfn.com/boards/read_msg.aspx?message_id=663945
X_DEV User Manual - https://web.archive.org/web/20070101012309/stockwerld.com:80/xdevusersmanual.pdf
X_DEV 3 day Rule : Post 4349 https://investorshub.advfn.com/boards/read_msg.aspx?message_id=668865
| Volume | |
| Day Range: | |
| Bid Price | |
| Ask Price | |
| Last Trade Time: |


