News
News  Market Data
  Discover
Support: 888-992-3836
Copyright © 2023 InvestorsHub Inc.


status is none of yer' damn business!! :-)
eye_ater
![]()
status is none of yer' damn business!! :-)
Register for free to join our community of investors and share your ideas. You will also get access to streaming quotes, interactive charts, trades, portfolio, live options flow and more tools.
Register for free to join our community of investors and share your ideas. You will also get access to streaming quotes, interactive charts, trades, portfolio, live options flow and more tools.
status is none of yer' damn business!! :-)
There sure is. Gonna do some more research this wekend on this Eagle Nest mine. See if I can find more info on it.
Indeed.
GOLD friend.
URHN - Keep an eye this one.
Uranium Hunter Enters into Joint Venture on the Eagle Nest Mining Property
On Tuesday May 5, 2009, 2:18 pm EDT
Buzz up! Print TORONTO--(BUSINESS WIRE)--Uranium Hunter Corporation (OTCBB: URHN - News) announced today that it has entered into a Joint Venture Agreement to acquire 49% interest of the Eagle Nest Mining Property Claims (“Eagle Nest”) located in La Paz County, Arizona from Sparrowtech Resources, Inc.
Mr. Reno Calabrigo, President stated “This joint venture agreement represents a diversification to include the precious metal industry and will provide the Company with increased growth opportunity within the current economy.”
The Eagle Nest Mining Property
Eagle Nest includes a previously producing Au-Cu-Ag-Fe (Gold, Copper, Silver and Iron) mine located 10 miles off Highway 95 in La Paz County, Arizona. Easy access to the mine site and a good water supply will facilitate ease of construction for a potential processing plant as well as expansion of the mine site.
Mineralization previously documented on Eagle Nest is very fine-grained to visible flaky gold, with oxidized copper ores and staining, in a linear, lenticular ore body with a steeply dipping fault zone cutting metamorphic Mesozoic, red, hematitic shale. Lenticular ore body formed from oxidation and enrichment was also found in the fault zone.
Previous workings include a 400 feet (121.92 meter) deep shaft and about 170 feet of drifts on the 100 level with some near-surface stopes. The previous mining operation on this property recorded historic productions of 1,050 tons of ore averaging about 1.07 ounces per ton gold, 1.8% copper and 2.1 ounces per ton silver.
Uranium Hunter will be updating its corporate website www.uraniumhuntercorp.com and release further details on the property including assay and concentration testing results in the near future.
Nice share structure to boot.
Shares Outstanding: 64,320,000
Restricted: 30,000,000
Free Trading: 34,320,000
Management Holds 46% of Outstanding Shares
This is pretty interesting. It appears that Sparrowtech Resources, Inc just acquired this property in May and needed a partner to help with expenses. This could turn out to be a fruitful joint venture here.
What's going on with this one? Noticed some action this bad boy and thought I would check it out.
Morning folks. Patience will pay off here.
Exactly.
PCAI DD
General Company overview
CEO David Cohen personally Owns over 23% of outstanding shares.
AS 500 million
OS : 35,580,340
Float : 3.5 million
Generate over $90 million is sales revenues with net profitability at a minimum of 3 percent.
Attain store revenues between $2.0 to $3.5 million per store annually
Ramp up to pumping a minimum of three million gallons of gasoline per month
Implement cost effective, centralized real-time remote sales and financial management reporting and security systems and accountability.
After a store is acquired and re-engineered to the specification of the parent, a landlord-leasing distribution program will be implemented
Ramp up acquisitions with one (1) new store monthly, ten (10) annually, totaling twenty (20) over the period a two-year period and thirty (30) within three years.
Company Pursues $400 Billion Industry
The Company began generating revenue in the $400 Billion Industry in 2006 through acquisitions during the second quater of 2007 and ended that year with revenue of $4.26 million!
Potential acquisitions candidates must have the potential to pump 1,200,000 gallons of gasoline annually with in-store item sales potential to exceed of $420,000 annually!
Focus on identifying unique high growth geo graphical areas with C-store locations that will achieve fast operational breakeven costs/revenues and with a much higher than average return on investment.
PCAI's centralized operation, purchasing and distribution strategies reduces overhead, increases quality control & improves profitability
Announced that it is focused on reaching its objective to acquire 50-60 stations over the next three years starting in 2009. Unlike other industries, the distressed economy has increased the number of targeted revenue-producing locations which, in turn, leads to an opportunistic market.
Anticipated Sales Streams
Sales Steam #1 - Retailer of Gasoline Stations
As a retailer to consumers in the gasoline / C-store channel and as a Jobber to its gasoline / C-store operators, distributing gasoline to its network of company owned stores and operator-leased facilities.
PCAI has target market demographics focused from South Florida north through Jacksonville that target mom and pop C-stores, distress sales or previously operated locations. Sound financial leverage will be used acquire sites. Market research indicates that motorists are primarily concerned with the big four: (1) quality, (2) convenience, (3) safety, and (4) cleanliness.
PCAI Retail Concept Model Includes:
Are located along busy roads, in densly populated suburban neighborhoods
Re-branding program using major branded gasoline
Transitioning the store from a "stop" to a "destination" to increase in-store sales
Multi-cultural pre-packaged product offerings based on the surrounding cultural demographics of the community
Re-branding and re-merchandising to provide an image in which the C-store evolves into a motorist destination, rather that just a one time or occasional stop for drivers and neighborhood pedestrians alike.
Sales Stream #2 - Wholesaler of Gasoline
As a general rule, Jobber-operated stations use gasoline supplied by a major oil company, which is delivered to the gasoline terminal at rack pricing. The jobber has the responsiblity of delivering the gasoline to the retail stations and independently sets the wholesale cost over rack pricing paid by the operator.
PCAI's wholesale jobber contracts for branded and/or unbranded gasoline sold through its distribution network will add net income of $0.04 per gallon (comprised of $0.02 over rack pricing plus $0.02 volume rebate from varied oil companies). Example: 6 million gallons annually would add another $240,000.00 profi directly to the bottom line.
Began generating revenue through acquisitions during the second quarter of 2007 and ended that year with revenue of $4.26 million.
Gas Staion Industry Info
On April 28, 2008 the Energy Information Agency released offical energy statistics from the federal government. In 2007, domestic crude oil output averaged 5.1 million bbl/d, unchanged from 2006 (U.S. Crude Oil Production), and is projected to decline only slightly in 2008. In 2009, however, production is projected to grow by 3.9 percent, or about 200,000 bbl/d (barrels per day), mainly because of the start-up of the Thunder Horse and Tahiti platforms in the Gulf of Mexico.
Total petroleum consumption of liquid gasoline and other petroleum products averaged 20.7 million bbl/d in 2007, essentially unchanged from 2006 (U.S. Petroleum Products Consumption Growth). Based on the projections of weak economic growth and record high crude oil and product prices, consumption of liquid gasoline and other petroleum products is projected to decline by 90,000 bbl/d in 2008 - a sharp reversal from the 40,000 bbl/d increase projected in the previous outlook - then increase by 200,000 bbl/d in 2009. After accounting for projected increases in domestic ethanol production, U.S. petroleum consumption is projected to fall by 210,000 bbl/d this year. Gasoline consumption is projected to shrink by 0.2 percent in 2008 before rising by 1.5 percent in 2009.
There were 164,292 total retail-gasoline sites in the United States in 2007. This is a steep and steady decline since 1994, when the station count topped 202,800 sites. (Source: National Petroleum New's Market Facts 2007)., As of December 31,2006 there were 115,157
C-stores selling motor gasoline in the United States. This represents 79 percent of the 146,294 current C-stores in operation across the United States.
Merger with INdiana Coal Company Info
"Based on our initial discussions, current analysis and the geological report, dated April 28, 2009, which was written by an independent third party, we have ascertained that this merger candidate controls significant assets in the form of a mining reserve, that is conservatively valued in excess of $100,000,000 (one hundred million dollars) based on current market prices.
The private resource company with proven reserves of approximately 5,000,000 tons of low sulfur high BTU coal and approximately 15,500,000 tons of inferred coal deposits is located in the Illinois coal basin. The shallow coal seams are located approximately 150 feet below the surface and will be accessed with proven room and pillar mining techniques. The permitting process is in the last stages and is expected to be approved in the fall of 2009. Additional drilling programs are presently in progress to change the status of inferred reserves to proven reserves.
Misc Coal Mining info
The Quarterly Coal Report (QCR) provides detailed quarterly data on U.S. coal production, distribution, exports, imports, receipts, prices, consumption, stocks, synfuel, and quality. Data on US. coke production, distribution, exports, imports, and consumption are also provided. This edition contains revised data for the previous quarters.
Highlights for the 4th Quarter of 2008:
Production grew slightly to 299.4 million short tons, a new record for a single quarter.
Consumption decreased by 9.7 percent to 270.4 million short tons.
Exports increased by 9.7 percent to 22.3 million short tons and accounted for 7.5 percent of total coal production.
Imports rose by 7.3 percent to 9.1 million short tons, the third highest level in the U.S. history.
Stocks increased by 12.0 percent to 171.9 million short tons, the highest fourth quarter level since 1987
http://www.eia.doe.gov/cneaf/coal/quarterly/qcr_sum.html
US Production
U.S. coal production grew in 2008 by 2.2 percent to reach a record level of 1,171.5 million short tons (Figure 1 and (Table 1), 24.8 million short tons more than the 2007 production total. Although total U.S. coal production was higher in 2008, only two of the three coal-producing regions had increases in coal production while the other was about level. Exclusive of refuse production, the Appalachian and Western Regions had an increase in their production levels in 2008 of 3.2 percent and 2.0 percent respectively, while the Interior Region remained essentially unchanged (Figure 2 and (Table 2). In the amount of tons of coal produced, the increase in the Appalachian Region production was 12.0 million short tons, while the increase in the Western Region production in 2008 was 12.6 million short tons. Coal production in the Interior Region increased by only 57 thousand short tons.
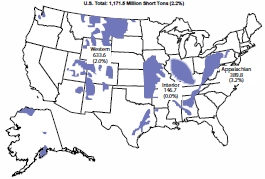
Figure 1. Coal Production by
Coal-Producing Region, 2008
Regional Totals do not include refuse recovery Figure 2. Coal Production by Region, 1999-2008
(Million Short Tons)
Regional Totals do not include refuse recovery
Table 2. U.S. Coal Production by Coal-Producing Region and State, 2004 - 2008
(Million Short Tons)
Coal-Producing Region and State 2004 2005 2006 2007 2008 Percent Change
2007 - 2008
Appalachia Total 389.9 396.7 391.2 377.8 389.8 3.2
Alabama 22.3 21.3 18.8 19.3 20.6 6.6
Kentucky, Eastern 90.9 93.3 93.6 87.1 89.9 3.2
Maryland 5.2 5.2 5.1 2.3 2.8 22.0
Ohio 23.2 24.7 22.7 22.6 26.3 16.3
Pennsylvania Total 66.0 67.5 66.0 65.0 65.3 0.4
Anthracite 1.7 1.6 1.5 1.6 1.7 8.7
Bituminous 64.3 65.8 64.5 63.5 63.6 0.2
Tennessee 2.9 3.2 2.8 2.7 2.3 -12.0
Virginia 31.4 27.7 29.7 25.3 24.6 -3.0
West Virginia Total 148.0 153.6 152.4 153.5 158.0 2.9
Northern 40.6 42.6 42.4 42.2 40.9 -3.1
Southern 107.3 111.0 110.0 111.3 117.1 5.2
Interior Total 146.0 149.2 151.4 146.7 146.7 0.0
Arkansas * * * 0.1 0.1 -16.3
Illinois 31.9 32.0 32.7 32.4 33.0 1.6
Indiana 35.1 34.5 35.1 35.0 36.2 3.3
Kansas 0.1 0.2 0.4 0.4 0.2 -45.5
Kentucky, Western 23.4 26.4 27.2 28.2 30.0 6.3
Louisiana 3.8 4.2 4.1 3.1 3.8 22.9
Mississippi 3.6 3.6 3.8 3.5 2.8 -19.9
Missouri 0.6 0.6 0.4 0.2 0.2 4.6
Oklahoma 1.8 1.9 2.0 1.6 1.4 -17.7
Texas 45.9 45.9 45.5 41.9 39.0 -7.0
Western Total 575.2 585.0 619.4 621.0 633.6 2.0
Alaska 1.5 1.5 1.4 1.3 1.5 11.6
Arizona 12.7 12.1 8.2 8.0 8.0 0.5
Colorado 39.9 38.5 36.3 36.4 32.0 -12.0
Montana 40.0 40.4 41.8 43.4 44.8 3.2
New Mexico 27.2 28.5 25.9 24.5 25.6 4.9
North Dakota 29.9 30.0 30.4 29.6 29.6 0.1
Utah 21.7 24.5 26.0 24.3 24.4 0.2
Washington 5.7 5.3 2.6 - - 0.0
Wyoming 396.5 404.3 446.7 453.6 467.6 3.1
Refuse Recovery 1.0 0.7 0.8 1.2 1.4 17.9
U.S. Total 1,112.1 1,131.5 1,162.7 1,146.6 1,171.5 2.2
* Less than 50 thousand short tons.
Source: Energy Information Administration, Annual Coal Report 2005, DOE/EIA-0584(2005)(Washington, DC, October 2006); Energy Information Administration, Annual Coal Report 2007, DOE/EIA-0584(2007)(Washington, DC, January 2009); and Quarterly Coal Report, October-December 2008, DOE/EIA-0121(2008/Q4)(Washington, DC, March 2009).
Appalachian Region
Coal production in the Appalachian Region reversed a two-year declining trend and ended 2008 at 389.8 million short tons, an increase of 3.2 percent, or 12.0 million short tons. The growth in 2008 in coal production in the Appalachian Region was primarily driven by the large increase in U.S. coal exports, which are predominantly produced in this region. International demand for metallurgical coal, which is primarily produced in the central and southern portions of the Appalachian Region, helped to push several of the States to higher production totals for the year. Four of the States in the Appalachian Region (Alabama, East Kentucky, Ohio, and West Virginia) had an increase of over a million short tons in 2008, more than offsetting the two States (Tennessee and Virginia) that had a decline in production for the year.
West Virginia, the largest coal-producing State in the Appalachian Region and the second largest in the U.S., had an increase in total coal production of 2.9 percent in 2008 to end the year with 158.0 million short tons of production, 4.5 million short tons above the 2007 level. Even though there were large declines in production at several mines in the state due to either production related issues or the idling or suspension of production totaling a combined drop of 5.1 million short tons, the increases in production at existing mines or the start-up of new mines more than offset the those decreases. The idling or suspension of production by Massey Energy’s No. 130 and Laurel Creek mines, Patriot Coal’s Europa mine, and Appalachian Fuels Big Creek No. 2 surface mine accounted for 2.7 million short tons of the decrease while production issues [movement of longwalls, geological impairments, or equipment issues] at ANR’s Alma mine, Patriot Coal’s Samples mine, Massey Energy’s Black Castle mine, and Frasure Creek’s Mine No. 7 accounted for 2.4 million short tons of the decrease. Major increases in coal production of at least 0.5 million short tons in 2008 experienced by Arch Coal’s Mountaineer II mine, Massey Energy’s Republic mine, Brody Mining’s Mine No. 1, Cleveland-Cliff’s Pinnacle mine, Eagle Creek Mining’s MT-11 Surface mine, Hanover Resources’ Four Mile Mine No. 2, and Patriot Coal’s American Eagle mine added over 6.7 million short tons to West Virginia’s total.
Coal production in Ohio in 2008 increased by 3.7 million short tons, or 16.3 percent to end the year at 26.3 million short tons, the highest level in a decade. The increase in production was primarily a result of higher production levels at four mines in the State. Ohio American Energy’s Salt Run mine had an increase of 1.4 million short tons in 2008, its first full year of production. Ohio Valley Coal’s Powhatan No. 6 mine had an increase of 1.2 million short tons in 2008, while Buckingham Coal’s Mine No. 6 had an increase of 0.6 million short tons and Oxford Mining’s Snyder mine had an increase of 0.5 million short tons.
Eastern Kentucky produced 89.9 million short tons of coal in 2008, an increase of 3.2 percent or 2.8 million short tons above the 2007 level. Although there were 16 mines in Eastern Kentucky that had a 2008 production increase of at least a quarter-of-a-million short tons, there were also 16 mines that had a production decrease of at least a quarter-of-a-million short tons. The primary reason that total coal production in Eastern Kentucky was higher for the year was the fact that there were 141 mines that had production that were either new in 2008 or did not produce coal in 2007 and these mines accounted for 9.1 million short tons, more than enough to offset the 90 mines that had produced coal in 2007 but were either closed or idled for 2008.
Coal production in Alabama in 2008 totaled 20.6 million short tons, 6.6 percent higher than the 2007 level. Although production levels decreased at several mines in the State, with the largest being a drop of 0.5 million short tons of Twin Pines Coal Company’s Mine No. 2 which suspended production after the first quarter of the year, increases in coal production by several other mines along with production from six new mines resulted in a coal production level that was just slightly below the 2005 level. The largest portion of the 1.3 million short ton increase for 2008 was due to the increase in coal production by Drummond Company’s Shoal Creek mine, which produced 2.1 million short tons, 0.8 million short tons more than it produced in 2007.
Pennsylvania produced 65.3 million short tons, an increase of 0.4 percent from 2007 or 0.3 million short tons. Coal production in Maryland in 2008 totaled 2.8 million short tons, an increase of 0.5 million short tons. Tennessee, one of the two States in the Appalachian Region to have a decrease in production in 2008, produced a total of 2.3 million short tons, down by 0.3 million short tons. Coal production in Virginia decreased in 2008 by 0.8 million short tons to a total of 24.6 million short tons, a decline of 3.0 percent. The decrease in coal production in Virginia was primarily a result of the abandonment of Paramount Coal’s Lovers Gap No. 2 mine and Exeter Coal’s Mine No. 1, combined with the suspension of production at Arch Coal’s Pardee mine in the latter half of 2007.
Interior Region
Coal production in the Interior Region in 2008 was 146.7 million short tons, comparable to the 2007 production level. While the total coal production for the region was basically unchanged, that was not the case when it came to the respective States’ production levels in 2008. Three of the four largest coal-producing States (Indiana, West Kentucky, and Texas) in the region had major changes in their production levels in 2008 when compared to 2007. Texas, the largest coal-producing State in the region, had a decrease in coal production of 2.9 million short tons to end the year at 39.0 million short tons, a level not seen since 1983. Texas coal is lignite, the lowest rank of coal with the lowest amount of energy (or Btus) and the vast majority of the coal is used in the electric power sector, primarily at mine-mouth facilities. The amount of Texas-produced lignite consumed by the electric power sector in the State dropped by 7.9 percent while the total amount of coal consumed in the electric power sector in Texas declined only slightly, by 1.3 percent. The discrepancy is due to the fact that the amount of subbituminous coal consumed for power production increased by 4.3 percent. Declines in coal production by three Texas mines accounted for most drop in 2008 production. The three mines are Luminant Mining’s Beckville Strip, Winfield South Strip, and Big Brown Strip down by 1.1, 0.7, and 0.6 million short tons, respectively.
Western Kentucky had the largest increase in coal production in the Interior Region in 2008, increasing by 1.8 million short tons to reach a total of 30.0 million short tons. This is the fourth year in a row that Western Kentucky experienced growth in coal production and the 2008 increase of 6.3 percent was primarily a result of the growth in production by one mine and the opening of a new mine in the second quarter of the year. The increase of 1.4 million short tons experienced by Hopkins County Coal’s Elk Creek mine and the opening of Armstrong Coal’s Midway mine which produced 0.8 million short tons in 2008 more than offset the production declines experienced by several other mines during the year.
Indiana produced a total of 36.2 million short tons in 2008, an increase of 3.3 percent, or 1.2 million short tons. Although there was a decrease of 0.5 million short tons by United Minerals’ Somerville East mine, an increase in production of 0.9 million short tons by Sunrise Coal’s Carlisle mine and an increase of 0.6 million short tons by both Gibson County Coal’s Gibson mine and Black Beauty Coal’s Francisco mine lead to Indiana’s highest production level since 2001. Illinois is the other major coal-producing State in the Interior Region, and it had an increase of 1.6 percent to end the year at a total of 33.0 million short tons. The other States in the Interior Region (Arkansas, Kansas, Louisiana, Mississippi, Missouri, and Oklahoma), which together produced 8.4 million short tons of coal, accounted for a total of 5.7 percent of the entire region’s production in 2008. Of these States, only Louisiana and Missouri had increases in their coal production from their prior year levels.
Western Region
The Western Region is the largest coal-producing region in the U.S., and in 2008 coal production rose by 2.0 percent to reach a total of 633.6 million short tons, 54 percent of total U.S. production for the year. The increase of 12.6 million short tons resulted in another record level for the region, the fifth year in a row. Although there was a record level of coal production in 2008, one State in the Western Region (Colorado) had a lower production level than the previous year.
Wyoming, the largest coal-producing State in the nation, a position it has held for two decades, continues to dominate the U.S. coal production picture. In 2008, Wyoming produced 467.6 million short tons of coal, an increase of 3.1 percent, or 14.1 million short tons for the year, another record year. Wyoming has dominated U.S. coal production since 1995 when it first accounted for more than one-quarter of total U.S. production. Examples of how much Wyoming dominates the U.S. coal supply include that for 2008, it accounted for 73.8 percent of the Western Region production total; was 77.8 million short tons more than the entire Appalachian Region; was more than three times the Interior Region; and was almost 40 percent of the total U.S. coal production for the year. Also, if all of the coal-producing States in 2008 were ranked by descending total production levels, Wyoming produced more than the next six largest coal-producing States (West Virginia, Kentucky, Pennsylvania, Montana, Texas, and Indiana), besting their combined production by 4.5 million short tons. Wyoming also produced 261.3 million short tons more coal than the summation of the States ranked 8th through 25th. Although seven of the twenty mines in Wyoming had decreases in coal production in 2008, the increased production levels at the rest of the mines pushed the state to a new record level for the year. Peabody’s North Antelope Rochelle mine was again the largest coal mine in Wyoming and the U.S. in 2008, producing a total of 97.6 million short tons, an increase of 6.1 million short tons or 6.6 percent. This one mine produced more coal than the combined total of the other coal-producing States ranked 13th through 25th in 2008. Although there were increases of over 2 million short tons experienced by three other mines in Wyoming, one mine, Foundation Coal’s Eagle Butte mine, had a decrease in production of 4.5 million short tons, a decline of 18.2 percent, to end the year at 20.4 million short tons.
In 2008, Montana, the second largest coal-producing State in the Western Region, produced a total of 44.8 million short tons, an increase of 3.2 percent. Although there were decreases in production at half of the six mines in the State, the increase in coal production at Spring Creek Coal’s Spring Creek mine of 2.2 million short tons in 2008 to reach a total of 17.9 million short tons, more than offset the declines. Colorado, the third largest coal-producing State in the Western Region, was the only State in the region to have a decrease in coal production for 2008. Colorado ended the year with a total of 32.0 million short tons, a decline of 12.0 percent, or 4.4 million short tons. Although eight of the twelve mines in the State had lower coal production in 2008, the majority of the decrease in Colorado’s total production was accounted for by two mines. Bowie Resources’ Bowie No. 2 mine had a decrease of 2.6 million short tons to end the year at 2.9 million short tons, and Arch Coal’s West Elk mine had a decrease of 1.0 million short tons to end the year at 5.9 million short tons. Both of these are underground longwall mines and they experienced production problems relating to geologic faults that impacted production due to relocating the longwall mining systems.
Total coal production in the other States in the Western Region (Alaska, Arizona, New Mexico, North Dakota, and Utah) had increases in their respective production levels in 2008. The increases ranged in percentages from a low of 0.1 percent in North Dakota to a high of 11.6 percent in Alaska, while the tonnage increases ranged from a low of 21 thousand short tons in North Dakota to a high of 1.2 million short tons in New Mexico.
PCAI DD
General Company overview
CEO David Cohen personally Owns over 23% of outstanding shares.
AS 500 million
OS : 35,580,340
Float : 3.5 million
Generate over $90 million is sales revenues with net profitability at a minimum of 3 percent.
Attain store revenues between $2.0 to $3.5 million per store annually
Ramp up to pumping a minimum of three million gallons of gasoline per month
Implement cost effective, centralized real-time remote sales and financial management reporting and security systems and accountability.
After a store is acquired and re-engineered to the specification of the parent, a landlord-leasing distribution program will be implemented
Ramp up acquisitions with one (1) new store monthly, ten (10) annually, totaling twenty (20) over the period a two-year period and thirty (30) within three years.
Company Pursues $400 Billion Industry
The Company began generating revenue in the $400 Billion Industry in 2006 through acquisitions during the second quater of 2007 and ended that year with revenue of $4.26 million!
Potential acquisitions candidates must have the potential to pump 1,200,000 gallons of gasoline annually with in-store item sales potential to exceed of $420,000 annually!
Focus on identifying unique high growth geo graphical areas with C-store locations that will achieve fast operational breakeven costs/revenues and with a much higher than average return on investment.
PCAI's centralized operation, purchasing and distribution strategies reduces overhead, increases quality control & improves profitability
Announced that it is focused on reaching its objective to acquire 50-60 stations over the next three years starting in 2009. Unlike other industries, the distressed economy has increased the number of targeted revenue-producing locations which, in turn, leads to an opportunistic market.
Anticipated Sales Streams
Sales Steam #1 - Retailer of Gasoline Stations
As a retailer to consumers in the gasoline / C-store channel and as a Jobber to its gasoline / C-store operators, distributing gasoline to its network of company owned stores and operator-leased facilities.
PCAI has target market demographics focused from South Florida north through Jacksonville that target mom and pop C-stores, distress sales or previously operated locations. Sound financial leverage will be used acquire sites. Market research indicates that motorists are primarily concerned with the big four: (1) quality, (2) convenience, (3) safety, and (4) cleanliness.
PCAI Retail Concept Model Includes:
Are located along busy roads, in densly populated suburban neighborhoods
Re-branding program using major branded gasoline
Transitioning the store from a "stop" to a "destination" to increase in-store sales
Multi-cultural pre-packaged product offerings based on the surrounding cultural demographics of the community
Re-branding and re-merchandising to provide an image in which the C-store evolves into a motorist destination, rather that just a one time or occasional stop for drivers and neighborhood pedestrians alike.
Sales Stream #2 - Wholesaler of Gasoline
As a general rule, Jobber-operated stations use gasoline supplied by a major oil company, which is delivered to the gasoline terminal at rack pricing. The jobber has the responsiblity of delivering the gasoline to the retail stations and independently sets the wholesale cost over rack pricing paid by the operator.
PCAI's wholesale jobber contracts for branded and/or unbranded gasoline sold through its distribution network will add net income of $0.04 per gallon (comprised of $0.02 over rack pricing plus $0.02 volume rebate from varied oil companies). Example: 6 million gallons annually would add another $240,000.00 profi directly to the bottom line.
Began generating revenue through acquisitions during the second quarter of 2007 and ended that year with revenue of $4.26 million.
Gas Staion Industry Info
On April 28, 2008 the Energy Information Agency released offical energy statistics from the federal government. In 2007, domestic crude oil output averaged 5.1 million bbl/d, unchanged from 2006 (U.S. Crude Oil Production), and is projected to decline only slightly in 2008. In 2009, however, production is projected to grow by 3.9 percent, or about 200,000 bbl/d (barrels per day), mainly because of the start-up of the Thunder Horse and Tahiti platforms in the Gulf of Mexico.
Total petroleum consumption of liquid gasoline and other petroleum products averaged 20.7 million bbl/d in 2007, essentially unchanged from 2006 (U.S. Petroleum Products Consumption Growth). Based on the projections of weak economic growth and record high crude oil and product prices, consumption of liquid gasoline and other petroleum products is projected to decline by 90,000 bbl/d in 2008 - a sharp reversal from the 40,000 bbl/d increase projected in the previous outlook - then increase by 200,000 bbl/d in 2009. After accounting for projected increases in domestic ethanol production, U.S. petroleum consumption is projected to fall by 210,000 bbl/d this year. Gasoline consumption is projected to shrink by 0.2 percent in 2008 before rising by 1.5 percent in 2009.
There were 164,292 total retail-gasoline sites in the United States in 2007. This is a steep and steady decline since 1994, when the station count topped 202,800 sites. (Source: National Petroleum New's Market Facts 2007)., As of December 31,2006 there were 115,157
C-stores selling motor gasoline in the United States. This represents 79 percent of the 146,294 current C-stores in operation across the United States.
Merger with INdiana Coal Company Info
"Based on our initial discussions, current analysis and the geological report, dated April 28, 2009, which was written by an independent third party, we have ascertained that this merger candidate controls significant assets in the form of a mining reserve, that is conservatively valued in excess of $100,000,000 (one hundred million dollars) based on current market prices.
The private resource company with proven reserves of approximately 5,000,000 tons of low sulfur high BTU coal and approximately 15,500,000 tons of inferred coal deposits is located in the Illinois coal basin. The shallow coal seams are located approximately 150 feet below the surface and will be accessed with proven room and pillar mining techniques. The permitting process is in the last stages and is expected to be approved in the fall of 2009. Additional drilling programs are presently in progress to change the status of inferred reserves to proven reserves.
Misc Coal Mining info
The Quarterly Coal Report (QCR) provides detailed quarterly data on U.S. coal production, distribution, exports, imports, receipts, prices, consumption, stocks, synfuel, and quality. Data on US. coke production, distribution, exports, imports, and consumption are also provided. This edition contains revised data for the previous quarters.
Highlights for the 4th Quarter of 2008:
Production grew slightly to 299.4 million short tons, a new record for a single quarter.
Consumption decreased by 9.7 percent to 270.4 million short tons.
Exports increased by 9.7 percent to 22.3 million short tons and accounted for 7.5 percent of total coal production.
Imports rose by 7.3 percent to 9.1 million short tons, the third highest level in the U.S. history.
Stocks increased by 12.0 percent to 171.9 million short tons, the highest fourth quarter level since 1987
http://www.eia.doe.gov/cneaf/coal/quarterly/qcr_sum.html
US Production
U.S. coal production grew in 2008 by 2.2 percent to reach a record level of 1,171.5 million short tons (Figure 1 and (Table 1), 24.8 million short tons more than the 2007 production total. Although total U.S. coal production was higher in 2008, only two of the three coal-producing regions had increases in coal production while the other was about level. Exclusive of refuse production, the Appalachian and Western Regions had an increase in their production levels in 2008 of 3.2 percent and 2.0 percent respectively, while the Interior Region remained essentially unchanged (Figure 2 and (Table 2). In the amount of tons of coal produced, the increase in the Appalachian Region production was 12.0 million short tons, while the increase in the Western Region production in 2008 was 12.6 million short tons. Coal production in the Interior Region increased by only 57 thousand short tons.
Figure 1. Coal Production by
Coal-Producing Region, 2008
Regional Totals do not include refuse recovery Figure 2. Coal Production by Region, 1999-2008
(Million Short Tons)
Regional Totals do not include refuse recovery
Table 2. U.S. Coal Production by Coal-Producing Region and State, 2004 - 2008
(Million Short Tons)
Coal-Producing Region and State 2004 2005 2006 2007 2008 Percent Change
2007 - 2008
Appalachia Total 389.9 396.7 391.2 377.8 389.8 3.2
Alabama 22.3 21.3 18.8 19.3 20.6 6.6
Kentucky, Eastern 90.9 93.3 93.6 87.1 89.9 3.2
Maryland 5.2 5.2 5.1 2.3 2.8 22.0
Ohio 23.2 24.7 22.7 22.6 26.3 16.3
Pennsylvania Total 66.0 67.5 66.0 65.0 65.3 0.4
Anthracite 1.7 1.6 1.5 1.6 1.7 8.7
Bituminous 64.3 65.8 64.5 63.5 63.6 0.2
Tennessee 2.9 3.2 2.8 2.7 2.3 -12.0
Virginia 31.4 27.7 29.7 25.3 24.6 -3.0
West Virginia Total 148.0 153.6 152.4 153.5 158.0 2.9
Northern 40.6 42.6 42.4 42.2 40.9 -3.1
Southern 107.3 111.0 110.0 111.3 117.1 5.2
Interior Total 146.0 149.2 151.4 146.7 146.7 0.0
Arkansas * * * 0.1 0.1 -16.3
Illinois 31.9 32.0 32.7 32.4 33.0 1.6
Indiana 35.1 34.5 35.1 35.0 36.2 3.3
Kansas 0.1 0.2 0.4 0.4 0.2 -45.5
Kentucky, Western 23.4 26.4 27.2 28.2 30.0 6.3
Louisiana 3.8 4.2 4.1 3.1 3.8 22.9
Mississippi 3.6 3.6 3.8 3.5 2.8 -19.9
Missouri 0.6 0.6 0.4 0.2 0.2 4.6
Oklahoma 1.8 1.9 2.0 1.6 1.4 -17.7
Texas 45.9 45.9 45.5 41.9 39.0 -7.0
Western Total 575.2 585.0 619.4 621.0 633.6 2.0
Alaska 1.5 1.5 1.4 1.3 1.5 11.6
Arizona 12.7 12.1 8.2 8.0 8.0 0.5
Colorado 39.9 38.5 36.3 36.4 32.0 -12.0
Montana 40.0 40.4 41.8 43.4 44.8 3.2
New Mexico 27.2 28.5 25.9 24.5 25.6 4.9
North Dakota 29.9 30.0 30.4 29.6 29.6 0.1
Utah 21.7 24.5 26.0 24.3 24.4 0.2
Washington 5.7 5.3 2.6 - - 0.0
Wyoming 396.5 404.3 446.7 453.6 467.6 3.1
Refuse Recovery 1.0 0.7 0.8 1.2 1.4 17.9
U.S. Total 1,112.1 1,131.5 1,162.7 1,146.6 1,171.5 2.2
* Less than 50 thousand short tons.
Source: Energy Information Administration, Annual Coal Report 2005, DOE/EIA-0584(2005)(Washington, DC, October 2006); Energy Information Administration, Annual Coal Report 2007, DOE/EIA-0584(2007)(Washington, DC, January 2009); and Quarterly Coal Report, October-December 2008, DOE/EIA-0121(2008/Q4)(Washington, DC, March 2009).
Appalachian Region
Coal production in the Appalachian Region reversed a two-year declining trend and ended 2008 at 389.8 million short tons, an increase of 3.2 percent, or 12.0 million short tons. The growth in 2008 in coal production in the Appalachian Region was primarily driven by the large increase in U.S. coal exports, which are predominantly produced in this region. International demand for metallurgical coal, which is primarily produced in the central and southern portions of the Appalachian Region, helped to push several of the States to higher production totals for the year. Four of the States in the Appalachian Region (Alabama, East Kentucky, Ohio, and West Virginia) had an increase of over a million short tons in 2008, more than offsetting the two States (Tennessee and Virginia) that had a decline in production for the year.
West Virginia, the largest coal-producing State in the Appalachian Region and the second largest in the U.S., had an increase in total coal production of 2.9 percent in 2008 to end the year with 158.0 million short tons of production, 4.5 million short tons above the 2007 level. Even though there were large declines in production at several mines in the state due to either production related issues or the idling or suspension of production totaling a combined drop of 5.1 million short tons, the increases in production at existing mines or the start-up of new mines more than offset the those decreases. The idling or suspension of production by Massey Energy’s No. 130 and Laurel Creek mines, Patriot Coal’s Europa mine, and Appalachian Fuels Big Creek No. 2 surface mine accounted for 2.7 million short tons of the decrease while production issues [movement of longwalls, geological impairments, or equipment issues] at ANR’s Alma mine, Patriot Coal’s Samples mine, Massey Energy’s Black Castle mine, and Frasure Creek’s Mine No. 7 accounted for 2.4 million short tons of the decrease. Major increases in coal production of at least 0.5 million short tons in 2008 experienced by Arch Coal’s Mountaineer II mine, Massey Energy’s Republic mine, Brody Mining’s Mine No. 1, Cleveland-Cliff’s Pinnacle mine, Eagle Creek Mining’s MT-11 Surface mine, Hanover Resources’ Four Mile Mine No. 2, and Patriot Coal’s American Eagle mine added over 6.7 million short tons to West Virginia’s total.
Coal production in Ohio in 2008 increased by 3.7 million short tons, or 16.3 percent to end the year at 26.3 million short tons, the highest level in a decade. The increase in production was primarily a result of higher production levels at four mines in the State. Ohio American Energy’s Salt Run mine had an increase of 1.4 million short tons in 2008, its first full year of production. Ohio Valley Coal’s Powhatan No. 6 mine had an increase of 1.2 million short tons in 2008, while Buckingham Coal’s Mine No. 6 had an increase of 0.6 million short tons and Oxford Mining’s Snyder mine had an increase of 0.5 million short tons.
Eastern Kentucky produced 89.9 million short tons of coal in 2008, an increase of 3.2 percent or 2.8 million short tons above the 2007 level. Although there were 16 mines in Eastern Kentucky that had a 2008 production increase of at least a quarter-of-a-million short tons, there were also 16 mines that had a production decrease of at least a quarter-of-a-million short tons. The primary reason that total coal production in Eastern Kentucky was higher for the year was the fact that there were 141 mines that had production that were either new in 2008 or did not produce coal in 2007 and these mines accounted for 9.1 million short tons, more than enough to offset the 90 mines that had produced coal in 2007 but were either closed or idled for 2008.
Coal production in Alabama in 2008 totaled 20.6 million short tons, 6.6 percent higher than the 2007 level. Although production levels decreased at several mines in the State, with the largest being a drop of 0.5 million short tons of Twin Pines Coal Company’s Mine No. 2 which suspended production after the first quarter of the year, increases in coal production by several other mines along with production from six new mines resulted in a coal production level that was just slightly below the 2005 level. The largest portion of the 1.3 million short ton increase for 2008 was due to the increase in coal production by Drummond Company’s Shoal Creek mine, which produced 2.1 million short tons, 0.8 million short tons more than it produced in 2007.
Pennsylvania produced 65.3 million short tons, an increase of 0.4 percent from 2007 or 0.3 million short tons. Coal production in Maryland in 2008 totaled 2.8 million short tons, an increase of 0.5 million short tons. Tennessee, one of the two States in the Appalachian Region to have a decrease in production in 2008, produced a total of 2.3 million short tons, down by 0.3 million short tons. Coal production in Virginia decreased in 2008 by 0.8 million short tons to a total of 24.6 million short tons, a decline of 3.0 percent. The decrease in coal production in Virginia was primarily a result of the abandonment of Paramount Coal’s Lovers Gap No. 2 mine and Exeter Coal’s Mine No. 1, combined with the suspension of production at Arch Coal’s Pardee mine in the latter half of 2007.
Interior Region
Coal production in the Interior Region in 2008 was 146.7 million short tons, comparable to the 2007 production level. While the total coal production for the region was basically unchanged, that was not the case when it came to the respective States’ production levels in 2008. Three of the four largest coal-producing States (Indiana, West Kentucky, and Texas) in the region had major changes in their production levels in 2008 when compared to 2007. Texas, the largest coal-producing State in the region, had a decrease in coal production of 2.9 million short tons to end the year at 39.0 million short tons, a level not seen since 1983. Texas coal is lignite, the lowest rank of coal with the lowest amount of energy (or Btus) and the vast majority of the coal is used in the electric power sector, primarily at mine-mouth facilities. The amount of Texas-produced lignite consumed by the electric power sector in the State dropped by 7.9 percent while the total amount of coal consumed in the electric power sector in Texas declined only slightly, by 1.3 percent. The discrepancy is due to the fact that the amount of subbituminous coal consumed for power production increased by 4.3 percent. Declines in coal production by three Texas mines accounted for most drop in 2008 production. The three mines are Luminant Mining’s Beckville Strip, Winfield South Strip, and Big Brown Strip down by 1.1, 0.7, and 0.6 million short tons, respectively.
Western Kentucky had the largest increase in coal production in the Interior Region in 2008, increasing by 1.8 million short tons to reach a total of 30.0 million short tons. This is the fourth year in a row that Western Kentucky experienced growth in coal production and the 2008 increase of 6.3 percent was primarily a result of the growth in production by one mine and the opening of a new mine in the second quarter of the year. The increase of 1.4 million short tons experienced by Hopkins County Coal’s Elk Creek mine and the opening of Armstrong Coal’s Midway mine which produced 0.8 million short tons in 2008 more than offset the production declines experienced by several other mines during the year.
Indiana produced a total of 36.2 million short tons in 2008, an increase of 3.3 percent, or 1.2 million short tons. Although there was a decrease of 0.5 million short tons by United Minerals’ Somerville East mine, an increase in production of 0.9 million short tons by Sunrise Coal’s Carlisle mine and an increase of 0.6 million short tons by both Gibson County Coal’s Gibson mine and Black Beauty Coal’s Francisco mine lead to Indiana’s highest production level since 2001. Illinois is the other major coal-producing State in the Interior Region, and it had an increase of 1.6 percent to end the year at a total of 33.0 million short tons. The other States in the Interior Region (Arkansas, Kansas, Louisiana, Mississippi, Missouri, and Oklahoma), which together produced 8.4 million short tons of coal, accounted for a total of 5.7 percent of the entire region’s production in 2008. Of these States, only Louisiana and Missouri had increases in their coal production from their prior year levels.
Western Region
The Western Region is the largest coal-producing region in the U.S., and in 2008 coal production rose by 2.0 percent to reach a total of 633.6 million short tons, 54 percent of total U.S. production for the year. The increase of 12.6 million short tons resulted in another record level for the region, the fifth year in a row. Although there was a record level of coal production in 2008, one State in the Western Region (Colorado) had a lower production level than the previous year.
Wyoming, the largest coal-producing State in the nation, a position it has held for two decades, continues to dominate the U.S. coal production picture. In 2008, Wyoming produced 467.6 million short tons of coal, an increase of 3.1 percent, or 14.1 million short tons for the year, another record year. Wyoming has dominated U.S. coal production since 1995 when it first accounted for more than one-quarter of total U.S. production. Examples of how much Wyoming dominates the U.S. coal supply include that for 2008, it accounted for 73.8 percent of the Western Region production total; was 77.8 million short tons more than the entire Appalachian Region; was more than three times the Interior Region; and was almost 40 percent of the total U.S. coal production for the year. Also, if all of the coal-producing States in 2008 were ranked by descending total production levels, Wyoming produced more than the next six largest coal-producing States (West Virginia, Kentucky, Pennsylvania, Montana, Texas, and Indiana), besting their combined production by 4.5 million short tons. Wyoming also produced 261.3 million short tons more coal than the summation of the States ranked 8th through 25th. Although seven of the twenty mines in Wyoming had decreases in coal production in 2008, the increased production levels at the rest of the mines pushed the state to a new record level for the year. Peabody’s North Antelope Rochelle mine was again the largest coal mine in Wyoming and the U.S. in 2008, producing a total of 97.6 million short tons, an increase of 6.1 million short tons or 6.6 percent. This one mine produced more coal than the combined total of the other coal-producing States ranked 13th through 25th in 2008. Although there were increases of over 2 million short tons experienced by three other mines in Wyoming, one mine, Foundation Coal’s Eagle Butte mine, had a decrease in production of 4.5 million short tons, a decline of 18.2 percent, to end the year at 20.4 million short tons.
In 2008, Montana, the second largest coal-producing State in the Western Region, produced a total of 44.8 million short tons, an increase of 3.2 percent. Although there were decreases in production at half of the six mines in the State, the increase in coal production at Spring Creek Coal’s Spring Creek mine of 2.2 million short tons in 2008 to reach a total of 17.9 million short tons, more than offset the declines. Colorado, the third largest coal-producing State in the Western Region, was the only State in the region to have a decrease in coal production for 2008. Colorado ended the year with a total of 32.0 million short tons, a decline of 12.0 percent, or 4.4 million short tons. Although eight of the twelve mines in the State had lower coal production in 2008, the majority of the decrease in Colorado’s total production was accounted for by two mines. Bowie Resources’ Bowie No. 2 mine had a decrease of 2.6 million short tons to end the year at 2.9 million short tons, and Arch Coal’s West Elk mine had a decrease of 1.0 million short tons to end the year at 5.9 million short tons. Both of these are underground longwall mines and they experienced production problems relating to geologic faults that impacted production due to relocating the longwall mining systems.
Total coal production in the other States in the Western Region (Alaska, Arizona, New Mexico, North Dakota, and Utah) had increases in their respective production levels in 2008. The increases ranged in percentages from a low of 0.1 percent in North Dakota to a high of 11.6 percent in Alaska, while the tonnage increases ranged from a low of 21 thousand short tons in North Dakota to a high of 1.2 million short tons in New Mexico.
Old but good reading on business plan that keep getting better and better.
PCAI: Acquisitions Could Gas Up Profits
Thursday , November 30, 2006 16:29ET
The South Florida gasoline and convenience store market is beginning to experience some consolidation. One company that is gaining momentum in this emerging trend is Petroleum Consolidators of America, Inc (PCAI).
Petroleum Consolidators of America, Inc. announced on Wednesday that it had entered into its second letter of intent with an independent owner to acquire a Chevron branded gas station located in Charlotte County, Florida.
Knobias originally reported on the company on November 9th, highlighting its first acquisition; a BP branded gas station also located in Charlotte County, Florida.
Knobias spoke with David Cohen, President and CEO of Petroleum Consolidators of American, Inc about the company's second deal.
"The second store is actually on the same road but 8 miles north,” noted Cohen, "It is also being acquired from the same owner but is a different brand than the first one."
The stations being different brands should allow Petroleum Consolidators a positive hedging effect in the event one brand becomes more or less desirable, as most recently experienced with CITGO. With several different brands, Petroleum Consolidators has the added ability to capture different consumer groups based on product offerings and pricing. Furthermore, these stations should immediately experience cost efficiencies through the implementation of technology and other cost saving mechanisms.
"We will purchase the gasoline in two different ways," said Cohen, "We will either use a major oil company as a supplier, such as Exxon-Mobil, BP, etc. or we will use 'jobbers' that have supply agreements and act as middlemen."
The two acquisitions are different in size and are expected to contribute different revenue and gross income numbers.
"The first acquisition is projecting revenue of $4.5M and a bottom line of $275,000. The second acquisition should produce $3M in revenue and contribute $195,000 in net income," noted Cohen, "The majority of revenue is generated from gas sales while the majority of the bottom line is contributed from inside store sales."
As its name implies, Petroleum Consolidators business strategy is to roll up these stations south of Orlando and house them under one name. The company has an aggressive business plan involving a number of acquisitions.
"We are targeting 50-60 stations over the next three years," stated Cohen, "But that number may decrease if we purchase ‘Megastations’.
A ‘Megastation’ is described as having a large structure on the property and bringing in $10M-$15M in annual revenue.
"If we decide to focus on ‘Megastations,’ we will probably not grow to 50-60 locations as we will achieve the same revenue and earning targets with fewer facilities," finished Cohen, "If we do not pursue ‘Megastations,’ our goal is to announce an acquisition that fits our profile every 6-8 weeks while maintaining our goals of contributing to the top and bottom line."
In any event, with $7.5M in revenue expected with half a million in gross income from the two stores, the company is quickly growing its top and bottom line numbers through an aggressive acquisition strategy. With expected cost synergies originating from the close proximities of the stores, investors can easily see the benefit of having these varied branded stations under one umbrella. Investors should continue to watch for more acquisition news from this name.
2008 Indiana Coal Production
Surface
Coal Company Mine Name County Production
Black Beauty Coal Company, LLC Farmersburg Mine Vigo 2,387,731.32
Black Beauty Coal Company, LLC Francisco Mine Gibson 1,381,782.27
Black Beauty Coal Company, LLC Miller Creek Mine, Knox Pit Knox 1,293,297.84
Black Beauty Coal Company, LLC Somerville East Mine Pike 349,454.40
Black Beauty Coal Company, LLC Somerville Mine Gibson 3,940,320.50
Black Beauty Coal Company, LLC Somerville South Mine Gibson 1,857,479.19
Black Beauty Coal Company, LLC Viking Mine, Corning Pit Daviess 1,126,468.75
Covol Fuels No. 2, LLC Chinook Ancillary Area Clay 97,366.11
Jarvis Coal, LLC JC # 1 Mine Sullivan 55,691.11
Solar Sources, Inc. Cannelburg Daviess 788,341.38
Solar Sources, Inc. Lewis Clay 350,389.03
Solar Sources, Inc. Midway II Daviess 678,601.55
Solar Sources, Inc. Shamrock Dubois 638,630.63
Triad Mining, Inc. Augusta Mine Pike 247,276.40
Triad Mining, Inc. Augusta South Pike 431,713.53
Triad Mining, Inc. Flat Creek Mine Pike 278,717.83
Triad Mining, Inc. Freelandville Knox 407,412.09
Triad Mining, Inc. Freelandville Mine, Center Pit Knox 86,765.21
Triad Mining, Inc. Freelandville Mine, East Pit Knox 149,645.73
Triad Mining, Inc. Hurricane Creek Mine Gibson 187,062.30
Vigo Coal Operating Co., Inc. Cypress Creek Mine Warrick 1,002,385.72
Vigo Coal Operating Co., Inc. Red Brush Mine Warrick 59,901.22
Total Production For Surface 17,796,434.11
Underground
Coal Company Mine Name County Production
Black Beauty Coal Company, LLC Air Quality Mine Knox 1,394,303.90
Black Beauty Coal Company, LLC Francisco Mine-Underground Pit Gibson 969,341.15
Five Star Mining, Inc. Prosperity Pike 1,761,983.30
Gibson County Coal, LLC Gibson County Gibson 2,767,151.50
Sunrise Coal, LLC Carlisle Mine Sullivan 1,354,970.08
Total Production For Underground 8,247,749.93
Wednesday, February 04, 2009 Report: rptFeeForWeb based on query qryFeeForWeb Page 1 of 2
Underground On A Surface Mine
Coal Company Mine Name County Production
Triad Mining, Inc. Freelandville Knox 512,857.52
Total Production For Underground On A Surface Mine 512,857.52
Total 2008 Production: 26,557,041.56
Wednesday, February 04, 2009 Report: rptFeeForWeb based on query qryFeeForWeb Page 2 of 2
"Based on our initial discussions, current analysis and the geological report, dated April 28, 2009, which was written by an independent third party, we have ascertained that this merger candidate controls significant assets in the form of a mining reserve, that is conservatively valued in excess of $100,000,000 (one hundred million dollars) based on current market prices.
PCAI highlights:
Generate over $90 million is sales revenues with net profitability at a minimum of 3 percent.
Attain store revenues between $2.0 to $3.5 million per store annually
Ramp up to pumping a minimum of three million gallons of gasoline per month
Implement cost effective, centralized real-time remote sales and financial management reporting and security systems and accountability.
After a store is acquired and re-engineered to the specification of the parent, a landlord-leasing distribution program will be implemented
Ramp up acquisitions with one (1) new store monthly, ten (10) annually, totaling twenty (20) over the period a two-year period and thirty (30) within three years.
Company Pursues $400 Billion Industry
The Company began generating revenue in the $400 Billion Industry in 2006 through acquisitions during the second quater of 2007 and ended that year with revenue of $4.26 million!
Potential acquisitions candidates must have the potential to pump 1,200,000 gallons of gasoline annually with in-store item sales potential to exceed of $420,000 annually!
Focus on identifying unique high growth geo graphical areas with C-store locations that will achieve fast operational breakeven costs/revenues and with a much higher than average return on investment.
PCAI's centralized operation, purchasing and distribution strategies reduces overhead, increases quality control & improves profitability
Morning all. Good job Money, keep us informed.
Now add the spinoff with free trading shares, low share structure , etc. so what's not to like here. Worth a few shares to say the least, heck...there are worse plays out there.
Just some basic info on the method they will use to extract the caol once merger is complete.
Room and pillar (also called bord and pillar) is a mining system in which the mined material is extracted across a horizontal plane while leaving "pillars" of untouched material to support the overburden leaving open areas or "rooms" underground. It is usually used for relatively flat-lying deposits, such as those that follow a particular stratum.
The room and pillar system is used in mining coal, iron and base metals ores particularly when found as manto or blanket deposits, stone and aggregates, talc, soda ash and potash. [1]
The key to the successful room and pillar mining is selecting the optimum pillar size. If the pillars are too small the mine will collapse. If the pillars are too large then significant quantities of valuable material will be left behind reducing the profitability of the mine.[1] The percentage of material mined varies depending on many factors, including the material mined, height of the pillar, and roof conditions; typical values are: stone and aggregates 75%, coal 60%, and potash 50%.[1]
That 100 mill deal would add nicely to this.
Our total revenues for calendar 2008 were $2.38 million, a decrease from 2007. This
decline in revenue was due to the selloff of an underperforming store. Although our
revenues decreased, we have positioned ourselves more effectively to take
advantage of acquiring distressed stores at significantly lower valuations, thus,
allowing us to achieve greater margins throughout 2009. In calendar 2007 and 2008,
we reported a net loss of ($597,975) and ($1,664,671) respectively and a net diluted
loss of ($0.03) per share.
Never though about this. Possible rev stream in the coming years.
Million Tons of CO2 Will Be Injected Under Illinois
WASHINGTON, DC, December 20, 2007 (ENS) - Millions of tons of the greenhouse gas carbon dioxide will be injected deep underground for storage expected to last for thousands of years in a series of projects funded by the U.S. Department of Energy in all regions of the country. Generated by burning fossil fuels, if allowed to escape into the atmosphere, the gas will intensify global warming.
The Energy Department plans to invest $197 million over 10 years for the seven projects, subject to annual appropriations from Congress. Their estimated value, including partnership cost share, is $318 million.
On Tuesday, the Energy Department awarded $66.7 million to the Midwest Geological Sequestration Consortium for a large-scale carbon sequestration project. The partnership, led by the Illinois State Geological Survey, will conduct tests in the Illinois Basin.
Repost of yesterdys PR just incase no one saw it.
Petroleum Consolidators Announces Intent to Spinoff a Wholly Owned Subsidiary
On Tuesday June 2, 2009, 9:00 am EDT
Buzz up! Print Related:Petroleum Consolidators of America, Inc.
PALM BEACH GARDENS, FL--(MARKET WIRE)--Jun 2, 2009 -- Petroleum Consolidators of America, Inc. (Other OTC:PCAI.PK - News), a gasoline station/convenience store consolidator, is pleased to announce its intention to spinoff Pioneer Realty Group, Inc., its wholly owned subsidiary, to its shareholders of record on June 10, 2009. Shareholders of record on such date will receive a pro rata distribution of one share in Pioneer Realty Group, Inc. for every fourteen shares they own of PCAI as of June 10, 2009. Fractional shares will not be issued, as they will be rounded up to equal a whole share.
Related Quotes
Symbol Price Change
PCAI.PK 0.05 0.00
{"s" : "pcai.pk","k" : "c10,l10,p20,t10","o" : "","j" : ""} Petroleum Consolidators President & CEO David Cohen stated, "Our decision to spinoff Pioneer Realty Group, Inc. should help us continue to pursue our strategy of building a diverse portfolio of retail gasoline facilities and a wholesale fuel distribution business. We are confident that separating these companies should allow Petroleum Consolidators to maximize shareholder value from its potential merger based on its non-binding letter of intent with an Indiana based mining company."
About Petroleum Consolidators of America.
Petroleum Consolidators of America, Inc. is a gasoline station/convenience store operator which is implementing a targeted acquisition strategy to create a portfolio of consolidated retail gasoline facilities, producing oil wells and a wholesale fuel distributorship that will benefit from substantial operating efficiencies.
Safe Harbor
This release contains various forward-looking statements within the meaning of Section 27A of the Securities Act of 1933, as amended and Section 21E of the Securities Exchange Act of 1934, as amended which represent the company's expectations or beliefs concerning future events of the company's financial performance. These forward-looking statements are further qualified by important factors that could cause actual results to differ materially from those in the forward-looking statements. The words "may," "could," "should," "believe," "anticipate," "estimate," "expect," "intend," "plan" and similar words are intended to identify forward-looking statements. These forward-looking statements are based on the Company's current plans and expectations and involve a number of risks and uncertainties that could cause actual results and events to vary materially from the results and events anticipated or implied by such forward-looking statements. Any number of factors could affect actual results and events, including, without limitation: the ability of the Company to take advantage of expected synergies in connection with acquisitions; the actual operating results of stores and / or properties acquired; the ability of the Company to integrate acquisitions into its operations; fluctuations in domestic and global petroleum, coal and gasoline markets; changes in the competitive landscape of the coal industry, convenience store industry, including gasoline stations and other non-traditional retailers located in the Company's markets; the effect of national and regional economic conditions on the convenience store industry and the markets we serve; the effect of regional weather conditions on customer traffic; financial difficulties of suppliers, including our principal suppliers of gas and merchandise, and their ability to continue to supply our stores; environmental risks associated with selling petroleum products; governmental regulations, including those regulating the environment; and acts of war or terrorist activity. Results actually achieved may differ materially from expected results included in these statements. The Company is under no obligation to, and expressly disclaims any such obligation to, update or alter its forward-looking statements, whether as a result of new information, future events or otherwise. Furthermore, the Company cautions that the risk factors listed in this paragraph are not exhaustive.
Contact:
Contact:
David Cohen
President & CEO
Petroleum Consolidators of America, Inc.
(561) 483-4440
Email Contact
http://www.petroleumconsolidators.com
This may be a good start for research purposes
http://dnb.powerprofiles.com/Indiana/12/
Does anyone know what city this private company is located in Indiana?
I haven't been able to pull anything up either but I am still looking and trying to find something theat may give us an idea. Either way they have significant reserves.
The private resource company with proven reserves of approximately 5,000,000 tons of low sulfur high BTU coal and approximately 15,500,000 tons of inferred coal deposits is located in the Illinois coal basin. The shallow coal seams are located approximately 150 feet below the surface and will be accessed with proven room and pillar mining techniques.
Morning people. Let's see what today brings us.
any news from this?
I would have them by the 4th just to be safe from the 3 day clearing rule.
Yep, news needs to sink a bit.
:) - See how tomorrow goes but looking for 5.50 - 6.00
agreed, not very often you see a spin off with free trading shres. Normally the darned things are restricted for 1 or more years resulting in garbage shares in your account. Says a lot IMO.
Man, that's some nice bouncing in our siggy LOL.
How about those free shares here, I understand them the be free trading to boot!!!!
Petroleum Consolidators Announces Intent to Spinoff a Wholly Owned Subsidiary
On Tuesday June 2, 2009, 9:00 am EDT
Related:Petroleum Consolidators of America, Inc.
PALM BEACH GARDENS, FL--(MARKET WIRE)--Jun 2, 2009 -- Petroleum Consolidators of America, Inc. (Other OTC:PCAI.PK - News), a gasoline station/convenience store consolidator, is pleased to announce its intention to spinoff Pioneer Realty Group, Inc., its wholly owned subsidiary, to its shareholders of record on June 10, 2009. Shareholders of record on such date will receive a pro rata distribution of one share in Pioneer Realty Group, Inc. for every fourteen shares they own of PCAI as of June 10, 2009. Fractional shares will not be issued, as they will be rounded up to equal a whole share.
Related Quotes
Symbol Price Change
PCAI.PK 0.06 0.00
{"s" : "pcai.pk","k" : "c10,l10,p20,t10","o" : "","j" : ""} Petroleum Consolidators President & CEO David Cohen stated, "Our decision to spinoff Pioneer Realty Group, Inc. should help us continue to pursue our strategy of building a diverse portfolio of retail gasoline facilities and a wholesale fuel distribution business. We are confident that separating these companies should allow Petroleum Consolidators to maximize shareholder value from its potential merger based on its non-binding letter of intent with an Indiana based mining company."
About Petroleum Consolidators of America.
Petroleum Consolidators of America, Inc. is a gasoline station/convenience store operator which is implementing a targeted acquisition strategy to create a portfolio of consolidated retail gasoline facilities, producing oil wells and a wholesale fuel distributorship that will benefit from substantial operating efficiencies.
Safe Harbor
This release contains various forward-looking statements within the meaning of Section 27A of the Securities Act of 1933, as amended and Section 21E of the Securities Exchange Act of 1934, as amended which represent the company's expectations or beliefs concerning future events of the company's financial performance. These forward-looking statements are further qualified by important factors that could cause actual results to differ materially from those in the forward-looking statements. The words "may," "could," "should," "believe," "anticipate," "estimate," "expect," "intend," "plan" and similar words are intended to identify forward-looking statements. These forward-looking statements are based on the Company's current plans and expectations and involve a number of risks and uncertainties that could cause actual results and events to vary materially from the results and events anticipated or implied by such forward-looking statements. Any number of factors could affect actual results and events, including, without limitation: the ability of the Company to take advantage of expected synergies in connection with acquisitions; the actual operating results of stores and / or properties acquired; the ability of the Company to integrate acquisitions into its operations; fluctuations in domestic and global petroleum, coal and gasoline markets; changes in the competitive landscape of the coal industry, convenience store industry, including gasoline stations and other non-traditional retailers located in the Company's markets; the effect of national and regional economic conditions on the convenience store industry and the markets we serve; the effect of regional weather conditions on customer traffic; financial difficulties of suppliers, including our principal suppliers of gas and merchandise, and their ability to continue to supply our stores; environmental risks associated with selling petroleum products; governmental regulations, including those regulating the environment; and acts of war or terrorist activity. Results actually achieved may differ materially from expected results included in these statements. The Company is under no obligation to, and expressly disclaims any such obligation to, update or alter its forward-looking statements, whether as a result of new information, future events or otherwise. Furthermore, the Company cautions that the risk factors listed in this paragraph are not exhaustive.
Contact:
Contact:
David Cohen
President & CEO
Petroleum Consolidators of America, Inc.
(561) 483-4440
Email Contact
http://www.petroleumconsolidators.com
You got that right.
PCAI - May be time to start accumulating this one the merger completion in Aug.
"Based on our initial discussions, current analysis and the geological report, dated April 28, 2009, which was written by an independent third party, we have ascertained that this merger candidate controls significant assets in the form of a mining reserve, that is conservatively valued in excess of $100,000,000 (one hundred million dollars) based on current market prices.