


Thursday, June 04, 2009 9:31:07 AM
PCAI DD
General Company overview
CEO David Cohen personally Owns over 23% of outstanding shares.
AS 500 million
OS : 35,580,340
Float : 3.5 million
Generate over $90 million is sales revenues with net profitability at a minimum of 3 percent.
Attain store revenues between $2.0 to $3.5 million per store annually
Ramp up to pumping a minimum of three million gallons of gasoline per month
Implement cost effective, centralized real-time remote sales and financial management reporting and security systems and accountability.
After a store is acquired and re-engineered to the specification of the parent, a landlord-leasing distribution program will be implemented
Ramp up acquisitions with one (1) new store monthly, ten (10) annually, totaling twenty (20) over the period a two-year period and thirty (30) within three years.
Company Pursues $400 Billion Industry
The Company began generating revenue in the $400 Billion Industry in 2006 through acquisitions during the second quater of 2007 and ended that year with revenue of $4.26 million!
Potential acquisitions candidates must have the potential to pump 1,200,000 gallons of gasoline annually with in-store item sales potential to exceed of $420,000 annually!
Focus on identifying unique high growth geo graphical areas with C-store locations that will achieve fast operational breakeven costs/revenues and with a much higher than average return on investment.
PCAI's centralized operation, purchasing and distribution strategies reduces overhead, increases quality control & improves profitability
Announced that it is focused on reaching its objective to acquire 50-60 stations over the next three years starting in 2009. Unlike other industries, the distressed economy has increased the number of targeted revenue-producing locations which, in turn, leads to an opportunistic market.
Anticipated Sales Streams
Sales Steam #1 - Retailer of Gasoline Stations
As a retailer to consumers in the gasoline / C-store channel and as a Jobber to its gasoline / C-store operators, distributing gasoline to its network of company owned stores and operator-leased facilities.
PCAI has target market demographics focused from South Florida north through Jacksonville that target mom and pop C-stores, distress sales or previously operated locations. Sound financial leverage will be used acquire sites. Market research indicates that motorists are primarily concerned with the big four: (1) quality, (2) convenience, (3) safety, and (4) cleanliness.
PCAI Retail Concept Model Includes:
Are located along busy roads, in densly populated suburban neighborhoods
Re-branding program using major branded gasoline
Transitioning the store from a "stop" to a "destination" to increase in-store sales
Multi-cultural pre-packaged product offerings based on the surrounding cultural demographics of the community
Re-branding and re-merchandising to provide an image in which the C-store evolves into a motorist destination, rather that just a one time or occasional stop for drivers and neighborhood pedestrians alike.
Sales Stream #2 - Wholesaler of Gasoline
As a general rule, Jobber-operated stations use gasoline supplied by a major oil company, which is delivered to the gasoline terminal at rack pricing. The jobber has the responsiblity of delivering the gasoline to the retail stations and independently sets the wholesale cost over rack pricing paid by the operator.
PCAI's wholesale jobber contracts for branded and/or unbranded gasoline sold through its distribution network will add net income of $0.04 per gallon (comprised of $0.02 over rack pricing plus $0.02 volume rebate from varied oil companies). Example: 6 million gallons annually would add another $240,000.00 profi directly to the bottom line.
Began generating revenue through acquisitions during the second quarter of 2007 and ended that year with revenue of $4.26 million.
Gas Staion Industry Info
On April 28, 2008 the Energy Information Agency released offical energy statistics from the federal government. In 2007, domestic crude oil output averaged 5.1 million bbl/d, unchanged from 2006 (U.S. Crude Oil Production), and is projected to decline only slightly in 2008. In 2009, however, production is projected to grow by 3.9 percent, or about 200,000 bbl/d (barrels per day), mainly because of the start-up of the Thunder Horse and Tahiti platforms in the Gulf of Mexico.
Total petroleum consumption of liquid gasoline and other petroleum products averaged 20.7 million bbl/d in 2007, essentially unchanged from 2006 (U.S. Petroleum Products Consumption Growth). Based on the projections of weak economic growth and record high crude oil and product prices, consumption of liquid gasoline and other petroleum products is projected to decline by 90,000 bbl/d in 2008 - a sharp reversal from the 40,000 bbl/d increase projected in the previous outlook - then increase by 200,000 bbl/d in 2009. After accounting for projected increases in domestic ethanol production, U.S. petroleum consumption is projected to fall by 210,000 bbl/d this year. Gasoline consumption is projected to shrink by 0.2 percent in 2008 before rising by 1.5 percent in 2009.
There were 164,292 total retail-gasoline sites in the United States in 2007. This is a steep and steady decline since 1994, when the station count topped 202,800 sites. (Source: National Petroleum New's Market Facts 2007)., As of December 31,2006 there were 115,157
C-stores selling motor gasoline in the United States. This represents 79 percent of the 146,294 current C-stores in operation across the United States.
Merger with INdiana Coal Company Info
"Based on our initial discussions, current analysis and the geological report, dated April 28, 2009, which was written by an independent third party, we have ascertained that this merger candidate controls significant assets in the form of a mining reserve, that is conservatively valued in excess of $100,000,000 (one hundred million dollars) based on current market prices.
The private resource company with proven reserves of approximately 5,000,000 tons of low sulfur high BTU coal and approximately 15,500,000 tons of inferred coal deposits is located in the Illinois coal basin. The shallow coal seams are located approximately 150 feet below the surface and will be accessed with proven room and pillar mining techniques. The permitting process is in the last stages and is expected to be approved in the fall of 2009. Additional drilling programs are presently in progress to change the status of inferred reserves to proven reserves.
Misc Coal Mining info
The Quarterly Coal Report (QCR) provides detailed quarterly data on U.S. coal production, distribution, exports, imports, receipts, prices, consumption, stocks, synfuel, and quality. Data on US. coke production, distribution, exports, imports, and consumption are also provided. This edition contains revised data for the previous quarters.
Highlights for the 4th Quarter of 2008:
Production grew slightly to 299.4 million short tons, a new record for a single quarter.
Consumption decreased by 9.7 percent to 270.4 million short tons.
Exports increased by 9.7 percent to 22.3 million short tons and accounted for 7.5 percent of total coal production.
Imports rose by 7.3 percent to 9.1 million short tons, the third highest level in the U.S. history.
Stocks increased by 12.0 percent to 171.9 million short tons, the highest fourth quarter level since 1987
http://www.eia.doe.gov/cneaf/coal/quarterly/qcr_sum.html
US Production
U.S. coal production grew in 2008 by 2.2 percent to reach a record level of 1,171.5 million short tons (Figure 1 and (Table 1), 24.8 million short tons more than the 2007 production total. Although total U.S. coal production was higher in 2008, only two of the three coal-producing regions had increases in coal production while the other was about level. Exclusive of refuse production, the Appalachian and Western Regions had an increase in their production levels in 2008 of 3.2 percent and 2.0 percent respectively, while the Interior Region remained essentially unchanged (Figure 2 and (Table 2). In the amount of tons of coal produced, the increase in the Appalachian Region production was 12.0 million short tons, while the increase in the Western Region production in 2008 was 12.6 million short tons. Coal production in the Interior Region increased by only 57 thousand short tons.
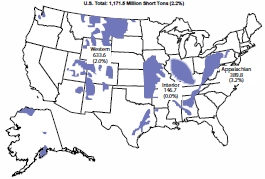
Figure 1. Coal Production by
Coal-Producing Region, 2008
Regional Totals do not include refuse recovery Figure 2. Coal Production by Region, 1999-2008
(Million Short Tons)
Regional Totals do not include refuse recovery
Table 2. U.S. Coal Production by Coal-Producing Region and State, 2004 - 2008
(Million Short Tons)
Coal-Producing Region and State 2004 2005 2006 2007 2008 Percent Change
2007 - 2008
Appalachia Total 389.9 396.7 391.2 377.8 389.8 3.2
Alabama 22.3 21.3 18.8 19.3 20.6 6.6
Kentucky, Eastern 90.9 93.3 93.6 87.1 89.9 3.2
Maryland 5.2 5.2 5.1 2.3 2.8 22.0
Ohio 23.2 24.7 22.7 22.6 26.3 16.3
Pennsylvania Total 66.0 67.5 66.0 65.0 65.3 0.4
Anthracite 1.7 1.6 1.5 1.6 1.7 8.7
Bituminous 64.3 65.8 64.5 63.5 63.6 0.2
Tennessee 2.9 3.2 2.8 2.7 2.3 -12.0
Virginia 31.4 27.7 29.7 25.3 24.6 -3.0
West Virginia Total 148.0 153.6 152.4 153.5 158.0 2.9
Northern 40.6 42.6 42.4 42.2 40.9 -3.1
Southern 107.3 111.0 110.0 111.3 117.1 5.2
Interior Total 146.0 149.2 151.4 146.7 146.7 0.0
Arkansas * * * 0.1 0.1 -16.3
Illinois 31.9 32.0 32.7 32.4 33.0 1.6
Indiana 35.1 34.5 35.1 35.0 36.2 3.3
Kansas 0.1 0.2 0.4 0.4 0.2 -45.5
Kentucky, Western 23.4 26.4 27.2 28.2 30.0 6.3
Louisiana 3.8 4.2 4.1 3.1 3.8 22.9
Mississippi 3.6 3.6 3.8 3.5 2.8 -19.9
Missouri 0.6 0.6 0.4 0.2 0.2 4.6
Oklahoma 1.8 1.9 2.0 1.6 1.4 -17.7
Texas 45.9 45.9 45.5 41.9 39.0 -7.0
Western Total 575.2 585.0 619.4 621.0 633.6 2.0
Alaska 1.5 1.5 1.4 1.3 1.5 11.6
Arizona 12.7 12.1 8.2 8.0 8.0 0.5
Colorado 39.9 38.5 36.3 36.4 32.0 -12.0
Montana 40.0 40.4 41.8 43.4 44.8 3.2
New Mexico 27.2 28.5 25.9 24.5 25.6 4.9
North Dakota 29.9 30.0 30.4 29.6 29.6 0.1
Utah 21.7 24.5 26.0 24.3 24.4 0.2
Washington 5.7 5.3 2.6 - - 0.0
Wyoming 396.5 404.3 446.7 453.6 467.6 3.1
Refuse Recovery 1.0 0.7 0.8 1.2 1.4 17.9
U.S. Total 1,112.1 1,131.5 1,162.7 1,146.6 1,171.5 2.2
* Less than 50 thousand short tons.
Source: Energy Information Administration, Annual Coal Report 2005, DOE/EIA-0584(2005)(Washington, DC, October 2006); Energy Information Administration, Annual Coal Report 2007, DOE/EIA-0584(2007)(Washington, DC, January 2009); and Quarterly Coal Report, October-December 2008, DOE/EIA-0121(2008/Q4)(Washington, DC, March 2009).
Appalachian Region
Coal production in the Appalachian Region reversed a two-year declining trend and ended 2008 at 389.8 million short tons, an increase of 3.2 percent, or 12.0 million short tons. The growth in 2008 in coal production in the Appalachian Region was primarily driven by the large increase in U.S. coal exports, which are predominantly produced in this region. International demand for metallurgical coal, which is primarily produced in the central and southern portions of the Appalachian Region, helped to push several of the States to higher production totals for the year. Four of the States in the Appalachian Region (Alabama, East Kentucky, Ohio, and West Virginia) had an increase of over a million short tons in 2008, more than offsetting the two States (Tennessee and Virginia) that had a decline in production for the year.
West Virginia, the largest coal-producing State in the Appalachian Region and the second largest in the U.S., had an increase in total coal production of 2.9 percent in 2008 to end the year with 158.0 million short tons of production, 4.5 million short tons above the 2007 level. Even though there were large declines in production at several mines in the state due to either production related issues or the idling or suspension of production totaling a combined drop of 5.1 million short tons, the increases in production at existing mines or the start-up of new mines more than offset the those decreases. The idling or suspension of production by Massey Energy’s No. 130 and Laurel Creek mines, Patriot Coal’s Europa mine, and Appalachian Fuels Big Creek No. 2 surface mine accounted for 2.7 million short tons of the decrease while production issues [movement of longwalls, geological impairments, or equipment issues] at ANR’s Alma mine, Patriot Coal’s Samples mine, Massey Energy’s Black Castle mine, and Frasure Creek’s Mine No. 7 accounted for 2.4 million short tons of the decrease. Major increases in coal production of at least 0.5 million short tons in 2008 experienced by Arch Coal’s Mountaineer II mine, Massey Energy’s Republic mine, Brody Mining’s Mine No. 1, Cleveland-Cliff’s Pinnacle mine, Eagle Creek Mining’s MT-11 Surface mine, Hanover Resources’ Four Mile Mine No. 2, and Patriot Coal’s American Eagle mine added over 6.7 million short tons to West Virginia’s total.
Coal production in Ohio in 2008 increased by 3.7 million short tons, or 16.3 percent to end the year at 26.3 million short tons, the highest level in a decade. The increase in production was primarily a result of higher production levels at four mines in the State. Ohio American Energy’s Salt Run mine had an increase of 1.4 million short tons in 2008, its first full year of production. Ohio Valley Coal’s Powhatan No. 6 mine had an increase of 1.2 million short tons in 2008, while Buckingham Coal’s Mine No. 6 had an increase of 0.6 million short tons and Oxford Mining’s Snyder mine had an increase of 0.5 million short tons.
Eastern Kentucky produced 89.9 million short tons of coal in 2008, an increase of 3.2 percent or 2.8 million short tons above the 2007 level. Although there were 16 mines in Eastern Kentucky that had a 2008 production increase of at least a quarter-of-a-million short tons, there were also 16 mines that had a production decrease of at least a quarter-of-a-million short tons. The primary reason that total coal production in Eastern Kentucky was higher for the year was the fact that there were 141 mines that had production that were either new in 2008 or did not produce coal in 2007 and these mines accounted for 9.1 million short tons, more than enough to offset the 90 mines that had produced coal in 2007 but were either closed or idled for 2008.
Coal production in Alabama in 2008 totaled 20.6 million short tons, 6.6 percent higher than the 2007 level. Although production levels decreased at several mines in the State, with the largest being a drop of 0.5 million short tons of Twin Pines Coal Company’s Mine No. 2 which suspended production after the first quarter of the year, increases in coal production by several other mines along with production from six new mines resulted in a coal production level that was just slightly below the 2005 level. The largest portion of the 1.3 million short ton increase for 2008 was due to the increase in coal production by Drummond Company’s Shoal Creek mine, which produced 2.1 million short tons, 0.8 million short tons more than it produced in 2007.
Pennsylvania produced 65.3 million short tons, an increase of 0.4 percent from 2007 or 0.3 million short tons. Coal production in Maryland in 2008 totaled 2.8 million short tons, an increase of 0.5 million short tons. Tennessee, one of the two States in the Appalachian Region to have a decrease in production in 2008, produced a total of 2.3 million short tons, down by 0.3 million short tons. Coal production in Virginia decreased in 2008 by 0.8 million short tons to a total of 24.6 million short tons, a decline of 3.0 percent. The decrease in coal production in Virginia was primarily a result of the abandonment of Paramount Coal’s Lovers Gap No. 2 mine and Exeter Coal’s Mine No. 1, combined with the suspension of production at Arch Coal’s Pardee mine in the latter half of 2007.
Interior Region
Coal production in the Interior Region in 2008 was 146.7 million short tons, comparable to the 2007 production level. While the total coal production for the region was basically unchanged, that was not the case when it came to the respective States’ production levels in 2008. Three of the four largest coal-producing States (Indiana, West Kentucky, and Texas) in the region had major changes in their production levels in 2008 when compared to 2007. Texas, the largest coal-producing State in the region, had a decrease in coal production of 2.9 million short tons to end the year at 39.0 million short tons, a level not seen since 1983. Texas coal is lignite, the lowest rank of coal with the lowest amount of energy (or Btus) and the vast majority of the coal is used in the electric power sector, primarily at mine-mouth facilities. The amount of Texas-produced lignite consumed by the electric power sector in the State dropped by 7.9 percent while the total amount of coal consumed in the electric power sector in Texas declined only slightly, by 1.3 percent. The discrepancy is due to the fact that the amount of subbituminous coal consumed for power production increased by 4.3 percent. Declines in coal production by three Texas mines accounted for most drop in 2008 production. The three mines are Luminant Mining’s Beckville Strip, Winfield South Strip, and Big Brown Strip down by 1.1, 0.7, and 0.6 million short tons, respectively.
Western Kentucky had the largest increase in coal production in the Interior Region in 2008, increasing by 1.8 million short tons to reach a total of 30.0 million short tons. This is the fourth year in a row that Western Kentucky experienced growth in coal production and the 2008 increase of 6.3 percent was primarily a result of the growth in production by one mine and the opening of a new mine in the second quarter of the year. The increase of 1.4 million short tons experienced by Hopkins County Coal’s Elk Creek mine and the opening of Armstrong Coal’s Midway mine which produced 0.8 million short tons in 2008 more than offset the production declines experienced by several other mines during the year.
Indiana produced a total of 36.2 million short tons in 2008, an increase of 3.3 percent, or 1.2 million short tons. Although there was a decrease of 0.5 million short tons by United Minerals’ Somerville East mine, an increase in production of 0.9 million short tons by Sunrise Coal’s Carlisle mine and an increase of 0.6 million short tons by both Gibson County Coal’s Gibson mine and Black Beauty Coal’s Francisco mine lead to Indiana’s highest production level since 2001. Illinois is the other major coal-producing State in the Interior Region, and it had an increase of 1.6 percent to end the year at a total of 33.0 million short tons. The other States in the Interior Region (Arkansas, Kansas, Louisiana, Mississippi, Missouri, and Oklahoma), which together produced 8.4 million short tons of coal, accounted for a total of 5.7 percent of the entire region’s production in 2008. Of these States, only Louisiana and Missouri had increases in their coal production from their prior year levels.
Western Region
The Western Region is the largest coal-producing region in the U.S., and in 2008 coal production rose by 2.0 percent to reach a total of 633.6 million short tons, 54 percent of total U.S. production for the year. The increase of 12.6 million short tons resulted in another record level for the region, the fifth year in a row. Although there was a record level of coal production in 2008, one State in the Western Region (Colorado) had a lower production level than the previous year.
Wyoming, the largest coal-producing State in the nation, a position it has held for two decades, continues to dominate the U.S. coal production picture. In 2008, Wyoming produced 467.6 million short tons of coal, an increase of 3.1 percent, or 14.1 million short tons for the year, another record year. Wyoming has dominated U.S. coal production since 1995 when it first accounted for more than one-quarter of total U.S. production. Examples of how much Wyoming dominates the U.S. coal supply include that for 2008, it accounted for 73.8 percent of the Western Region production total; was 77.8 million short tons more than the entire Appalachian Region; was more than three times the Interior Region; and was almost 40 percent of the total U.S. coal production for the year. Also, if all of the coal-producing States in 2008 were ranked by descending total production levels, Wyoming produced more than the next six largest coal-producing States (West Virginia, Kentucky, Pennsylvania, Montana, Texas, and Indiana), besting their combined production by 4.5 million short tons. Wyoming also produced 261.3 million short tons more coal than the summation of the States ranked 8th through 25th. Although seven of the twenty mines in Wyoming had decreases in coal production in 2008, the increased production levels at the rest of the mines pushed the state to a new record level for the year. Peabody’s North Antelope Rochelle mine was again the largest coal mine in Wyoming and the U.S. in 2008, producing a total of 97.6 million short tons, an increase of 6.1 million short tons or 6.6 percent. This one mine produced more coal than the combined total of the other coal-producing States ranked 13th through 25th in 2008. Although there were increases of over 2 million short tons experienced by three other mines in Wyoming, one mine, Foundation Coal’s Eagle Butte mine, had a decrease in production of 4.5 million short tons, a decline of 18.2 percent, to end the year at 20.4 million short tons.
In 2008, Montana, the second largest coal-producing State in the Western Region, produced a total of 44.8 million short tons, an increase of 3.2 percent. Although there were decreases in production at half of the six mines in the State, the increase in coal production at Spring Creek Coal’s Spring Creek mine of 2.2 million short tons in 2008 to reach a total of 17.9 million short tons, more than offset the declines. Colorado, the third largest coal-producing State in the Western Region, was the only State in the region to have a decrease in coal production for 2008. Colorado ended the year with a total of 32.0 million short tons, a decline of 12.0 percent, or 4.4 million short tons. Although eight of the twelve mines in the State had lower coal production in 2008, the majority of the decrease in Colorado’s total production was accounted for by two mines. Bowie Resources’ Bowie No. 2 mine had a decrease of 2.6 million short tons to end the year at 2.9 million short tons, and Arch Coal’s West Elk mine had a decrease of 1.0 million short tons to end the year at 5.9 million short tons. Both of these are underground longwall mines and they experienced production problems relating to geologic faults that impacted production due to relocating the longwall mining systems.
Total coal production in the other States in the Western Region (Alaska, Arizona, New Mexico, North Dakota, and Utah) had increases in their respective production levels in 2008. The increases ranged in percentages from a low of 0.1 percent in North Dakota to a high of 11.6 percent in Alaska, while the tonnage increases ranged from a low of 21 thousand short tons in North Dakota to a high of 1.2 million short tons in New Mexico.
General Company overview
CEO David Cohen personally Owns over 23% of outstanding shares.
AS 500 million
OS : 35,580,340
Float : 3.5 million
Generate over $90 million is sales revenues with net profitability at a minimum of 3 percent.
Attain store revenues between $2.0 to $3.5 million per store annually
Ramp up to pumping a minimum of three million gallons of gasoline per month
Implement cost effective, centralized real-time remote sales and financial management reporting and security systems and accountability.
After a store is acquired and re-engineered to the specification of the parent, a landlord-leasing distribution program will be implemented
Ramp up acquisitions with one (1) new store monthly, ten (10) annually, totaling twenty (20) over the period a two-year period and thirty (30) within three years.
Company Pursues $400 Billion Industry
The Company began generating revenue in the $400 Billion Industry in 2006 through acquisitions during the second quater of 2007 and ended that year with revenue of $4.26 million!
Potential acquisitions candidates must have the potential to pump 1,200,000 gallons of gasoline annually with in-store item sales potential to exceed of $420,000 annually!
Focus on identifying unique high growth geo graphical areas with C-store locations that will achieve fast operational breakeven costs/revenues and with a much higher than average return on investment.
PCAI's centralized operation, purchasing and distribution strategies reduces overhead, increases quality control & improves profitability
Announced that it is focused on reaching its objective to acquire 50-60 stations over the next three years starting in 2009. Unlike other industries, the distressed economy has increased the number of targeted revenue-producing locations which, in turn, leads to an opportunistic market.
Anticipated Sales Streams
Sales Steam #1 - Retailer of Gasoline Stations
As a retailer to consumers in the gasoline / C-store channel and as a Jobber to its gasoline / C-store operators, distributing gasoline to its network of company owned stores and operator-leased facilities.
PCAI has target market demographics focused from South Florida north through Jacksonville that target mom and pop C-stores, distress sales or previously operated locations. Sound financial leverage will be used acquire sites. Market research indicates that motorists are primarily concerned with the big four: (1) quality, (2) convenience, (3) safety, and (4) cleanliness.
PCAI Retail Concept Model Includes:
Are located along busy roads, in densly populated suburban neighborhoods
Re-branding program using major branded gasoline
Transitioning the store from a "stop" to a "destination" to increase in-store sales
Multi-cultural pre-packaged product offerings based on the surrounding cultural demographics of the community
Re-branding and re-merchandising to provide an image in which the C-store evolves into a motorist destination, rather that just a one time or occasional stop for drivers and neighborhood pedestrians alike.
Sales Stream #2 - Wholesaler of Gasoline
As a general rule, Jobber-operated stations use gasoline supplied by a major oil company, which is delivered to the gasoline terminal at rack pricing. The jobber has the responsiblity of delivering the gasoline to the retail stations and independently sets the wholesale cost over rack pricing paid by the operator.
PCAI's wholesale jobber contracts for branded and/or unbranded gasoline sold through its distribution network will add net income of $0.04 per gallon (comprised of $0.02 over rack pricing plus $0.02 volume rebate from varied oil companies). Example: 6 million gallons annually would add another $240,000.00 profi directly to the bottom line.
Began generating revenue through acquisitions during the second quarter of 2007 and ended that year with revenue of $4.26 million.
Gas Staion Industry Info
On April 28, 2008 the Energy Information Agency released offical energy statistics from the federal government. In 2007, domestic crude oil output averaged 5.1 million bbl/d, unchanged from 2006 (U.S. Crude Oil Production), and is projected to decline only slightly in 2008. In 2009, however, production is projected to grow by 3.9 percent, or about 200,000 bbl/d (barrels per day), mainly because of the start-up of the Thunder Horse and Tahiti platforms in the Gulf of Mexico.
Total petroleum consumption of liquid gasoline and other petroleum products averaged 20.7 million bbl/d in 2007, essentially unchanged from 2006 (U.S. Petroleum Products Consumption Growth). Based on the projections of weak economic growth and record high crude oil and product prices, consumption of liquid gasoline and other petroleum products is projected to decline by 90,000 bbl/d in 2008 - a sharp reversal from the 40,000 bbl/d increase projected in the previous outlook - then increase by 200,000 bbl/d in 2009. After accounting for projected increases in domestic ethanol production, U.S. petroleum consumption is projected to fall by 210,000 bbl/d this year. Gasoline consumption is projected to shrink by 0.2 percent in 2008 before rising by 1.5 percent in 2009.
There were 164,292 total retail-gasoline sites in the United States in 2007. This is a steep and steady decline since 1994, when the station count topped 202,800 sites. (Source: National Petroleum New's Market Facts 2007)., As of December 31,2006 there were 115,157
C-stores selling motor gasoline in the United States. This represents 79 percent of the 146,294 current C-stores in operation across the United States.
Merger with INdiana Coal Company Info
"Based on our initial discussions, current analysis and the geological report, dated April 28, 2009, which was written by an independent third party, we have ascertained that this merger candidate controls significant assets in the form of a mining reserve, that is conservatively valued in excess of $100,000,000 (one hundred million dollars) based on current market prices.
The private resource company with proven reserves of approximately 5,000,000 tons of low sulfur high BTU coal and approximately 15,500,000 tons of inferred coal deposits is located in the Illinois coal basin. The shallow coal seams are located approximately 150 feet below the surface and will be accessed with proven room and pillar mining techniques. The permitting process is in the last stages and is expected to be approved in the fall of 2009. Additional drilling programs are presently in progress to change the status of inferred reserves to proven reserves.
Misc Coal Mining info
The Quarterly Coal Report (QCR) provides detailed quarterly data on U.S. coal production, distribution, exports, imports, receipts, prices, consumption, stocks, synfuel, and quality. Data on US. coke production, distribution, exports, imports, and consumption are also provided. This edition contains revised data for the previous quarters.
Highlights for the 4th Quarter of 2008:
Production grew slightly to 299.4 million short tons, a new record for a single quarter.
Consumption decreased by 9.7 percent to 270.4 million short tons.
Exports increased by 9.7 percent to 22.3 million short tons and accounted for 7.5 percent of total coal production.
Imports rose by 7.3 percent to 9.1 million short tons, the third highest level in the U.S. history.
Stocks increased by 12.0 percent to 171.9 million short tons, the highest fourth quarter level since 1987
http://www.eia.doe.gov/cneaf/coal/quarterly/qcr_sum.html
US Production
U.S. coal production grew in 2008 by 2.2 percent to reach a record level of 1,171.5 million short tons (Figure 1 and (Table 1), 24.8 million short tons more than the 2007 production total. Although total U.S. coal production was higher in 2008, only two of the three coal-producing regions had increases in coal production while the other was about level. Exclusive of refuse production, the Appalachian and Western Regions had an increase in their production levels in 2008 of 3.2 percent and 2.0 percent respectively, while the Interior Region remained essentially unchanged (Figure 2 and (Table 2). In the amount of tons of coal produced, the increase in the Appalachian Region production was 12.0 million short tons, while the increase in the Western Region production in 2008 was 12.6 million short tons. Coal production in the Interior Region increased by only 57 thousand short tons.
Figure 1. Coal Production by
Coal-Producing Region, 2008
Regional Totals do not include refuse recovery Figure 2. Coal Production by Region, 1999-2008
(Million Short Tons)
Regional Totals do not include refuse recovery
Table 2. U.S. Coal Production by Coal-Producing Region and State, 2004 - 2008
(Million Short Tons)
Coal-Producing Region and State 2004 2005 2006 2007 2008 Percent Change
2007 - 2008
Appalachia Total 389.9 396.7 391.2 377.8 389.8 3.2
Alabama 22.3 21.3 18.8 19.3 20.6 6.6
Kentucky, Eastern 90.9 93.3 93.6 87.1 89.9 3.2
Maryland 5.2 5.2 5.1 2.3 2.8 22.0
Ohio 23.2 24.7 22.7 22.6 26.3 16.3
Pennsylvania Total 66.0 67.5 66.0 65.0 65.3 0.4
Anthracite 1.7 1.6 1.5 1.6 1.7 8.7
Bituminous 64.3 65.8 64.5 63.5 63.6 0.2
Tennessee 2.9 3.2 2.8 2.7 2.3 -12.0
Virginia 31.4 27.7 29.7 25.3 24.6 -3.0
West Virginia Total 148.0 153.6 152.4 153.5 158.0 2.9
Northern 40.6 42.6 42.4 42.2 40.9 -3.1
Southern 107.3 111.0 110.0 111.3 117.1 5.2
Interior Total 146.0 149.2 151.4 146.7 146.7 0.0
Arkansas * * * 0.1 0.1 -16.3
Illinois 31.9 32.0 32.7 32.4 33.0 1.6
Indiana 35.1 34.5 35.1 35.0 36.2 3.3
Kansas 0.1 0.2 0.4 0.4 0.2 -45.5
Kentucky, Western 23.4 26.4 27.2 28.2 30.0 6.3
Louisiana 3.8 4.2 4.1 3.1 3.8 22.9
Mississippi 3.6 3.6 3.8 3.5 2.8 -19.9
Missouri 0.6 0.6 0.4 0.2 0.2 4.6
Oklahoma 1.8 1.9 2.0 1.6 1.4 -17.7
Texas 45.9 45.9 45.5 41.9 39.0 -7.0
Western Total 575.2 585.0 619.4 621.0 633.6 2.0
Alaska 1.5 1.5 1.4 1.3 1.5 11.6
Arizona 12.7 12.1 8.2 8.0 8.0 0.5
Colorado 39.9 38.5 36.3 36.4 32.0 -12.0
Montana 40.0 40.4 41.8 43.4 44.8 3.2
New Mexico 27.2 28.5 25.9 24.5 25.6 4.9
North Dakota 29.9 30.0 30.4 29.6 29.6 0.1
Utah 21.7 24.5 26.0 24.3 24.4 0.2
Washington 5.7 5.3 2.6 - - 0.0
Wyoming 396.5 404.3 446.7 453.6 467.6 3.1
Refuse Recovery 1.0 0.7 0.8 1.2 1.4 17.9
U.S. Total 1,112.1 1,131.5 1,162.7 1,146.6 1,171.5 2.2
* Less than 50 thousand short tons.
Source: Energy Information Administration, Annual Coal Report 2005, DOE/EIA-0584(2005)(Washington, DC, October 2006); Energy Information Administration, Annual Coal Report 2007, DOE/EIA-0584(2007)(Washington, DC, January 2009); and Quarterly Coal Report, October-December 2008, DOE/EIA-0121(2008/Q4)(Washington, DC, March 2009).
Appalachian Region
Coal production in the Appalachian Region reversed a two-year declining trend and ended 2008 at 389.8 million short tons, an increase of 3.2 percent, or 12.0 million short tons. The growth in 2008 in coal production in the Appalachian Region was primarily driven by the large increase in U.S. coal exports, which are predominantly produced in this region. International demand for metallurgical coal, which is primarily produced in the central and southern portions of the Appalachian Region, helped to push several of the States to higher production totals for the year. Four of the States in the Appalachian Region (Alabama, East Kentucky, Ohio, and West Virginia) had an increase of over a million short tons in 2008, more than offsetting the two States (Tennessee and Virginia) that had a decline in production for the year.
West Virginia, the largest coal-producing State in the Appalachian Region and the second largest in the U.S., had an increase in total coal production of 2.9 percent in 2008 to end the year with 158.0 million short tons of production, 4.5 million short tons above the 2007 level. Even though there were large declines in production at several mines in the state due to either production related issues or the idling or suspension of production totaling a combined drop of 5.1 million short tons, the increases in production at existing mines or the start-up of new mines more than offset the those decreases. The idling or suspension of production by Massey Energy’s No. 130 and Laurel Creek mines, Patriot Coal’s Europa mine, and Appalachian Fuels Big Creek No. 2 surface mine accounted for 2.7 million short tons of the decrease while production issues [movement of longwalls, geological impairments, or equipment issues] at ANR’s Alma mine, Patriot Coal’s Samples mine, Massey Energy’s Black Castle mine, and Frasure Creek’s Mine No. 7 accounted for 2.4 million short tons of the decrease. Major increases in coal production of at least 0.5 million short tons in 2008 experienced by Arch Coal’s Mountaineer II mine, Massey Energy’s Republic mine, Brody Mining’s Mine No. 1, Cleveland-Cliff’s Pinnacle mine, Eagle Creek Mining’s MT-11 Surface mine, Hanover Resources’ Four Mile Mine No. 2, and Patriot Coal’s American Eagle mine added over 6.7 million short tons to West Virginia’s total.
Coal production in Ohio in 2008 increased by 3.7 million short tons, or 16.3 percent to end the year at 26.3 million short tons, the highest level in a decade. The increase in production was primarily a result of higher production levels at four mines in the State. Ohio American Energy’s Salt Run mine had an increase of 1.4 million short tons in 2008, its first full year of production. Ohio Valley Coal’s Powhatan No. 6 mine had an increase of 1.2 million short tons in 2008, while Buckingham Coal’s Mine No. 6 had an increase of 0.6 million short tons and Oxford Mining’s Snyder mine had an increase of 0.5 million short tons.
Eastern Kentucky produced 89.9 million short tons of coal in 2008, an increase of 3.2 percent or 2.8 million short tons above the 2007 level. Although there were 16 mines in Eastern Kentucky that had a 2008 production increase of at least a quarter-of-a-million short tons, there were also 16 mines that had a production decrease of at least a quarter-of-a-million short tons. The primary reason that total coal production in Eastern Kentucky was higher for the year was the fact that there were 141 mines that had production that were either new in 2008 or did not produce coal in 2007 and these mines accounted for 9.1 million short tons, more than enough to offset the 90 mines that had produced coal in 2007 but were either closed or idled for 2008.
Coal production in Alabama in 2008 totaled 20.6 million short tons, 6.6 percent higher than the 2007 level. Although production levels decreased at several mines in the State, with the largest being a drop of 0.5 million short tons of Twin Pines Coal Company’s Mine No. 2 which suspended production after the first quarter of the year, increases in coal production by several other mines along with production from six new mines resulted in a coal production level that was just slightly below the 2005 level. The largest portion of the 1.3 million short ton increase for 2008 was due to the increase in coal production by Drummond Company’s Shoal Creek mine, which produced 2.1 million short tons, 0.8 million short tons more than it produced in 2007.
Pennsylvania produced 65.3 million short tons, an increase of 0.4 percent from 2007 or 0.3 million short tons. Coal production in Maryland in 2008 totaled 2.8 million short tons, an increase of 0.5 million short tons. Tennessee, one of the two States in the Appalachian Region to have a decrease in production in 2008, produced a total of 2.3 million short tons, down by 0.3 million short tons. Coal production in Virginia decreased in 2008 by 0.8 million short tons to a total of 24.6 million short tons, a decline of 3.0 percent. The decrease in coal production in Virginia was primarily a result of the abandonment of Paramount Coal’s Lovers Gap No. 2 mine and Exeter Coal’s Mine No. 1, combined with the suspension of production at Arch Coal’s Pardee mine in the latter half of 2007.
Interior Region
Coal production in the Interior Region in 2008 was 146.7 million short tons, comparable to the 2007 production level. While the total coal production for the region was basically unchanged, that was not the case when it came to the respective States’ production levels in 2008. Three of the four largest coal-producing States (Indiana, West Kentucky, and Texas) in the region had major changes in their production levels in 2008 when compared to 2007. Texas, the largest coal-producing State in the region, had a decrease in coal production of 2.9 million short tons to end the year at 39.0 million short tons, a level not seen since 1983. Texas coal is lignite, the lowest rank of coal with the lowest amount of energy (or Btus) and the vast majority of the coal is used in the electric power sector, primarily at mine-mouth facilities. The amount of Texas-produced lignite consumed by the electric power sector in the State dropped by 7.9 percent while the total amount of coal consumed in the electric power sector in Texas declined only slightly, by 1.3 percent. The discrepancy is due to the fact that the amount of subbituminous coal consumed for power production increased by 4.3 percent. Declines in coal production by three Texas mines accounted for most drop in 2008 production. The three mines are Luminant Mining’s Beckville Strip, Winfield South Strip, and Big Brown Strip down by 1.1, 0.7, and 0.6 million short tons, respectively.
Western Kentucky had the largest increase in coal production in the Interior Region in 2008, increasing by 1.8 million short tons to reach a total of 30.0 million short tons. This is the fourth year in a row that Western Kentucky experienced growth in coal production and the 2008 increase of 6.3 percent was primarily a result of the growth in production by one mine and the opening of a new mine in the second quarter of the year. The increase of 1.4 million short tons experienced by Hopkins County Coal’s Elk Creek mine and the opening of Armstrong Coal’s Midway mine which produced 0.8 million short tons in 2008 more than offset the production declines experienced by several other mines during the year.
Indiana produced a total of 36.2 million short tons in 2008, an increase of 3.3 percent, or 1.2 million short tons. Although there was a decrease of 0.5 million short tons by United Minerals’ Somerville East mine, an increase in production of 0.9 million short tons by Sunrise Coal’s Carlisle mine and an increase of 0.6 million short tons by both Gibson County Coal’s Gibson mine and Black Beauty Coal’s Francisco mine lead to Indiana’s highest production level since 2001. Illinois is the other major coal-producing State in the Interior Region, and it had an increase of 1.6 percent to end the year at a total of 33.0 million short tons. The other States in the Interior Region (Arkansas, Kansas, Louisiana, Mississippi, Missouri, and Oklahoma), which together produced 8.4 million short tons of coal, accounted for a total of 5.7 percent of the entire region’s production in 2008. Of these States, only Louisiana and Missouri had increases in their coal production from their prior year levels.
Western Region
The Western Region is the largest coal-producing region in the U.S., and in 2008 coal production rose by 2.0 percent to reach a total of 633.6 million short tons, 54 percent of total U.S. production for the year. The increase of 12.6 million short tons resulted in another record level for the region, the fifth year in a row. Although there was a record level of coal production in 2008, one State in the Western Region (Colorado) had a lower production level than the previous year.
Wyoming, the largest coal-producing State in the nation, a position it has held for two decades, continues to dominate the U.S. coal production picture. In 2008, Wyoming produced 467.6 million short tons of coal, an increase of 3.1 percent, or 14.1 million short tons for the year, another record year. Wyoming has dominated U.S. coal production since 1995 when it first accounted for more than one-quarter of total U.S. production. Examples of how much Wyoming dominates the U.S. coal supply include that for 2008, it accounted for 73.8 percent of the Western Region production total; was 77.8 million short tons more than the entire Appalachian Region; was more than three times the Interior Region; and was almost 40 percent of the total U.S. coal production for the year. Also, if all of the coal-producing States in 2008 were ranked by descending total production levels, Wyoming produced more than the next six largest coal-producing States (West Virginia, Kentucky, Pennsylvania, Montana, Texas, and Indiana), besting their combined production by 4.5 million short tons. Wyoming also produced 261.3 million short tons more coal than the summation of the States ranked 8th through 25th. Although seven of the twenty mines in Wyoming had decreases in coal production in 2008, the increased production levels at the rest of the mines pushed the state to a new record level for the year. Peabody’s North Antelope Rochelle mine was again the largest coal mine in Wyoming and the U.S. in 2008, producing a total of 97.6 million short tons, an increase of 6.1 million short tons or 6.6 percent. This one mine produced more coal than the combined total of the other coal-producing States ranked 13th through 25th in 2008. Although there were increases of over 2 million short tons experienced by three other mines in Wyoming, one mine, Foundation Coal’s Eagle Butte mine, had a decrease in production of 4.5 million short tons, a decline of 18.2 percent, to end the year at 20.4 million short tons.
In 2008, Montana, the second largest coal-producing State in the Western Region, produced a total of 44.8 million short tons, an increase of 3.2 percent. Although there were decreases in production at half of the six mines in the State, the increase in coal production at Spring Creek Coal’s Spring Creek mine of 2.2 million short tons in 2008 to reach a total of 17.9 million short tons, more than offset the declines. Colorado, the third largest coal-producing State in the Western Region, was the only State in the region to have a decrease in coal production for 2008. Colorado ended the year with a total of 32.0 million short tons, a decline of 12.0 percent, or 4.4 million short tons. Although eight of the twelve mines in the State had lower coal production in 2008, the majority of the decrease in Colorado’s total production was accounted for by two mines. Bowie Resources’ Bowie No. 2 mine had a decrease of 2.6 million short tons to end the year at 2.9 million short tons, and Arch Coal’s West Elk mine had a decrease of 1.0 million short tons to end the year at 5.9 million short tons. Both of these are underground longwall mines and they experienced production problems relating to geologic faults that impacted production due to relocating the longwall mining systems.
Total coal production in the other States in the Western Region (Alaska, Arizona, New Mexico, North Dakota, and Utah) had increases in their respective production levels in 2008. The increases ranged in percentages from a low of 0.1 percent in North Dakota to a high of 11.6 percent in Alaska, while the tonnage increases ranged from a low of 21 thousand short tons in North Dakota to a high of 1.2 million short tons in New Mexico.

Join the InvestorsHub Community
Register for free to join our community of investors and share your ideas. You will also get access to streaming quotes, interactive charts, trades, portfolio, live options flow and more tools.

