 News
News  Market Data
  Discover
Support: 888-992-3836
Copyright © 2023 InvestorsHub Inc.


Seeking Creative & Innovative Investment Ideas...
EDWARD STEVENSON
![]()
Seeking Creative & Innovative Investment Ideas...
Register for free to join our community of investors and share your ideas. You will also get access to streaming quotes, interactive charts, trades, portfolio, live options flow and more tools.
Register for free to join our community of investors and share your ideas. You will also get access to streaming quotes, interactive charts, trades, portfolio, live options flow and more tools.
Seeking Creative & Innovative Investment Ideas...
FDA Calendar Updates: Transcept Pharma Surges on Deal
by: Mike Havrilla August 03, 2009
Below is a summary of updates to the BioMedReports.com FDA Calendar, which includes a database of 297 entries as of 8/3/09.. I originally created this calendar to track companies with pending new drug, biological agent, or medical device new product decisions at the FDA. With the launch of BioMedReports.com, the FDA Calendar has expanded to include the following categories: pending new submissions to the FDA (e.g. NDA, ANDA, BLA, 510k, PMA, sNDA, sBLA filings), pending complete response letter (CRL) re-submissions to the FDA, and pending late-stage clinical trial results.
On 8/2/09, Savient Pharma (NASDAQ:SVNT) announced it received a complete response letter (CRL) from the FDA for the company's Biologics License Application (BLA) seeking approval of Krystexxa (pegloticase) as a treatment for chronic gout patients who do not respond to conventional therapy. The CRL cites deficiencies with the chemistry, manufacturing and controls (CMC) section of the BLA and also provided the current draft of the proposed labeling and further guidance regarding a Risk Evaluation and Mitigation Strategy (REMS).
The company intends to immediately request a meeting with the FDA to discuss and clarify the issues raised in the complete response letter. Under FDA regulations, the company believes that this meeting is deemed a "Type A" meeting, meaning that the FDA would meet with the company within 30 days of its receipt of the meeting request. SVNT stated that it is currently targeting a resubmission for early 2010 and expects to provide more details after meeting with the FDA to discuss the CRL. Resubmissions to the Agency are designated as either Class I (60-day) or Class II (six-month) reviews.
On 8/3/09, Repros Therapeutics (NASDAQ:RPRX) announced that, in the interest of patient safety (elevation of liver enzymes), it is voluntarily suspending dosing of all patients in its clinical trials of Proellex. This decision is based on available information regarding the occurrence of clinically significant increases in liver enzymes with 50 mg and 25 mg doses of Proellex, coupled with recent input from a consulting panel of liver experts.
The company submitted a meeting request to the FDA on 7/30/09 and, in response, the Agency has proposed to change the topic of the previously scheduled End of Phase II meeting for endometriosis in late September into a discussion about the safety of Proellex and overall direction and scope of the program.The suspension of dosing will involve all ongoing clinical trials with Proellex for the treatment of chronic symptomatic uterine fibroids, anemia associated with this condition, and endometriosis.
On 8/2/09, Transcept Pharma (NASDAQ:TSPT) and privately-held Purdue Pharma announced an exclusive deal to commercialize Intermezzo (zolpidem tartrate sublingual tablet) in the U.S. Pending FDA approval, Intermezzo has the potential to be the first prescription sleep aid specifically approved for use in the middle of the night at the time a patient awakens and has difficulty returning to sleep. The PDUFA action date for the Intermezzo NDA is 10/30/09 for an expected FDA decision.
Purdue will pay TSPT near-term milestones that include an upfront cash payment of $25 million and an additional payment of up to $30 million based upon the timing of an FDA approval of Intermezzo, which approval and payment are subject to review and acceptance by Purdue. In addition, TSPT is eligible to receive up to an additional $90 million upon reaching future milestones related to achievement of intellectual property and U.S. net sales targets along with double-digit royalties ranging up to the mid-20% level on U.S. net sales.
Shares of TSPT have more than doubled since the stock was featured as an FDA Calendar Extreme Trade on 7/20/09 as one of 20 stocks below $5 with pending FDA decisions or clinical trial results.
On 8/3/09, BVX announced a 510(k) submission to the FDA seeking pre-market clearance for the company's ICON VS electrosurgical generator. The generator has been designed to work with Bovie's Seal-N-Cut line of vessel sealing instruments providing both monopolar and bipolar energy options to the surgeon. The fully digital ICON VS generator has a user friendly interface allowing the surgeon flexibility to choose the type of effect desired. The monopolar and bipolar functions satisfy a wide variety of surgical demands needed during surgeries including vessel sealing.
On 8/3/09, Keryx Biopharma (NASDAQ:KERX) announced an agreement with the FDA for a Special Protocol Assessment (SPA) on the design of a Phase 3 trial for its KRX-0401 (perifosine), in relapsed or relapsed / refractory multiple myeloma patients previously treated with bortezomib (Velcade). The SPA provides agreement that the Phase 3 study design adequately addresses objectives in support of a regulatory submission.
The study is a double-blinded, placebo-controlled trial comparing the efficacy and safety of KRX-0401 vs. placebo when combined with bortezomib and dexamethasone and will enroll about 400 patients with relapsed or relapsed / refractory multiple myeloma. The primary endpoint is progression-free survival and secondary endpoints include overall response rate, overall survival and safety. Perifosine is in-licensed by Keryx from Aeterna Zentaris (NASDAQ:AEZS) in the U.S., Canada and Mexico.
On 8/3/09, Icagen (NASDAQ:ICGN) announced that the FDA has lifted the partial clinical hold related to the development of ICA-105665, the company's novel orally available small molecule KCNQ potassium channel agonist, for the treatment of epilepsy. Accordingly, the company is planning to initiate a proof-of-concept study in patients with photosensitive epilepsy. The study measures the ability of ICA-105665 to reduce the photic-induced epileptiform EEG responses. The duration of an observed effect will also be measured over time.
A range of doses of ICA-105665 will be studied in successive cohorts, and the response observed in each cohort will determine the subsequent dose for the next cohort. The objective of the study is to determine a potential dose range to study in subsequent, more advanced clinical trials. The study is anticipated to be completed by mid-2010 but interim results may be available earlier. In addition, the company continues preparations for a proof-of-concept pain study, which is also expected to be initiated during 3Q09 with initial results expected by early 2010.
Disclosure: No positions
Six in 10 Consumers Still Rely on Newspaper Ads.
by: Marketing Charts August 03, 2009
![]()
US consumers say they rely on newspaper advertisements more than ads in any other medium when they are planning, shopping and making purchase decisions, according to early results from a study commissioned by the Newspaper Association of America, conducted by MORI Research.
Other media, including the internet, trailed newspapers by 20 percentage points as the primary medium for checking advertising, the study found.
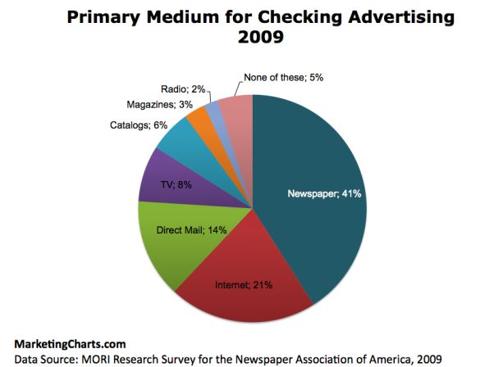
The research, part of a series entitled “American Consumer Insights,” also examined the effect newspaper advertising has on consumer shopping and spending patterns. It found that nearly six in 10 adults (59%) identify newspapers as the medium they use to help plan shopping or make purchase decisions.
Among respondents who say they “took action” as a result of newspaper advertising:
61% clipped a coupon
50% bought something
27% tried something for the first time
Data also revealed that 73% of adults regularly or occasionally read newspaper inserts, and 82% have been spurred to action by a newspaper insert in the past month.
“Newspaper advertising remains the most powerful tool for advertisers who want to motivate consumers to take action,” said NAA President and CEO John Sturm.
In contrast to the NAA’s survey findings, a recent study by Harris Interactive put newspaper ads behind TV ads as the most helpful to consumers in making purchase decisions.
About the survey: MORI Research conducted this phone and internet survey of more than 3,000 adults for the Newspaper Association of America. Findings discussed in this article represent early data from the survey. Full results will be available in the Fall of 2009.
Feds Now Accepting Applications for Solar, Wind Power.
by: Greentech Media August 03, 2009
By Ucilia Wang
The U.S. Department of Treasury said Friday it's now accepting applications for a program for renewable energy project developers who wish to forgo a 30 percent investment tax credit in exchange for the equivalent amount in cash.
The Treasury department's announcement came three weeks after it released guidelines and a sample application to help companies prepare to apply for the grant online (see application website).
Project developers have been waiting for the government to start processing applications and giving out money ever since February this year, when the American Recovery and Reinvestment Act of 2009 created the program.
The program is meant to inject financing into a business that has found it difficult to line up money to build renewable energy generation projects.
But the financial market crisis has sidelined tax equity investors who in the past would invest in projects to make use of a 30 percent investment tax credit. If the investors aren't making much money, then they aren't likely to see a lot of value in taking a tax write-off.
The Treasury department expects to dole out $3 billion to about 5,000 projects generating power from solar, wind, biomass and other sources, the government said.
The U.S. Department of Energy, which knows more about renewable energy technologies, will help the Treasury department to review the applications.
The department promised to give out the cash within 60 days of receiving applications, but project developers must first complete the projects and put them into service.
Projects that have been installed since Jan. 1, 2009 are eligible. There is no cap for the amount each applicant could receive.
The grant program is meant to help projects that are up and running during 2009 and 2010. The government would consider projects that aren't finished by the end of 2010. The guidelines spell out more deadlines.
Although renewable energy companies were grateful when the government first created the program, some worry that the government might not dispense the money quickly enough to stimulate market demand (see Reality Check: How Much Impact Can the Feds Have on Solar?).
The Solar Energy Industries Association is now lobbying for a one-year extension of the program.
http://seekingalpha.com/article/153362-feds-now-accepting-applications-for-solar-wind-power?
Wireless Age to Enter Plasma Gasification Sector
TORONTO, ONTARIO--(Marketwire - July 22, 2009) - Wireless Age Communications, Inc. (PINK SHEETS:WLSA), ("Wireless Age" or "the Company") announced today that it has entered into a letter of intent with PowerPlay Energy Corp. ("PowerPlay") and Sunbay Energy Corp. ("Sunbay") to acquire the exclusive rights to develop Sunbay plasma gasification opportunities in the United States of America (the "USA Rights") and to acquire 60% of the issued and outstanding shares of Sunbay Port Hope Inc. ("Sunbay Port Hope"). Closing of the transaction is scheduled for July 31, 2009.
The Company has agreed to acquire the USA Rights and control of Sunbay Port Hope in exchange for seven million five hundred thousand (7,500,000) common shares of Newlook Industries Corp ("Newlook") and approximately $270,000 US in cash and forgiveness of debt. The Company will also enter into a management services agreement with PowerPlay to utilize the expertise of Mr. Jordan Oxley and his team. Mr. Oxley has over 7 years experience in clean energy development and he will become an integral part of the Wireless Age management team moving forward.
Sunbay Port Hope was organized to pursue a Sunbay biomass plasma gasification project in Port Hope, Ontario, Canada. Sunbay has entered into an exclusive developer agreement with Europlasma SA for Canada.
John G. Simmonds, CEO of Wireless Age stated; "We believe that renewable energy projects are extremely timely and will generate above average returns for shareholders. The Port Hope biomass project has been funded by Newlook, our controlling shareholder so we're well aware of what's necessary to make that project a success. We are in final stage discussions with potential new business partners and we plan to make known our plans for the United States market shortly. We also expect that Wireless Age and Newlook will complete our previously announced restructuring of debt as well as a name change for Wireless Age. The Port Hope project alone should provide Wireless Age with over $2M in net income once it is operational."
http://www.marketwire.com/press-release/Wireless-Age-Communications-Inc-PINK-SHEETS-WLSA-1020384.html
Feds Now Accepting Applications for Solar, Wind Power.
by: Greentech Media August 03, 2009
By Ucilia Wang
The U.S. Department of Treasury said Friday it's now accepting applications for a program for renewable energy project developers who wish to forgo a 30 percent investment tax credit in exchange for the equivalent amount in cash.
The Treasury department's announcement came three weeks after it released guidelines and a sample application to help companies prepare to apply for the grant online (see application website).
Project developers have been waiting for the government to start processing applications and giving out money ever since February this year, when the American Recovery and Reinvestment Act of 2009 created the program.
The program is meant to inject financing into a business that has found it difficult to line up money to build renewable energy generation projects.
But the financial market crisis has sidelined tax equity investors who in the past would invest in projects to make use of a 30 percent investment tax credit. If the investors aren't making much money, then they aren't likely to see a lot of value in taking a tax write-off.
The Treasury department expects to dole out $3 billion to about 5,000 projects generating power from solar, wind, biomass and other sources, the government said.
The U.S. Department of Energy, which knows more about renewable energy technologies, will help the Treasury department to review the applications.
The department promised to give out the cash within 60 days of receiving applications, but project developers must first complete the projects and put them into service.
Projects that have been installed since Jan. 1, 2009 are eligible. There is no cap for the amount each applicant could receive.
The grant program is meant to help projects that are up and running during 2009 and 2010. The government would consider projects that aren't finished by the end of 2010. The guidelines spell out more deadlines.
Although renewable energy companies were grateful when the government first created the program, some worry that the government might not dispense the money quickly enough to stimulate market demand (see Reality Check: How Much Impact Can the Feds Have on Solar?).
The Solar Energy Industries Association is now lobbying for a one-year extension of the program.
http://seekingalpha.com/article/153362-feds-now-accepting-applications-for-solar-wind-power?
Wireless Age to Enter Plasma Gasification Sector
TORONTO, ONTARIO--(Marketwire - July 22, 2009) - Wireless Age Communications, Inc. (PINK SHEETS:WLSA), ("Wireless Age" or "the Company") announced today that it has entered into a letter of intent with PowerPlay Energy Corp. ("PowerPlay") and Sunbay Energy Corp. ("Sunbay") to acquire the exclusive rights to develop Sunbay plasma gasification opportunities in the United States of America (the "USA Rights") and to acquire 60% of the issued and outstanding shares of Sunbay Port Hope Inc. ("Sunbay Port Hope"). Closing of the transaction is scheduled for July 31, 2009.
The Company has agreed to acquire the USA Rights and control of Sunbay Port Hope in exchange for seven million five hundred thousand (7,500,000) common shares of Newlook Industries Corp ("Newlook") and approximately $270,000 US in cash and forgiveness of debt. The Company will also enter into a management services agreement with PowerPlay to utilize the expertise of Mr. Jordan Oxley and his team. Mr. Oxley has over 7 years experience in clean energy development and he will become an integral part of the Wireless Age management team moving forward.
Sunbay Port Hope was organized to pursue a Sunbay biomass plasma gasification project in Port Hope, Ontario, Canada. Sunbay has entered into an exclusive developer agreement with Europlasma SA for Canada.
John G. Simmonds, CEO of Wireless Age stated; "We believe that renewable energy projects are extremely timely and will generate above average returns for shareholders. The Port Hope biomass project has been funded by Newlook, our controlling shareholder so we're well aware of what's necessary to make that project a success. We are in final stage discussions with potential new business partners and we plan to make known our plans for the United States market shortly. We also expect that Wireless Age and Newlook will complete our previously announced restructuring of debt as well as a name change for Wireless Age. The Port Hope project alone should provide Wireless Age with over $2M in net income once it is operational."
http://www.marketwire.com/press-release/Wireless-Age-Communications-Inc-PINK-SHEETS-WLSA-1020384.html
Market pauses from recent runup, stocks open lower.
Stocks lower as investors pause from recent runup, little moved by rise in consumer spending
By Sara Lepro, AP Business Writer
On Tuesday August 4, 2009, 9:40 am EDT
NEW YORK (AP) -- Investors are pausing after the market's huge rally, pushing stocks slightly lower as they wait for more confirmation that the economic recovery is under way.
The early slide in stocks follows mostly lower trading on overseas markets and after a three-week-long rally that catapulted the benchmark Standard & Poor's 500 index past the 1,000 mark on Monday for the first time since November.
Investors appear little fazed by a report showing an uptick in consumer spending and instead are focusing on locking in some profits following a 14 percent climb in stocks since July 13.
The Dow Jones industrial average is down 27 to 9,258. The Standard & Poor's 500 index is down 5 to 997, while the Nasdaq composite index is down 13 to 1,994.
THIS IS A BREAKING NEWS UPDATE. Check back soon for further information. AP's earlier story is below.
NEW YORK (AP) -- U.S. stock futures pointed to a lower opening Tuesday as investors around the world paused after a the market's huge rally and waited for more confirmation that the economic recovery is under way.
The slide in futures followed mostly lower trading on overseas markets and after a three-week-long rally that catapulted the benchmark Standard & Poor's 500 index past the 1,000 mark on Monday for the first time since November.
Investors appeared little fazed by the day's earnings and economic news and instead focused on locking in some profits following a 14 percent climb in stocks since July 13.
The Commerce Department said consumers spending rose 0.4 percent in June, slightly more than anticipated and the second straight gain. But the department said personal incomes, which fuel future spending, dropped by a larger-than-expected 1.3 percent.
Among the day's earnings news, homebuilder D.R. Horton Inc. said its fiscal third-quarter loss shrank from the year-ago period, beating Wall Street's estimates. And a day after automakers reported improved U.S. auto sales for July, Toyota posted a smaller-than-expected quarterly loss and said it expects narrower losses for the full year.
Stock market investors have seen better-than-expected corporate earnings reports and encouraging outlooks this summer, as well as data showing improvements in the manufacturing and housing industries. Such promising signs have driven hopes that the nearly two-year-long recession is coming to an end, pushing stocks up to levels not seen since last fall.
Ahead of the market's open, Dow Jones industrial average futures fell 38, or 0.4 percent, to 9,210. Standard & Poor's 500 index futures fell 5.40, or 0.5 percent, to 995.30, while Nasdaq 100 index futures fell 10.75, or 0.7 percent, to 1,616.
Despite the decline in futures Tuesday, analysts generally believe the market's near-term trajectory is upward, with investors seeing dips in stocks as an opportunity to put money to work, afraid of missing out on an extended rally.
"We are cautiously optimistic that this trend will continue," said Janet Engels, senior vice president and director of private client research group at RBC Wealth Management. "We also believe this market will be prone to pullbacks."
Later Tuesday, the National Association of Realtors will issue a report on pending home sales in June, which analysts expect to rise for a fifth month in a row.
There have been other positive signs in the troubled housing industry recently. Home prices in May posted their first monthly increase since the summer of 2006, according to the Standard & Poor's/Case-Shiller index released last week. And home resales have risen for three straight months, increasing 3.6 percent in June.
On Monday, all the major indicators rose more than 1 percent to fresh highs for the year, tacking on to a big advance in July that sent the Dow up 725 points. The gains follow a month of wayward trading in June when investors questioned the validity of a spring rally that sent stocks up as much as 40 percent in a matter of months.
Despite the impressive gains, major indexes are still down 35 percent from their peak in October 2007.
Investors are certainly more optimistic about the economy, and more confident in companies' ability to make money, than they were last fall at the peak of the financial crisis. But concerns about rising unemployment and the financial health of consumers have yet to subside.
On Friday, investors will get the month's most important piece of economic data -- the Labor Department's employment report. While the unemployment rate is expected to rise as high as 10 percent this year, a huge negative surprise in the report has the potential to rattle the market.
Bond prices rose in early trading Tuesday. The yield on the benchmark 10-year Treasury note, which moves opposite its price, fell to 3.59 percent from 3.64 percent late Monday.
The dollar rose against other major currencies, while gold prices fell.
Oil prices retreated, falling $1.18 to $70.40 a barrel in premarket trading on the New York Mercantile Exchange.
Overseas, Japan's Nikkei stock average rose 0.2 percent, while Hong Kong's Hang Seng index dipped 0.1 percent. In afternoon trading, Britain's FTSE 100 fell 1.2 percent, Germany's DAX index fell 0.8 percent, and France's CAC-40 slipped 0.5 percent.
GMAC Financial posts wider 2Q loss of $3.9 billion.
GMAC Financial posts wider 2nd-qtr loss of $3.9 billion on charges related to mortgages, taxes
On Tuesday August 4, 2009, 8:56 am EDT
NEW YORK (AP) -- GMAC Financial Services, which provides both automotive and home loans, said Tuesday it posted a wider second-quarter loss of $3.9 billion as it transformed from an arm of General Motors Co. into an independent bank.
In the year-ago period, the company posted a loss of $2.48 billion.
Revenue during the quarter fell 28 percent to $1.27 billion from $1.76 billion.
The bulk of the latest quarterly loss stems from a $1.6 billion charge related to company's mortgage business. GMAC also incurred a $1.2 billion tax charge on its conversion from GM's financing arm to a separate company offering personal banking services in addition to auto loans for GM and Chrysler customers.
Excluding those charges, GMAC said its second-quarter loss was about $400 million.
"GMAC's results in the quarter were dramatically affected by a series of strategic actions that produced a short-term negative impact to financial performance but are expected to lead to longer-term benefits," said GMAC CEO Alvaro G. de Molina in a statement. "This is about gaining funding and operational flexibility, expanding on our strengths, and shedding legacy and non-strategic assets, allowing us to focus on the core automotive and mortgage origination and servicing businesses."
Midway through the quarter, GMAC was named as Chrysler LLC's preferred lender. However, GMAC's automotive unit lost $727 million in the quarter, compared with a loss of $717 in the second quarter of 2008.
In May, the Treasury Department announced a new $7.5 billion injection for GMAC -- still short of the $11.5 billion the government's "stress test" last month showed the company needs to stay afloat if the economy worsens. Of the injection, $4 billion was earmarked for new loans to Chrysler dealers and customers. The remaining $3.5 billion was to go toward boosting GMAC's capital base.
To help GMAC raise the remaining capital, the Federal Deposit Insurance Corp. took the rare step of allowing the junk-rated company to gain access to its debt guarantee program. GMAC will be allowed to issue as much as $7.4 billion in FDIC-backed debt. The FDIC guarantees the debt that GMAC would issue in case the company defaults on payment.
The Federal Reserve also waived rules to give GMAC's new bank, called Ally Bank, more leeway to make loans to GM customers.
Ally Bank had assets of $42.5 billion at the end of the quarter, up from $36.4 billion at the end of the first quarter, the only comparable quarter. Ally received $25.4 billion in deposits in the quarter, including $14.5 billion in retail deposits as the company heavily marketed its new bank status.
Oil falls below $71 after big rally.
Oil falls below $71 in noon European trade after rally fueled by signs of improving US economy
By Pablo Gorondi, Associated Press Writer
On Tuesday August 4, 2009, 7:42 am EDT
Oil prices fell below $71 a barrel Tuesday, as investors booked profits after a big rally fueled by signs of economic recovery in the U.S.
By midday in Europe, benchmark crude for September delivery was down 92 cents to $70.66 a barrel in electronic trading on the New York Mercantile Exchange. Earlier in the session, the contract fell as low as $70.28. On Monday, the contract rose $2.13 to settle at $71.58.
"Oil has rallied to levels seen in June, before the sharp decline of nearly 16 percent," said analysts at Sucden Financial in London. "Given continuing poor oil fundamentals, current high prices seem difficult to sustain."
A report Monday from the Institute for Supply Management, a trade group of purchasing executives, said U.S. manufacturing activity should increase next month for the first time since January 2008. Also, the Commerce Department said construction spending rose in June.
The positive economic news has emboldened investors to bid up stocks and oil. The Dow Jones industrial average rose 1.3 percent Monday and most Asian indexes gained Tuesday.
"With the economy seemingly improving each week, oil has felt pressure to go higher," said Michael Sander, an adviser at Sander Capital in Seattle. "As far as fundamentals go, oil still has very high inventory levels and weak consumer demand, but those just don't seem to matter."
A report last week showing U.S. crude inventories jumped the previous week suggested demand remains sluggish, and sent prices below $63 a barrel. Since then, oil has been on a tear as investors anticipate an improving economy will boost demand and whittle away supplies.
"Improving demand amid continued supply tightness should accelerate the pace of erosion of the inventory overhang, lending support to prices," Barclays Capital said in a report.
Still, the uncertainties about global demand for oil -- in parallel with concerns about supplies -- continue to prompt some analysts to remain cautious.
"We think that oil prices should head back down towards $50 per barrel rather than remain close to OPEC's informal target of $75-80," said London's Capital Economics. "The rally that we have seen since the spring has been driven mainly by hopes of a strong recovery and is likely to falter as these hopes fade. Final demand is set to remain weak for years."
In other Nymex trading, gasoline for August delivery was down 2.33 cents to $2.0460 a gallon and heating oil lost 1.18 to $1.8595. Natural gas for August delivery fell 5.6 cents to $3.975 per 1,000 cubic feet.
In London, Brent prices fell 59 cents to $72.96 a barrel on the ICE Futures exchange.
Associated Press writer Alex Kennedy in Singapore contributed to this report.
Consumer spending rises in June, incomes fall.
On Tuesday August 4, 2009, 9:12 am EDT
WASHINGTON (Reuters) - U.S. consumer spending rose slightly more than expected in June, a government report showed on Tuesday, likely pushed up by higher gasoline prices, and incomes saw their biggest drop in four-and-a-half years.
The Commerce Department said spending rose 0.4 percent, boosted by expenditures on nondurable goods, after a revised 0.1 percent increase in May, which was previously reported as a 0.3 percent rise.
That compared to market expectations for a 0.3 percent increase in spending, which accounts for over two-thirds of U.S. economic activity. However, adjusted for inflation, spending fell 0.1 percent after being flat in May.
"I think the data shows that consumer confidence appears to be bottoming and turning higher, though headwinds from job losses remain a significant hurdle," said Alan Gayle, senior investment strategist at Ridgeworth Investments in Richmond, Virginia.
Personal incomes declined 1.3 percent in June, however, as the effects of one-time government stimulus checks in May wore off, and U.S. stock index futures extended losses after the report while government bond prices rose.
The drop in personal income was the biggest decrease since January 2005 and was larger than market expectations for a 1.0 percent drop.
"It's obviously a modestly sharper decline than had been expected, but it's very much affected by the unwinding of the transfer payments from the Obama administration stimulus plan," said Hugh Johnson, chief investment officer at Johnson Illington Advisors in Albany, New York.
"The good news is that personal spending rose," he said.
Spending on nondurable goods rose 1.7 percent in June after a 0.1 percent rise in May. Spending on services also was up slightly, but consumption of durable goods, like appliances and cars, fell 0.2 percent.
High unemployment, reduced access to credit and sagging house prices are undermining personal incomes, hurting consumer spending.
A government report last Friday showed spending fell at a 1.2 percent rate in the second quarter, after rising 0.6 percent in the January-March period.
While the recession's grip on the economy appears to be slackening, consumers remain reluctant to open their wallets, opting instead to save any extra income. This has raised concerns that the economic recovery will be tepid.
Real disposable income tumbled 1.8 percent in June, the largest decline since last June, the Commerce Department said. The decline in income saw a decrease in savings during the month.
Savings fell to an annual rate of $505 billion, with the saving rate slipping to 4.6 percent versus 6.2 percent in May. A measure of inflation closely watched by the Federal Reserve, the year-on-year personal consumption expenditures index excluding food and energy rose 1.5 percent after a 1.6 percent increase in May.
(Reporting by Lucia Mutikani; Additional reporting by Ryan Vlastelica and Charles Mikolajzcak in New York, Editing by Andrea Ricci)
Toyota trims loss forecast, cautious on demand recovery.
Tue Aug 4, 2009 7:08am EDT
By Chang-Ran Kim, Asia autos correspondent
TOKYO (Reuters) - Toyota Motor Corp (7203.T: Quote, Profile, Research, Stock Buzz) is relying on deeper cost cuts and a government-backed sales boost as it forecasts a slightly shallower annual loss, underscoring doubts over a sustainable recovery in demand.
Toyota, the world's biggest automaker, slipped to its third quarterly loss in a row as sales sank in Japan, Europe and the United States with job losses mounting and credit still tight, and expects to lose a record $7.9 billion this business year.
While the global downturn is hammering automakers everywhere, Toyota's results contrasted with surprising first-quarter profits at domestic rivals Honda Motor Co (7267.T: Quote, Profile, Research, Stock Buzz) and Nissan Motor Co (7201.T: Quote, Profile, Research, Stock Buzz).
"Toyota lowered its loss forecasts, but it booked a loss for April-June. That is slightly unsatisfactory, compared with Honda and Nissan, which turned profitable for the period," said Fujio Ando, senior managing director at Chibagin Asset Management.
Toyota lifted its global vehicle sales by 100,000 vehicles to 6.6 million on the back of rising demand in Japan, where the government is offering generous incentives on hybrids, but it remained cautious on sales elsewhere.
"Demand is being supported to a large extent by government schemes, and it's difficult to get a read on how much this will translate into a fundamental recovery in demand," Senior Managing Director Takahiko Ijichi told a news conference.
A "cash-for-clunkers" scheme introduced in the United States helped limit Toyota's U.S. sales drop to 11 percent last month, but Ijichi said he would gauge performance over the next two months before deciding on any revisions to its sales forecast for the region.
Toyota's production is gradually picking up, most notably to assemble more of the Prius hybrid car, for which customers in Japan are waiting at least eight months for delivery.
But Ijichi said output was being held back by a shortage of batteries to run the vehicles, and the company was considering expanding capacity. Toyota's battery venture with Panasonic Corp (6752.T: Quote, Profile, Research, Stock Buzz) has so far announced plans to double capacity to about 1 million units a year by the middle of 2010.
MORE COST CUTTING
For the year to March 31, 2010, the maker of the Corolla and Tundra forecast an operating loss of 750 billion yen ($7.9 billion) and net loss of 450 billion yen, better than its projections three months ago for losses of 850 billion yen and 550 billion yen, respectively.
But its estimates are much more conservative than a consensus operating loss forecast of 467 billion yen, according to a poll of 22 analysts by Thomson Reuters, prompting speculation further revisions could follow.
Toyota raised its cost savings target to 900 billion yen from 800 billion yen, through steps such as accelerating measures to eliminate quality-related costs and cutting labor costs through work-sharing.
In the April-June quarter, which saw two U.S. automakers succumb to bankruptcy, Toyota made an operating loss of 194.9 billion yen ($2.04 billion). That compared with a profit of 412.6 billion yen a year earlier and a consensus loss estimate of 326 billion yen in a survey of five analysts by Thomson Reuters.
Toyota lost a net 77.8 billion yen, swinging from a profit of 353.7 billion yen in the first quarter a year ago. Revenue declined 38 percent to 3.84 trillion yen.
Profitability could improve in North America, where Toyota is preparing to dissolve a loss-making plant in California that it ran with General Motors before the U.S. automaker left it behind in bankruptcy with Motors Liquidation Co (MTLQQ.PK: Quote, Profile, Research, Stock Buzz).
A liquidation would likely result in a one-off loss, but it would help Toyota in the long run by raising the rate of capacity utilization at its other North American factories, analysts said.
Shares of Toyota have gained 37 percent in the year to date, against a 17 percent rise in the benchmark Nikkei average .N225.
Before the results were announced, Toyota ended down 1.5 percent versus a 0.2 percent rise in the Nikkei.
($1=94.92 Yen)
(Additional reporting by Koichi Kawaguchi; Editing by Lincoln Feast)
UBS still losing client money, sees improvement.
Tue Aug 4, 2009 6:43am EDT
By Lisa Jucca and Emma Thomasson
ZURICH (Reuters) - Swiss bank UBS posted another big loss in the second quarter as wealthy clients were scared off by a U.S. tax row, but said it hoped to start winning back trust now that a U.S. deal was in sight.
UBS said on Tuesday it remained cautious about its prospects, given the economic environment, but after taking out one-off restructuring and other charges of 2.3 billion Swiss francs ($2.17 billion), it made an operating profit of 971 million francs, its best in eight quarters.
The bank posted a net loss of 1.4 billion francs, compared with an average forecast from analysts in a Reuters poll for a loss of 1.1 billion francs, and suffered 39.4 billion francs of outflows at its wealth and asset management divisions.
Chief Executive Oswald Gruebel told analysts a deal UBS struck with the U.S. government on Friday to settle their tax dispute should help reverse outflows as the bank rebuilds its reputation, although recovery would take more than a quarter.
"We certainly think we will reverse the trend in outflows," Gruebel said.
UBS is expected to finalize the deal this week. It is not expected to have to pay a fine for helping U.S. clients dodge taxes but could hand over 5,000 names of secret account holders, compared with the 52,000 Washington is seeking.
Gruebel declined to comment on the details of the deal but Chief Financial Officer John Cryan said the bank had made no additional provision for settling the U.S. litigation.
Shares in UBS, which have missed out on much of the recent rally in bank stocks but gained 7 percent after the tax deal, were down 4.8 percent at 15.25 francs at 0949 GMT, compared to a 0.8 percent weaker DJ Stoxx European banking sector.
"UBS posts mixed results... In our view, the market is pricing in UBS turning back to profitability levels similar to peers too quickly," said Kepler Capital Markets analyst Mathias Bueeler.
"The investment bank is simply not taking advantage of improved market conditions to the same extent as peers. Especially in fixed income, a market that is thriving currently, UBS remains behind peers."
Gruebel said it would take six to 12 months to rebuild the UBS fixed income business.
The UBS loss came in contrast with forecast-beating results at some European rivals such as Switzerland's Credit Suisse and HSBC and Barclays, which took advantage of a market rebound while UBS was busy cutting costs, paring its balance sheet and fighting the U.S. case.
SWISS OUTFLOWS SLOW
The U.S. case has compounded UBS's woes in the credit crisis, prompting many of its wealthy clients to withdraw their assets, a trend that accelerated in the second quarter with outflows increasing from its wealth management operations in the Americas and its asset management business.
However, outflows slowed at the wealth management and Swiss bank business, to 16.5 billion francs from 23.4 billion in the first quarter, with outflows from Swiss clients almost stopping at 0.2 billion, compared with 16.3 billion from global clients.
Gruebel said the U.S. tax litigation would push up compliance costs for the wealth management industry as a whole and did not rule out similar action by European governments.
"Other governments will closely watch what is going on there," he said when asked about the U.S. case.
Gruebel said he expected the first signs of net new money growth in the onshore Swiss business but did not expect to see a quick reversal of outflows in international offshore assets.
UBS had already warned in June that it would post a loss, and said it saw client withdrawal in all its wealth management and asset management divisions.
The bank had to accept a 6 billion franc state cash injection last year after making $54 billion writedowns on toxic assets. When the bank raised $3.5 billion of new capital in June, the government said it had agreed not to sell its stake before August 4 as part of the deal.
UBS continued to further reduce risks in the second quarter and was able to boost its Tier 1 ratio to a solid 13.2 percent, but still well below the 15.5 percent reported by Credit Suisse.
Cryan said now the quarterly report was out of the way, the Swiss government could look to change its mandatory convertible notes into shares and place them in the market.
The Swiss finance ministry declined to comment on its stake, but said the bank was still in a process of stabilization.
(Additional reporting by Sven Egenter, editing by Will Waterman and Mike Nesbit)
($1=1.061 Swiss Franc)
Bank regulators dig in against Obama shake-up.
Tue Aug 4, 2009 7:52am EDT
By Patrick Rucker and Kevin Drawbaugh
WASHINGTON (Reuters) - Top U.S. bank regulators will speak out on Tuesday against some key elements of the Obama administration's plan to reshape financial regulation, saying parts of it were unneeded or could be disruptive.
The officials' defiance, in prepared congressional testimony obtained by Reuters, came despite a warning given to them on Friday by Treasury Secretary Timothy Geithner.
In private remarks punctuated with expletives, Geithner urged the regulators to end their turf battles and show support for President Barack Obama's plan, according to a person familiar with the situation on Monday.
But that seemed to have little impact on John Bowman, acting director of the Office of Thrift Supervision (OTS), an agency slated for closure under the Obama plan.
"We do not support the administration's proposal to establish a new agency, the National Bank Supervisor (NBS), by eliminating the Office of the Comptroller of the Currency ... and the OTS," Bowman said in written remarks to be given to the Senate Banking Committee at a hearing.
In addition, he said, "The OTS does not support the provision in the administration's proposal to eliminate the thrift charter and require all federal thrift institutions to change their charter."
Such words marked a retrenching of regulators' opposition to portions of Obama's plans to tighten oversight of banks and capital markets amid the worst financial crisis in generations and with the economy mired in a stubborn recession.
"We do not see merit or wisdom in consolidating federal supervision of national and state banking charters into a single regulator," FDIC chairman Sheila Bair said in her remarks ahead of the hearing on regulatory reform.
TENSE MEETING
At a tense, hour-long meeting on Friday, Geithner told Bair, Federal Reserve Chairman Ben Bernanke and Securities and Exchange Commission Chairman Mary Schapiro to end recent public criticism of the administration's plan and stop airing concerns over their potential loss of authority.
The Wall Street Journal, which first reported the meeting, said Geithner vented frustration over the plan's slow progress and told regulators that "enough is enough."
Citing people familiar with the meeting, the newspaper also said Geithner used obscenities and took an aggressive stance in his dressing down of the regulators.
Treasury spokesman Andrew Williams said, "We planned this meeting as a venue to deliver a tough message to regulators that we should work together to get reform done - and focus less on protecting turf."
Under the plan conceived by Treasury, banking supervision would be significantly consolidated.
But Bair, whose populist tone has won allies in Congress, in her prepared remarks for the banking committee hearing, said: "Prudent risk management argues strongly against putting all your regulatory and supervisory eggs in one basket."
The Obama plan aims to bring a creaking system set up in the 1930s, with regulation spread across many agencies, into the 21st century. But it has met resistance not only from regulators, but the institutions that they supervise.
Groups such as the American Bankers Association and the Independent Community Bankers have expressed opposition.
FED POWERS QUESTIONED
John Dugan, Comptroller of the Currency, warned lawmakers in his remarks that the existing plan would wrongly give the Federal Reserve the right to 'override' the views of other regulators when it comes to supervising very large banks.
Such a move would "undermine the authority -- and the accountability -- of the banking supervisor" he said.
Federal Reserve Board Governor Daniel Tarullo argued for preserving the Fed's bank oversight powers, with enhancements.
"It is essential both to refocus the regulation and supervision of banking institutions under existing authorities and to augment those," he said in prepared remarks.
(Reporting by Patrick Rucker, Kevin Drawbaugh, David Lawder and Jonathan Stempel in New York; Editing by Kim Coghill)
EVRM ~ video chart 08.03.09
Volume continues to support the price rally, with short-term resistance at $0.056; support at $0.049, $0.03, respectfully. Critical support at $0.02 is countered by key resistance at $0.08, $0.10, respectfully. The market has corrected itself numerous times during the rally in the past few months only to yield long-term growth and a bullish outlook.
Link to video chart: http://timelesswealth.net/evrm.html
Note: While viewing the video chart please tune the sound accordingly.
BofA agrees to $33M SEC fine over Merrill bonuses.
Bank of America pays $33 million SEC penalty for misleading investors about Merrill bonuses
By Christopher S. Rugaber, AP Economics Writer
On Monday August 3, 2009, 9:27 pm EDT
WASHINGTON (AP) -- Bank of America Corp. has agreed to pay a $33 million penalty to settle government charges that it misled investors about Merrill Lynch's plans to pay bonuses to its executives, regulators said Monday.
In seeking approval to buy Merrill, Bank of America told investors that Merrill would not pay year-end bonuses without Bank of America's consent. But the Securities and Exchange Commission said Bank of America had authorized New York-based Merrill to pay up to $5.8 billion in bonuses.
That rendered a statement Bank of America mailed to 283,000 shareholders of both companies about the Merrill deal "materially false and misleading," the SEC said in a statement.
Bank of America agreed to pay $33 million to settle the charges without admitting or denying the allegations. The settlement is subject to court approval.
"Bank of America believes that the settlement ... represents a constructive conclusion to this issue," company spokesman Scott Silvestri said in an e-mailed statement.
New York Attorney General Andrew Cuomo, who referred the case to the SEC in April, said his investigation is continuing. The SEC said its probe also is ongoing.
Bank of America, along with Citigroup Inc. and insurance giant American International Group, is among the largest recipients of government aid. It has received $45 billion from the federal $700 billion bank rescue program.
Charlotte, N.C.-based Bank of America agreed to purchase Merrill in a deal that was hastily arranged Sept. 13-14, 2008, the same weekend that Lehman Brothers collapsed. Bank of America CEO Ken Lewis and Merrill Lynch CEO John Thain announced the deal Sept. 15.
The acquisition came as Lehman's collapse caused panic in the financial markets and investment banks such as Merrill faced billions of losses on soured mortgage investments.
Merrill ended up paying $3.6 billion in bonuses in 2008, the SEC said, even though it lost $27.6 billion that year, a record for the firm.
Bank of America included a copy of the merger agreement with the proxy statement that it mailed to shareholders of both firms in November. That agreement said Merrill would not pay discretionary bonuses prior to the deal's closing, the SEC said.
A separate agreement authorizing the bonuses wasn't mailed to shareholders, the SEC said.
Shareholders in both companies voted to approve the acquisition Dec. 5, which then closed Jan. 1. The SEC said the bonuses were paid Dec. 31.
"Companies must give shareholders all material information about corporate transactions they are asked to approve," said Robert Khuzami, director of the SEC's enforcement division. "Failing to disclose that a struggling company will pay out billions of dollars in performance bonuses obviously violates that duty."
The bonuses amount to nearly 12 percent of the $50 billion that Bank of America paid for Merrill.
Separately, Bank of America announced that Sallie Krawcheck, Citigroup's former chief executive of global wealth management, will join the company to run its global wealth and investment management operations.
Krawcheck, 44, also has served as chief financial officer of Citigroup, as chairman and CEO of Sanford C. Bernstein & Co. Inc., and an executive vice president of Bernstein's parent company, Alliance Capital Management LP.
Shares of Bank of America added 53 cents, or 3.6 percent, to $15.32 Monday. The company's stock has traded between $2.53 and $39.50 in the last year.
AP Business Writers Ieva M. Augstums in Charlotte and Stephen Bernard in New York contributed to this report.
Asian markets rise on commodities gains.
Asian markets rise on gains in commodity prices, strong Wall Street performance
By Joe Mcdonald, AP Business Writer
On Tuesday August 4, 2009, 12:38 am EDT
BEIJING (AP) -- Asian markets mostly rose Tuesday on stronger commodity prices and overnight Wall Street gains driven by signs the U.S. recession might be ending.
Investors were encouraged after the Standard & Poor's 500 index -- a key U.S. market measure -- broke through the 1,000-point level for the first time since November. A trade group said American manufacturing might improve next month for the first time since early 2008.
Japan's benchmark Nikkei 225 index was up 44.53, or 0.4 percent, at 10,396.92, while Hong Kong's Hang Seng index added 6.51 points, or less than 0.1 percent, to 20,813.77 in back and forth trade. South Korea's Kospi rose 0.1 percent to 1,566.57.
"Investors are in an even more upbeat mood because of the very strong performance on Wall Street," said Dariusz Kowalczyk, chief investment strategist for SJS Markets in Hong Kong.
China's Shanghai Composite Index bucked the regional trend, falling 23.21, or 0.7 percent, to 3,439.38, led by banks after regulators announced a review of capital adequacy as they try to cool a credit boom. China's biggest lender, Industrial & Commercial Bank of China Ltd, lost 2 percent while Bank of China Ltd. was down 1.9 percent.
"The regulator's documents would further squeeze the profits of banks. But this is just a short-term factor as a reason for investors to take profits," said Tang Yonggang, an analyst for Hongyuan Securities in Beijing.
Elsewhere, Australia's benchmark was up 1.3 percent while Singapore's market measure dropped 0.2 percent and Taiwan's Taiex fell 1 percent.
BHP Billiton Ltd., the world's biggest miner, was up 3.3 percent in Sydney after prices for copper, tin, aluminum and other metals gained Monday. Rival Rio Tinto Ltd. was up 5.6 percent.
"Our region is very sensitive to developments in commodities prices and commodities gained sharply," Kowalczyk said.
Wall Street's big indexes all rose more than 1 percent on Monday, including the Dow Jones industrial average, which climbed 115 points. Better corporate earnings pushed the Dow Jones average up 725 points in July to its best month in nearly seven years.
The Institute for Supply Management, a trade group of purchasing executives, said U.S. manufacturing should increase next month for the first time since January 2008 as industrial companies restock shelves.
The Commerce Department said U.S. construction spending rose rather than fell in June as analysts had expected. The reports and rising commodity prices lifted energy and material stocks.
Ford Motor Co. said its sales rose 1.6 percent in July, its first monthly gain in nearly two years.
Oil prices stayed above $70 in Asia on expectations a global recovery will boost demand for crude. Benchmark crude for September delivery fell 37 cents to $71.21 per barrel in electronic trading on the New York Mercantile Exchange. On Monday, the contract rose 67 cents to $70.12.
In currency markets, the dollar rose to 95.31 yen from 95.22. The euro fell to $1.4384 from $1.4410 late Monday in New York.
StockPromoters.com - End of Day Summary for 8/3/2009
--------------------------------------------------------------------------------
Company: He5 Resources Corp. New (HRRN)
--------------------------------------------------------------------------------
End of Day: $ Close: 0.064 Volume: 25,631,336
$ Change: 0.051 % Change: 392.308
Dollar Volume: 1,640,406
--------------------------------------------------------------------------------
3 Month : $ High 0.064 Volume 3m avg: 790,811
$ Low: 0.006 % Change 3m: 8.127
Dollar Volume 3 m: 11,669
--------------------------------------------------------------------------------
Compensation: HotShotStocks.com - 1,500,000 FREE trading shares
3,141.146
Company: Ethos Environmental Inc. New (ETEV)
--------------------------------------------------------------------------------
End of Day: $ Close: 0.300 Volume: 2,437,542
$ Change: -0.056 % Change: -15.730
Dollar Volume: 731,263
--------------------------------------------------------------------------------
3 Month : $ High 0.464 Volume 3m avg: 126,432
$ Low: 0.160 % Change 3m: 0.126
Dollar Volume 3 m: 35,417
--------------------------------------------------------------------------------
Compensation: Hototc.com - sixty five thousand dollars
COOL PENNY STOCKS - sixty five thousand dollars
StockRich.com - sixty five thousand dollars
Stock Egg - sixty five thousand dollars
Stock Hideout - SEVENTY FIVE THOUSAND DOLLARS
1,827.954
Company: Super Nova Resources Inc (SNRR)
--------------------------------------------------------------------------------
End of Day: $ Close: 0.190 Volume: 2,638,650
$ Change: 0.053 % Change: 38.686
Dollar Volume: 501,344
--------------------------------------------------------------------------------
3 Month : $ High 0.750 Volume 3m avg: 176,956
$ Low: 0.080 % Change 3m: 4.071
Dollar Volume 3 m: 41,782
--------------------------------------------------------------------------------
Compensation: Monsterstox.com - five million shares free trading
1,391.132
Company: Liberator Medical Holdings Inc. (LBMH)
--------------------------------------------------------------------------------
End of Day: $ Close: 0.980 Volume: 289,515
$ Change: 0.250 % Change: 34.247
Dollar Volume: 283,725
--------------------------------------------------------------------------------
3 Month : $ High 0.980 Volume 3m avg: 27,078
$ Low: 0.450 % Change 3m: 0.896
Dollar Volume 3 m: 15,531
--------------------------------------------------------------------------------
Compensation: Wall Street Resources - $2,500
969.180
Company: Clear Skies Solar Inc. (CSKH)
--------------------------------------------------------------------------------
End of Day: $ Close: 0.170 Volume: 2,544,797
$ Change: 0.030 % Change: 21.429
Dollar Volume: 432,615
--------------------------------------------------------------------------------
3 Month : $ High 0.173 Volume 3m avg: 345,650
$ Low: 0.044 % Change 3m: 2.163
Dollar Volume 3 m: 25,046
--------------------------------------------------------------------------------
Compensation: Stock Market News Alert - thirty thousand dollars
Lebed.biz - $20,000 cash
636.235
Company: Smokefree Innotec Inc. (SFIO)
--------------------------------------------------------------------------------
End of Day: $ Close: 0.105 Volume: 7,356,529
$ Change: 0.040 % Change: 61.538
Dollar Volume: 772,436
--------------------------------------------------------------------------------
3 Month : $ High 0.240 Volume 3m avg: 1,155,605
$ Low: 0.013 % Change 3m: 15.491
Dollar Volume 3 m: 112,690
--------------------------------------------------------------------------------
Compensation: OTC Reporter - received a purchase of twelve million sixteen thousand free trading shares from a third party
StockStars.net - three thousand dollars
Willy Wizard - COMPENSATED SEVEN THOUSAND DOLLARS IN TOTAL
536.595
Company: Kodiak Energy Inc. (KDKN)
--------------------------------------------------------------------------------
End of Day: $ Close: 0.750 Volume: 3,324,268
$ Change: 0.120 % Change: 19.048
Dollar Volume: 2,493,201
--------------------------------------------------------------------------------
3 Month : $ High 0.750 Volume 3m avg: 604,707
$ Low: 0.145 % Change 3m: 2.446
Dollar Volume 3 m: 181,142
--------------------------------------------------------------------------------
Compensation: The Green Baron - $4,500
Small Cap Investor - six-teen thousand dollars
449.732
Company: Navstar Technologies Inc New (NVSR)
--------------------------------------------------------------------------------
End of Day: $ Close: 0.038 Volume: 18,437,388
$ Change: 0.008 % Change: 25.753
Dollar Volume: 693,246
--------------------------------------------------------------------------------
3 Month : $ High 0.038 Volume 3m avg: 4,627,183
$ Low: 0.002 % Change 3m: 6.831
Dollar Volume 3 m: 30,708
--------------------------------------------------------------------------------
Compensation: OTC Picks - eight thousand dollars
OTC-Advisors - Seven thousand dollars from a third party
298.458
Company: Applied Dna Sciences Inc. (APDN)
--------------------------------------------------------------------------------
End of Day: $ Close: 0.141 Volume: 2,541,239
$ Change: 0.011 % Change: 8.462
Dollar Volume: 358,315
--------------------------------------------------------------------------------
3 Month : $ High 0.194 Volume 3m avg: 680,924
$ Low: 0.070 % Change 3m: 1.197
Dollar Volume 3 m: 80,217
--------------------------------------------------------------------------------
Compensation: Micro Stock Profit - ONE HUNDRED AND TWENTY FIVE THOUSAND
273.204
Company: Fonix Corp. (FNXC)
--------------------------------------------------------------------------------
End of Day: $ Close: 0.048 Volume: 1,527,549
$ Change: -0.022 % Change: -31.429
Dollar Volume: 73,322
--------------------------------------------------------------------------------
3 Month : $ High 0.070 Volume 3m avg: 446,903
$ Low: 0.018 % Change 3m: 1.788
Dollar Volume 3 m: 13,500
--------------------------------------------------------------------------------
Compensation: Wall Street Grand - Thirty-Five Thousand Dollars
241.808
Company: Mundus Group Inc. (MNDP)
--------------------------------------------------------------------------------
End of Day: $ Close: 0.110 Volume: 1,813,666
$ Change: 0.016 % Change: 17.021
Dollar Volume: 199,503
--------------------------------------------------------------------------------
3 Month : $ High 0.370 Volume 3m avg: 654,984
$ Low: 0.060 % Change 3m: -0.358
Dollar Volume 3 m: 74,983
--------------------------------------------------------------------------------
Compensation: MONSTER PENNY STOCKS - $25,000 cash
Wall Street Grand - Fifty-Four Thousand Dollars
176.902
Company: Total Apparel Group Inc New (TLAG)
--------------------------------------------------------------------------------
End of Day: $ Close: 0.145 Volume: 202,490
$ Change: 0.050 % Change: 52.632
Dollar Volume: 29,361
--------------------------------------------------------------------------------
3 Month : $ High 0.200 Volume 3m avg: 83,661
$ Low: 0.070 % Change 3m: 2.910
Dollar Volume 3 m: 12,896
--------------------------------------------------------------------------------
Compensation: TOP Best Penny Stock - five thousand cash
142.037
Company: W2 Energy Inc. New (WTWO)
--------------------------------------------------------------------------------
End of Day: $ Close: 0.011 Volume: 1,989,887
$ Change: -0.002 % Change: -15.385
Dollar Volume: 21,889
--------------------------------------------------------------------------------
3 Month : $ High 0.015 Volume 3m avg: 897,238
$ Low: 0.005 % Change 3m: 1.030
Dollar Volume 3 m: 7,259
--------------------------------------------------------------------------------
Compensation: Alpha Trade - 200,000 unregistered and restricted common shares
121.779
Company: Metatron Inc (MRNJ)
--------------------------------------------------------------------------------
End of Day: $ Close: 0.386 Volume: 120,420
$ Change: 0.016 % Change: 4.324
Dollar Volume: 46,482
--------------------------------------------------------------------------------
3 Month : $ High 2.050 Volume 3m avg: 56,524
$ Low: 0.240 % Change 3m: 25.087
Dollar Volume 3 m: 24,986
--------------------------------------------------------------------------------
Compensation: Speculating Stocks - $4,000 cash
OTC Picks - three thousand dollars
113.042
Company: Dana Resources (DANR)
--------------------------------------------------------------------------------
End of Day: $ Close: 0.650 Volume: 52,276
$ Change: 0.000 % Change: 0.000
Dollar Volume: 33,979
--------------------------------------------------------------------------------
3 Month : $ High 0.890 Volume 3m avg: 24,898
$ Low: 0.230 % Change 3m: 2.689
Dollar Volume 3 m: 16,066
--------------------------------------------------------------------------------
Compensation: OTC Stock Exchange - 150,000 shares
109.964
Company: Optical Systems Inc (OPSY)
--------------------------------------------------------------------------------
End of Day: $ Close: 0.040 Volume: 897,373
$ Change: -0.009 % Change: -18.367
Dollar Volume: 35,895
--------------------------------------------------------------------------------
3 Month : $ High 0.058 Volume 3m avg: 443,623
$ Low: 0.002 % Change 3m: 9.577
Dollar Volume 3 m: 9,673
--------------------------------------------------------------------------------
Compensation: StockStars.net - ten thousand dollars
TheSUBWAY.com - ( 200,000 FREE TRADING SHARES)
102.283
Company: Eagle Rock Enterprises Inc (EREI)
--------------------------------------------------------------------------------
End of Day: $ Close: 0.017 Volume: 5,616,121
$ Change: 0.002 % Change: 13.333
Dollar Volume: 95,474
--------------------------------------------------------------------------------
3 Month : $ High 0.034 Volume 3m avg: 2,998,557
$ Low: 0.003 % Change 3m: 5.631
Dollar Volume 3 m: 32,546
--------------------------------------------------------------------------------
Compensation: OTC Reporter - fifteen thousand dollars and sixteen million five hundred thousand free trading shares
87.294
Company: Social Media Ventures Inc (SMVI)
--------------------------------------------------------------------------------
End of Day: $ Close: 0.370 Volume: 104,193
$ Change: 0.010 % Change: 2.778
Dollar Volume: 38,551
--------------------------------------------------------------------------------
3 Month : $ High 0.750 Volume 3m avg: 64,086
$ Low: 0.010 % Change 3m: 110.030
Dollar Volume 3 m: 19,867
--------------------------------------------------------------------------------
Compensation: OTC Stock Exchange - 400,000 shares
Ahead Of The Bulls - 200,000 free trading shares
62.584
Company: Skinvisible Inc. (SKVI)
--------------------------------------------------------------------------------
End of Day: $ Close: 0.165 Volume: 263,267
$ Change: -0.005 % Change: -2.941
Dollar Volume: 43,439
--------------------------------------------------------------------------------
3 Month : $ High 0.200 Volume 3m avg: 187,853
$ Low: 0.050 % Change 3m: 1.988
Dollar Volume 3 m: 15,760
--------------------------------------------------------------------------------
Compensation: Stock Guru - 500,000 144 restricted common shares
40.145
Company: Northern Explorations Ltd. (NXPN)
--------------------------------------------------------------------------------
End of Day: $ Close: 0.050 Volume: 2,356,386
$ Change: -0.010 % Change: -16.667
Dollar Volume: 117,819
--------------------------------------------------------------------------------
3 Month : $ High 0.330 Volume 3m avg: 1,727,331
$ Low: 0.033 % Change 3m: -1.258
Dollar Volume 3 m: 247,162
--------------------------------------------------------------------------------
Compensation: Alpha Trade - $5,000 in cash
36.418
Company: Save The World Air Inc. (ZERO)
--------------------------------------------------------------------------------
End of Day: $ Close: 0.280 Volume: 38,914
$ Change: -0.010 % Change: -3.448
Dollar Volume: 10,896
--------------------------------------------------------------------------------
3 Month : $ High 0.430 Volume 3m avg: 29,678
$ Low: 0.250 % Change 3m: -0.217
Dollar Volume 3 m: 10,339
--------------------------------------------------------------------------------
Compensation: Stock Guru - 60,000 144 restricted common shares
31.121
Company: Cannabis Science Inc. (CBIS)
--------------------------------------------------------------------------------
End of Day: $ Close: 0.560 Volume: 352,973
$ Change: -0.090 % Change: -13.846
Dollar Volume: 197,665
--------------------------------------------------------------------------------
3 Month : $ High 1.220 Volume 3m avg: 269,917
$ Low: 0.070 % Change 3m: 2.196
Dollar Volume 3 m: 115,185
--------------------------------------------------------------------------------
Compensation: Alpha Trade - $5,000 in cash
30.771
Company: Ecosphere Technologies Inc. (ESPH)
--------------------------------------------------------------------------------
End of Day: $ Close: 0.400 Volume: 200,589
$ Change: 0.009 % Change: 2.302
Dollar Volume: 80,236
--------------------------------------------------------------------------------
3 Month : $ High 0.495 Volume 3m avg: 171,062
$ Low: 0.370 % Change 3m: -0.005
Dollar Volume 3 m: 74,014
--------------------------------------------------------------------------------
Compensation: Wall Street Resources - $15,000 in cash and 200,000 shares of 144 restricted stock
17.261
Company: Rxi Pharmaceuticals Corp. (RXII)
--------------------------------------------------------------------------------
End of Day: $ Close: 3.580 Volume: 47,154
$ Change: -0.120 % Change: -3.243
Dollar Volume: 168,811
--------------------------------------------------------------------------------
3 Month : $ High 7.390 Volume 3m avg: 40,868
$ Low: 3.180 % Change 3m: -0.229
Dollar Volume 3 m: 192,850
--------------------------------------------------------------------------------
Compensation: Red Chip Companies - $10,000 per month
15.382
Company: Trilliant Exploration Corp. (TTXP)
--------------------------------------------------------------------------------
End of Day: $ Close: 0.250 Volume: 23,035
$ Change: -0.030 % Change: -10.714
Dollar Volume: 5,759
--------------------------------------------------------------------------------
3 Month : $ High 1.700 Volume 3m avg: 20,554
$ Low: 0.250 % Change 3m: -2.564
Dollar Volume 3 m: 15,995
--------------------------------------------------------------------------------
Compensation: Alpha Trade - 100,000 registered and unrestricted shares of stock from a third party, and 500,000 unregistered and restricted
12.071
Company: Contracted Services Inc. (CSEV)
--------------------------------------------------------------------------------
End of Day: $ Close: 1.020 Volume: 500
$ Change: -0.030 % Change: -2.857
Dollar Volume: 510
--------------------------------------------------------------------------------
3 Month : $ High 1.050 Volume 3m avg: 500
$ Low: 1.020 % Change 3m: -0.952
Dollar Volume 3 m: 520
--------------------------------------------------------------------------------
Compensation: Market-Pulse - twenty thousand dollars
0.000
Company: Nxt Nutritionals Holdings Inc. (NXTH)
--------------------------------------------------------------------------------
End of Day: $ Close: 1.560 Volume: 32,015
$ Change: 0.040 % Change: 2.632
Dollar Volume: 49,943
--------------------------------------------------------------------------------
3 Month : $ High 1.560 Volume 3m avg: 33,435
$ Low: 0.720 % Change 3m: 1.575
Dollar Volume 3 m: 35,972
--------------------------------------------------------------------------------
Compensation: Emerging Markets Consulting - $25,000
-4.247
Company: Decisionpoint Systems Inc. (DNPI)
--------------------------------------------------------------------------------
End of Day: $ Close: 0.650 Volume: 9,750
$ Change: 0.010 % Change: 1.562
Dollar Volume: 6,338
--------------------------------------------------------------------------------
3 Month : $ High 1.250 Volume 3m avg: 11,023
$ Low: 0.219 % Change 3m: 31.854
Dollar Volume 3 m: 9,589
--------------------------------------------------------------------------------
Compensation: Stock Guru - twenty-five thousand restricted 144 shares
-11.549
Company: Cobra Oil & Gas Company (CGCA)
--------------------------------------------------------------------------------
End of Day: $ Close: 1.150 Volume: 1,067,028
$ Change: -0.135 % Change: -10.506
Dollar Volume: 1,227,082
--------------------------------------------------------------------------------
3 Month : $ High 1.550 Volume 3m avg: 1,207,854
$ Low: 0.460 % Change 3m: 2.966
Dollar Volume 3 m: 948,434
--------------------------------------------------------------------------------
Compensation: Alpha Trade - $5,000 in cash
-11.659
Company: Ventana Biotech Inc. (VNTA)
--------------------------------------------------------------------------------
End of Day: $ Close: 0.510 Volume: 299,865
$ Change: -0.140 % Change: -21.538
Dollar Volume: 152,931
--------------------------------------------------------------------------------
3 Month : $ High 2.500 Volume 3m avg: 348,496
$ Low: 0.450 % Change 3m: -3.444
Dollar Volume 3 m: 268,150
--------------------------------------------------------------------------------
Compensation: College Stock - $25,000
-13.954
Company: Northern Oil & Gas Inc (NOG)
--------------------------------------------------------------------------------
End of Day: $ Close: 6.710 Volume: 221,943
$ Change: 0.120 % Change: 1.821
Dollar Volume: 1,489,238
--------------------------------------------------------------------------------
3 Month : $ High 8.340 Volume 3m avg: 263,862
$ Low: 5.190 % Change 3m: 0.426
Dollar Volume 3 m: 1,761,363
--------------------------------------------------------------------------------
Compensation: Wall Street Resources - $25,000 in cash and 15,000 shares of 144 restricted stock
-15.887
Company: Bulova Technologies Group Inc (BLVT)
--------------------------------------------------------------------------------
End of Day: $ Close: 0.530 Volume: 12,250
$ Change: -0.450 % Change: -45.918
Dollar Volume: 6,493
--------------------------------------------------------------------------------
3 Month : $ High 2.450 Volume 3m avg: 14,793
$ Low: 0.530 % Change 3m: -1.709
Dollar Volume 3 m: 20,943
--------------------------------------------------------------------------------
Compensation: Alpha Trade - 100,000 registered and unrestricted shares of stock
-17.191
Company: Access Pharmaceuticals Inc. (ACCP)
--------------------------------------------------------------------------------
End of Day: $ Close: 4.650 Volume: 36,640
$ Change: 0.150 % Change: 3.333
Dollar Volume: 170,376
--------------------------------------------------------------------------------
3 Month : $ High 4.650 Volume 3m avg: 46,307
$ Low: 1.250 % Change 3m: 2.277
Dollar Volume 3 m: 102,960
--------------------------------------------------------------------------------
Compensation: OTC Picks - three thousand five hundred dollars
-20.877
Company: Nymet Holdings Inc (NYMH)
--------------------------------------------------------------------------------
End of Day: $ Close: 0.130 Volume: 22,245
$ Change: 0.020 % Change: 18.182
Dollar Volume: 2,892
--------------------------------------------------------------------------------
3 Month : $ High 0.180 Volume 3m avg: 28,431
$ Low: 0.040 % Change 3m: 5.274
Dollar Volume 3 m: 3,119
--------------------------------------------------------------------------------
Compensation: Best Damn Stocks - fifteen thousand dollars
-21.757
Company: Zagg Inc. (ZAGG)
--------------------------------------------------------------------------------
End of Day: $ Close: 6.170 Volume: 198,351
$ Change: -0.200 % Change: -3.140
Dollar Volume: 1,223,826
--------------------------------------------------------------------------------
3 Month : $ High 7.550 Volume 3m avg: 294,757
$ Low: 2.940 % Change 3m: 1.375
Dollar Volume 3 m: 1,648,544
--------------------------------------------------------------------------------
Compensation: Red Chip Companies - $6,750 in cash and a one-year warrant to purchase 20,000 shares
-32.707
Company: Icc Worldwide Inc (ICCW)
--------------------------------------------------------------------------------
End of Day: $ Close: 0.006 Volume: 40,000
$ Change: 0.000 % Change: 0.000
Dollar Volume: 240
--------------------------------------------------------------------------------
3 Month : $ High 0.009 Volume 3m avg: 60,133
$ Low: 0.003 % Change 3m: 3.232
Dollar Volume 3 m: 343
--------------------------------------------------------------------------------
Compensation: Small Cap Voice - $10,000
-33.481
Company: Single Touch Systems Inc. (SITO)
--------------------------------------------------------------------------------
End of Day: $ Close: 1.050 Volume: 8,600
$ Change: -0.180 % Change: -14.634
Dollar Volume: 9,030
--------------------------------------------------------------------------------
3 Month : $ High 1.690 Volume 3m avg: 14,571
$ Low: 0.950 % Change 3m: -0.406
Dollar Volume 3 m: 17,925
--------------------------------------------------------------------------------
Compensation: Small Cap Voice - $10,000
-40.978
Company: Gws Technologies Inc. (GWSC)
--------------------------------------------------------------------------------
End of Day: $ Close: 1.350 Volume: 69,515
$ Change: -0.010 % Change: -0.735
Dollar Volume: 93,845
--------------------------------------------------------------------------------
3 Month : $ High 3.270 Volume 3m avg: 124,645
$ Low: 0.200 % Change 3m: 6.120
Dollar Volume 3 m: 144,119
--------------------------------------------------------------------------------
Compensation: Small Cap Voice - $40,000 from the company and 150,000 restricted shares subject to Rule 144
-44.230
Company: China Direct Industries Inc. (CDII)
--------------------------------------------------------------------------------
End of Day: $ Close: 1.880 Volume: 394,603
$ Change: 0.030 % Change: 1.622
Dollar Volume: 741,854
--------------------------------------------------------------------------------
3 Month : $ High 2.240 Volume 3m avg: 744,168
$ Low: 1.240 % Change 3m: 1.068
Dollar Volume 3 m: 1,172,286
--------------------------------------------------------------------------------
Compensation: Alpha Trade - 12,000 Series C preferred shares
-46.974
Company: Industrial Nanotech Inc (INTK)
--------------------------------------------------------------------------------
End of Day: $ Close: 0.028 Volume: 264,700
$ Change: -0.002 % Change: -6.667
Dollar Volume: 7,412
--------------------------------------------------------------------------------
3 Month : $ High 0.048 Volume 3m avg: 512,384
$ Low: 0.027 % Change 3m: -0.043
Dollar Volume 3 m: 17,754
--------------------------------------------------------------------------------
Compensation: Stock Guru - nine thousand dollars and 100,000 144 restricted common shares
-48.340
Company: Ronn Motor Company (RNNM)
--------------------------------------------------------------------------------
End of Day: $ Close: 0.280 Volume: 17,700
$ Change: -0.010 % Change: -3.448
Dollar Volume: 4,956
--------------------------------------------------------------------------------
3 Month : $ High 0.350 Volume 3m avg: 48,743
$ Low: 0.260 % Change 3m: -0.021
Dollar Volume 3 m: 14,449
--------------------------------------------------------------------------------
Compensation: HotShotStocks.com - $4,000.00
-63.687
Company: edoorways Corp. (EDWY)
--------------------------------------------------------------------------------
End of Day: $ Close: 0.022 Volume: 1,829,915
$ Change: -0.001 % Change: -2.222
Dollar Volume: 40,258
--------------------------------------------------------------------------------
3 Month : $ High 0.040 Volume 3m avg: 5,172,551
$ Low: 0.002 % Change 3m: 8.004
Dollar Volume 3 m: 85,904
--------------------------------------------------------------------------------
Compensation: Investors Voice - 750,000 free trading shares
HotShotStocks.com - 3,000,000FREE Trading Shares.
-64.623
Company: Goldpoint Resources Inc. (GPNT)
--------------------------------------------------------------------------------
End of Day: $ Close: 0.450 Volume: 5,000
$ Change: 0.000 % Change: 0.000
Dollar Volume: 2,250
--------------------------------------------------------------------------------
3 Month : $ High 0.750 Volume 3m avg: 14,784
$ Low: 0.100 % Change 3m: 13.959
Dollar Volume 3 m: 6,954
--------------------------------------------------------------------------------
Compensation: Alpha Trade - $5,000 in cash
-66.179
Company: Advanced Growing Systems Inc. (AGWS)
--------------------------------------------------------------------------------
End of Day: $ Close: 0.040 Volume: 18,000
$ Change: -0.040 % Change: -50.000
Dollar Volume: 720
--------------------------------------------------------------------------------
3 Month : $ High 0.100 Volume 3m avg: 61,650
$ Low: 0.035 % Change 3m: -1.485
Dollar Volume 3 m: 4,822
--------------------------------------------------------------------------------
Compensation: Wall Street Resources - $15,000 in cash and 50,000 shares of 144 restricted stock
-70.803
Company: Hs3 Technologies Inc. (HSTH)
--------------------------------------------------------------------------------
End of Day: $ Close: 0.060 Volume: 9,900
$ Change: 0.005 % Change: 9.091
Dollar Volume: 594
--------------------------------------------------------------------------------
3 Month : $ High 0.120 Volume 3m avg: 52,073
$ Low: 0.030 % Change 3m: 2.924
Dollar Volume 3 m: 3,332
--------------------------------------------------------------------------------
Compensation: Wall Street Resources - $18,000 in cash and 890,000 shares of 144 restricted stock
-80.988
Company: Geltech Solutions Inc. (GLTC)
--------------------------------------------------------------------------------
End of Day: $ Close: 1.900 Volume: 1,100
$ Change: 0.050 % Change: 2.703
Dollar Volume: 2,090
--------------------------------------------------------------------------------
3 Month : $ High 2.200 Volume 3m avg: 6,030
$ Low: 1.560 % Change 3m: 0.011
Dollar Volume 3 m: 11,265
--------------------------------------------------------------------------------
Compensation: Wall Street Resources - 35,000 shares of 144 restricted stock
-81.758
Company: Bergamo Acquisition Corp. (BGMO)
--------------------------------------------------------------------------------
End of Day: $ Close: 0.270 Volume: 17,100
$ Change: 0.020 % Change: 8.000
Dollar Volume: 4,617
--------------------------------------------------------------------------------
3 Month : $ High 0.500 Volume 3m avg: 95,639
$ Low: 0.069 % Change 3m: 4.313
Dollar Volume 3 m: 19,665
--------------------------------------------------------------------------------
Compensation: Stock Guru - $18,000 cash and 600,000 restricted 144 shares by BGMO.
-82.120
Company: Medizone International Inc. (MZEI)
--------------------------------------------------------------------------------
End of Day: $ Close: 0.070 Volume: 34,300
$ Change: -0.010 % Change: -12.500
Dollar Volume: 2,401
--------------------------------------------------------------------------------
3 Month : $ High 0.150 Volume 3m avg: 298,850
$ Low: 0.032 % Change 3m: 1.994
Dollar Volume 3 m: 24,802
--------------------------------------------------------------------------------
Compensation: Stock Guru - seventy-two hundred dollars and 200,000 144 restricted common shars
Earnings Schedule dated ~ 08/04/09 ~
Company Name Symbol Date Time Estimate YrAgo
3-D Sys Corp Del TDSC 8/4 B -0.04 -0.15
Acroda Therapeutics IncACOR 8/4 B -0.55 -0.58
Allegheny Energy Inc AYE 8/4 B 0.43 0.45
Archer Daniels Midland ADM 8/4 B 0.44 0.58
Arvinmeritor Inc ARM 8/4 B -0.31 0.77
Atricure Inc ATRC 8/4 B -0.08 -0.11
Barrett Bill Corp BBG 8/4 B 0.38 0.75
Beasley Broadcast GroupBBGI 8/4 B 0.00 0.10
Berry Pete Co BRY 8/4 B 0.29 1.08
Cameron International CCAM 8/4 B 0.47 0.65
Cincinnati Bell Inc NewCBB 8/4 B 0.10 0.10
Cognizant Technology SoCTSH 8/4 B 0.37 0.35
Colfax Corp CFX 8/4 B 0.25 0.32
Cvs Corp CVS 8/4 B 0.64 0.60
D R Horton Inc DHI 8/4 B -0.23 -1.26
Datawatch Corp DWCH 8/4 B n/a 0.02
Denbury Res Inc DNR 8/4 B 0.17 0.53
Diebold Inc DBD 8/4 B 0.33 0.66
Domtar Corp UFS 8/4 B -0.70 0.06
Duke Energy Corp New DUK 8/4 B 0.26 0.27
Emergency Medical Svcs EMS 8/4 B 0.52 0.43
Emerson Elec Co EMR 8/4 B 0.57 0.82
Endeavour Intl Corp END 8/4 B 0.00 0.02
Enpro Inds Inc NPO 8/4 B 0.29 1.38
Enzon Pharmaceuticals IENZN 8/4 B -0.02 -0.04
Expeditors Intl Wash InEXPD 8/4 B 0.25 0.32
Frontier CommunicationsFTR 8/4 B 0.13 0.17
Fti Consulting Inc FCN 8/4 B 0.65 0.66
Fundtech Ltd FNDT 8/4 B 0.08 0.18
Fuwei Films Hldgs Co LtFFHL 8/4 B n/a 0.11
Gartner Inc IT 8/4 B 0.17 0.30
Gaylord Entmt Co New GET 8/4 B 0.11 0.21
Genpact Limited G 8/4 B 0.14 0.11
Glatfelter GLT 8/4 B 0.01 0.06
Great Lakes Dredge & DoGLDD 8/4 B 0.06 0.05
Hcp Inc HCP 8/4 B 0.51 0.51
Headwaters Inc HDWR 8/4 B 0.47 0.31
Health Net Inc HNT 8/4 B 0.52 0.74
Heartland Pmt Sys Inc HPY 8/4 B 0.24 0.30
Hewitt Assocs Inc HEW 8/4 B 0.60 0.53
Icagen Inc ICGN 8/4 B -0.09 -0.08
Iconix Brand Group Inc ICON 8/4 B 0.30 0.27
Immucell Corp ICCC 8/4 B n/a -0.08
Intelli-Check Inc IDN 8/4 B n/a -0.01
Landauer Inc LDR 8/4 B 0.64 0.62
Lnb Bancorp Inc LNBB 8/4 B 0.02 -0.16
Macerich Co MAC 8/4 B 1.00 1.16
Magic Software EnterpriMGIC 8/4 B n/a 0.05
Martin Marietta Matls IMLM 8/4 B 0.77 1.39
Marvel Entertainment InMVL 8/4 B 0.31 0.59
Matrix Svc Co MTRX 8/4 B 0.26 0.34
Max Re Capital Ltd HamiMXGL 8/4 B 0.74 1.29
Mednax Inc MD 8/4 B 0.86 0.80
Mitsui & Co Ltd MITSY 8/4 B n/a n/a
Nisource Inc NI 8/4 B 0.01 0.08
Nmt Med Inc NMTI 8/4 B -0.20 -0.43
Northwest Nat Gas Co NWN 8/4 B 0.17 0.08
Nova Measuring InstrumeNVMI 8/4 B n/a -0.07
Och-Ziff Capital ManageOZM 8/4 B 0.06 0.13
Pantry Inc PTRY 8/4 B 0.45 0.48
Par Pharmaceutical Cos PRX 8/4 B 0.48 -0.59
Perot Sys Corp PER 8/4 B 0.24 0.24
Philippine Long DistancPHI 8/4 B n/a 1.06
Phoenix Cos Inc New PNX 8/4 B 0.09 0.13
Playboy Enterprises IncPLA 8/4 B -0.23 -0.06
Powell Inds Inc POWL 8/4 B 0.71 0.69
Ppl Corp PPL 8/4 B 0.40 0.50
Prg-Schultz InternationPRGXD 8/4 B 0.12 0.20
Rcn Corp RCNI 8/4 B -0.35 -0.45
Rowan Cos Inc RDC 8/4 B 0.75 1.05
Rti Intl Metals Inc RTI 8/4 B -0.02 0.81
Schein Henry Inc HSIC 8/4 B 0.76 0.71
Senomyx Inc SNMX 8/4 B -0.21 -0.25
Simon Ppty Group Inc NeSPG 8/4 B 1.37 1.49
Skilled Healthcare GrouSKH 8/4 B 0.25 0.24
Spectra Energy Corp SE 8/4 B 0.20 0.44
St Joe Co JOE 8/4 B -0.16 -0.23
Statoil Asa STO 8/4 B 0.36 1.16
Synta Pharmaceuticals CSNTA 8/4 B -0.34 -0.67
Tenet Healthcare Corp THC 8/4 B -0.01 -0.02
Tohto Suisan Co Ltd TOHSF.PK 8/4 B n/a n/a
Top Ships Inc TOPSD 8/4 B -0.05 0.04
Toyota Motor Corp TM 8/4 B -2.09 2.15
Transdigm Group Inc TDG 8/4 B 0.79 0.75
Trimas Corp TRS 8/4 B 0.03 0.32
Trinity Biotech Plc TRIB 8/4 B 0.10 0.07
Trw Automotive Hldgs CoTRW 8/4 B -0.83 1.24
Twin Disc Inc TWIN 8/4 B 0.18 0.62
Txu Corp TXU 8/4 B n/a n/a
Ubs Ag UBS 8/4 B -0.13 -0.16
Universal Technical InsUTI 8/4 B 0.02 -0.03
Vornado Rlty Tr VNO 8/4 B 1.09 1.27
W & T Offshore Inc WTI 8/4 B -0.48 1.86
West Pharmaceutical SvsWST 8/4 B 0.53 0.73
Westlake Chem Corp WLK 8/4 B 0.11 0.68
Yapi Ve Kredi Bankasi AYVKBY 8/4 B n/a n/a
Zebra Technologies CorpZBRA 8/4 B 0.20 0.44
Allied Healthcare Intl AHCI 8/4 D 0.05 0.05
Allied Motion TechnologAMOT 8/4 D n/a 0.13
Allos Therapeutics Inc ALTH 8/4 D -0.17 -0.16
American Pac Corp APFC 8/4 D -0.23 0.02
Answers Corp ANSW 8/4 D 0.06 -0.11
Asta Fdg Inc ASFI 8/4 D -0.25 0.17
California Micro DeviceCAMD 8/4 D -0.14 -0.04
Capital Southwest Corp CSWC 8/4 D n/a 0.17
Capitol Fed Finl CFFN 8/4 D 0.24 0.20
Cedar Fair L P FUN 8/4 D 0.30 0.32
Chromcraft Revington InCRC 8/4 D n/a -1.32
Church & Dwight Inc CHD 8/4 D 0.79 0.66
Commvault Systems Inc CVLT 8/4 D 0.10 0.12
Companhia Brasileira DeCBD 8/4 D 0.49 0.31
Conseco Inc CNO 8/4 D 0.22 0.18
Consolidated Edison IncED 8/4 D 0.49 0.42
Corvel Corp CRVLE 8/4 D n/a 0.40
Cray Inc CRAYD 8/4 D 0.00 -0.15
Curagen Corp CRGN 8/4 D -0.10 -0.39
Embratel Participacoes EMT 8/4 D n/a n/a
Entergy Corp New ETR 8/4 D 1.26 1.46
First Merchants Corp FRME 8/4 D 0.01 0.36
Gasco Energy Inc GSX 8/4 D 0.01 0.03
Global Cash Access HldgGCA 8/4 D 0.18 0.17
Houston Amern Energy CoHUSA 8/4 D -0.01 0.11
Hypercom Corp HYC 8/4 D -0.09 -0.20
I-Flow Corp IFLO 8/4 D 0.03 0.03
Impax Laboratories Inc IPXL 8/4 D 0.03 0.29
Inergy Hldgs L P NRGP 8/4 D 0.23 0.27
Inergy Hldgs L P NRGP 8/4 D 0.23 0.27
Infogroup Inc IUSA 8/4 D 0.10 0.08
Innospec Inc IOSP 8/4 D 0.06 0.07
Investors Title Co ITIC 8/4 D 0.58 -0.11
Ipg Photonics Corp IPGP 8/4 D -0.02 0.19
Itau Unibanco Banco MulITUB 8/4 D 0.24 0.42
Kindred Healthcare Inc KND 8/4 D 0.35 0.33
Kite Rlty Group Tr KRG 8/4 D 0.15 0.31
Knology Inc KNOL 8/4 D 0.05 -0.11
Kopin Corp KOPN 8/4 D n/a -0.02
Lionbridge TechnologiesLIOX 8/4 D -0.05 0.02
Louisiana Pac Corp LPX 8/4 D -0.33 -0.34
Mac-Gray Corp TUC 8/4 D 0.07 -0.03
Market Leader Inc LEDR 8/4 D n/a -0.05
Monterey Gourmet Foods PSTA 8/4 D -0.01 -0.01
Multi Color Corp LABL 8/4 D 0.30 0.23
Numerex Corp Pa NMRX 8/4 D -0.02 0.02
Ocwen Finl Corp OCN 8/4 D 0.22 0.00
Onyx Pharmaceuticals InONXX 8/4 D 0.14 0.08
Outdoor Channel Hldgs IOUTD 8/4 D -0.04 0.01
Pinnacle West Cap Corp PNW 8/4 D 0.87 1.03
Presstek Inc PRST 8/4 D -0.02 0.02
Progress Energy Inc PGN 8/4 D 0.69 0.77
Riskmetrics Group Inc RMG 8/4 D 0.12 0.08
Royal Std Minerals Inc RYSMF 8/4 D n/a n/a
Ruddick Corp RDK 8/4 D 0.46 0.51
Sciclone PharmaceuticalSCLN 8/4 D 0.02 -0.01
Sothebys Hldgs Inc BID 8/4 D 0.28 1.28
Southwest Bancorp Inc OOKSB 8/4 D -0.16 0.28
Southwest Gas Corp SWX 8/4 D -0.02 -0.06
Spdr Index Shs Fds BIK 8/4 D -0.17 -0.09
Strattec Sec Corp STRT 8/4 D -0.82 -0.27
Techne Corp TECH 8/4 D 0.69 0.70
Thomas Group Inc TGIS 8/4 D -0.11 -0.17
Valeant PharmaceuticalsVRX 8/4 D 0.44 -0.06
Vicor Corp VICR 8/4 D -0.01 -0.03
Volcano Corporation VOLC 8/4 D -0.11 -0.03
Advisory Brd Co ABCO 8/4 A 0.24 0.36
Albany Molecular Resh IAMRI 8/4 A 0.09 0.24
American Cap Ltd ACAS 8/4 A 0.22 0.71
American Eqty Invt LifeAEL 8/4 A 0.40 0.33
American Med Sys Hldgs AMMD 8/4 A 0.24 0.19
American Physicians SvcAMPH 8/4 A 0.67 0.95
American Public EducatiAPEI 8/4 A 0.27 0.21
Apac Customer Services APAC 8/4 A 0.12 0.00
Approach Resources Inc AREX 8/4 A 0.04 0.35
Atmos Energy Corp ATO 8/4 A -0.07 -0.07
Avis Budget Group CAR 8/4 A -0.15 0.16
Bgc Partners Inc BGCP 8/4 A 0.09 0.17
Big 5 Sporting Goods CoBGFV 8/4 A 0.15 0.08
Bigband Networks Inc BBND 8/4 A 0.03 0.07
Bio Rad Labs Inc BIO 8/4 A 1.06 1.58
Bioclinica Inc BIOC 8/4 A 0.03 0.07
Bmc Software Inc BMC 8/4 A 0.49 0.43
Boston Beer Inc SAM 8/4 A 0.62 0.79
Bre Properties Inc BRE 8/4 A 0.61 0.70
Buckeye Technologies InBKI 8/4 A 0.08 0.24
Cambrex Corp CBM 8/4 A 0.10 0.09
Capital Sr Living Corp CSU 8/4 A 0.04 0.05
Capital Trust Inc Md CT 8/4 A -0.56 -1.59
Caribou Coffee Company CBOU 8/4 A 0.00 -0.13
Catalyst Health SolutioCHSI 8/4 A 0.34 0.28
Cbl & Assoc Pptys Inc CBL 8/4 A 0.63 0.81
Cephalon Inc CEPH 8/4 A 1.30 1.13
Charles Riv Labs Intl ICRL 8/4 A 0.58 0.79
Chromavision Med Sys InCVSN 8/4 A 0.00 -0.06
Cogent Inc COGT 8/4 A 0.10 0.08
Coinstar Inc CSTR 8/4 A 0.17 0.09
Commercial Veh Group InCVGI 8/4 A -0.35 0.14
Ctrip Com Intl Ltd CTRP 8/4 A 0.28 0.25
Davita Inc DVA 8/4 A 0.95 0.90
Dennys Corp DENN 8/4 A 0.06 0.03
Dolan Media Co DM 8/4 A 0.18 0.17
Dollar Thrifty AutomotiDTG 8/4 A -0.23 -0.23
Douglas Emmett Inc DEI 8/4 A 0.32 0.33
Dupont Fabros TechnologDFT 8/4 A 0.27 0.35
Edgar Online Inc EDGR 8/4 A -0.03 -0.03
Electronic Arts Inc ERTS 8/4 A -0.14 -0.42
Esco Technologies Inc ESE 8/4 A 0.55 0.50
Evolving Sys Inc EVOLD 8/4 A 0.14 0.08
Exco Resources Inc XCO 8/4 A 0.24 0.34
Facet Biotech Corp FACT 8/4 A -1.22 n/a
Federal Realty Invt Tr FRT 8/4 A 0.94 0.96
First Industrial RealtyFR 8/4 A 0.33 1.16
Five Star Quality Care FVE 8/4 A 0.12 0.16
Franklin Street Pptys CFSP 8/4 A 0.25 0.29
Genomic Health Inc GHDX 8/4 A -0.13 -0.15
Georgia Gulf Corp GGC 8/4 A -11.25 -0.04
Getty Rlty Corp New GTY 8/4 A 0.46 0.49
Giga Tronics Inc GIGA 8/4 A n/a -0.11
Gladstone Invt Corp GAIN 8/4 A 0.19 0.17
Gt Solar Intl Inc SOLR 8/4 A 0.06 0.03
Guidance Software Inc GUID 8/4 A -0.04 -0.02
Hansen Medical Inc HNSN 8/4 A -0.42 -0.61
Hcc Ins Hldgs Inc HCC 8/4 A 0.70 0.80
Hersha Hospitality Tr HT-A 8/4 A 0.23 0.43
Hill International Inc HIL 8/4 A 0.10 0.09
I D Systems Inc IDSY 8/4 A -0.17 -0.06
Insulet Corp PODD 8/4 A -0.68 -0.87
Jack In The Box Inc JACK 8/4 A 0.58 0.51
Jones Lang Lasalle Inc JLL 8/4 A 0.16 0.73
Kenexa Corp KNXA 8/4 A 0.15 0.39
Kforce Inc KFRC 8/4 A 0.06 0.22
Kraft Foods Inc KFT 8/4 A 0.54 0.58
Lhc Group Inc LHCG 8/4 A 0.53 0.35
Liberty Global Inc LBTYA 8/4 A -0.06 1.11
Liveperson Inc LPSN 8/4 A 0.05 0.04
Mannatech Inc MTEX 8/4 A n/a -0.40
Mercury Computer Sys MRCY 8/4 A 0.07 -0.90
Mod Pac Corp MPAC 8/4 A n/a -0.16
Molex Inc MOLXE 8/4 A -0.07 0.41
Molina Healthcare Inc MOH 8/4 A 0.59 0.59
Nanophase Tchnologies CNANX 8/4 A n/a -0.04
National Finl Partners NFP 8/4 A 0.46 0.64
National Interstate CorNATL 8/4 A 0.46 0.23
National Research Corp NRCI 8/4 A 0.33 0.23
Nektar Therapeutics NKTR 8/4 A -0.41 -0.36
New York Mtg Tr Inc NYMT 8/4 A n/a n/a
Ngas Resources Inc NGAS 8/4 A -0.02 0.06
Odyssey Healthcare Inc ODSY 8/4 A 0.23 0.12
Oneok Inc New OKE 8/4 A 0.28 0.39
Optelecom Nkf Inc OPTC 8/4 A n/a 0.01
Orion Energy Systems InOESX 8/4 A -0.09 0.00
Papa Johns Intl Inc PZZA 8/4 A 0.34 0.41
Pericom Semiconductor CPSEM 8/4 A 0.03 0.17
Pioneer Nat Res Co PXD 8/4 A -0.20 1.31
Pioneer Southwst Enrg PPSE 8/4 A 0.58 0.88
Planar Sys Inc PLNR 8/4 A -0.19 -3.46
Plx Technology Inc PLXT 8/4 A -0.11 0.04
Poniard PharmaceuticalsPARD 8/4 A -0.34 -0.36
Protective Life Corp PL 8/4 A 0.77 0.96
S1 Corporation SONE 8/4 A 0.11 0.09
Spss Inc SPSS 8/4 A 0.42 0.41
Stanley Inc SXE 8/4 A 0.41 0.35
Ternium Sa TX 8/4 A 2.64 2.07
Tessera Technologies InTSRA 8/4 A 0.14 0.00
Tns Inc TNS 8/4 A 0.44 0.43
True Religion Apparel ITRLG 8/4 A 0.38 0.39
Udr Inc UDR 8/4 A 0.31 0.36
Unumprovident Corp UNM 8/4 A 0.61 0.65
Valueclick Inc VCLK 8/4 A 0.14 0.17
Web Com Inc WWWW 8/4 A 0.16 0.18
Weyco Group Inc WEYS 8/4 A n/a 0.34
Whole Foods Mkt Inc WFMI 8/4 A 0.19 0.24
Xerium Technologies IncXRM 8/4 A -0.04 0.31
Yamana Gold Inc AUY 8/4 A 0.10 0.15
Ziprealty Inc ZIPR 8/4 A -0.07 -0.08
*** A = After market hours B = Before market hours D = During market hours U = Time unknown ***
Good information, thank you.
Perhaps because it was a duplicate post? I covered the share structure earlier...http://investorshub.advfn.com/boards/read_msg.aspx?message_id=40158367
thegreatgate, superb annotations, thank you for sharing them.
The concept of the 'blue sky breakout' is that the sky is the limit. It's difficult to comprehend where the price will peak. A leading indicator will be volume, and the trading session where it begins to decline, imho.
mark5918, my thoughts have not changed since I shared it with subscribers at $0.0042: http://investorshub.advfn.com/boards/read_msg.aspx?message_id=39941618
IDO Security, Inc. continues to rally on strong volume making it an ideal trading vehicle. As a result, the price continues to appreciate.
Posted by: EDWARD STEVENSON Date: Monday, August 03, 2009 3:59:03 PM
In reply to: gap5473 who wrote msg# 4154 Post # of 4299
Remember we discussed two main principles, (1)short-term resistance would be established by intraday highs and (2)critical resistance lies at $0.01, which is also a psychological barrier.
The key to keep in mind: if there is a growing demand for this security, as we have seen in the past few trading sessions, resistance will fall as a result.
http://investorshub.advfn.com/boards/read_msg.aspx?message_id=40158910
How has the small position worked out for you?
Remember we discussed two main principles, (1)short-term resistance would be established by intraday highs and (2)critical resistance lies at $0.01, which is also a psychological barrier.
The key to keep in mind: if there is a growing demand for this security, as we have seen in the past few trading sessions, resistance will fall as a result.
1,974,366,319 issued & outstanding as of 08.03.09 per t/a.
Authorized 2,000,000,000...meaning the company has nearly maxed out.
Mammoth Stock Transfer.
Phone: (732) 872 2727
Out for the remainder of the trading session, will return by this evening.
Most likely an error. Equityfeed is having some difficulties with the otc level two's this session as well...
GSL ~ ($1.57) bullish accumulation continues imho...
IDOI ~ nhod ($0.0081).
When you see $40,000.00 buys coming in like we just had at .0079 and .008 range...you ask yourself, might this be more than a momentum play?
Congratulations madstockscientist, excellent trading!
Heard about that one numerous times now...might take an evening or two to look into it. Thank you for the reminder.
High-Frequency Trading Winners and Losers (WSJ)
by: Michael Steinberg August 02, 2009
The Wall Street Journal’s “What's Behind High-Frequency Trading” provides a pretty good Q&A on how Goldman Sachs (GS), Citadel and various smaller specialty firms take advantage of advanced peaks at orders, exchange rebates and flash orders that can be withdrawn in a split second. A political furor is starting to emerge from highly leveraged firms front running orders and teasing prices fractionally up at the expense of mutual funds and other large institutional investors.
With firms jockeying for the closest physical proximity to the exchanges data centers, NYSE Euronext (NYX) is building a huge data center in New Jersey to accommodate them. The exchange will be renting space in its own multi-football field size data center to house the computers of high-frequency traders. That’s how critical the speed of light along fiber optic cables is to this form of making money.
Aside from some inherent unfairness, what has regulators and politicians concerned? First is leverage, especially with the small firms specializing in this extreme form of programmed trading. Second is the systemic risk of large trades gone wrong. Third is the cascading effect of copy cat strategies. Think of how seriously flawed the portfolio insurance schemes of the 1990s were when they encountered a few black swans.
While mutual funds and large institutions are marginal losers, the exchanges are obvious winners with increased volume. Typically institutional traders don’t use limit orders for fear of tipping their hand, so any market manipulation hurts their clients. In a very real way high-frequency traders, such as Goldman, are trading against their own clients.
The story is mixed for retail investors. Most firms no longer charge higher commissions for limit orders, so higher volatility increases the likelihood that retail orders will be filled. Investors that are not pressured to buy or sell in a certain time frame are clearly winners.
Retail “active” traders that favor market orders could be buying or selling at a slightly disadvantaged price. Also they could be fooled by a false sense of momentum.
Retail investors that are dependent upon gradual investment sales for living expenses are most vulnerable. It can also be said the retail mutual fund shareholders will suffer slightly lower returns. But, investors in low churn funders should not be concerned.
If regulators rein in on this form of front running and insure firms have the capital to cover their risk, I see little harm in high-frequency trading. In many ways high-frequency trading has the same risks and benefits as programmed trading on the news.
Disclosures: none
Interesting find...
Will H1N1 Be an Asian Market Killer?
by: Cam Hui August 03, 2009
Remember SARS? SARS took 2-3% off GDP Asian growth. I don’t know how serious this outbreak of H1N1 swine flu is, but there are indications that Asia is under-reporting the incidence of swine flu.
Damjan DeNoble, who produced the table below, wrote that “reported cases of H1N1 as a percentage of their populations correlate almost exactly with the corruption ranking of each country relative to its neighbors.” In other words, the heavier the level of corruption (I am shocked! shocked I say! that is corruption in China), the more likely it is that they are hiding or under-reporting swine flu cases:
Incidence of Swine Flu by country.
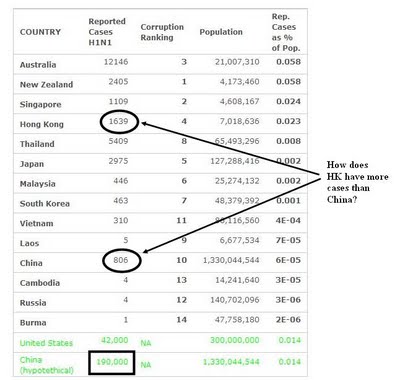
Studying the table above, some questions pop to mind:
How does Hong Kong, which has 0.5% of the population of China, have more reported cases of swine flu than China?
If China actually experiences 190K cases (a conservative estimate), would the markets panic?
As the winter flu season approaches, this could mean trouble.
Awesome, thanks for the update olandug.
Doc take a look at this, "Ford to post 1st monthly sales increase in 2 years."
http://investorshub.advfn.com/boards/read_msg.aspx?message_id=40130766

