 News
News  Market Data
  Discover

Support: 888-992-3836
Copyright © 2023 InvestorsHub Inc.


morpheustrading
![]()
Register for free to join our community of investors and share your ideas. You will also get access to streaming quotes, interactive charts, trades, portfolio, live options flow and more tools.
Register for free to join our community of investors and share your ideas. You will also get access to streaming quotes, interactive charts, trades, portfolio, live options flow and more tools.
How To Swing Trade Stocks - New Video
For those of you who have been reading my educational swing trading and technical analysis posts on this message board, you may be interested in checking out this new 7-minute video I just uploaded to the InvestorsHub video section.
The video is a succinct summary of the key elements of my swing trading system. Hope you find it helpful and useful.
If you have any questions or comments on the video, just reply and let me know.
Enjoy,
Deron
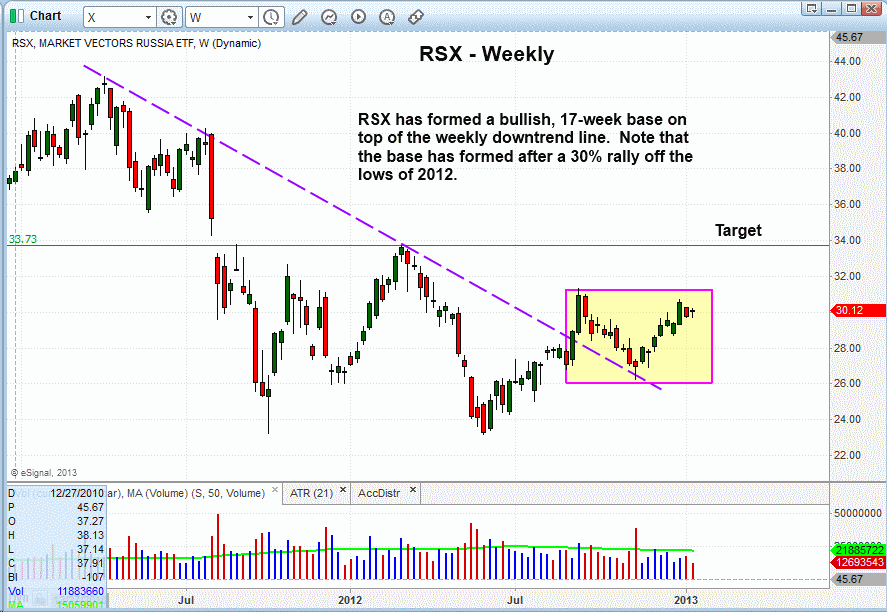
Russian ETF poised for swing trade breakout ($RSX)
The Market Vectors Russia ETF ($RSX) is currently forming a tight-ranged base (similar to a cup and handle chart pattern) on its longer-term weekly chart below. After rallying 30% off its 2012 low, $RSX subsequently pulled back and successfully tested new support (prior resistance) of its multi-year downtrend line, and now is forming the right side of this bullish chart pattern. The annotated chart below illustrates this:
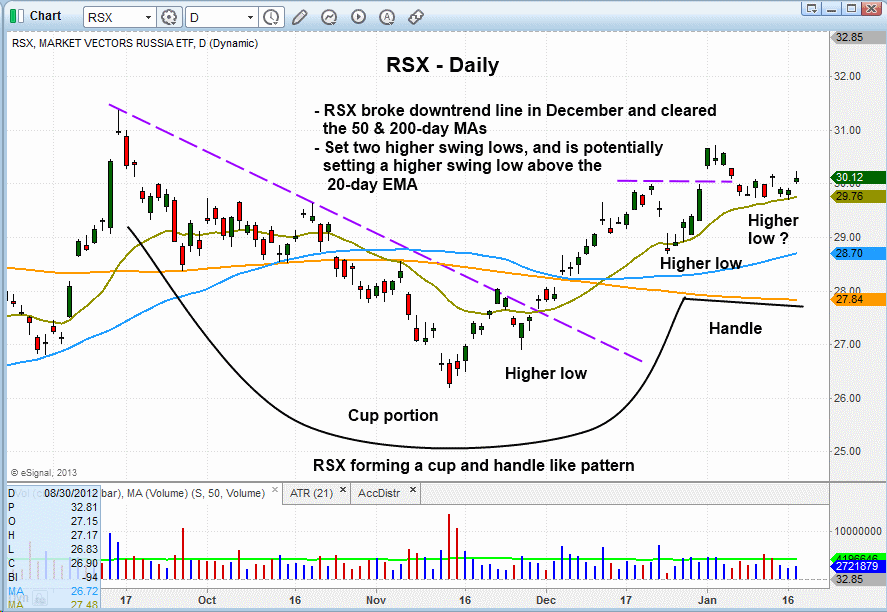
Drilling down to the short-term daily chart interval, the cup and handle pattern can be more easily seen. The “cup” was formed after the low of the pullback that tested the downtrend line on the weekly chart above, and the “handle” has been forming the right side of the chart pattern just below the prior highs from September of 2012:
As recently explained in this educational January 15 post on another InvestorsHub board, there are specific technical requirements that a chart pattern must exhibit before considering the ETF or stock as a potential swing trading breakout candidate.
First, the price action absolutely must stop making “lower highs” and “lower lows,” and eventually break the downtrend line of the pullback from the prior highs. Once this happens, and the price has formed a “higher swing high” and “higher swing low,” we then have something to work with. Without the higher lows or downtrend line break in place, all we have is a chart in a downtrend and showing no signs of bullish momentum. One key rule of our trading system (view 7-minute overview video) is that we do NOT try to predict future price action; rather, we merely react to the trend after it becomes established. As such, we never try to catch the bottom of a rally.
The key moving averages we monitor (20-day EMA, 50-day MA, and 200-day MA) are confirming the recent strength in $RSX. On the daily chart above, notice the 20-day EMA (beige line) crossed above the 50-day MA (teal line) in early December of 2012. Also, the 50-day MA is now above the 200-day MA and trending higher.
In late December, $RSX formed a second higher low, right at near-term technical support of the 20-day EMA, which led to a failed breakout above the prior swing high. However, the pullback from the failed breakout in early January again looks to have found support at the rising 20-day EMA. If this bullish chart pattern is to continue tightening up and forming higher swing lows, then the price action should continue holding above the 20-day EMA. This could lead to a breakout to new highs within the coming days, which is why $RSX has been added to our “official” watchlist as a potential swing trade buy entry. Regular subscribers to our ETF and stock newsletter should note our clearly predefined trigger, stop, and target prices for this trade setup in the ETF Watchlist section of today’s report.
My pleasure. Hope you are finding the content to be educational and helpful.
Have a nice weekend.
Deron
No problem. Glad you find my posts to be of value.
I will continue posting the educational trading posts in this thread, if it's okay with you all.
Quick question, is it against the rules to post a URL in here? As you probably noticed, I am not a hypester or spammer, but sometimes it is appropriate and helpful to post a link to another spot on my trading blog that explains a concept further. However, I wanted to see if that was okay before doing so because I nearly got banned for posting an innocent link on another thread.
Thanks,
Deron
Yeah, KOL has nicely pulled back to the 20-day EMA and now provides a very low-risk swing trade buy entry, with a protective stop just below the swing low. This allows for an overly positive reward-risk ratio.
The setup technically is lacking relative strength to the market, which is one thing we do NOT like about it, BUT we also like the fact it's a pretty low-risk entry with positive reward-risk ratio with entry near here.
By the way, that's one hell of a chart you got going there! My eyes were going buggy. 
Deron
Educational technical review of $EPU swing trade entry
On December 31, 2012, we bought the iShares MSCI All Peru Capped Index ETF ($EPU) as a short to intermediate-term swing trade entry in our nightly ETF and stock trading report. Although the position is still open, the ETF is presently showing an unrealized gain of 4% since our initial buy entry on the last day of 2012. For ETFs, which are typically less volatile than leading individual stocks, that's a solid percentage move over a two-week period. In this post, we take you on an educational walk-through of the technical trading factors that preceded our recent breakout buy entry.
For starters, take a look at the annotated daily chart of $EPU below, which highlights our exact buy entry point, as well as our current target price on the $EPU:
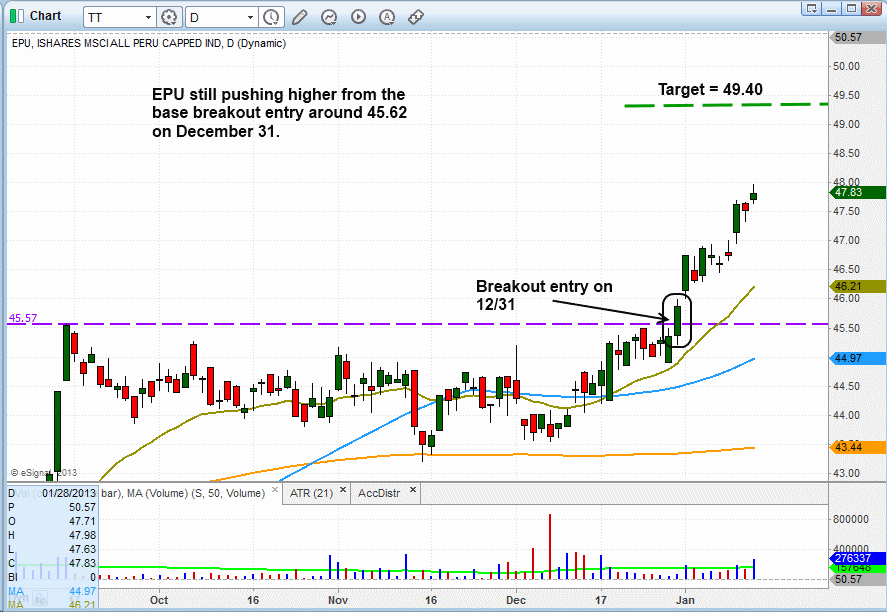
As the chart above illustrates, we bought $EPU on December 31, as the ETF broke out above resistance of the high of its trading range ($45.62). Since then, the price has been pushing steadily higher, and our "official" upside target is now the $49.40 area. Now that you've seen the bullish price action subsequent to the breakout, let's take a more important look at the technical trading criteria that preceded the breakout, which then prompted us to buy the ETF for swing trade entry.
Generally speaking, the price action preceding the late December breakout in $EPU is a good example of the technical factors we look for when stalking an ETF or stock that is trading in a bullish consolidation pattern. Once a clear base of support has formed, we then look for the formation of a "higher swing low" to develop within the base, which lets us know that bullish momentum is on our side. Approximately 90% or more of our ETF and stock breakout entries will have some sort of a "higher swing low" in place prior to our buy entry, and this setup was no different:
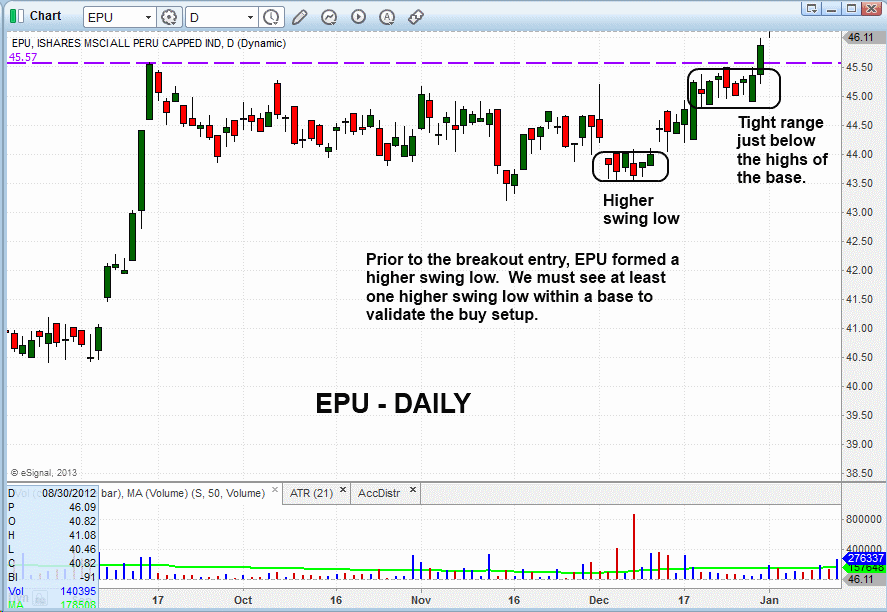
After the higher swing low was established in the first half of December, the next step was to look for a tight then look for a tighter, shorter-term price range to develop just below resistance of the highs of the base. Notice on the chart above that this tight price range developed in the last two weeks of December, as $EPU chopped around just below the $45.50 level. Such price action indicated that a momentum-based breakout above the highs of the trading range was likely to occur in the coming days, so we added $EPU to our "official" newsletter trade watchlist as a potential buy entry, just in time to catch the December 31 breakout.
If $EPU hits our target price at the $49.40 area, we will automatically sell into strength to lock in a sizeable gain on the swing trade. However, in the event price action suddenly starts to weaken along the way, we will simply trail our protective stop tighter to lock in gains in the event of an unexpected bearish reversal. As always, we will keep regular subscribers notified of any changes to management of this ETF trade.
Coal ETF ($KOL) Now A Low-Risk Trade Setup
Market Vectors Coal ETF ($KOL), which we initially pointed out on our January 3 blog post as a potential trend reversal buy setup, continues to chop around in a sideways range since clearing resistance of its 200-day moving average on January 2. However, the ETF may now be providing us with an even lower-risk swing trade entry point than last week.
Over the past two days, $KOL has been trading below the $26.25 – $23.35 breakout pivot (the dashed horizontal line on the chart below). It has also been doing so on lighter volume, which is a positive sign. Now, we would ideally like to see the price action retrace down to its 200-day moving average and form some sort of bullish reversal candlestick pattern. If this occurs, it would subsequently provide us with a very low-risk swing trade buy entry.
The area we are looking at for potential buy trigger is somewhere between the 20-day exponential moving average (beige line) and 200-day moving average (orange line), as annotated on the daily chart of $KOL below:
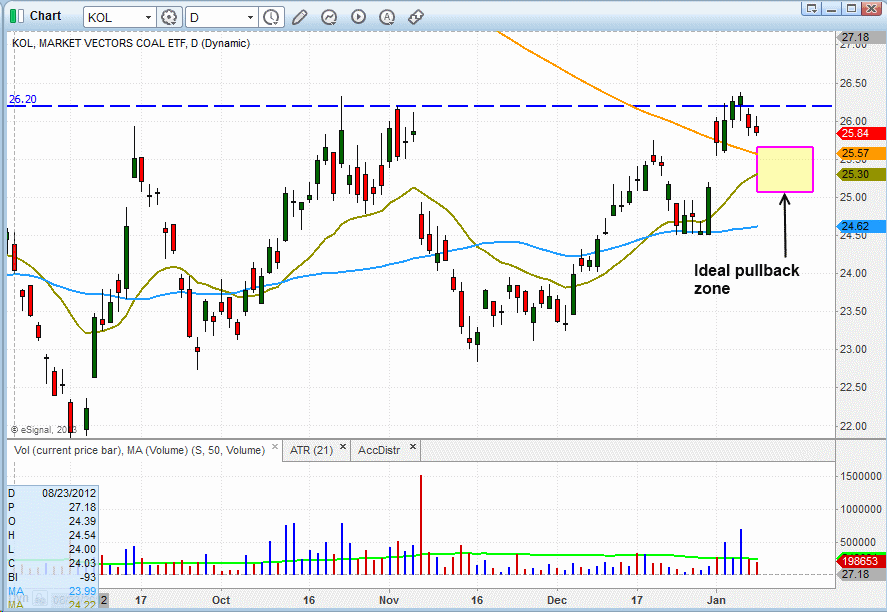
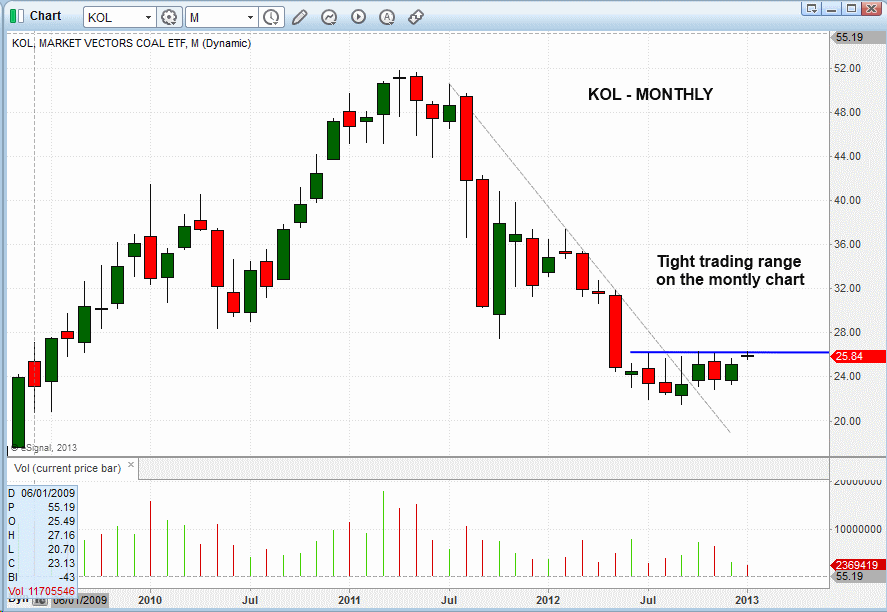
Although we would prefer to enter $KOL as a pullback buy entry, a breakout entry on the next move above the horizontal pivot may be in order if the ETF continues to hold near the highs of its recent range. Zooming out to analyze the longer-term monthly chart of $KOL, the technical pattern becomes even more clear.
After moving above resistance of a downtrend line that was in place for more than a year, $KOL developed a tight base off the lows that has been in place for the past six months. As the above daily chart confirms, the ETF now appears ready to breakout above this extended range. Again, with trend reversal setups, it is crucial to first wait for an extended base to develop at the lows, in order to ensure the ETF has actually found a significant bottom, rather than trying to catch a falling knife:
Based on the follow-up technical analysis above, we are now stalking $KOL for potential buy entry in the coming days. Although we typically focus more on breakout entries and pullback entries of ETFs and individual stocks, we are not afraid to buy when the occasional trend reversal setup with an overly positive reward-risk ratio comes along. As always, subscribers to our swing trading newsletter will be notified beforehand with our exact trigger, stop, and target prices for this ETF trade setup if we make an "official" buy entry.
Ahh, right, the Inverted Spinglefluke...guess I need to brush up on that one.
Why $XHB Is Setup For ETF Swing Trade
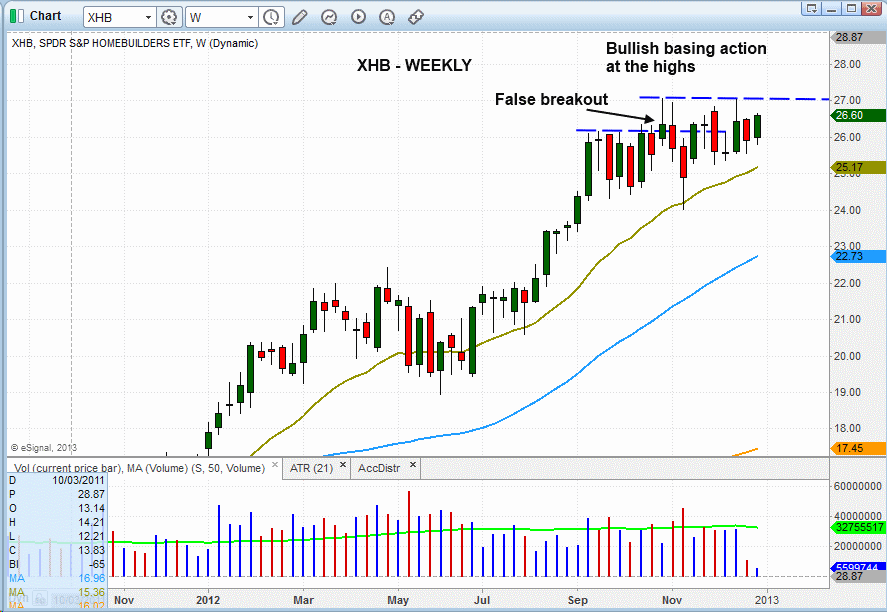
The weekly chart of SPDR S&P Homebuilders ($XHB) shows three months of tight basing action at the highs, with a false breakout in early November of 2012 that led to another nine weeks of consolidation. This is the bullish type of price action that leads to sustainable breakouts and ideal, low-risk swing trade entries. This is shown on the weekly chart of $XHB below:
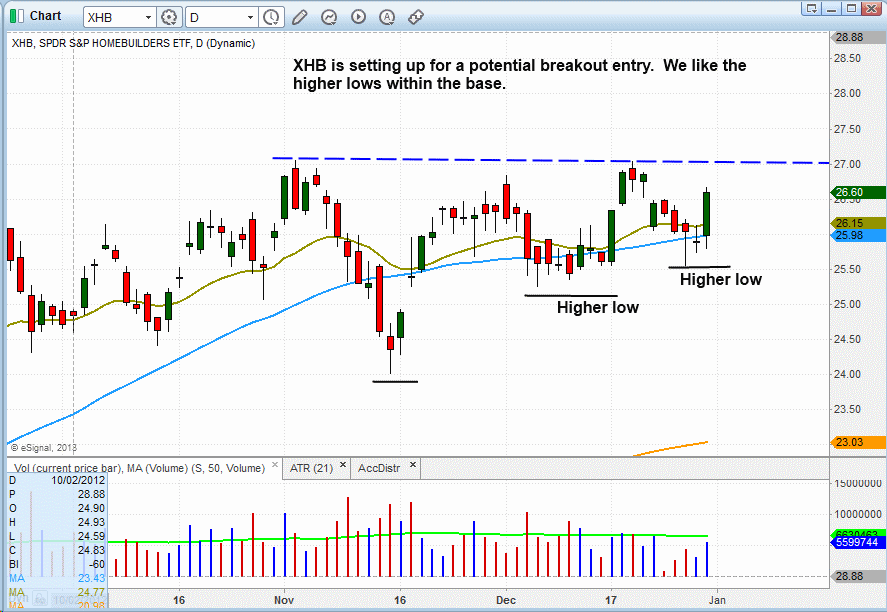
Dropping down to the shorter-term daily chart interval, we also see a tight base of consolidation trading around the 50-day moving average, with two higher lows in early and late December. This is the shorter-term type of price confirmation that we like to see confirming longer-term bases of the weekly chart. The daily chart of $XHB is shown below:
The last day of 2012 proved to be quite powerful, as major averages blasted higher in what was an impressive day of accumulation. The main stock market indexes closed more than 1.5% higher across the board, with volume increasing on both the NYSE and Nasdaq by 30%. The Nasdaq Composite, which had been quite the laggard in December, closed out the year with a strong 2.0% advance, and is now back above the 50 and 200-day moving averages.
The combination of Monday’s heavy volume advance and the Nasdaq reclaiming the 50-day MA was enough to cause our stock market timing system to shift to a different mode. Regular subscribers of our swing trading newsletter should note details of the change in the beginning of today’s newsletter.
With the new change to our stock market timing model, we want to continue building our long exposure as new, low-risk swing trade setups develop. The iShares Peru Index ($EPU) triggered a new buy entry in our ETF trading portfolio on Monday.
In addition to $XHB, there is another new ETF swing trade buy setup on today’s “official” watchlist. Several individual stock trade setups have been added to today’s watchlist as well.
Sure, no problem. Glad you enjoyed my analysis on the $SPY weekly chart last Friday.
I just wrote a follow-up article that discusses the Nasdaq ($QQQ), specifically making the point that the 4-week bounce off the mid-November lows may have run its course, with the Nasdaq ready to head back down.
Here's the link to the article (which I posted in another thread here on this forum):
Why The Nasdaq's Countertrend Bounce Has Run Its Course
Nasdaq's Countertrend Bounce Has Run Its Course ($QQQ)
In our December 14 commentary, we pointed out the bearish shooting star candlestick pattern that S&P 500 SPDR ($SPY) formed on its longer-term weekly chart interval. The rest of the major indices closed with the same topping pattern on their weekly charts. Last Friday, we also illustrated the bearish pattern and relative weakness in PowerShares QQQ Trust ($QQQ), a popular ETF for trading the Nasdaq 100 Index. On the updated daily chart below, notice that $QQQ is now trading below its 20, 50, and 200-day moving averages, each of which should now act as resistance on any bounce attempt. The blue horizontal line marks horizontal price support of the recent “swing lows” set earlier this month:

As marked by the brown, downward facing arrows, we anticipate that a break of horizontal price support in $QQQ will swiftly lead to a retest of the prior low from mid-November. Why? The reason is simply that the stock market rally off the mid-November lows has technically been nothing more than a countertrend bounce from near-term “oversold” conditions. Now, it looks as though the rally may have already run its course, as QQQ has run into major resistance of its downtrend line from the September 2012 high. Below is a second daily chart of $QQQ, which clearly illustrates how the ETF reversed after bumping into its multi-month downtrend last week (the red descending line):

We recently profited in a few ETF and stock swing trades on the long side after our system for timing the stock market shifted to “buy” mode. Yet, we were still fully aware at the time that the rally off the lows had not yet proven itself to be anything more than a countertrend bounce within the dominant downtrend. This is one of several reasons our market timing system shifted from “buy” to “neutral” mode on December 13, after several major indices formed “shooting stars” on their weekly charts while running into the downtrend lines from their September 2012 highs. Furthermore, if selling pressure in the broad market persists and we receive the necessary signals, the timing model may soon revert back to “sell” mode. We locked in solid profits on the short side of the market (and through inversely correlated “short ETFs”) when our stock market timing system was formerly in “sell” mode throughout most of October and part of November.
Going into today, we have “officially” added ProShares UltraShort QQQ ($QID) to our watchlist as a potential ETF to buy for swing trade entry. This inversely correlated ETF that tracks the price action of $QQQ, but moves in the opposite direction. We are looking to buy $QID, rather than sell short $QQQ, because subscribers with non-marginable cash accounts are unable to initiate short positions, but are not restricted from buying “short ETFs” such as $QID. Also, even though it is leveraged, $QID has shown only fractional underperformance to its underlying index for short-term trading.
Our short setup in iShares Nasdaq Biotechnology Index ($IBB) remains on our watchlist as a candidate for potential swing trade short sale entry going into today (December 17). Subscribers of our trading newsletter should note our clear, predefined trigger, stop, and target prices for the $QQQ and $IBB trade setups in the ETF Trading Watchlist section of today’s report.
Why Our Market Timing System Shifted To "Neutral"
On the close of December 13, our stock market timing system shifted from “buy” to “neutral” mode. This means we now have no firm bias with regard to near to intermediate-term market trend for swing trading.
The lack of substantial bullish follow-through in leading individual stocks in recent weeks, the absence of leadership in most ETFs (other than international ETFs), and the bearish pattern on the weekly chart of the S&P 500 Index (below) are all valid reasons to avoid the long side of the market now. Nevertheless, recent price action in the stock market has not yet convincingly confirmed the balance of power has shifted back to the bears, so we are a bit cautious about aggressively jumping in the short side of the market just yet.
Below is a longer-term weekly chart pattern of S&P 500 SPDR ($SPY), a popular ETF proxy for trading the benchmark S&P 500 Index. Notice that $SPY will likely print a bearish “shooting star” candlestick pattern for the week. This is a topping pattern that often indicates near-term bullish momentum is running out. Since a weekly chart is a longer-term interval than a daily chart, the formation of this shooting star pattern on the weekly chart is more important than if the the same pattern occurred on a daily chart:

Notice that the formation of the shooting star candlestick also occurred as $SPY “overcut” resistance of its downtrend line from the September high. This overcut of the downtrend line is significant because it sucks in new buyers, just as institutions are starting to sell into strength. This creates additional overhead supply that subsequently increases the odds of a resumption of the dominant downtrend. This would be confirmed if $SPY breaks below the horizontal price support shown above, which is merely a move below the low of its current weekly candlestick.
Although the weekly pattern of $SPY looks a bit ominous, at least in still trading above technical support of its 20, 50, and 200-day moving averages on the shorter-term daily chart. That’s more than one can say about the Nasdaq 100 Index, which sliced back below its 50 and 200 day moving averages yesterday. As you can see on the daily chart of $QQQ (an ETF proxy that tracks the Nasdaq 100), a break below yesterday’s low would coincide to the Nasdaq sliding back below its 20-day exponential moving average as well:

We concluded yesterday’s technical commentary by saying, “Given the lack of explosive price action in leadership stocks and the late day selling in the averages the past two days, the market could be vulnerable to a sell off in the short term…We are not calling the current rally dead, but we do not mind stepping aside for a few days and monitoring the price action.” To coincide with this statement, we made a judgment call to take profits on all long positions in our model trading portfolio by selling at market on yesterday’s open. Given that the broad market subsequently trended lower throughout the entire session, this worked out pretty well. Now, we are back to “flat and happy,” sitting on the sidelines 100% in cash.
One big challenge for swing traders right now is that volume levels in the broad market will likely begin heavily receding next week, as we approach the Christmas holiday. As we have warned several times in recent weeks, swing trading in low-volume environments is challenging because day-to-day price action tends to be more erratic and indecisive. Therefore, we’re not in a hurry to enter multiple new positions (either long or short) ahead of the holidays, but will still consider new stock and/or ETF trade entries (possibly on the short side and/or inverse ETFs) with reduced share size if an ideal trade setup with a firmly positive reward-risk ratio presents itself.
We do have one new setup to possibly sell short iShares Nasdaq Biotechnology ($IBB) on a slight bounce in today’s session (we recently wrote on our trading blog about the "head and shoulders" pattern on the weekly chart of $IBB) Our exact, preset entry, stop, and target prices for this swing trade setup are available to regular subscribers of The Wagner Daily swing trading newsletter.
Nice Head And Shoulders Chart Pattern In $IBB
In our November 19 ETF trading commentary, we initially pointed out that iShares Nasdaq Biotechnology ETF ($IBB) may be in the process of forming a bearish "head and shoulders" pattern on its weekly chart. Now, after a month-long bounce off support of its 200-day moving average, $IBB is forming the "right shoulder," after stalling at resistance of its 50-day moving average the past few days. This is shown on the weekly chart of $IBB below:
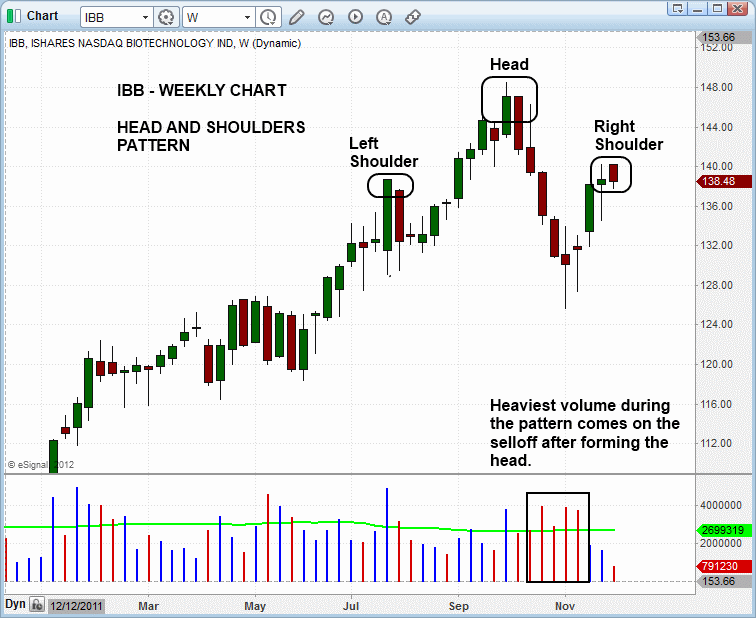
Notice how the recent highs of $IBB over the past few days correspond to the highs of the "left shoulder." The best quality head and shoulders chart patterns should form with a right shoulder that is equal to or less than the high of the left shoulder. For us, a head and shoulders pattern is no longer valid once the right shoulder extends much beyond the high of the left shoulder.
Drilling down to the shorter-term daily chart interval below, notice how the volume was heaviest on the decline from the top of the head to the bottom of the right shoulder. Higher volume on the selloff from the top of the head, followed by lighter volume on the bounce that forms the right shoulder, is what we look for to confirm the pattern:
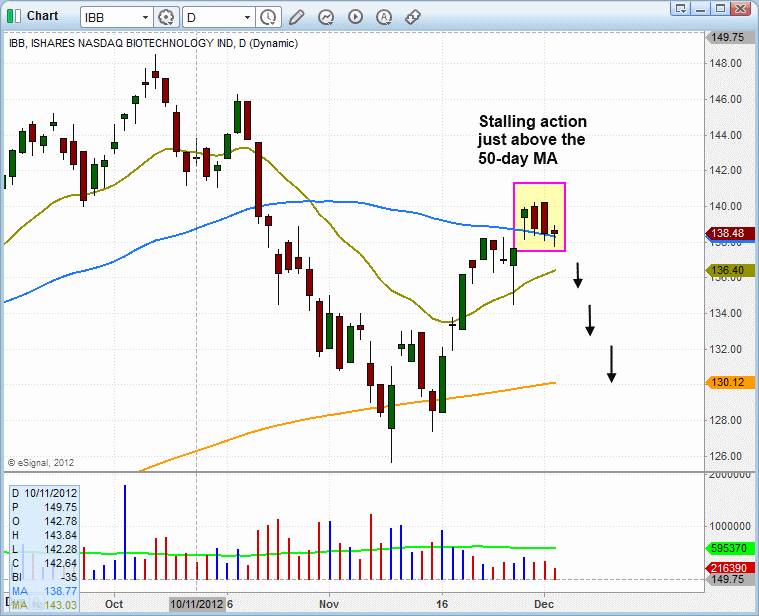
Based on the weekly and daily chart patterns above, we have officially added $IBB to our watchlist as a potential swing trade setup on the short side. Regular subscribers should note our exact, predefined entry, stop, and target prices in the ETF Trading Watchlist section of today’s report.
We mentioned recently that the broad market was showing signs of weakness during its current counter-trend rally off the lows, and one major concern is the lack of explosive price action in leadership stocks. If we were to focus only on the chart patterns of the major averages when analyzing the market, we would be missing a big piece of the puzzle, which is market leadership.
When our rule-based market timing model shifts to a new “buy” mode after a significant correction, our attention always turns to leadership stocks and how well they are breaking out from valid basing patterns. Are leading stocks break out on strong volume and holding up, or are they breaking out and selling off (false breakouts)? This information is critical to our decision making.
If leadership is strong, we can increase our long exposure, as well as our average share size per trade. But if leadership is weak and the market suffers a few “distribution days” (higher volume declines) over a short period of time, we are then forced to reduce long exposure and look for potential short setups. Though our market timing system is still showing a “buy” signal, we are now seeking the necessary confirmation for it to remain so.
Why This Week's Market Action Matters For December
Since the last two weeks of December are typically dead in terms of trading volume, there are really only two more “tradeable” weeks remaining in 2012. Therefore, it is fair to say the overall price action of the broad market over the next several days could easily set the tone for the remainder of the year. As such, here is some technical trading commentary that focuses on a few key factors to monitor this week in order to help determine whether stocks might finish the year with a bang, fizzle, or plunge.
The potential challenge as we enter the final month of 2012 is that stocks must still contend with an abundance of overhead supply and technical resistance levels. "Overhead supply" is formed by traders who formerly bought near the highs, but did not quickly cut their losses when stocks headed south. Still holding on to these losing positions, these individuals are typically eager to sell into strength of any further broad market gains, simply in the hope of "just breaking even" (learn why hope is a very dangerous emotion for traders). This selling pressure formed by the overhead supply is what makes it difficult for a confirmed down trending market to fully reverse into a new uptrend, at least without a substantial period of correction by time ("back and fill" price action).
With the Nasdaq and S&P 500 still trading below their September 2012 highs by about 5% and 3% respectively, only a sudden surge in institutional buying (high volume) would enable the broad market to rally all the way to new highs in a short period of time. On the daily chart of S&P 500 SPDR ($SPY), a popular ETF proxy for the benchmark S&P 500 Index, we have annotated the key resistance levels to pay attention to this week:

Overall, the month of November was basically a scratch for the broad market. The main stock market indexes printed significant losses in the first half of the month, then reversed to recover those losses in the latter half of the month. In the end, prices were little changed for the month. Despite this, the accurate signals received from our market timing model enabled us to still score decent gains in November by swing trading on both sides of the market (updated stats of our trading profits through November 2012 will soon be posted on "performance" page of our website).
Our market timing model has been in "buy" mode since November 23, the day it reversed from the previous “sell mode” after receiving signals that a significant market bottom may be forming. We still have two short positions in our model ETF trading portfolio, but the majority weighting of our swing trades (combining ETF and individual stock positions) remains on the long side of the market. Furthermore, if our timing model receives the proper technical signals to shift into a new "confirmed buy" mode, all bets on the short side would be off, and exposure on the long side would also be increased. But for now, maintaining a small percentage allocation of short/bearish exposure may help to reduce overall portfolio risk by basically "hedging" until/unless the downtrend from the September 2012 highs is convincingly reversed by the formation of two “higher lows” and “higher highs” on the daily charts. Trading objectively with a rule-based market timing system removes the guesswork and emotion out of knowing which side of the market to be on, and with how much exposure.
Going into today’s session, last Friday’s new swing trade setup in iShares Poland Index ($EPOL) remains an "official" buy setup with exactly the same trade parameters. We continue scanning for new ETF trading opportunities, such as buying the incredibly strong iShares Philippines ($EPHE) on a pullback to support. However, remember the best swing trade setups with a positive reward-risk ratio will eventually come to you. Avoid half-baked swing trading setups just for the sake of being in the action. If action is all you’re looking for, go to Vegas and get your fix. But if you’re serious about consistently raking in short-term trading profits over the long-term, you must develop the patience and discipline to follow our proven swing trading system taught every day in this newsletter.
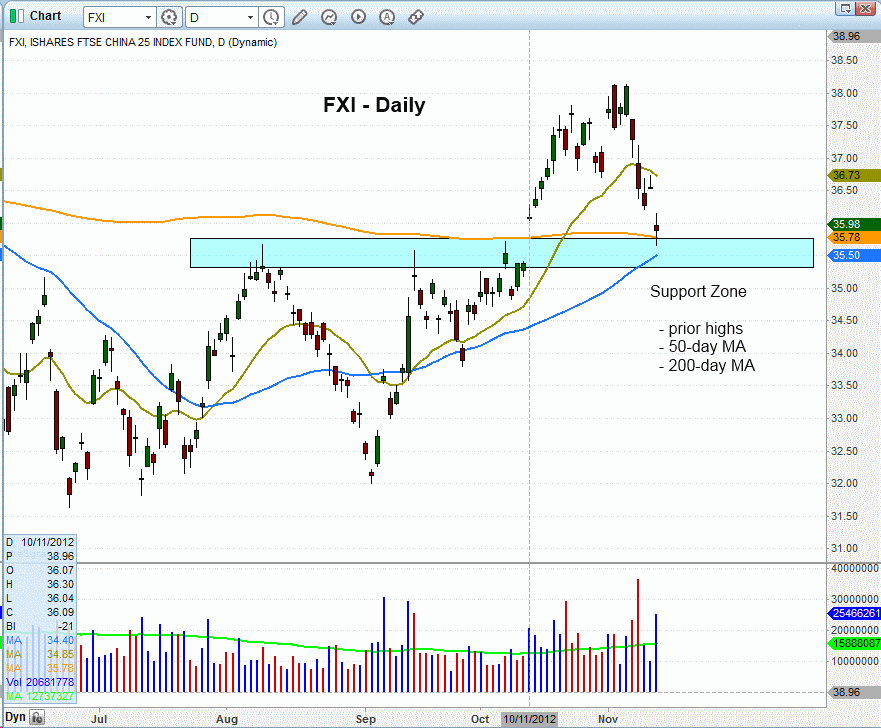
New Swing Trade Setup - iShares China ETF ($FXI)
Two weeks ago, on our November 14 blog post, we initially pointed out the relative strength of iShares China Xinhua 25 Index ($FXI) and said, "Although the main stock market indexes of the USA have been in a downtrend since mid-September, FXI actually started trending higher right as the domestic markets started selling off...and is now in pullback mode."
In our subsequent November 19 ETF analysis, just a few days later, we revisited the chart pattern of $FXI and said that, "very short-term traders only might consider buying FXI if it moves above the November 16 high of $35.88." Because US stocks had not yet confirmed at least a near-term low had been formed, we passed on "officially" adding this trade setup to our ETF Trade Watchlist. Nevertheless, we still pointed out the trade so that more aggressive, very short-term traders could take advantage of an anticipated "quick pop" is the desired. Fast forwarding to the present, take a look at the updated chart of $FXI below:

Note on the chart the level where we initially said aggressive traders could buy above the two-day high (circled in pink). This was due to the relative strength of FXI, a major level of horizontal price support (the blue line), and convergence of the 50 and 200-day moving averages (teal and orange lines respectively). Thereafter, FXI generally trended higher, but not in a very steady fashion.
Yesterday (November 28), like most stocks and ETFs in the market, FXI gapped down sharply lower, but reversed to close at its intraday high and back above its 20-day exponential moving average (beige line). This followed a normal four-day pullback from its November 23 high. This has created an ideal pullback buy setup in FXI, which has a positive reward to risk ratio for swing trade entry above yesterday's high. Regular newsletter subscribers should reference today's ETF Trade Watchlist section above to see our preset, exact entry, stop, and target prices for this swing trade setup.
Why Stocks Still Have Major Overhead Resistance
It was obviously positive that stocks continued building on their gains since bouncing off their mid-November lows, and did so on higher volume last Friday. However, it’s still too early to declare an end of the broad market’s multi-month downtrend from its September 2012 highs. One of the biggest reasons we say this is because the main stock market indexes still have an abundance of overhead supply to contend with. Furthermore, several of the major indices are now bumping into, or are quickly approaching, key technical resistance levels. One good example of this can be seen on the daily chart pattern of PowerShares QQQ Trust ($QQQ), a popular ETF proxy for trading the Nasdaq 100 index:
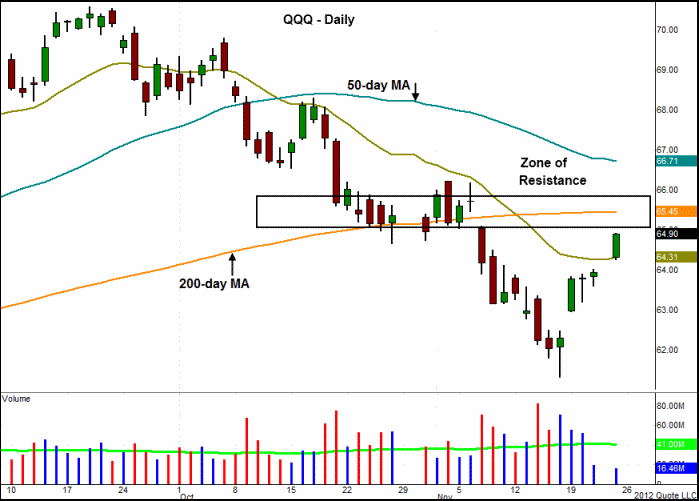
As you can see, $QQQ broke out above resistance of its 20-day exponential moving average last Friday. However, notice the horizontal price resistance just overhead, which was formed by the prior swing lows from late October, as well as the prior highs from July. Furthermore, the 200-day moving average, which formerly acted as support and now will provide formidable resistance, is less than 1% above the current price of $QQQ. Above that resistance level is the 50-day moving average, which has been sloping lower since mid-October, and is in danger of crossing below the 200-day moving average.
Whenever a market is trying to form a significant bottom, but has a plethora of overhead resistance levels, it is common for there to be at least one shakeout that tests or "undercuts" the prior low (from November 16), before the index can reset itself and start heading back up. For these reasons, it is still too early to declare the Nasdaq has found a significant bottom.
Another key broad-based ETF, the iShares Russell 2000 Index ETF ($IWM), has a similar chart pattern to $QQQ. The one difference is that it has already bounced to close right at its 200-day moving average last Friday. Furthermore, $IWM is still trading below the upper channel of its downtrend line from the September 2012 highs (the red line on the chart below), which may be difficult to overcome on the first few attempts. Take a look:

We’ll be closely monitoring the price action of both $QQQ and $IWM in the coming days, as the ability or inability of these indexes to move back above their 200-day moving averages, horizontal price resistance, and trend channel resistance may determine the tone of the broad market trend for the rest of the year. We focused on these broad-based ETFs, rather than the S&P 500 SPDR ($SPY) and Dow Jones Industrial SPDR ($DIA), because they better represent the performance of leading stocks (solid breakouts of leading individual stocks is a key component of a healthy market). Additionally, $QQQ and $IWM showed the most relative weakness of the broad-based ETFs on the way down, so they have the most technical damage to overcome.
Although we are still monitoring for new, low-risk entry points for ETF swing trades on the short side (and/or buying inverse ETFs), we can not ignore last Friday’s “accumulation day” (higher volume gains) in the market. Nevertheless, it’s important to realize a market bottom is never a one-day event, so we need to see more evidence accumulate over the next two weeks to confirm that an intermediate-term bottom is in place. Specifically, we need to see convincing breakouts of fresh leadership stocks, while the major indices need to avoid printing a bearish “distribution day” (higher volume loss) over the next five days.
3 ETFs Setting Up For Buy Entry Now
One ETF we are stalking for technical swing trading buy entry is ProShares UltraShort Emerging Markets ETF ($EEV), an inversely correlated short ETF. As you can see on the chart below, EEV broke out above a six-month downtrend last week, and has now pulled back to near-term support of its 20-day exponential moving average, which recently crossed above the 50-day moving average. This is a bullish trend reversal signal. With the ETF moving higher in yesterday’s session, but closing just below the previous day’s (November 19) low, we are now monitoring EEV as a potential short-term trade above the two-day high. The technical trade setup for EEV is shown on the daily chart below:

Although the main stock market indexes were flat yesterday, there were at least two ETFs we have been monitoring that pulled back to near-term technical support levels. Specifically, they retraced to test or "undercut" their 20-day exponential moving averages. One of those ETFs was Direxion 20-Year Treasury Bull 3x ($TMF), a fixed-income ETF that roughly follows the price of the US long-term treasury bond, but is leveraged at a 3 to 1 ratio. Last week, we sold this ETF for a substantial profit, after it broke out above resistance of a four-month downtrend line. However, the ETF has remained on our radar as a potential swing trade re-entry on a pullback. The current pullback that followed the recent breakout above the downtrend line is shown on the daily chart of TMF below:

As you can see, TMF sold off sharply yesterday, and closed just below near-term technical support of its 20-day exponential moving average. Such a price retracement off its recent highs provides a low-risk re-entry point to buy this ETF. However, remember that we do not blindly try to anticipate where a pullback will end and find support. Rather, we must now wait for the formation of a bullish reversal candlestick within the next several days, then look to buy TMF above the previous day’s high, which would confirm the pullback off the highs has ended, and TMF is likely to resume its bullish trend reversal. Therefore, TMF is now on our internal watchlist as a potential technical swing trade setup we are monitoring for the proper trigger point for buy entry.
Another ETF with a similar pattern is ProShares UltraShort Basic Materials ETF ($SMN), another short ETF. After buying the breakout above its downtrend line, we sold this ETF into strength last week for a 9.2% gain on an 8-day holding period. Now, it has pulled back to near-term support of its 20-day EMA, but probably needs another day or two to either “undercut” support of the 20-day EMA, or at least form a bullish reversal candle, before we would look for an actual re-entry point into this ETF. Like TMF, this setup in SMN has been added to our internal watchlist as a potential near-term buy entry. The daily chart pattern of SMN is shown below:

New ETF Short Sale Setup For Swing Trading
Over the past several days, we have been clearly explaining that our current plan of action is to be in "SOH mode" (sitting on hands) while waiting for the weakest ETFs and stocks to bounce into significant technical resistance levels, such as moving averages and prior lows. Then, we would wait for the bearish reversal patterns as a signal to initiate new short positions (and/or buy inversely correlated "short ETFs"). As such, we were pleased with yesterday’s (lighter volume) relief rally because it puts us closer to getting back into the market with new swing trades, albeit likely on the short side.
Given yesterday’s large percentage gains, the current bullish momentum could easily cause stocks to move higher for at least another week or two before the bears return to the market, causing the established downtrend to start taking hold again. Nevertheless, it’s important to remember that the stock market is very dynamic. For example, the sudden presence of an “accumulation day” (higher volume gains), followed by a confirmation day in which stocks jump another 1.5% to 2% at least three to four days later, could actually generate a new "buy" signal in our model for market timing. If that happens, no problem; we don’t care either way. Our proven stock trading strategy is based on trading either side of the market by simply reacting to current price action in front of us, rather than making predictions about market direction. Simply put, we always trade what we see, not what we think!
The SPDR S&P Homebuilders ETF ($XHB) was one of the last ETFs to break down below support during the recent decline, but now the ETF has a lot of immediate overhead supply and resistance to contend with. Just like many other stocks and ETFs, XHB jumped 2% higher yesterday. However, it formed a bearish reversal candlestick (similar to a shooting star candlestick) after running into resistance of both its 20-day exponential moving average and 50-day moving average. The ETF closed near its intraday low, and below both moving averages. This is shown on the daily chart of XHB below:

The setup for this swing trade is that we will only sell short XHB if it trades below yesterday’s low. This would provide us with a valid short entry point because its current relative weakness would indicate a resumption of downward momentum if that happens. Note that entering before a break of yesterday’s low is risky and not a valid short entry point. We are listing XHB as an "official" setup on our ETF Trading Watchlist in our swing trading newsletter today.
Trading Psychology: Knowing When To Be In Cash

In yesterday’s (November 15) blog post, we said the stock market may be nearing a significant short-term bottom because Wednesday’s price action resembled the start of panic selling that typically precedes exhaustion in a downward trend. However, given yesterday’s relatively tame price action, the stock market may still need more time to wash out the last of the remaining bulls…or maybe not. So, what plan of action does this provide us with? It comfortably puts us into “SOH mode” (sitting on hands). In swing trading, sometimes the best plan of action is doing absolutely nothing. In this educational trading psychology article, we explain why.
After shifting from “buy” mode to “neutral” mode on October 5, then from “neutral” to “sell” mode on October 12, our rule-based system for market timing once again precisely got us out of the long side of the market within a few percent of the highs, then prompted us to sell short (and buy inverse ETFs) right as the current sell-off began. However, even though our market timing system is still in “sell” mode, as it has been since October 12, we are now in a situation where the reward to risk ratio for entering new short positions at current levels is simply not positive.
Extremely short-term traders (such as daytraders) may now be looking for entry points to go long (buy) the stock market, with the goal of profiting from a near-term counter-trend bounce to the upside. However, as professional swing traders, we are not interested in trying to pick a bottom because our stock trading strategy is NOT designed to catch every “nook and cranny” of price movement in the stock market.
Instead, the combination of our stock trading system and market timing model is designed for us to only trade in the direction of the dominant market trend and seek to capture the “meat” of every significant move in either direction. This means we are not concerned with selling at the absolute top of market rallies, nor buying at the dead lows of downtrends. Once in a while, we get lucky and this actually happens, but it is never our intention because focusing on precisely nailing the tops and bottoms of market trends is simply too risky of a trading methodology. Think of our overall stock trading system as being designed to take large bites out of the middle of a sandwich, but not eat the crust.
When our market timing model is in “buy” mode (as it was from August 16 to October 5 of this year), we exclusively buy stocks and ETFs on the long side of the market. This means we view normal, short-term pullbacks in uptrending stocks as buying opportunities to enter new long positions; our trend-following system does NOT allow us to sell short quick pullbacks of strong stocks and ETFs in an uptrending stock market. Instead, we simply focus on selling long positions into strength of each major upward thrust, then reverting back to cash while waiting for stocks to pull back and set up for the next low-risk buying opportunities.
The same is true of how we trade in downtrending markets, except in reverse. For example, now that the broad market is in a confirmed downtrend (at least two “lower highs” and “lower lows” have been set), we are NOT interested in going long (buying) counter-trend bounces into resistance of downtrending stocks. Rather, we prefer to keep our powder dry by waiting in cash for ETFs and stocks to rally into new resistance of key moving averages and prior lows, then initiate new short positions (or buy inverse ETFs after they pull back to support). This will remain the case until we eventually receive the necessary proprietary signals for our market timing system to revert back to “buy” mode.
If you are new to swing trading, you may feel the urge to be actively trading the stock market at all times, either on the long or short side. However, the most profitable stock traders we know are actually out of the market more than they are in the market. But when the proper technical signals line up, the reward to risk ratios are good, and entry points are low-risk, successful traders take action and aggressively trade in the direction of the dominant market trend. This is exactly what we have done over the past several weeks, and with winning results.
On November 14, we closed several ETF swing trade positions for a substantial net profit. One day later (yesterday), we closed our remaining two open ETF positions. ProShares UltraShort Basic Materials ETF ($SMN) rallied to our target price, so we sold and locked in a 9.2% gain with just an 8-day holding period. Subsequently, ProShares UltraShort Financial ETF ($SKF) pulled back and hit our adjusted stop price, which knocked us out of the swing trade with a decent gain as well.
Mid-way through November, we have closed six ETF trades so far this month. Four of the six trades were winners, equating to a net gain in our $50,000 model ETF trading portfolio of more than 2% (approx. $1,100). During this same time period, the Nasdaq Composite has lost 4.7%. This means, the ETF trades in our Wagner Daily newsletter have outperformed the Nasdaq by nearly 7% over the past two weeks alone. On the individual stock side, we still have two open short positions. $COH short is showing an unrealized gain of 5.7% since entry, while $SBUX short is presently 4.1% in our favor. We will be taking profits on both swing trades on today’s open (approximately 1.7% net gain based on the $50,000 model stock trading portfolio).
We are now back to 100% cash in our model trading portfolios, which is a great place to be considering the current price levels of the market. There is not yet any technical reason to assume the broad market has formed a significant bottom, but it is equally risky to enter new short positions right now because stocks are due for a substantial bounce (the Nasdaq is on pace for its sixth consecutive week of losses). Now that we are flat, our plan is simply to wait for the broad market to bounce into resistance, then initiate new short positions and/or buy inverse ETFs (as previously explained). After having locked in solid gains on a string of winning ETF trades over the past few days, we are now “Flat and Happy,” patiently waiting in SOH mode for the stock market to provide us with our next low-risk swing trading opportunities.
If you have been losing money in recent weeks, we highly suggest you pause and take the time to do an honest, personal reflection of what you did wrong. Were you fighting the dominant market trend? Were you clinging to long positions that should have been sold weeks ago, but you ignored the stops? These are the types of questions you need to ask yourself if you have been losing money lately. Unless you learn from your mistakes and devise a way to prevent repeating them, you will never be a successful trader. Without taking the time for honest self-reflection when losing money, you will not even be aware of any trading mistakes are making.
Why Stocks May Be Nearing A Significant Bottom
For a weak market to form a significant bottom, there typically needs to be at least one or two days of panic selling, where investors finally give up and just want to sell at any price. This prompts institutional investors to step in and attempt to press the "reset" button. It seems as though yesterday's (November 14) action might have been the beginning of such a panic selling move, as there isn't much out there that is still holding up. Our nightly scans for new short selling setups have dried up this week, as most sector ETFs have already been hit hard and are now too extended to offer low-risk entry points. Because of this, we will continue to lay low with regard to new positions and just focus on managing our existing winning trades.
Earlier today, we sold ProShares UltraShort Basic Materials ($SMN) for a 9.2% gain since our November 7 swing trade entry. Yesterday morning, we sold our swing trade position in Direxion 20+ Year Treasury Bull 3x ETF ($TMF) for a net gain of 6.8% (just over 5 points). The trade setup was initially pointed out on this October 30 blog post. Later in the day, as the market broke down, ProShares UltraShort Real Estate ($SRS) hit our predetermined target price of $27.48. As such, we sold SRS into strength and closed it for a nice gain of 8% since our November 5 buy entry.
Our only recent disappointment was yesterday's price action in Global X Silver Miners ETF ($SIL), which hit our stop price when it fell below the prior day's low. Nevertheless, our stop was in the right place because SIL subsequently sold off another 7% below our exit price by the closing bell. This type of selling action after the ETF broke technical support was a great reminder of the crucial importance of always trading with and honoring your protective stop prices. Losing trades are a normal and unavoidable part of the business, but the only way to be a consistently profitable swing trader is to ensure the losses of your average losing trades are less than the gains of your average winning trades.
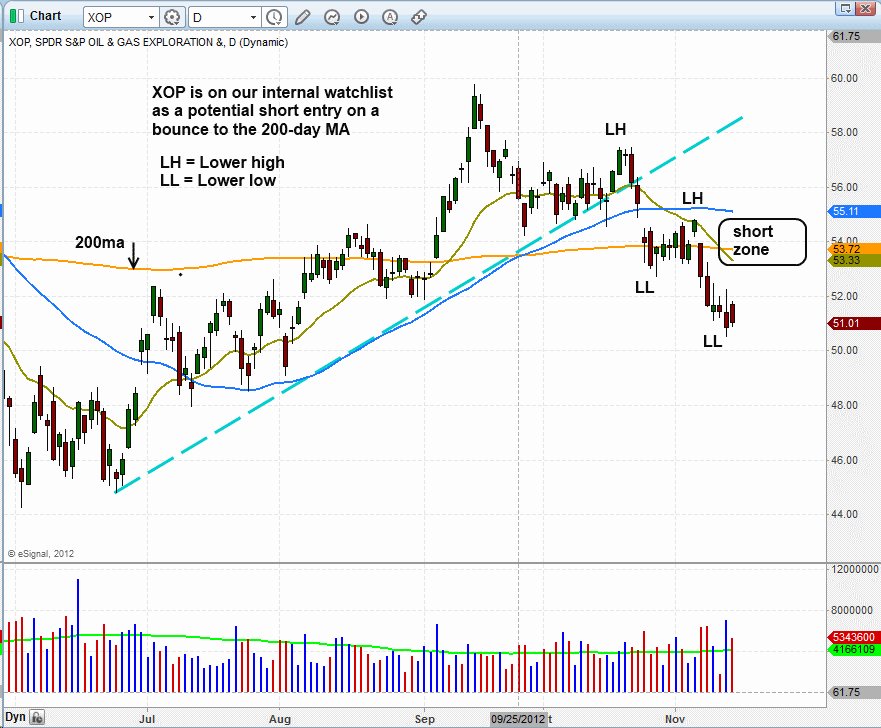
We now have three remaining open positions in our model trading portfolio, which consist of one inverse ETFs ($SKF) and two individual stocks on the short side ($COH and $SBUX). With these open positions, each of which is now showing a solid unrealized gain, we have once again tightened the stop prices so that we can protect at least half of the unrealized gains each position is showing (based on Wednesday's close). Regular subscribers of our swing trading newsletter should note our updated stop prices on the "Open Positions" section of today's report. Do not look at these updated stop prices as magical resistance levels that we identified using technical analysis. Rather, we simply placed them just below the half way point of yesterday's wide-ranged candlesticks. They are basically "money stops." If our positions continue moving further in our favor, that's great. But if the price action suddenly reverses, we will still keep the majority of our profits (barring any surprise opening gaps). We'll conclude this post with a new potential swing trade setup to put on your radar screen for potential short sale entry in the coming days.
After rallying off the summer lows and clearing the 200-day MA in early-September, SPDR S&P Oil & Gas Exploration ($XOP) stalled out after one thrust above the 200-day MA. Over the past few months, the price action has deteriorated, starting with the uptrend line break in late October, which coincided with a break of the 50 and 200-day MAs. The 20-day EMA is now below the 50-day MA, and the 50-day MA is beginning to slope lower. We also see a series of "lower highs" and "lower lows" the past two months, signaling a reversal of the uptrend. At its current level, $XOP is NOT actionable on the short side, but swing traders should add this to their watchlist for potential short entry on a bounce to resistance, in the area of the 200-day MA. This is shown on the daily chart of XOP below:
$FXI is a top ETF to buy for swing trading entry when the broad market finds a bottom.
Although our market timing system remains in “sell” mode, and our near to intermediate-term focus remains on the short side of the market, it’s never a bad idea to keep an eye on ETFs and stocks that are exhibiting relative strength to the broad market, as these will be the first equities to move higher when the broad market eventually finds support and bounces.
One of the very few ETFs showing relative strength since the two-month selloff in the US broad market began is iShares Xinhua China 25 Index Fund ETF ($FXI). Although the main stock market indexes of the USA have been in a downtrend since mid-September, FXI actually started trending higher just as the domestic markets started selling off. But despite its relative strength, FXI began correcting last week, and is now in pullback mode. However, this is still an ETF to consider buying if the stock market suddenly surprises us with a confirmed buy signal. Looking at the daily chart of FXI below, notice that FXI pulled back yesterday to close right at support of its 200-day moving average, following an extended run up from its October breakout. Support of the 200-day MA also coincides with new horizontal price support form the prior highs:
At the present time, we are NOT looking to buy FXI because the domestic broad market has yet to put in a convincing near-term bottom. Until it does, increasing or persistent bearish momentum in the US markets is likely to hold this ETF in check. Still, FXI should be on your watchlist as one of the first ETFs to consider buying when stocks eventually find a meaningful bottom. Therefore, it has been added to our internal watchlist as a potential long candidate, just in case our rule-based market timing model happens to shift back into “neutral” or “buy” mode any time soon.
High volatility and intraday indecision, such as was exhibited in yesterday’s broad market action, can be nerve-racking and frustrating for short-term swing traders. However, there is one benefit to such price action. Since stocks formed a similar intraday pattern (morning strength followed by afternoon weakness) on November 9, we now have two failed intraday rally attempts within the past three days. The benefit of this is that it makes it easy to adjust protective stop prices on short positions because if the main stock market indexes manage to rally above their three-day highs, bullish momentum will probably move stocks substantially higher in the near-term.
Presently, our model ETF trading portfolio is showing an unrealized gain of approximately $1,100 in trading profits (just over a 2% portfolio gain based on the $50,000 model account value). But because of the price action described above, we have now trailed the protective stops on our ETF and stock positions much tighter, so that we will still lock in substantial trading profit even if the major indices suddenly jump back above their three-day highs. Nevertheless, the weak action of the past three days also means there is an equally good chance that stocks could now tumble to new lows, due to the back to back failed reversal attempts (including the November 12 “inside day”). If that happens, our existing short and inverse ETF positions would realize substantially larger gains, and we would then immediately trail the protective stops even tighter, or look to take profits, the following day.
Swing Trade Setups That Don't Trigger For Entry
Yesterday (November 7), I was asked why I was targeting Market Vectors Coal ($KOL) for potential swing trade buy entry (as of the November 6 close). Specifically, this individual asked why I was looking at buying KOL when “Obama hates coal.” My reply was two-fold. First, I reminded him that my short-term trading system is based on technical analysis of price action, NOT news events. Although it is a common conception that stocks are driven by news, this is rarely the case; rather, the price action typically occurs first, and then the financial media subsequently comes up with whatever reason they can think of to justify the reason the stock went up or down for the day. Basing trading decisions on anticipated reactions to news events is rarely a profitable strategy because the expectation of the news is usually already built into the price, which therefore frequently leads to the opposite the price reaction one might expect.
But more importantly than this, the second part of my reply was an important reminder that KOL did not even hit my exact trigger price for swing trade buy entry (buy trigger was above the intraday high of November 6). Given that KOL tumbled more than 3% yesterday (November 7), it served as a great reminder of the danger of jumping the gun in trading by buying a stock or ETF before it actually hits the preset trigger price. Since my trigger prices for entry of swing trades are based on technical levels of near to intermediate-term support or resistance, trying to save a few pennies by entering a trade before it actually trades through the exact, preset trigger price is a foolhardy mistake swing traders can easily make, but one that can easily be avoided by checking your greed at the door.
Given that KOL is now well below the potential breakout level above horizontal price resistance, I have simply been removed it from my ETF Watchlist as a potential buy candidate. No harm, no foul. Always staying grounded in reality, rather than in “hope” mode, is the key to being a consistently profitable swing trader over the long-term. Although active traders who are patient, disciplined, and grounded in reality will NOT make profits every single month, they will consistently end up with a better performance than the overall stock market over the long-term because they will miss the substantial losses of the big down years. A good example of this is when I made a small profit on my ETF and stock trade picks during 2008, at a time when the major indices fell more than 30%.
It was my intention that this short post serves as a useful reminder to fellow swing traders to always be patient and follow the rules of your trading strategy.
Coal ETF ($KOL) Setting Up For Buy Entry
Going into today, we’re stalking a new potential ETF buy entry in Market Vectors Coal ETF ($KOL). After being in downtrend from April 2011 until September 2012, KOL is now setting up as a short-term, momentum-based bullish trend reversal play. On the daily chart below, notice that the 20 day moving averages recently crossed above the 50 day moving average, which is a bullish signal, although the 200-day moving average (orange line above the current price) has not yet started sloping higher. Nevertheless, there is a clearly defined area of horizontal price support and daily chart, and the ETF is also formed a pattern that is similar to an inverse head and shoulders.
The head and shoulders chart pattern is bearish when it forms near the highs after an extended rally, and usually leads to new near-term lows. Conversely, an inverse head and shoulders is bullish when it forms around the near-term lows of a protracted downtrend, and will frequently lead to new “swing highs.” On the chart below, we have annotated the components of the inverse head and shoulders pattern. As such, we are adding KOL as an “official” trade setup on our ETF Watchlist today:

In addition to being an inverse head and shoulders pattern, notice that the right shoulder is higher than the left shoulder. This tells us there were less sellers on the pullback after the formation of the head. A higher right shoulder than the left shoulder with this type of pattern is a bullish indicator. Although this is a trade setup for a long position, the fact it is a commodity ETF means the play has relatively low correlation to the direction of the broad market. Otherwise, we would not be looking at bullish trade setups because our market timing model remains in “sell” mode at the present moment.
Yesterday, our existing long position in Global X Silver Miners ETF ($SIL) got off to a rough start in the morning, but reversed to close near its intraday high, this resulted in the formation of a bullish hammer candlestick pattern that also “undercut” key intermediate-term support of its 50-day moving average. This is exactly type of price actually like to see during periods of consolidation, as it serves to shake out the “weak hands” who typically sell when stocks and ETFs break obvious technical levels of price support. If you happened to miss our initial buy entry, SIL presents a low-risk buy entry on a rally above yesterday’s high (around the $24.45 level).
At the time of this writing, all eyes are focused on the results of the US presidential election. However, we encourage you not to get too wrapped up in the results and its perceived impact on the market. Other than perhaps a short-term, knee-jerk reaction, the winner of each presidential election typically has much less to do with the future direction of the stock market than one may wish to believe. Rather, it is technical analysis and time cycles that really determines the direction of the market’s next move.
Why AAPL Is Technically In Trouble This Time
After just a one-day bounce off its lows on November 1, the Nasdaq 100 Index ($NDX) plunged right back down to pivotal, long-term support of its 200-day moving average just one day later. Why is the Nasdaq displaying such relative weakness to the rest of the major indices? Blame it in no small part on the persistent bearishness and downright ugly chart pattern of Apple ($AAPL), a former market leader and heavily-weighted stock within the Nasdaq 100 Index.
Last Friday (November 2), AAPL sliced through crucial support of its 200-day moving average for the first time since June of 2011. Now, AAPL is also in danger of losing horizontal price support of its prior “swing low” from July of 2012. If it does, it will become the first convincing “lower low” that AAPL has formed in years. As an example of just how negative recent price action has been, notice on the annotated chart below that AAPL plunged 3.3% last Friday, well below its recent low, even though the main stock market indexes still retained a portion of their previous day’s gains. AAPL has become a clear example of a stock exhibiting bearish divergence and relative weakness to the broad market:

Although our bearish analysis will undoubtedly anger the loyal army of Apple fanboys, we are merely being objective by saying that recent price action of AAPL (and quite a few other former market leaders) indicates a changing of the guards is on the horizon. However, the big problem is the replacement guards have not yet arrived. Until new leadership stocks start popping up, there will likely be no impetus for a sustainable broad-based rally.
In conclusion, if you've been holding $AAPL for a while, did not yet sell, and are still holding out hope (a very deadly emotion) that the stock will recover, be warned that you are playing a very dangerous game. We personally view any substantial bounce in the stock as a chance to sell into strength and/or initiate a new short position, because the technical are indicating further downside to come.
Hey Mike,
Thanks for helping out here.
I am hosting the charts on my own server (morpheustrading.com). When I made my first post (which I think was last week), the charts displayed fine and they were hosted the same way. However, there was no "$" symbol in the file name; hence, I am wondering if this was the problem.
Fantastic! I can already feel the love and warmth in the air. In fact, it makes me want to sing that Elton John song..."Can you feel the love tonight"
Haa! Well, obviously I'm not too smart cuz I still couldn't get the charts to work, despite following the rules exactly. But anyway, since I'm the newbie here, thanks for the friendly warnings and warm welcome.
The [chart] tag did not work either (when I previewed a sample post). I think the problem may be that I am using a dollar sign ($) within the file name. With my earlier post, it seems like it was displaying the charts upon initial loading, then giving a broken link starting with the $ sign part of the URL. So, this could be? Will try posting without $ sign next time I post a chart.
Thanks for your help.
Deron
Thanks for the explanation. I was using the "Image" button, which inserted "<img>" tag at front and "</img>" tag at the back, but I guess the "<chart>" tag actually works better than the built in code for images. Will try that for next post. Thanks!
Ah, ha! Makes sense then.
Anyone know why the links to my charts did not appear in previous post? I am pretty sure the "img" tag was used correctly.
Bullish Trend Reversals In T-Bond ETFs ($TLT, $TMF)
The Direxion 30-year Treasury Bull 3X ETF ($TMF), an index that tracks the performance of long-term US government T-bonds, has been in a long-term uptrend since February of 2011, but has been in an intermediate-term downtrend (correction) off its highs since July of 2012. Now, it appears as though TMF is setting up to break out above resistance of its 3-month downtrend line and resume the long-term uptrend that has been in place for nearly 2 years. The weekly chart below shows the long-term uptrend in TMF, while the daily chart that follows shows the potential breakout above the intermediate-term downtrend line.


In technical analysis, a longer-term trendline holds more weight and bearing over future price direction than a shorter-term trendline. Therefore, if TMF manages to breakout above its 50-day MA, it will have broken out above the downtrend line shown on the second chart, which should enable it to resume its dominant uptrend shown on the first chart.
As an aside, iShares 20+ year Treasury Bond ETF ($TLT) is the regular, non-leveraged version of TMF (which ties up a lot more buying power in one’s account). Normally, we are cautious about entering leveraged ETFs because they frequently underperform the underlying index, but we’ve observed that TMF has been tracking very closely to the price of TLT. Therefore, we are stalking TMF for potential buy entry, rather than TLT, but the latter is basically the same setup.
Over the past few days, we have spent quite a few hours scanning the technical chart patterns of hundreds of ETFs, looking for any ideal opportunities for the coming days. But we were generally not impressed with what we saw. We are listing TMF as a potential “trend reversal” setup (“breakouts” and “pullbacks” are the other two technical setups we trade) only because it is a fixed-income ETF, which has a low direct correlation to the direction of the overall stock market. Otherwise, we remain focused on selling short (or buying inversely correlated “short ETFs”). On the short side, we continue to monitor an internal watchlist of potential short selling candidates. Tickers include PowerShares QQQ Trust ($QQQ) and iShares Nasdaq Biotech ($IBB), both of which we are waiting for a substantial bounce before selling short (or buying the inverse ETF).
On the long side, select emerging markets ETFs are still looking pretty good, and are holding near their recent highs ($EWH, $GREK, $EPHE, and a few others). However, since our market timing model has been on a “sell” signal since October 12, we are presently not interested in buying stock-based international ETFs because they will eventually succumb to weakness if US stocks continue lower from here. Nevertheless, when the broad market eventually bounces, very short-term active traders may independently look to these ETFs as potential quick, momentum-based trades (just be aware they are countertrend to the broad market, which we do not advocate for our swing trading system).
Because fear is a more powerful human emotion than greed, stocks nearly always fall much faster and more violently than they rise. As such, there are key technical differences in our trading strategy with regard to the price levels where we look to sell short stocks, compared to the ways in which we buy stocks. As such, I would like to summarize my basic trading strategy for determining the most ideal, low-risk entry points for short selling stocks and ETFs.
Since my rule-based system for market timing switched to a new “sell” signal on October 12, my swing trading focus is now on selling short weak stocks, rather than buying stocks with relative strength to the broad market. It is crucial to realize that trading in the same direction as the dominant broad market trend is, and has always been, the first and most important element of our swing trading system.
Presently, the majority of stocks I am monitoring for potential short sale entry have either set a new “swing low” within the past few days, or are trading too close to a prior low, to initiate a low-risk entry point at current levels. I do not sell short stocks that are breaking down below obvious levels of support, as they tend to rebound and rip higher after just one to two days of weakness.
My most ideal short selling candidates are stocks and ETFs that have recently set new “swing lows” (or are testing prior lows), and have subsequently bounced into resistance over a period of three to ten days. But even though I prefer to wait for a bounce before entering a new short position, it is important to realize I do not enter a new short position while the stock is still bouncing (trying to catch the high of the bounce). Rather, I first wait for subsequent confirmation that the stock is about to stall again. This typically comes in the form of either a bearish reversal bar (such as a bearish engulfing or hanging man candlestick pattern) or sharp opening gap down, which signals the short-term bounce is losing steam. Similarly, I always take the same approach on the long side when buying pullbacks of uptrending stocks; I always wait for a pullback to form some sort of reversal pattern before buying (rather than trying to catch the bottom of the pullback).
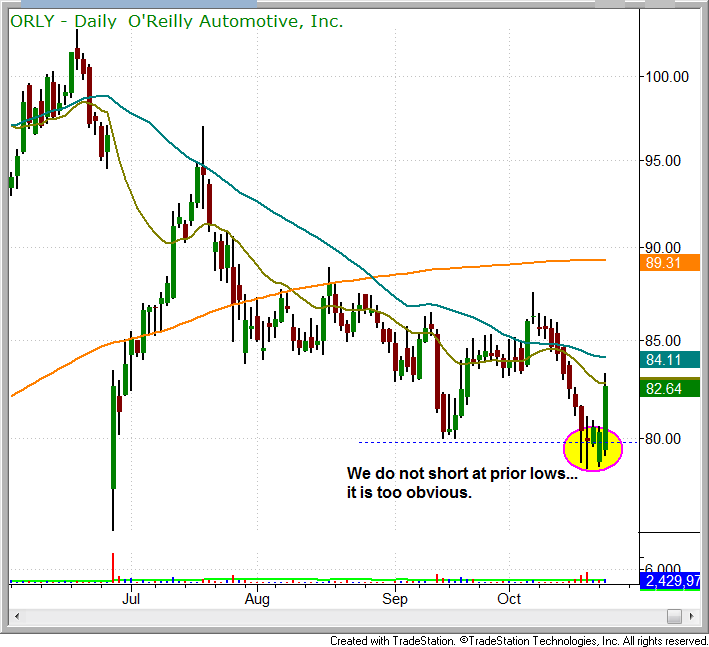
Below is a chart of O’Reilly Automotive ($ORLY), which is a good example of what frequently happens when attempting to sell short a breakdown below an obvious level of price support. Again, entering a new short position as a stock is breaking down below the low of a range is something I am not very comfortable doing:
A lower risk way of initiating a new short sale, which also provides you with a more positive reward to risk ratio for the trade, is shown on the following chart of Check Point Software ($CHKP). This is an example of what I am looking for when entering a short position (although the declines are not always as dramatic):
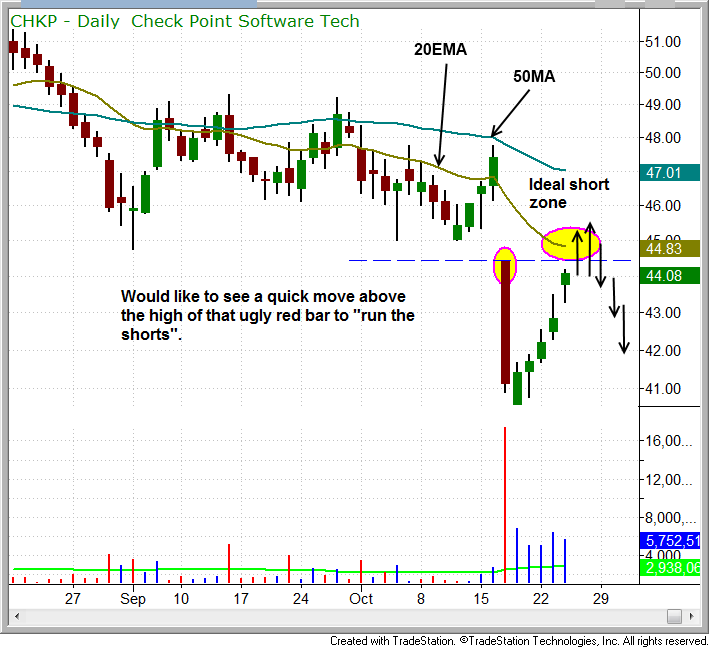
On October 17, CHKP gapped down sharply, on huge volume, due to a negative reaction to its quarterly earnings report. This caused the stock to crash through a four-month level of price support at the $44 area (dashed horizontal line). But over the past week, notice that CHKP has been climbing its way back up to test new resistance of its breakdown level. If CHKP now manages to probe above the intraday high of October 17, it would see some short covering, as most traders would not have expected the price action to climb back to that level. Further, the 20-day EMA is also above to lend a little more resistance. It is at that point ($44.50 to $45 area) that I would look for the first bearish reversal candle OR opening gap down to initiate a very low-risk short selling entry with a positive reward-risk ratio. By waiting for a significant bounce into new resistance of the breakdown before selling short, I can "be right or be right out" by keeping a relatively tight protective stop.
My current near-term plan with regard to individual stock and ETF trades is to remain patient and wait for proper, low-risk short setups to emerge. When the stock market eventually and inevitably bounces, I anticipate nice short selling opportunities to develop, and I will be prepared to take advantage of them. As for the long side of the market, I am not even looking for new buy entries right now because the overall stock market has simply deteriorated too much for our liking. At a minimum, even the best stocks and ETFs will now require at least six to eight weeks for new bases of support to develop.
Hope you found this post to be useful.

