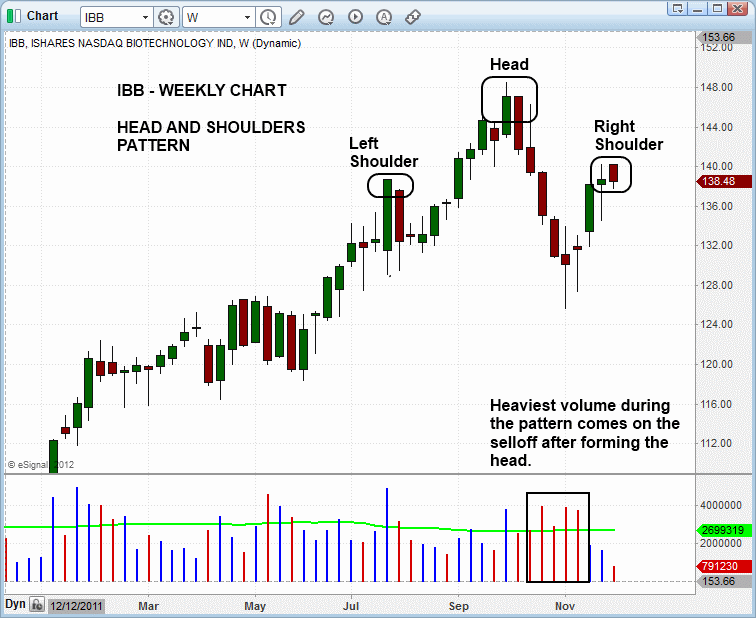
In our November 19 ETF trading commentary, we initially pointed out that iShares Nasdaq Biotechnology ETF ($IBB) may be in the process of forming a bearish "head and shoulders" pattern on its weekly chart. Now, after a month-long bounce off support of its 200-day moving average, $IBB is forming the "right shoulder," after stalling at resistance of its 50-day moving average the past few days. This is shown on the weekly chart of $IBB below:
Notice how the recent highs of $IBB over the past few days correspond to the highs of the "left shoulder." The best quality head and shoulders chart patterns should form with a right shoulder that is equal to or less than the high of the left shoulder. For us, a head and shoulders pattern is no longer valid once the right shoulder extends much beyond the high of the left shoulder.
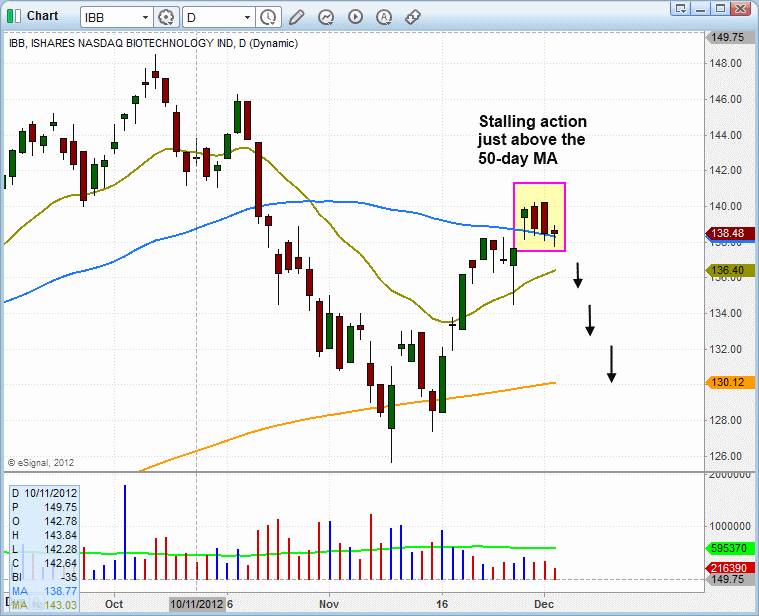
Drilling down to the shorter-term daily chart interval below, notice how the volume was heaviest on the decline from the top of the head to the bottom of the right shoulder. Higher volume on the selloff from the top of the head, followed by lighter volume on the bounce that forms the right shoulder, is what we look for to confirm the pattern:
Based on the weekly and daily chart patterns above, we have officially added $IBB to our watchlist as a potential swing trade setup on the short side. Regular subscribers should note our exact, predefined entry, stop, and target prices in the ETF Trading Watchlist section of today’s report.
We mentioned recently that the broad market was showing signs of weakness during its current counter-trend rally off the lows, and one major concern is the lack of explosive price action in leadership stocks. If we were to focus only on the chart patterns of the major averages when analyzing the market, we would be missing a big piece of the puzzle, which is market leadership.
When our rule-based market timing model shifts to a new “buy” mode after a significant correction, our attention always turns to leadership stocks and how well they are breaking out from valid basing patterns. Are leading stocks break out on strong volume and holding up, or are they breaking out and selling off (false breakouts)? This information is critical to our decision making.
If leadership is strong, we can increase our long exposure, as well as our average share size per trade. But if leadership is weak and the market suffers a few “distribution days” (higher volume declines) over a short period of time, we are then forced to reduce long exposure and look for potential short setups. Though our market timing system is still showing a “buy” signal, we are now seeking the necessary confirmation for it to remain so.
Register for free to join our community of investors and share your ideas. You will also get access to streaming quotes, interactive charts, trades, portfolio, live options flow and more tools.


 News
News  Market Data
  Discover