Russian ETF poised for swing trade breakout ($RSX)
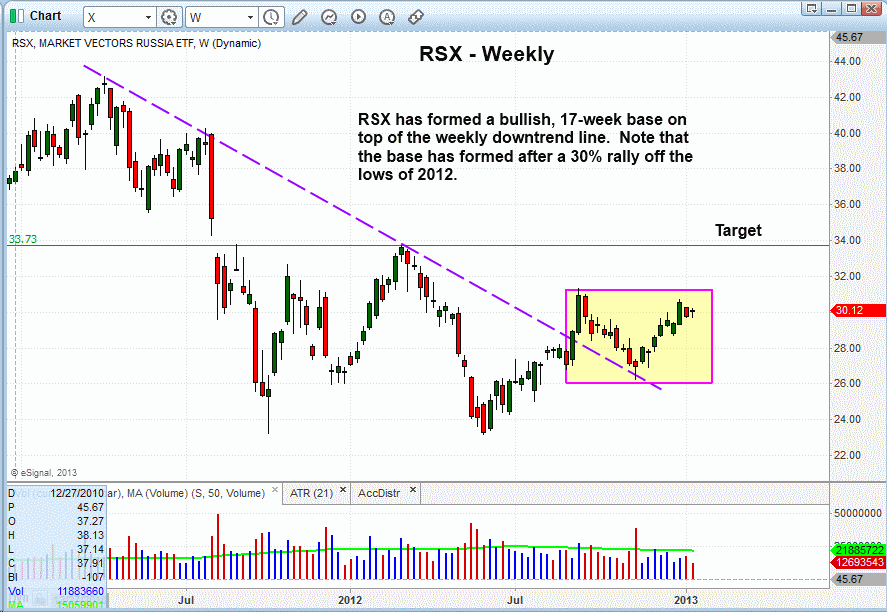
The Market Vectors Russia ETF ($RSX) is currently forming a tight-ranged base (similar to a cup and handle chart pattern) on its longer-term weekly chart below. After rallying 30% off its 2012 low, $RSX subsequently pulled back and successfully tested new support (prior resistance) of its multi-year downtrend line, and now is forming the right side of this bullish chart pattern. The annotated chart below illustrates this:
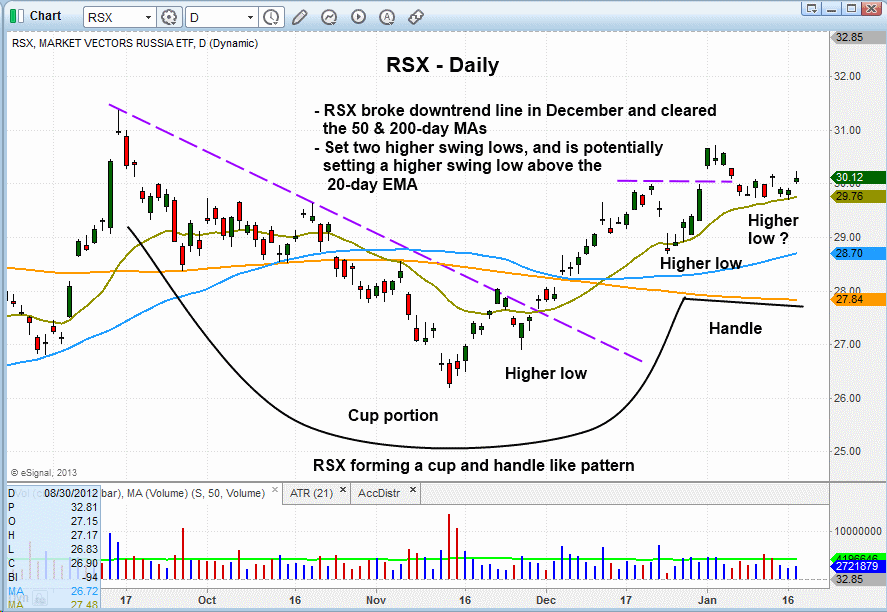
Drilling down to the short-term daily chart interval, the cup and handle pattern can be more easily seen. The “cup” was formed after the low of the pullback that tested the downtrend line on the weekly chart above, and the “handle” has been forming the right side of the chart pattern just below the prior highs from September of 2012:
As recently explained in this educational January 15 post on another InvestorsHub board, there are specific technical requirements that a chart pattern must exhibit before considering the ETF or stock as a potential swing trading breakout candidate.
First, the price action absolutely must stop making “lower highs” and “lower lows,” and eventually break the downtrend line of the pullback from the prior highs. Once this happens, and the price has formed a “higher swing high” and “higher swing low,” we then have something to work with. Without the higher lows or downtrend line break in place, all we have is a chart in a downtrend and showing no signs of bullish momentum. One key rule of our trading system (view 7-minute overview video) is that we do NOT try to predict future price action; rather, we merely react to the trend after it becomes established. As such, we never try to catch the bottom of a rally.
The key moving averages we monitor (20-day EMA, 50-day MA, and 200-day MA) are confirming the recent strength in $RSX. On the daily chart above, notice the 20-day EMA (beige line) crossed above the 50-day MA (teal line) in early December of 2012. Also, the 50-day MA is now above the 200-day MA and trending higher.
In late December, $RSX formed a second higher low, right at near-term technical support of the 20-day EMA, which led to a failed breakout above the prior swing high. However, the pullback from the failed breakout in early January again looks to have found support at the rising 20-day EMA. If this bullish chart pattern is to continue tightening up and forming higher swing lows, then the price action should continue holding above the 20-day EMA. This could lead to a breakout to new highs within the coming days, which is why $RSX has been added to our “official” watchlist as a potential swing trade buy entry. Regular subscribers to our ETF and stock newsletter should note our clearly predefined trigger, stop, and target prices for this trade setup in the ETF Watchlist section of today’s report.
Register for free to join our community of investors and share your ideas. You will also get access to streaming quotes, interactive charts, trades, portfolio, live options flow and more tools.


 News
News  Market Data
  Discover