 News
News  Market Data
  Discover
Support: 888-992-3836
Copyright © 2023 InvestorsHub Inc.


ls7550
![]()
Register for free to join our community of investors and share your ideas. You will also get access to streaming quotes, interactive charts, trades, portfolio, live options flow and more tools.
Register for free to join our community of investors and share your ideas. You will also get access to streaming quotes, interactive charts, trades, portfolio, live options flow and more tools.
RE: Wow, nobody seems to have noticed.
Happy Holiday Weekend.
N = Portfolio Control divided by Number of Shares
For the next sell price divide N by 1 minus safe minus minimum trade % i.e. if safe = 10%, minimum trade size = 5% then 1 - 0.1 - 0.05 = 0.85 (so N / 0.85)
For next buy price divide N by 1 + safe + minimum trade % i.e. if safe = 10% minimum trade size = 5% then 1 + 0.1 + 0.05 = 1.15 (so N / 1.15)
Yep, those are the figures alright. I added in Portfolio control and stock holdings so it is a match to the web site calculator, but I haven't figured out the best way to do the value of the stock instead of the price per share.
You've lost me somewhat Allen. You only need Portfolio Control, # Shares and cash reserve (and safe, minimum trade size, vealie-at if you use different values for different holdings). With PC and # Shares you can pre-calculate the next buy/sell prices and record those figures and you only need to review when the share price reaches/breaches one of those price levels. Then its a calculation to see how much stock to sell/buy, check whether you're above/below a Vealie level etc and either buy/sell or adjust PC for a Vealie accordingly (sell trade indicated but already too much cash reserve).
Recording weekly/monthly/quarterly prices is only useful if you want to create charts, otherwise its just clutter (that can usually be downloaded if you have the need). Otherwise just carry a piece of paper around in your wallet with a single line for each stock/fund (AIM) containing stock name, PC, #Shares, cash $, next buy price, next sell price (plus safe, min trade size, vealie at ..etc if you don't consistently use the same settings for all your AIM's).
Re: Mexican Peso/US $ peg question
http://www.oanda.com/currency/iso-currency-codes/MXN indicates that the Mexican Peso isn't pegged to USD
I don't have a Mexican stock trading account and I'd like to extend holdings to include one or two Mexican stocks. One route to achieve that is to buy via the US stock market and buy a Mexican stock American depositary receipt.
Unlike other Latin America regions, Mexico appears to be relatively tax friendly, exempting capital gains from stocks (???). As US dividend (from the ADR - that it receives from holding the underline Mexican stock) would have US withholding taxes applied (being a UK investor) ideally I want a low/no dividend stock and one such candidate is GMK
i.e. looking to reduce taxation/costs for a UK investor holding a US ADR that holds a Latin American stock.
Looking at how closely the ADR tracked the actual Mexican Stock however highlights that there appears to have been little in the way of Peso/US$ currency fluctuations. Is there some kind of opaque currency pegging between the Mexican Peso and US$? I would have expected to see a higher level of currency fluctuations.
TIA
To put some more meat on the bone as to why I'm asking - my thinking behind this is that I have accumulate enough wealth that I don't need to take on unnecessary risk. I own my own homes and therefore have a roof over our heads and in effect have the rent paid for the next 30+ years. As house prices generally pace inflation over the longer term the house price (inflation) plus imputed rent is a stock like reward. Assuming a third in such 'land' value and another third in inflation bonds with the intent to draw that down over 30 years (income - which will probably outlive me), combined with human capital (wages/inflation linked pension) and as UK gilts (treasury bonds/TIPS equivalent) have the inflation element exempt from taxation that leaves a third for growth/accumulation. i.e. if the growth of a initial third doubles in real terms over 30 years whilst the initial third allocation to bond drawdown draws down to zero then you end the 30 years with the same amount in inflation adjusted terms as at the start (inheritance). That's in the worst historic case (at least for that tables date range), in the average case the growth component might average 6.7% real (as indicated in that table) and grow a initial third allocation seven-fold (and leave a even larger inheritance or permit some periodic top-slicing/profit taking to supplement income (periodic 'bonus')).
For the growth/accumulation component, this article indicates that a equal weighted global choice of stocks can be one of the safer choices over 30 year periods (second row of data values)
http://patrickoshag.tumblr.com/post/93207823244/the-dangers-of-portfolio-patriotism
i.e. for 30 year periods the worst case real (inflation adjusted) gain for a global equal weighted portfolio was > 100% gain (double-up). The author also notes that that was similar for local returns (so not just for the US alone).
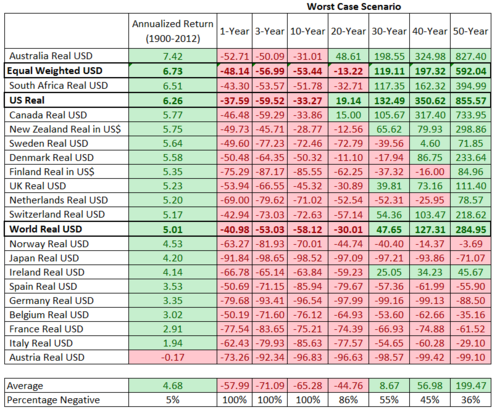
Accordingly 30 AIM's of a diverse range of global low/no dividend paying stocks (to reduce interim (withholding)taxes/costs) might be appropriate (3.3% risk per individual stock/AIM). I know that some say that growth stocks relatively lag other stocks (value, dividend paying etc.) but as both Steve's AIM's (which are comprised of many non dividend paying growth stocks) and Kenneth French's zero dividend data (since 1920's) show that lagging is more a case when cap weighting is used. For more equal weighted holdings the lag isn't evident.
For the AIM settings I believe that simply individually AIMing each stock, with the initial stock = how much would have been invested in buy and hold (3.3% each) combined with a '25% cash reserve' (more virtual than actual) i.e. AIM-HI settings is an appropriate choice. Together with some periodic movement of funds from one AIM to another as and when one AIM becomes more heavily weighted than another (i.e. looking to maintain a degree of equal weight as stock prices/currencies deviate over time). i.e. some AIM's might accumulate cash, others might deploy cash into buying more shares (periodic steering towards equal weighting (rebalancing) performing the transfer of cash from one AIM to another).
I already have access to around 15 different stock markets and currencies, but Latin America isn't included in that and hence this posting.
Re AIM Hold Zone calculation
N = Portfolio Control divided by Number of Shares
For the next sell price divide N by 1 minus safe minus minimum trade % i.e. if safe = 10%, minimum trade size = 5% then 1 - 0.1 - 0.05 = 0.85 (so N / 0.85)
For next buy price divide N by 1 + safe + minimum trade % i.e. if safe = 10% minimum trade size = 5% then 1 + 0.1 + 0.05 = 1.15 (so N / 1.15)
As to one being advantageous over the other? I don't know. But I've stated a number of times out here that, to me at least, there is nothing magic in the market about a week or month
There's a hidden (although its mentioned in the F1 (help) pages) control sequence of SHIFT-F4 in Newport that opens up the Portfolio Control Adjustment window (should the need to change that arise)

Under DOSBox its usually Ctrl-F10 to release the mouse from within DosBox back to the Host system (clicking in the DOSBox window can/does/tends-to lock the mouse to the DOS emulator window).
Personally I followed Toofuzzy's Hi Tech lead - pencil and paper and load copies of that into Excel (or LibreOffice) and create charts/perform analysis using spreadsheets. Using a calculator such as under the 'Calculator' subsection of this web page http://www.jfholdings.pwp.blueyonder.co.uk/ you can pre-calculate the prices at what AIM will next trade (how many shares and how much). Once you have that calculator web page open if you right click on the white page and select this-frame, save frame as (or something similar) you can save a copy of that calculator to a local directory/file (so you can subsequently run it even without a internet connection).
Newport floppy disk, then you'd be all set (if you still have an XP computer, or older, running somewhere that would accept a floppy disk!).


RE: AIM-HI Quarterly
For AIM-HI (20% cash), Robert Lichello suggested using 10% minimum trade size to preserve cash that bit longer and to prevent AIM spitting out repeated trades month after month.
I've noted however that if you AIM-HI quarterly using 5% minimum trade size you achieve similar overall results to monthly AIM-HI with 10% minimum trade size.
A benefit of quarterly reviews is that you can tie that with a bond ladder. One bond/rolling (or some of the proceeds being used to service AIM buy trades) means that there's no capital risk (bond matures at its par value). And four bonds being rolled each year is obviously less expensive to maintain than one bond/month being rolled.
Quarterly AIM-HI with 10% minimum trade size appears to be too wide a gap and can accumulate too much cash even when 20% Vealies are being used.
Yet another observation with quarterly AIM-HI with 5% minimum trade size is that it didn't run out of cash either during the 2003 lows nor the 2008 lows (whilst AIM-HI monthly with 10% minimum trade size did). i.e. similar rewards, without having exhausted cash reserves.
American Airlines have also been flying higher
The other benefit of AIM is that over time it can have gone that little bit more in when prices were low and lightened up a little when prices were high; And it seems to broadly do so with reasonable accuracy. Relatively overweighting when prices were low, underweighting when prices were high can produce better rewards than maintaining a more constant level of risk exposure.
Hi Steve. I'd forgotten that myself. I uploaded it some time back and it much have been around the time we were last discussing AIM of GIEW.
Generally I just open the template and then use the download worksheet to grab the Yahoo adjusted close prices (that include dividends and splits etc unless its a Index) for the stock and cash assets, and drop (copy/paste) those into columns B and AM of the AIM worksheet.
Fits well with AIM
Hi Allen. Have to be brief, off to the airport soon.
Yes 10% BUY and SELL SAFE values
Vealie : rather than selling some shares when AIM indicates it is appropriate to do so, and when cash reserves might already be at relatively high levels, instead you increase Portfolio Control by half the trade value amount indicated to be sold by AIM, without actually selling any shares.
Re Charts :
I used Excel to create those charts - something like http://www.jfholdings.pwp.blueyonder.co.uk/AIM_template.xls
Re images : you have to have somewhere on the internet to store the image and then you can post them here using the IMG url to image /IMG tag (but where IMG and /IMG have [ and ] either side. If I typed it here it wouldn't be seen as text so a close approximation is [IWG]http://www.somesite.com/myimage.gif[/IWG] but with a M instead of a W
Investors Hub also cater for images to be uploaded/displayed in posts. TOOLS/My Image Gallery and then you can browse your PC to select a image to upload ...etc.
Re: AIM performance.......
The tops of the blue bars are the total AIM portfolio value in these images i.e. green (cash) and blue (stock) bars are stacked. The scaling is also the same as the stock (red) scale - so you can see a direct comparison between buy and hold (red) and AIM (tops of blue bars).
AIM settings : Monthly reviews, 20% initial cash reserve (i.e. AIM-HI = Robert Lichello's last incarnation of AIM), 10% of stock value minimum trade size, 10% SAFE, 20% Vealie.
Dividends were assumed to be automatically reinvested into buying more shares, AIM's 'cash' was assumed to be invested in VFISX. No adjustments for trading costs, spreads nor taxes were included.
AIM started from a relative high

AIM started from a relative low

As another example, below is a AIM chart where both cash interest and dividends are ignored.

Hi Steveg_123
Ladder is based on a log stochastic scaling. The predictive part is deciding on the limits (top and bottom). Thereafter its just a case of applying the calculation using those levels and the current price.
cash % = (log(current) - log(bottom)) / (log(top) - log(bottom))
For example if you suspect the top will be 100, the bottom 50 and the current is 75 then
( log(75) - log(50) ) / (log(100) - log(50)) = 0.585 (58.5%) cash (inverse correlated fund) indicated.
The next requirement is deciding when to trade. The larger the moves before trading the lower the costs (fewer trades) and the larger the reward upon sizeable reversals. The optimum would obviously be to hit the exact peaks and troughs for zigzags within the top and bottom price range - but that's a impossibility. Fundamentals/PnF/ZigZag/news/W%R etc type methods might be employed when making such 'when to trade' decisions. There's no magic single method that consistently works well - if when you do sell some stock and the price continues on up, you relatively lost out by selling early. Similarly if you buy more stock and the prices continues down you relatively lost out by buying too early.
Whilst you could use linear stochastic i.e. ((75-50)/(100-50)) =0.5 (50%) for wider ranges using log scaling helps to keep things more proportional across the entire range.
Standard AIM can't run out of stock to sell, but it can exhaust cash (has a bottom). LD-AIM can run out of stock or cash (has both a top and bottom). AIM adds when prices decline, reduces when prices rise. So ladder and LD-AIM are somewhat the same sort of thing. With ladder the top and bottom are more transparent and can be fine tuned/dynamically adjusted more easily. For instance you might opt to revise the top and bottom over time to coincide with Bollinger Bands. Note that for Bollinger bands often during a sustained up-trend the price will tend to rattle along quite close to the upper Bollinger Band - where you'd be near all-out. Similarly during sustained down trends then the price tends to rattle along the bottom Bollinger Band - where you'd be near all-in. Which is a bad stance (miss a sizeable amount of up-run, near all-in/heaving exposed to down-runs).
Ladder as cash% is better suited to zigzag ranging between where volatility capture gains become apparent. In some cases you might want to totally flip the ladder - if you think that the stock/fund is trending higher or lower then log stochastic cash% might be flipped to being considered a stock% value. A relatively long moving average can provide a indicator of the broader trend
With a fund and its inverse (short) fund, at 50% 'cash' you're neutral (long 50, short 50), as the price rises so you reduce the long, increase the short (becomes more short), as the prices declines so you reduce short, increase long. i.e. anticipates mean reversion. In some cases however holdings might go straight up and out of the top (all in cash/short). In other cases it might drop down and out of the bottom (all in stock/long). Outside of the top and bottom levels and your ladder becomes static/fixed (all in or all out). Being all out isn't a problem as you can start a new investment. Being all in and seeing the price below your bottom price level involves either sitting and waiting for a upward recovery, or opting to take a loss and close the position and move on to something else. Or you can revise the top and bottom values to account for perceived likely tops and bottoms.
Generally its all just a guess (luck). Guess more right than wrong and you'll likely churn a profit. Guess wrong and you lose out. Ladder is just a mathematical means that can help with deciding how much stock/cash to have at risk at any one time for each such guess. For instance with the S&P currently above its 200 day moving average it looks like a up-trend, so ladder (log stochastic) might be considered as being a stock% value. Within that the price is near its upper Bollinger band, so ladder with top/bottom set at those bollinger bands would be relatively heavily in stock more recently. As the price declines towards the lower Bollinger so lighten up on stock, increase cash. If the 200 day moving average is breached then consider switching from ladder using a long stock holding to using a short stock holding and flip to using ladder = cash%. If the trend starts to zigzag around a flat trend (sideways volatility), then ladder using cash% to potentially capture some of the zigzag moves.
Why not use pairs (long/ short) of ETFS or mutual funds for volatility capture?
It is their opinion that for US dollar based foreign investments a significant portion of gains seen over the last 15 years have been from Currency Shift and not equity appreciation
They also feel that the central bank collusion of the last decade or so is about to change course, too. Their CIO, Randy Brown, says, "Monetary policy divergence among central banks will intensify in the future."
Thanks Tom.
MRI looks somewhat similar to vWave diversified minus 15%
=================================================
With QE slowing/halting and markets/currencies striving to reacquire some degree of linkage, rotating between UK midaps and S&P500 based on GB£ comparisons of total gains since 2009 has enabled some reasonable currency based enhancement of rewards.

Last rotated into SPY about 6 months ago. Using S250 / SPY total (£) values with 0.95 and 1.05 switch/rotate settings i.e. FT250 value / SPY value last rose from below to > 1.05 last January.
YoY +13% compared to around +6% for either held alone.
Feels like being paid to watch two ships zigzag correcting course, over-do it one way and start steering back the other way again ... to over-do it ...
You don't have it wrong Allen - its simply :
Start with some stock and some cash (perhaps a 80-20 split of each for instance)
Initially set Portfolio Control (PC) = stock value (SV)
Each month you check your AIM
If your PC is larger than SV, then AIM is considering buying T = PC - SV - 0.1 x SV
If your SV is larger than PC, then AIM is considering selling T = SV - PC - 0.1 x SV
Only actually trade if T exceeds some minimum capital amount, perhaps 10% of SV
Each time you BUY additional shares, increase PC by 0.5 x T (PC remains the same after each sell).
Don't trade too often, review or trade at most once each month.
do you have a more detailed explanation of how to apply vealies?
Tom Veale, a veteran AIM user and Chief Investment Officer at signalpointinvest.com devised an AIM extension called the Vealie, where rather than selling some shares when AIM indicates it is appropriate to do so, and when cash reserves might already be at relatively high levels, instead you increase Portfolio Control by half the trade value amount indicated to be sold by AIM, without actually selling any shares.
The AIM which is mentioned in the article isn't defined
Its a relatively new (compared to our AIM) UK based market - Alternative Investment Market, that provides smaller outfits the opportunity to get a listing on a stock exchange at a lower cost (and bureaucracy). An upstarts/small co. market.
http://www.londonstockexchange.com/companies-and-advisors/aim/aim/aim.htm
Nothing to do with Robert Lichello's AIM
Using vWave to determine appropriate leverage
The weekly calculated single sector (stock) vWave (appropriate cash reserve for each AIM) is divided by 1.5 to determine the diversified portfolio vWave - the indicator of appropriate amounts of AIM cash reserves across all AIM's.
An alternative is to use the single sector vWave as a indicator of how much leverage is appropriate to be employed at any one time, by subtracting the vWave from 100%.
AIM can provide similar total gains to 100% buy and hold, but do so with less stock exposure. A AIM that averages 80% stock, 20% cash for instance might compare to 100% stock gains.
As the broad average vWave = 50% cash, that implies average 50% (1.5 factor) stock leverage (100 - vWave = 50% leverage). Instead of 20 individual AIM's each allocated 5% weighting and each having half in cash reserves (collectively 50% stock, 50% cash), hold 30 AIM's each with half in cash reserves (collectively 75% stocks, 25% cash). Or alternatively revise each of the 20 individual AIM's to each have just 25% cash reserve instead of 50%.
At more recent 60% vWave levels that implies 100 - 60 = 40% leverage, such that 40% overall stock exposure scales 1.4 times to 56% stock exposure (44% total cash).
At the 2009 lows when the vWave was indicating 15% cash reserves that implies 85% leverage, such that 85% stock exposure x 1.85 leverage = 157% total stock exposure. Whilst that would entail having to employ leveraged ETF's in order to gain such exposure (or other derivatives), having been 157% loaded into stocks at the 2009 lows would have considerably enhanced the rewards from the subsequent stock market recovery/rebound. In practice however the vWave indicated reducing exposure relatively quickly so you'd have scaled out of employing leveraged ETF's relatively quickly. By the time the vWave was back up to 38%, you could have totally ejected the employment of leveraged ETF's (62% stock exposure x 1.62 leverage = 100% stock).
Here's a pre-calculated table of values
Vwave %	Stock Exposure %
 65	47
 60	56
 55	65
 50	75
 45	85
 40	96
 35	107
 30	119
 25	131
 20	144
 15	157
 10	171
 5	185
Re vWave stuck
Here in the UK market gains broadly continue to come half from dividends, half from capital gains. Some years back I believe the US changed taxation policies such that it was more tax efficient to retain more, pay less in dividends.
Generally in the UK we might anticipate a share price that broadly paces inflation, together with a dividend yield on top (in effect the real gain or risk reward amount). One of the measures I periodically review is how share prices (excluding dividends) are generally moving in real (inflation adjusted) terms relative to a start/base date of 1987. Generally prices broadly paced inflation (with some modest zigzagging around) up to the early 1990's, but then progressively rose up to 1.5 times inflation by 1999. Subsequently prices dropped (dot com bubble bursting) by around 33% back down to inflation pacing again by 2003. i.e. the 1999 1.5 times inflation figure was perhaps indicative that prices were at risk of declining 1/1.5 - which they did.
Real prices again rose progressively after 2003 up to 2.0 levels by 2007, and 2008 saw that crash back down again to 1.0 levels by 2009.
Again since 2009 real prices have risen = up to 2.5 times inflation pacing, and as such might drop 1 / 2.5 = -60% back down to 1.0 levels again.
If there's a chance of a 30% fall then its worth keeping 30% cash in hand. If there's a chance of a 60% fall its worth keeping 60% cash in hand. The vWave value of 60% cash is perhaps reflective of such risk. But could stay at such levels, perhaps even rise further until such a correction occurs (or inflation rises to close down the gap).
Since 2000 it would appear that micro-managing the markets (intervention, QE etc) could actually be inducing increased risk/volatility. QE and very low short end bond yields (0.5% or whatever) are an experiment and has induced investors to be more likely to take on risk that otherwise they might not have. It will be interesting to see how it all pans out in the end.
AIM might reasonably be expected to navigate you through such volatility, the vWave supplements AIM providing a broader feel for appropriate levels of cash at any one time.
I've no idea how long such zigzagging of beating inflation and then 'falling' (correcting) back down to a more reasonable inflation pacing levels again - will continue to be followed by subsequent quick 'recoveries' back up to former relatively high levels (and beyond). Its as though more than a reasonable amount is repeatedly being expected from the markets. At some time the markets might realise that the 'lows' are actually more fair-price levels. But that will also need the markets not to be manipulated by the likes of QE etc.
A reasonable return from short dated treasury bonds might be inflation pacing. Lend to the treasury for longer (10 years) and its not unreasonable to expect a little more - perhaps 2% real. Take on stock risk and a inflation pacing share price coupled with a 4% yield would also seem reasonable. Back in the higher inflation years of the 1980's that would have meant something like share prices rising by 8% inflation and paying a 4% dividend. Its as though the markets are expecting such high historic nominal rewards (12% or so total) to indefinitely persist - whilst in a 2% inflation world a 5% or 6% nominal (3% or 4% real) isn't a unreasonable reward relative to 0% real from short dated bonds, 2% from longer dated bonds.
Since 1987 total real gains have doubled up every 9 years pretty consistently, hitting such double ups in 1996, 2005, 2014. i.e. stock rewards are being manipulated by the likes of the Fed to continue to provide around 8% real 1980's type high inflation/interest rate years gains, even in the more recent relatively low inflation/interest rate years. Such expectations IMO are too high.
Over the years I've come to less follow AIM and more follow the likes of the vWave. AIM helps steer you to similar levels of stock/cash levels in a more automated manner such that you're more likely to actually follow such levels. AIM in effect trains you to be more inclined to profit take when high, add when low, whereas normal human nature tends to otherwise steer you to do the complete opposite. Relative to mathematical averages and you might actually just compare to that average, however that is often a lot more than what many other investors actually achieve - as often individual investors actually lag the mathematical average due to having followed their buy-high, sell-low emotions.
Yes. I first got Mr Lichello's book in 1979 at a Stars and Stripes bookstore in England. I've been using it ever since.
Is the vWave a replacement/improvement on the Idiot Wave?
Hi Steve
Right now I would realize a double+ on my remaining cost of SNDK, my largest program. It's off it's high by about 10% over the last 2 weeks.
I should also probably dump a few of my losers (deep divers). If the market does see a correction, they typically are the first fatalities.
Haven't decided quite yet but I probably should do something.

Hi Steve
GIEW is at 40% cash as of today, and I'm thinking of liquidating or reducing some of my programs.
https://publications.credit-suisse.com/tasks/render/file/index.cfm?fileid=88F22B53-83E8-EB92-9D555B7A27900DAC
CREDIT SUISSE GLOBAL INVESTMENT RETURNS YEARBOOK 2013
Page 27
To exploit stock market predictability, investors
should take advantage of opportunities when
returns are expected to be higher, and hence
should buy when prices are low relative to funda-
mentals. In historical terms, that means buying
enthusiastically during the October 1987 crash,
during the Lehman crisis, and during other major
setbacks; and selling outperforming assets during
the 1990s bull market. Following a contra-cyclical
investment strategy, at the very time that investors
are behaving pro-cyclically, is uncomfortable. It is
clear that the potential profits from mean reversion
are in general modest, and that they demand a
disciplined approach to investment strategy.
a 79 yo man who has 450k that he has to live on and invest with. He'll need to get income from the money, but also he'll want it to grow
Yes we MAY be near a short term top, but you can use the V wave as a starting guide of 60 to 65 % cash
Red coats - does seem mad now, but back then battles were typically fought in long lines facing each other using low accuracy/velocity muskets and black powder. The smoke would often quickly cloud the battle field and being able to spot units of friend from foe through the smog could be beneficial.
Part of the British tactics would be to form squares or multiple ranks, enabling more rapid volleys to be fired - often with such attritional rapid fire rates winning out. At the Battle of Rorke's Drift (Zulu war) for instance, 150 British soldiers fought off 4000 Zulu Warriors using such techniques.
Happy Independence Day!!!
(I hope Clive doesn't mind!)

Say your stock drops below the hold zone. You don't follow advice of AIM but hold off and wait for your buy filter to kick in. The stock makes some recovery. Say it goes back into the hold zone (not an unlikely prospect) -- so with this advice you're making your buy of 10 shares at a price within the hold zone. Am I correct.
My understanding of ocroft's approach is that you run AIM as normal, reviewing monthly, maintaining AIM records as though you had bought, but don't actually buy when indicated and instead buy afterwards.
i.e. AIM can at times generate several sequential buy trades in a row, after which there may be no AIM trade indicated - and that is the time you actually buy.
So rather that multiple cost averaging in's month after month during the down-run of a deep dive, you add more shares at a single (larger trade) price that's somewhere after the bottom.
That shouldn't result in you missing any trades - rather you just pay a higher price than you might otherwise have. Price dips, AIM suggests adding 10 more shares at $x, but you don't actually buy at that time. Next month no AIM trade indicated and you're 10 shares short, so you buy at the current price - which might be higher than $x. In which case you've relatively lost, but in other cases queuing multiple buy trades into a larger single buy trade will relatively win. Rather than perhaps 13.3 shares being bought at $75, another 14.8 shares at $67.5, another 16.5 shares at $60.75 (combined $3000 paid for 44.6 shares at average cost of $67.25), you might buy all of those 44.6 shares at a price ('average cost') of $63 price (being the first month with AIM indicating no action/trade after a series of buy trades).
Even if the average of relatively win and relatively lose situations balance out overall, the deferred purchase approach IMO is better suited to a deep dive than is 'normal' AIM (conventional AIM might have exhausted cash reserves due to repeated buy trades as the price declined, and not been able to continue to buy as the share price sank further down. Deferred AIM buys would still have its cash reserves available, waiting for when AIM indicated no further buy trades were being made). i.e. potentially safer/better, with potentially no/low overhead cost (generally) for that additional safety (although there may be a cost for some individual situations (mouse traps where the share price dipped down briefly and then subsequently recovered again).
Wondered if there was a Management Company that would have an Aim bias in their investing philosophy.
That video does look comprehensive, too bad I can't understand it

Book was listed as 1977, First edition, First printing... They sent me the second revised edition from September , 1985
If anyone asks me to explain AIM and its spreadsheet I point them to this detailed youtube
Hi FB
Isn't the cover similar to the second edition? More or less the exact same, but with the second edition having a bar across the bottom stating its a second edition?
I have copies of 2nd and 4th editions. The first of which I bought whilst on holiday in the US, from a second hand book store (as a casually picked up choice for the 8 hour flight home) - way back in the early 1980's.
Regards. Clive.
Hi Tom
We're on the beach looking mostly west on the Providenciales island.

