News
News  Market Data
  Discover
Support: 888-992-3836
Copyright © 2023 InvestorsHub Inc.


Register for free to join our community of investors and share your ideas. You will also get access to streaming quotes, interactive charts, trades, portfolio, live options flow and more tools.
610 & 233 good for some coin
but
tricky on gap a roo day .
Still
down on the 610 signal
entry rally on 233
entry 80.29
out now at 79.71
Been getting some good plays on the XIV 610 tic anchor
233tic entry .
Patience is the way.
*** Trend trade the pull back or rally , both charts in sync , then bingo. Not in sync no play.***
610 anchor
233 entry
not bad today :o)
Bet the ranch short trade.
hi bobjack
gee a whole post got deleted when i went to send it due to LOL me .
Sorry it took me a while to reply , i sometimes have an issue with having
to sign in all the time to IHUB and it is becoming disenchanting.
Yes, spdpros TOS charts are really good :o)
i am not able to view the new one you are speaking of , but have been
using the ones i have had for a while now .
Patience is the thing .
Not sure what you are looking at but for me , if i am sitting here , waiting for the double touch of the channel line in TREND is the trade!!!
i do like the 3day JP pivot TOS as well for that intra day trade.
BUT
For a while now i have been really liking my own S/R lines, drilling down
from the Daily to 4 hour to 60 min .
example XIV
81.50 ish , 80.69 ish to 78.30 did ok this week for me .
Of course trend helps always .
i am going to try to look deeper into your chart and see what i can
see .
Thanks for your post .
All the best
CH
I'll talk to the tos tech gurus when I can >
something changed a while back I have not been
able yet to figure out where > ???
The "Sharing Workspace" Method that I used on 5/25 is not working for me today.
bobjack
Hi HawkMan, I like your handle, makes me think of a hawk in a power dive as soon as I see your name, and SPDPRO, spdpro makes me think FAST cars everytime too.
I gave up on day trading, OR any short term trading in general..
Win two, lose 4 for me. Kept getting killed by oddball things too. The whole born loser syndrome.
I had not payed any attention to the market for last year and a half, just got back into TOS a couple of weeks ago. Had to re-learn it, BUT, what little I knew is all back and a little more. Market Forecast is a proprietary study, you cannot view the code, BUT, it seems quite useful, the studies that I have been watching are that, along with tripple stoch on one plot, and tripple cci on one plot, looking for all three to act in unison, indicating that three time frames are in synch. add MACD with Bollinger Bands and PMO studies, At One Glance brings 11 indicators to the show in one summarized dashboard/paintbar array.
When I saw spdpro's chart with NewStudy23TTMandBB2, I was intrigued and found it to look quite useful.
I have not traded any thing for 1 1/2 years, but, these look pretty promising for 4 hr charts on NUGT/Dust. I am watching a combination of 2 hr, 4 hr, and daily to get a feel for it, and keep scrolling thru the last couple of years to watch how the signals vs action played out.
Doesn't hurt to look at weekly for last 5 years to get a different perspective either. As far as I know, none of the studies that I mentioned flip flop on past bars except the NewStudy23TTMandBB2, which I observed changing signals after the fact as mentioned earlier - I love the indicator, but don't really trust it. I need to watch it real time, probably with short time frames to assess that. PROBLEM for me is: 4 hr and daily charts are like watching paint dry. My attention span wanders, I have too many interests. Short timeframes keep me involved, BUT, always lose money for ME.
Another lesson that took me forever to learn, counter trend trades are MUCH more dangerous than trades with the daily/weekly trend.
Flip Flopping or swing trading NUGT/DUST looks easy on the surface, BUT, I find that I cannot distinguish between the small whiplash/countertrend signals from real longer term/stronger signals.
http://tos.mx/njWUTp
actual, now I have 5 stoch and 4 cci curves on 2 studies, the extra curves don't add that much info, I guess on the "rare occasion" that all 5, or all 4 dip/top together, you have a really strong signal.
Good Trading To You an SPD
bobjack
hi bobjack
Thanks for this up date.
i am going to work on this method you are presenting.
When i get it going , i hope to be able to share with you and spdpro
any things i see about working the chart or charts.
The 4 hour maybe great.
Have had to be very selective on lower time frames 233t n 400t due to
lacking Volatility and etc.
Still doing able but slim pickings , also depending the hours one wants
to sit.
i have a daily and 4 hour chart with my own lines .
But do like JP TOS pivots daily 3 day and etc. Depending on the chart.
XIV mostly but i do look at NUGT and DUST as well .
Happy Sunday
CH
Funny, as I read your reply, I saw the yellow up arrow (on the NewStudy23TTManBB2)on the lower study flipping between last full bar and current in progress bar. This is on a 4h chart. Also notice that Hull Moving Average Plot is 2 bars behind (I suppose that's the nature of the Hull indicator). I guess my mornings observations have answered last night's question, but any comments that you offer are welcome.
not at home > will reply later
spdpro,after looking ,with much interest, at that workspace from #3422, it seems to be very accurate and useful. This may seem to be a very dumb question, BUT, do the arrows and color changes happen real time (end of bar), or like a bar delayed, meaning an arrow shows up "today" on "yesterday's bar", not today's bar. I saw a study called YABSI that looked impressive, but upon usage, for example, I found that the signals appeared today on yesterday's bar. A bar or two delayed and quite useless to me.
I hope this question makes sense and I hope you don't mind me using your workspace.
TIA
bobjack
spdpro/cityhawk, Pardon my intrusion, but, at 1:30 PM, 5/25/17 , I was able to "open shared item" in TOS, type in htty://tos.mx/AKNTYI (notice capital I, not L) and open a chart shared by spdpro. There were no plots in the upper OR lower areas, BUT, all the studies were there when I clicked "edit studies". I saved the studies as a set, then detached a chart of mine, and told TOS to use the spdpro study set and voila, I had the chart with data and studies, it looks just like the picture in post #3428, except it has data for my ticker (NUGT) instead of -ES.
Hope this is useful to you,
BTW, I look at spdpro posts a couple of times a year.
bobjack
spdpro
How be ???
So i was on youtube trying to find out about that TTSqueeze indicator
you tried to send me , that i can not transfer over as of yet and can
not locate on the custom indicators which it is , if indeed is available
where i am able to find LKB 10 etc.
Perhaps if you remember the name that was used i can just click it in
one of my 233t or 400 t's .
Do not want to be by ass ed LOL but if we are at some large type of
Res. might make a good case for catching a few waves soon?
But
If winds of being Sup. well might just have to pull that Bull trigger.
*** Maybe i should look at VXX during bullish XIV and trade XIV :o) ***
Always looks more attractive looking at the down chart pattern ?
The look of the BR covering with it curling down above as a block for it
not to go up !!!!!!!!!!!
In this case it is the BR money rainbow making dream maker !!!
Maybe we should fill in the space bet. the Bottom and Top lines of the
BR with different rainbow colors .
Gee , what a salesman i would make at the expo ???
just looked version/build 1900.14
here is the print on 1900.14 >
http://tlc.thinkorswim.com/center/release
I threw a bunch of drawings on a chart and deleted them
with no unusual problems > Note the drawings were Not
from a previous build
all my other stuff looks and acts normal at first glance
TOS bug
I went into delete old drawings on chart and it hangs without
deleting the drawings. so i have to close TOS thru task manager.
New version of TOS
i am getting orange triangle which means
contains charts from previous TOS message
so just save chart
drawing tools are now on the right
Yes, I agree.
Over time i intend on better limit order style , if possible .
But, do not want to out trick these moves.
Market orders do give ok entries, when the movement is fast.
The 233t moves about a bar or so a min.
So, I have my trigger timing down.
But they fill as they fill.
Maybe due to electronic they can move a few ticks with the orders to fill to the max or close?
Still worth the wait , pre jumping signal not wise!
Obey the BR wave , wait for the double or crack in trend MO MO !!!
Will take a look at tasty.
IB is ok but they can be complicated in some ways.
Have a good Friday .
tastytrade/tastyworks has the lowest rates >
Tom Sosnoff former TOS ower was the reason
everyone lowered the rates after he started it
platform is called tastyworks > some of the same dev people
from tos did the code
the key is to use tos to chart and trade wherever best
https://www.tastyworks.com/commissions-and-fees.html
It pays to wait for the BR to be directional 233t .
Then take the trade on a rev and crack or a double or near it at BR.
Take a piece and that be it .
Ok
am here on the move with the 233t XIV
Google Chrome was a bust here > back to tos tech
Yea, 17.83% !!!
Maybe the start of a leg ?
i will try to give TOS a call tomorrow and see if i can get a fix.
*** i notice a few brokerage firms are lowering the flat rate to about
$5 ish. i wonder if the charting could compare with TOS ? ***
To have the charts and the entry in the same place a little easier.
But , i can still work around it .
Also, at $10 round trip , that will be in line with IB on an ok number
of shares.
Still, without being able to dupe the charts , not worth it.
call tos tech before 5pm central >
seems I miss them with my schedule at the moment
phone number is on the tos start up page with sign in
ok
Great looks like a good one , chart.
Big move going on this morning.
i can fish around in the custom indicators section for the lower one on this chart.
Might take a look.
But
For sure at some point if we can connect on TOS share , great.
I'll pass you this when we get the swap issue
figured out > 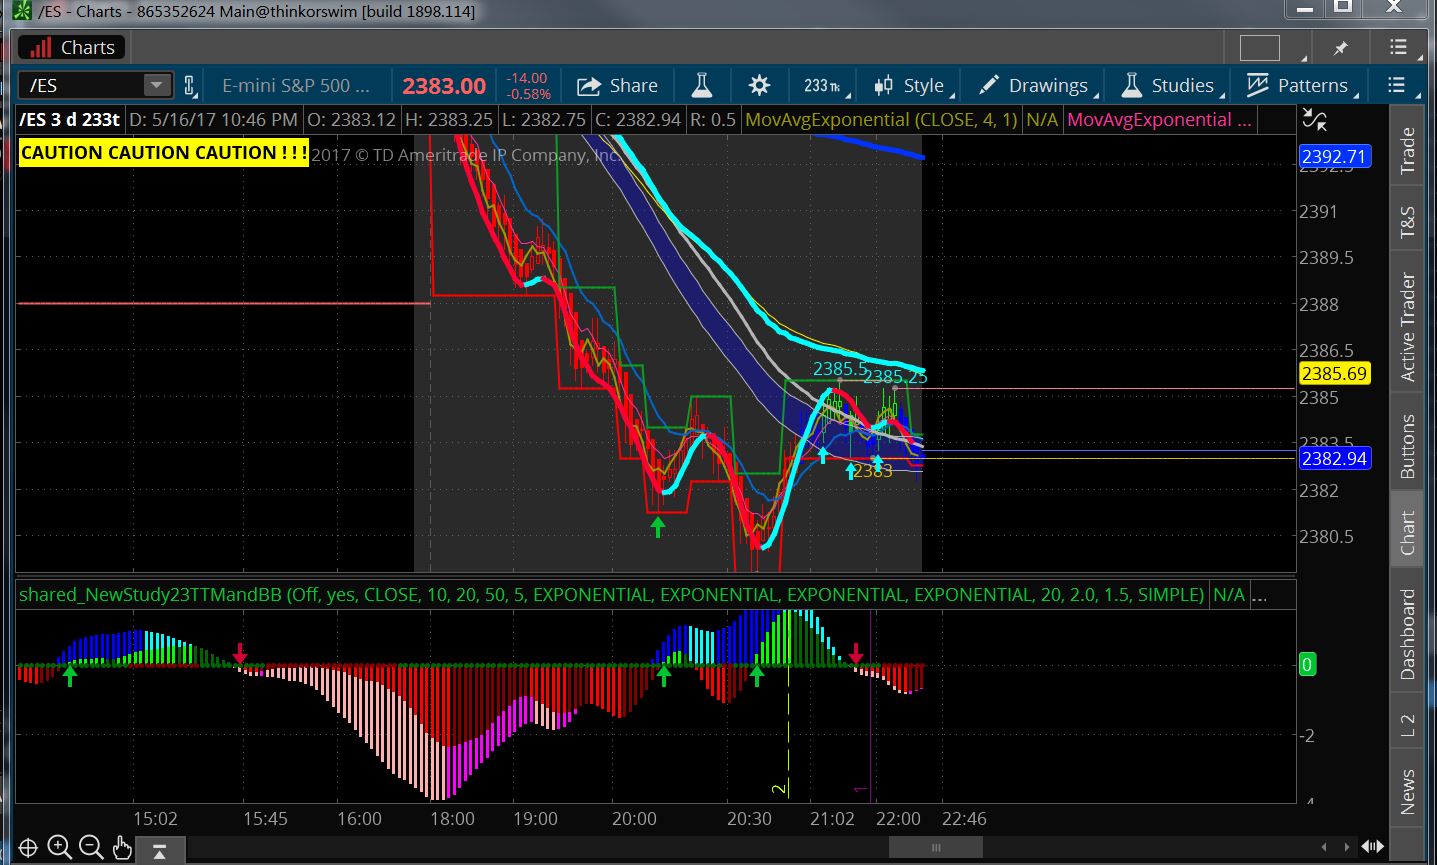
Wonder why , but it is kind of free.
Still, I appreciate your help and the spirit of the charts !
Good stuff they are.
Require patients, a bit of a birds eye of sorts and $ management for the 1 2 or 3 type of trade set up.
Still , as you know some of the best charts going ?? ?? ??
trying to solve this win 7 sharing thing >
missed tos tech to today but will call them in AM
and see if they have a solution
let me know > Later
Good Morning
i will have to down load FireFox to try.
But
Come to think of it i can try Google Crome and will.
Thanks
Alternate to try > Go To myTrade on TOS >
TOOLS > click >
myTrade > click >
look for spdpro entry > In The Link Box on Left >
Left Click on link IE: http://tos.mx/ (and the rest) and
click OPEN > It should open properly
hawk > try this on Firefox > http://tos.mx/AKNTYI
Below this line on the page http://tos.mx/e8tc00
is
Open shared Chart in thinkorswim
below that is
this
in a green area which says
Install Thinkorswim and view chart
Since i already have Thinkorswim i am not sure to install it just to
view a chart .
http://tos.mx/e8tc00
Perhaps if you click on this you will see what i see.
spdpro
How be ???
Might you be able to describe where the view tab maybe?
Click 'View in thinkorswim' to view this chart in your thinkorswim platform. If thinkorswim is not currently running, it will load and prompt you for your username and password.
Can not find this darn tab. "View"
Also, have changed my sign in shared code , so all ok on that end.
Still, the process of getting your shares on to my TOS is not working
as it use to , meaning pretty simple.
The good news is that i did some of the reconfiguration on a few of them
and think that my new feeling of the 233t with the stuff on it already
maybe great.
i shall try to clip and send you the stuff on the chart .
No play as of yet for me.
XIV
No forcing the trade , just wait to see something ok.
Ok
Now here and will check all out .
i think i have to resign into the share system to be able to
see what you are showing my TOS .
So i will work on that.
not at home > will look at it later
Is Think or Swim having issues again? This is the error I get when I log into my account that has multiple accounts linked to it, "Some data could not be calculated."And a, "The system is temporarily unavailable. Please try again later." Will this be fixed by before trading begins this morning?
I ended up calling TOS tech again today. My platform is running so slow, I can barely put in a trade. Now their excuse is that my processor isn't powerful enough. I've had this for just a little over a year now. I never had issues like this until a month ago. They did mention to re-set the charts to default settings. It did run much faster, however, it wipes out all studies. I guess it would be similar to deleting TOS & downloading a fresh version of it. I'm guessing, all of the old studies in the background, bogs it down? I wish TOS would focus on performance instead of bells & whistles.
copy > similar here with 4 22's > keep me posted
Will do. BTW, I have 5 screens with 24 minimized screens in them. I have always had these & rarely an issue until recently.
beach > have not had a real change to eval >
if you talk to tos tech pls post here what they say > thanks
I know one of my probs is I have way too many tos charts/windows
up and running usually > (5 or so active and prob 15+ minimized)
> I'll knock it down to 3 or 4 for compare
I have been periodically running speed tests during the day. they range from 19.06-40.32 Mpbs & 16.14-22.92 Mpbs Did your new TOS DL run better for you? I may just try calling tech support again to see if I can find someone there that can fix this.
Thanks for your help!
beach > run this test at night And in morning >
write down the numbers > http://www.speedtest.net/
now I'm > ping 21ms / download 15.07Mbps / upload 1.45Mbps
problem I have at the moment is ATT has the
neighborhood dug up and installing fiber >
they have knocked me out a few times during this
transition period > glad when it done and up on fiber
?? today seemed unusual here also > why ? > I was
not using it all day but when I looked it seemed slow
> just did a tos 64 bit download/reload > will see what
happens in the AM with some changes I did (tos settings and JAVA)
let me see what happens and I'll get back to you >
made some JAVA stack / heep setting changes
Win 10 64 bit. Solid machine. Yesterday TOS was solid, today ? not so much.
|
Followers
|
44
|
Posters
|
|
|
Posts (Today)
|
0
|
Posts (Total)
|
3631
|
|
Created
|
08/22/10
|
Type
|
Free
|
| Moderator desertcynlite | |||
| Assistants spdpro | |||
This board is for those interested in using technical analysis to trade ETF's and stocks using swing trading and day trading systems. The board is for open minded people who wish to share ideas and observations about just in time action in the stock market. All are welcome to join in the fun! ThinkorSwim is the primary platform used to create charts and as such most of the discussion is around programming and creating charts in ThinkorSwim.
Please keep all posts civil, leaving political discussion and egos checked at the door.
P.S. Please use "OT" prior to any post that does not contain on topic material. However, please keep in mind that in order for this to remain a "free" board according to the rules of Investor's Hub, most posts should remain on topic.
Thank for joining the board!
Resources on the Web:
The Chart Pattern Trader: http://thechartpatterntrader.com/
VIX Blog: http://vixandmore.blogspot.com/
Understanding Decay Part 1: http://caps.fool.com/Blogs/understanding-etfetn-decay/597736
Understanding Decay Part 2: http://caps.fool.com/Blogs/understanding-etf-decay-part/597928
Volatility Indexes: http://hypervolatility.com/volatility-modelling/equity-volatility-indices-vix-vxn-vxd-rvx/
2013 Spreadsheet VIX&SPX: http://investorshub.advfn.com/boards/read_msg.aspx?message_id=91737761
Trading Gaps: http://www.thegapguy.com
Stocktwits.TV: http://www.stocktwits.tv/
Wall Street Journal: http://online.wsj.com/mdc/public/page/marketsdata.html
Dow Theory: http://en.wikipedia.org/wiki/Dow_theory
Ten Best Candlestick Patterns: http://www.swing-trade-stocks.com/candlestick-patterns.html
Bullish/Bearish Candlestick Patterns: http://www.candlesticker.com/Bullish.asp
Bulkowski's Best Chart Patterns: http://thepatternsite.com/BestPatterns.html
Using Prophet Charts to find Patterns: http://www.youtube.com/watch?v=VkpMHF7Ridc
Economic Calendar: http://www.bloomberg.com/markets/economic-calendar/
Tim Knight's Slope of Hope Blog: http://slopeofhope.com/
Corey Rosenbloom's Afraid to Trade Blog: http://blog.afraidtotrade.com/
Condor Options Blog: http://condoroptions.com/
Great Software for IRS Wash Sales: http://www.tradelogsoftware.com/products/tradelog/
Abnormal Returns Blog: http://abnormalreturns.com/
ETF Prophet: http://etfprophet.com/
Buy/Sell Model: http://buysellmodel.com/
Monthly Put/Call Analysis for Opt. Exp.: http://leavittbrothers.com/blog/?cat=103
Option's Calendar: http://www.cmegroup.com/trading/equity-index/files/SP-500-options-calendar.pdf
HeatMap of Market - configurable: http://www.smartmoney.com/map-of-the-market/
Trading Gaps: http://trading-stocks.netfirms.com/gaps1.htm
The "Myth of Max Pain" article: http://investmentxyz.blogspot.com/2006/05/myth-of-max-pain_19.html
Trading Videos:
Tastytrade Market Talk Videos: https://www.tastytrade.com/#/shows/market-talk
Emini Trading: http://emini-watch.com/
#######
Think or Swim Resources:
email: thinkorswimtechsupport@tdameritrade.com; phone: 800-672-2098 (ask for Chicago office.)
Constant Colors: http://team.thinkorswim.com/manual/dark/thinkscript/reference/Constants/Color/index.html
Custom Sounds: http://finance.dir.groups.yahoo.com/group/TOS_thinkscript/message/4780
ReadTheProspectus: http://readtheprospectus.wordpress.com/
Shadowtrader: http://www.shadowtrader.net/weekend_updates2011/111030we_final.html
Free Code: http://freethinkscript.blogspot.com/
More Free Code: http://search.traders.com/search?q=thinkorswim+script&btnG=Search&entqr=0&output=xml_no_dtd&sort=date%3AD%3AL%3Ad1&client=default_frontend&ud=1&oe=UTF-8&ie=UTF-8&proxystylesheet=default_frontend&site=entire_site&filter=0
TOS Ratio Charts: http://investorshub.advfn.com/boards/read_msg.aspx?message_id=72707087
ThinkDesk User's Manual: http://mediaserver.thinkorswim.com/support/thinkDesktop.pdf
Linking Excel and ThinkorSwim: http://readtheprospectus.wordpress.com/2009/09/06/linking-excel-and-think-or-swim-for-streaming-real-time-calculations/
Thinkscript:
Custom Indicator Scripts: http://www.thinkscripter.com/
Paintbars Come to ThinkorSwim: http://readtheprospectus.wordpress.com/2009/09/12/paintbars-finally-come-to-think-or-swim/
Getting Started With Thinkscript Parts 1 & 2:
Part 1: http://www.youtube.com/watch?v=J4y19UdTA9A&feature=related
Part 2: http://www.youtube.com/watch?v=gRB42FsOWRw&feature=related
ThinkScript User's Manual: https://www.thinkorswim.com/tos/thinkScriptHelp.jsp?laf=dark
ThinkorSwim Resource Manual: http://team.thinkorswim.com/manual/dark/index.html
Prodigio: (Prodigio is no longer supported by TDAmeritrade!!!
email: Prodigio@thinkorswim.com; phone: Direct 773-244-7749 or 866-839-1100 ext. 7749;
Forum: http://www.prodigiorts.com/http://www.prodigiorts.net/forums/Getting%20Started
Video Archive: http://www.prodigiorts.net/videoarchive
Introduction to Trading with Prodigio: http://www.youtube.com/watch?v=OtcU6Z0m2po&feature=related
Prodigio Manual: http://rr-corner.squarespace.com/prodigio-manual/
Posts with Custom Code not in TOS (may contain errors...works in progress.)
Spdpro: http://investorshub.advfn.com/boards/read_msg.aspx?message_id=68488237
Fibonacci Pivots: http://investorshub.advfn.com/boards/read_msg.aspx?message_id=72995202
ADX: http://investorshub.advfn.com/boards/read_msg.aspx?message_id=73059624
Standard Pivots: http://investorshub.advfn.com/boards/read_msg.aspx?message_id=72983311
BollingerBand Fill: http://investorshub.advfn.com/boards/read_msg.aspx?message_id=72971915
Spdpro: http://investorshub.advfn.com/boards/read_msg.aspx?message_id=72934360
RVI: http://investorshub.advfn.com/boards/read_msg.aspx?message_id=72375457
RSI with Gradient Line: http://investorshub.advfn.com/boards/read_msg.aspx?message_id=73474308
EMASix: http://investorshub.advfn.com/boards/read_msg.aspx?message_id=74016255
Spdpro update 4/8/12: http://investorshub.advfn.com/boards/read_msg.aspx?message_id=74153484
Volume with 2 Averages: http://investorshub.advfn.com/boards/read_msg.aspx?message_id=74343095
Alert Code: http://investorshub.advfn.com/boards/read_msg.aspx?message_id=91364438
Fractal Code: http://investorshub.advfn.com/boards/read_msg.aspx?message_id=91678788
Volume Zone Oscillator http://investorshub.advfn.com/boards/post_new.aspx?board_id=18585
Using Pivot Points:
Custom Code: http://investorshub.advfn.com/boards/read_msg.aspx?message_id=121798065
https://www.tradingview.com/chart/SPX500/47iWUwzO-Pivots-Indicator-I-Made-A-Living-Trading-This-System-For-2-Yrs/
http://www.pivotpointcalculator.com/
http://tradingmarkets.com/recent/combining_trading_strategies_to_improve_your_odds-640609.html
http://tonylaporta.com/the-intricacies-of-the-pivot-points/
Technical Issues:
Reoccurring Error Messages in popups: http://investorshub.advfn.com/boards/read_msg.aspx?message_id=73711643
Restore to Previous Build: http://investorshub.advfn.com/boards/read_msg.aspx?message_id=73713733
Software Questions/Answers: https://www.thinkorswim.com/tos/displayFaq.tos?categoryKey=SOFTWARE
#######
Volatility:
Quarterly Statistics: http://www.investopedia.com/articles/financial-theory/08/volatility.asp#axzz1wBh8M2L2
Volatility Calculator; just input symbol: http://etfreplay.com/volatility.aspx
Resources for Measuring Economic Growth:
ISM Report: http://www.ism.ws/ismreport/mfgrob.cfm
US GDP Growth Rate: http://www.tradingeconomics.com/united-states/gdp-growth-annual
20 Year Treasury Bond Forecast: http://forecasts.org/interest-rate/20-year-treasury-bond-yield.htm
TED Spread Chart: http://thedismaloptimist.net/index.php/ted-spread-chart.html
H.15 Release http://www.federalreserve.gov/releases/h15/current/default.htm
#######
| Volume | |
| Day Range: | |
| Bid Price | |
| Ask Price | |
| Last Trade Time: |