 News
News  Market Data
  Discover

Support: 888-992-3836
Copyright © 2023 InvestorsHub Inc.


Register for free to join our community of investors and share your ideas. You will also get access to streaming quotes, interactive charts, trades, portfolio, live options flow and more tools.
How much longer till Biden ceases to function?-
Watch: Biden Thinks Russia Invaded Iraq
https://www.zerohedge.com/political/watch-biden-thinks-russia-invaded-iraq
My Comment: Biden's brain is scrambled eggs
Excerpt:
Biden was asked about reports that the Russian military is to leave the city of Kherson in Ukraine, one of the only major cities they have successfully occupied since the invasion began.
“I think the context is that whether or not they’re pulling back from Fallujah,” Biden said before racking his brain to try and recall where Russian troops really are.
Fallujah is in Iraq.
It’s not even on the same continent.
Regardless.....


And NOBODY messes with the U.S. of A !......We know what we WANT !
.
.
The Ship of Fools-
Sequoia Writes Off Entire $210MM FTX Investment; Here Are All The Other Funds That Are Losing Billions In FTX
https://www.zerohedge.com/markets/here-are-all-funds-are-about-lose-billions-ftx
Excerpt:
Still, while billions will be lost, nobody will be crushed as much as Bankman-Fried himself, whose personal wealth has collapsed from $16 billion to what may now be a negative number when accounting for his personal debt. Of course, it's all downhill from there especially once SBF is thrown in prison from stealing billions in client funds in his exchange and using them not even to buy yachts but to make catastrophically bad investments.
270,782886
The Grinch Who Stole Christmas.....
7 percent of the S&P

Black Freaking Thursday and Friday ahead ?
Just as plain as the nose on either yours' or my face......
.Especially when the/a longer-term charts are looked at.
Man, what a great freaking "system" you all have designed down there !

Good thing we got FOOTBALL to watch at least.

.
Yeah, China's markets rallied on speculation of less restrictive lockdowns, but it ain't happening
China reports 8,335 new COVID cases for Nov 8 vs 7,691 a day earlier
''https://www.reuters.com/world/china/china-reports-8335-new-covid-cases-nov-8-vs-7691-day-earlier-2022-11-09/
China's COVID epicentre shifts to Guangzhou as outbreaks widen
https://www.reuters.com/world/china/guangzhous-covid-outbreak-deepens-more-lockdowns-loom-china-2022-11-08/
Cryptos are showing their true values -
Panic in crypto can trigger 'capitulation' in most markets that are already under pressure - analysts
https://www.kitco.com/news/2022-11-09/Panic-in-crypto-can-trigger-capitulation-in-most-markets-that-are-already-under-pressure-analysts.html
My Comment: What a joke. I think Cryptos' intrinsic value is zero and it is fast approaching that level. The turmoil certainly destroys trust in the market
Excerpts:
Bitcoin tumbled to November 2020 lows, down nearly 16% on the day, and last trading at $17,029.47. Ethereum dropped to July lows, down 24.5% on the day, and last trading at $1,165.42.
"Many of the problems of traditional finance which cryptocurrencies aim to solve are being replicated in the crypto market, as many centralized entities have become too greedy,"[color=red][/color] Sotiriou added.
Last Friday ;

High 16,513

.
CHINA is coming back on line !.....
Interest rates have PEAKED !
GLOBAL INVESTMENT OPPORTUNITY OF A LIFETIME !
Don't you DARE miss the boat !
LoL

Tungsten !.......Aluminum !..........Copper !.........GOLD !
EVERYTHING'S going to go UP !
CURSES !!!!!!!!.........

AAPL / SPY

etc., etc.,.
Including :

O.M.G.
Last 21,239
.
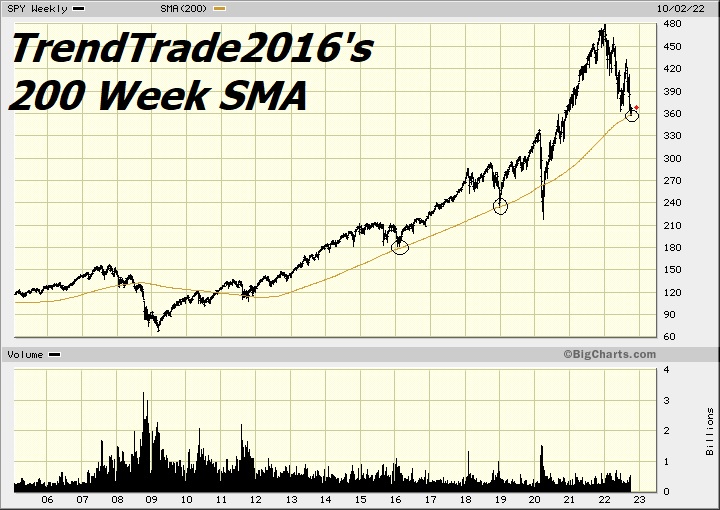
The 200-dMA is falling so that 4000 area could turn out to be an important test for the rally. I'd be inclined to wait and see what happens at the 200-day, assuming the rally get's that far. I think the bottom is in, but there are enough issues to be concerned. In 1998 there was a 20% correction. The dot.com crash began 18 months later. Something similar is possible this time.
IMHO the 20w low has occurred. The straightest part of a sine wave is 1/4L, and centered at the midpoint of the upleg, and also the center of the downleg. For the 20w, the slope of a 5week sma should approximate those legs. If the slope during the downleg is only allowed to become more negative, a trendline with that slope approximates the channel boundary surrounding the 20w sma. Such a trendline was soundly violated this week and hence the low has occurred. Presumably, the 40w sma slope will remain negative and the FLD suggests that the run-up would not exceed 4000-4050 area. Given the bearish scenario LT, this would be an excellent area to Short, imho.
American Professional Bank Fraud Week......
SEE what they generally can DO (mark reversals)
Many Republicans are now currently disatisified by ridiculous market activity......
When it's declining they are all full of glee.
But lately that's not been the case.

.
Mission accomplished : Perhaps now Leg 2 (of the Mkt Game).....
In which one was to guess where things would be come Election Day
S&P Futures are currently down 11 to 377
Nope make that now down only 3

8 plays (days) earlier ;

THE SCRIBBLERS GOT STOPPED AT THE 380 YARD LINE

Likewise, Bitcoin's gettin' stopped at its' overhead diagonal ?
![]()
Aren't mkts simply zig-zagging until the election is over ?
We're about to learn whether they can bust the SPY out to over its' 380
.
Many Republicans are now currently disatisified by ridiculous market activity......
When it's declining they are all full of glee.
But lately that's not been the case.

.
Interesting Times -
Chinese stocks and Yuan are crashing and their debt levels are a serious problem.The zero Covid lockdowns are negatively impacting the economy. Their bubble economy is deflating.
Biden is losing it. I don't think he will be able to complete his term. But can the country survive with Kamala Harris as president? I think they will try their best to literally prop Biden up for two more years. One problem is countries like China, Iran, and Russia will see Biden in a weaken state and take advantage of it (eg Taiwan invasion).
China Stocks Crash As Xi Tightens Grip On Power
https://www.zerohedge.com/markets/china-stocks-crash-xi-tightens-grip-power
After Xi's 'Crowning', China 'Surprises' World With GDP Growth Beat; Yuan Slides
https://www.zerohedge.com/economics/after-xis-crowning-china-surprises-world-gdp-growth-beat-yuan-slides
Watch: Biden's Brain Reboots Mid-Interview
https://www.zerohedge.com/political/watch-bidens-brain-reboots-mid-interview
Last week indicators were slightly bullish. Last Friday they turned full on bullish with 18-Bull and 10-Bear. I'm fully invested. This time, will the S&P 500 break thru its 200-dMA?
Biden: Deficit reduction in chief -
U.S. 2022 budget deficit halves to $1.375 trillion despite student loan costs
https://www.reuters.com/markets/us/us-fy-2022-budget-deficit-halves-1375-trln-despite-student-loan-costs-2022-10-21/
My Comment: The Federal budget deficit fell to $1.4Trillion for FY2022, half of the $2,8Triilion deficit for FY2021. And this reduction was in part due in large to tax receipts hitting a record $4.896 trillion, up $850 billion, or 21% from fiscal 2021. The total debt under Biden over two years is $4.2Trillion. And he keeps spending like a drunken sailor. I'm expecting the national debt to reach $40Trillion by 2026. The deficits will explode higher in the recession. The national debt will keep interest rates high as investors demand compensation for holding US Treasuries.
SPX 3 666 !.....Go U.S.A. Go !
Holy Doodle - Rebound City - 1/2 hr before the bell ?
Futures shot from minus 30 to where they are now green

![]()

Killer US Dollar strength = Economic Warfare ?
Destroy your competitors economies by blowing up thier pipelines ? - Cathrine Austin Fitts explains
Supress the price of gold. AND Bitcoin https://investorshub.advfn.com/boards/board.aspx?board_id=26047
19,000 Baby ! https://investorshub.advfn.com/boards/read_msg.aspx?message_id=170252569
To me sounds like conspiratorial stuff but is beginning to look sound real
Hugely support the war effort in Ukraine
Sanction China hard
U.S. = how many trillions in debt ?.....So why is the dollar strong ?
I dunno - I just go by lines on charts......where the facts they get REVEALED
This is the week that the chit hits the fan
Might just be Black Fri
Futures minus 29.........1hr before the bell
https://bigcharts.marketwatch.com/advchart/frames/frames.asp?show=&insttype=&symb=usdgbp&x=55&y=12&time=19&startdate=2%2F4%2F2020&enddate=10%2F19%2F2022&freq=1&compidx=aaaaa%3A0&comptemptext=&comp=none&ma=0&maval=9&uf=0&lf=1&lf2=0&lf3=0&type=2&style=320&size=3&timeFrameToggle=false&compareToToggle=false&indicatorsToggle=false&chartStyleToggle=false&state=9
September 26th..................Locate that date in link above)

The BOJ (Kuroda) is asking the same thing as the Yen is near a critical 150Yen/US$. If it breaks above that level, it could bring in more Yen weakness and make YCC very difficult for the BOJ.
It's the Dollar !......It's the Dollar !...........Oh my God just WHEN will it STOP ??????

Oh,,,,,,Hey.........hmmmmmm..........What, huh ?.....................................................................................................September 26th (see chart above)

Worlds' 2nd largest Financial Center
https://www.nytimes.com/1985/02/26/business/dollar-reaches-further-records-as-gold-slumps.html
.American Professional Bank Fraud Week/Period - The week(s) in which U.S. banks report.
.
Nouriel Roubini: stagflationary debt crisis like 'never seen before,' investors need assets like gold
https://www.kitco.com/news/2022-10-17/Nouriel-Roubini-stagflationary-debt-crisis-like-never-seen-before-investors-need-assets-like-gold.html
My Comment: Got Gold? Buckle up.
Excerpts:
"The decade ahead may well be a Stagflationary Debt Crisis the likes of which we've never seen before," Roubini wrote in his latest Time essay.
There are enough signs to forecast that a severe stagflationary debt crisis will define the next recession.
"As a share of global GDP, private and public debt levels are much higher today than in the past, having risen from 200% in 1999 to 350% today. Under these conditions, rapid normalization of monetary policy and rising interest rates will drive highly leveraged households, companies, financial institutions, and governments into bankruptcy and default," Roubini explained.
In light of this, investors need to seek assets that protect against inflation, political and geopolitical risks, and environmental damage. And that includes gold.
"These include short-term government bonds and inflation-indexed bonds, gold and other precious metals, and real estate that is resilient to environmental damage," Roubini added.
At this point in time, central banks are in the so-called "debt trap," Roubini described. "Any attempt to normalize monetary policy will cause debt-servicing burdens to spike, leading to massive insolvencies and cascading financial crises," he wrote.
Throwing good money after bad -
My Comment: This will be a global collapse with Europe, Japan, and China in dire straits and the US not far behind. It's all about the DEBT.
China is facing a full-blown debt crisis with $8 trillion at risk as Xi Jinping eyes an unprecedented 3rd term
://www.msn.com/en-us/money/markets/china-is-facing-a-full-blown-debt-crisis-with-8-trillion-at-risk-as-xi-jinping-eyes-an-unprecedented-3rd-term/ar-AA131ejK?ocid=msedgntp&cvid=d3f1fd2365894f3296e333bdb9cc3586#image=AA130YVW|7
Excerpt:
Experts think Beijing will have to step in with a bailout as officials try to prevent an already-slowing economy from deteriorating further.
"To avoid major local dislocations or damage to overall economic recovery, the government is, in our view, still highly likely to intervene to support strategically important state-owned companies and prevent defaults that would trigger localized financial stress events," said Yating Xu, principal economist at S&P Global Market Intelligence.
Derivatives: Weapons of Financial Destruction -
Macleod: The Great Global Unwind Begins
https://www.zerohedge.com/markets/macleod-great-global-unwind-begins
My Comment: This rising interest rate environment is putting real pressure on banks through their derivatives exposure. Even Central Banks balance sheets are negatively impacted by rate increases. Something really big is going to break. The dominoes are lined up and ready to fall. This article is long, but it gives a very good discussion of the financial quagmire in Europe and Japan. Something really big is going to break.
Excerpts:
The LDI episode is a warning of the consequences of a change in interest rate trends for derivatives in the widest sense. We should not forget that the evolution of derivatives has been in large measure due to the post-1980 trend of declining interest rates. With commodity, producer, and consumer prices now all rising fuelled by currency debasement, that trend has now come to an end. And with collateral values falling instead of rising, it is not just a case of dealers adjusting their outlook. There are bound to be more detonations in the $600 trillion OTC global derivatives market.
The burden of bail outs will undoubtedly lead to new rounds of currency debasement directly and indirectly, as vain attempts are made to support financial asset values and prevent an economic catastrophe. Accelerating currency debasement by the issuing authorities will almost certainly undermine public faith in fiat currencies, leading to their entire collapse, unless a way can be found to stabilise them.
But one thing is clear: with CPI measures rising at a 10% clip, interest rates and bond yields will continue to rise until something breaks[color=red][/color]. So far, commercial banks are dumping financial assets to deleverage their balance sheets. The effects on listed securities are in plain sight. What is less appreciated, at least before LDI schemes threatened to collapse the UK’s gilt market, is that the $600 trillion OTC derivative market which grew on the back of a long-term trend of declining interest rates is now set to shrink as contracts go sour and banks refuse to novate them. That means that up to $600 trillion of notional credit is set to vanish, in what we might call the Great Unwind.
This downturn in the cycle of bank credit boom and bust will prove difficult enough for the central banks to manage. But they themselves have balance sheet issues, which can only be resolved, one way or another, by the rapid expansion of base money. And that risks undermining all public credibility in fiat currencies.
I see it as a short squeeze. I also think the markets interpret the CPI as using old (6-9 mos old) rent data, but the Fed will raise rates based on the numbers generated for the CPI (another 75 bp this month). This rally should be shorted.
When bad news is met by a strong move higher in markets, we interpret it as a very bullish sign. We also note that today was a bullish Outside Reversal Day. We’ve seen bearish reversals in August and September; this is the first bullish reversal signal since 1 July. That signal presaged a 13% rally in the S&P 500. Based on my bottom analysis, it appears that this time it may be signaling a more significant move higher – my “time to buy” signal was triggered on 27 September with the warning that the S&P 500 might fall below the 27 Sept close, but probably not more than 5% below it. The Index did close about 2% below the 27 September low. Today’s move suggests we may not dip below the lows again...
...Volumes have been declining since the 30 Sept low suggesting a slowdown in selling and tending to confirm that the bottom might have been in the vicinity of 3600 on the S&P 500. This has continued to support the position that the best move is to “buy-the-dip.” Today volume bounced back to about 5% above the monthly average. Further 80% of the volume was up-volume. Another strong 80%+ up-volume day Friday would be a bullish sign, adding evidence that 12 October was the final bottom.
The $31 Trillion Dollar Question – Can The Fed Afford To Pivot?
https://www.zerohedge.com/geopolitical/31-trillion-dollar-question-can-fed-afford-pivot
My Comment: It's going to get ugly. Got Gold?
Excerpt:
In the short to medium term, however, the pain for much of the world will be intense, including the US. Much of the deflation in certain sectors of the US economy from the Fed’s intense interest rate policy should be offset by capital inflow from those who have lived beyond their means because of the weak dollar in the past.
The prime beneficiaries of this have been Europe and their overly generous entitlement/pension systems, which are teetering on full collapse as we saw in the UK recently, and China with its massive trade surplus with the US.
The winners will be those who produce and export base commodities. Because in broad strokes, assets inflated through easy credit for over a decade, like gov’t bonds, stocks, real estate and mid-to-high end consumer goods, will be deflating. On the flip side, base commodity prices, the main driver of inflation today, will continue rising – oil, gas, gold, metals, food, etc.
In short, the easy money of the post-2008 era fueled stock, bond and real estate booms which will now bust, suppressing investment into base commodities. With the credit cycle reversing so too will this dynamic.
My advice to people is the same as it’s been for years. Get and stay out of debt, minimize expenses where you can, and develop strong local communities to assist each other while the geopolitical tensions continue to rise.
$SPX updated target for rally high is 10/14 or 10/17, between 3900-3950. Time will tell...
The 27 Sept retest of the June low looks good to me. I think the markets have bottomed, or were very close to final bottoms last week.
THE STOCK MARKET LIKELY JUST BOTTOMED (Markets Insider vis msn.com)
“The stock market has likely found its bottom this week and should stage a rally of up to 15% heading into year-end, Fundstrat's technical strategist Mark Newton told clients in a Monday note.” Story at...
https://www.msn.com/en-us/money/markets/the-stock-market-likely-just-bottomed-and-a-15-25-rally-could-take-hold-into-year-end-fundstrat-says/ar-AA12AO2s
The World is ending !!!......The World is ending !!!......
The democrats are destroying the World !
Oh wow, well then, yeah, if that's the case then for sure.....
Everyone should be short......
Note :
S&P up 3 pct
Hong Kong and Shanghai both closed ?
Yup......In fact, Shanghai has now been closed since Sept 25th
Overnight Futures up 12 to 3690
Shanghai, Chinas' Golden Week !?
Yup.....and
When cats are away there are rats who'll play......Their Get Out Of Jail Free card(s)
Surprise !
OMG
.
The Friday (9/30/22) rundown of indicators improved, but remained bearish (19-bear and 8-bull).
BEAR SIGNS
-The 10-dMA percentage of issues advancing on the NYSE (Breadth) is below 50%.
-The 50-dMA percentage of issues advancing on the NYSE (Breadth) is below 50.
-The 100-dMA percentage of issues advancing on the NYSE (Breadth) is below 50%
-The 50-dMA percentage of issues advancing on the NYSE (Breadth) has been below 50%, for 3 days in a row below 50% for my “correction-now” signal. – It hardly matters now.
-McClellan Oscillator is negative.
-Slope of the 40-dMA of New-highs is falling.
-There was a Follow-thru day 28 Sept and it cancels the 13 Distribution Days over the last 5 weeks.
-23 Sept was a bearish, >90%-down-volume day. 28 Sept did not meet the tests for a 90% high volume up-day.
-MACD of the percentage of issues advancing on the NYSE (breadth) made a bearish crossover 30 Aug.
-MACD of S&P 500 price made a bearish crossover 22 Aug.
-21 Sep was a Bearish Outside Reversal Day.
-Smoothed Buying Pressure minus Selling Pressure is falling.
-The 5-10-20 Timer System is SELL; the 5-dEMA and 10-dEMA are both below the 20-dEMA. (The 5-day is below the 10-day so short-term momentum is bearish too.)
-VIX is rising quickly.
-Long-term new-high/new-low data.
-Short-term new-high/new-low data.
-The graph of the 100-day Count (the 100-day sum of up-days) is falling.
-Cyclical Industrials (XLI-ETF) are under-performing the S&P 500 so I’ll call it bearish.
- Only 23% of the 15-ETFs that I track have been up over the last 10-days.
No trading positions.
The Friday (9/30/22) rundown of indicators improved, but remained bearish (19-bear and 8-bull).
BEAR SIGNS
-The 10-dMA percentage of issues advancing on the NYSE (Breadth) is below 50%.
-The 50-dMA percentage of issues advancing on the NYSE (Breadth) is below 50.
-The 100-dMA percentage of issues advancing on the NYSE (Breadth) is below 50%
-The 50-dMA percentage of issues advancing on the NYSE (Breadth) has been below 50%, for 3 days in a row below 50% for my “correction-now” signal. – It hardly matters now.
-McClellan Oscillator is negative.
-Slope of the 40-dMA of New-highs is falling.
-There was a Follow-thru day 28 Sept and it cancels the 13 Distribution Days over the last 5 weeks.
-23 Sept was a bearish, >90%-down-volume day. 28 Sept did not meet the tests for a 90% high volume up-day.
-MACD of the percentage of issues advancing on the NYSE (breadth) made a bearish crossover 30 Aug.
-MACD of S&P 500 price made a bearish crossover 22 Aug.
-21 Sep was a Bearish Outside Reversal Day.
-Smoothed Buying Pressure minus Selling Pressure is falling.
-The 5-10-20 Timer System is SELL; the 5-dEMA and 10-dEMA are both below the 20-dEMA. (The 5-day is below the 10-day so short-term momentum is bearish too.)
-VIX is rising quickly.
-Long-term new-high/new-low data.
-Short-term new-high/new-low data.
-The graph of the 100-day Count (the 100-day sum of up-days) is falling.
-Cyclical Industrials (XLI-ETF) are under-performing the S&P 500 so I’ll call it bearish.
- Only 23% of the 15-ETFs that I track have been up over the last 10-days.
No trading positions. I'm currently 35% invested in stocks.
"2023 Will Be Year From Hell" - Martin Armstrong Warns Europe 'Could Suck The Rest Of The World Down The Tubes'
https://www.zerohedge.com/markets/2023-will-be-year-hell-martin-armstrong-warns-europe-could-suck-rest-world-down-tubes
My Comment: Yep
Excerpt:
Armstrong says governments are borrowing and spend huge amounts of money. The Fed will keep raising interest rates to fight inflation, but Armstrong says,
“Raising interest rates will only make things worse. We have supply shortages, and raising rates will not fill the gaps.”
Armstrong has never been more positive on buying gold. Why? Armstrong explains,
“We are looking at a sovereign debt default. This is what’s going on. This is why Biden will spend whatever he wants because he knows he doesn’t have to pay it back. Eventually, this is what’s going to happen. This is Schwab’s agenda.”
Armstrong has predicted “2023 will be the year from Hell.”
We completed 11weeks of the 10-11 week cycle and Friday was day18 of an 18day cycle. We should see series of 9day cycles with the expected high in middle of 2nd cycle from now. Looking at 10/19 area for the high, aka start of down move. Next rally high should be approx 20weeks from then with interim low in between. Then major low follows.
Beginning of the End -
Larry Summers Pre-Empts Coming Crash, Says Market Feels Like 2007
https://www.zerohedge.com/markets/larry-summers-pre-empts-coming-crash-says-market-feels-2007
My Comment: The instability in the currency markets are the beginning of the end. The consequences of the past 35 years of Fed interventions which created one economic bubble after another are starting to be felt as things unravel globally. It's going to get a lot worse. The central banks have created a problem for which they have no solution.
Excerpts:
Besides the UK, “I don’t there’s any sign that I see -- yet -- of other markets being disorderly,” said Summers, a Havard University professor and paid contributor to Bloomberg Television. “But we know that when you have extreme volatility, that’s when these situations are more likely to arise.”
According to Summer, some of the dynamics behind the current fragility are substantial leverage, uncertainty about the economic policy outlook, unease about high rates of underlying inflation, volatility in commodities and geopolitical tensions tied to Russia’s Ukraine invasion and to China.
One particular area to monitor is the strains inherent in Japan’s policies right now, the former Treasury chief said, echoing what we said back in March (see "Yen At Risk Of "Explosive" Downward Spiral With Kuroda Trapped... And Why China May Soon Devalue")
Pointing out what our readers have known for much of the past year, Summers said that - like the BOE - on one hand, Japan has been withdrawing liquidity from its markets, through its purchases of yen last week in an effort to support the exchange rate. But on the other hand, it’s injecting liquidity through the Bank of Japan’s continuing monetary easing. It’s an “extraordinary thing” Summers said adding that “It will be interesting to see how that plays out." Japanese investors have “vast holdings” of fixed-income securities around the world, and that will be something to keep an eye on, he said.
Turning to the UK, Summers said that “we’re in very complex and uncharted territory,” warning that while the Bank of England’s intervention in the gilt market stabilized things for a time, that won't last, noting that the BOE’S plan is for operations to continue until Oct. 14. The key problem - according to the man who single-handedly redefined unsustainable economic policy - is that markets don’t believe UK macroeconomic policy is sustainable.
“It’s not going to stay stable forever on the basis of two weeks buying -- and it’s probably not even going to stay stable for two weeks, unless there is a sense that this is a bridge to the fundamentals being fixed,” Summers said of UK markets. “And that’s not what we are seeing from the indications we’re getting this morning.”
Internals have been improving on recent intra-day lows, so I sold SDS and SH in the early afternoon today. No bottom yet, but we may have a bounce.
Metals traders: Watch for FOREX markets extra closely
https://www.kitco.com/news/2022-09-27/Metals-traders-Watch-for-FOREX-markets-extra-closely.html?sitetype=fullsite
Of course, if something really big breaks, all bets are off. Weakening FX currencies (Yen, Sterling, Yuan) or an escalation of the war in Ukraine could be the catalyst. The Fed would be in a bind if a financial crisis erupts and inflation is still high.
$SPX (1) has declined for 5 weeks, and is 10weeks from the start of this 10-11week cycle. My obj for this cycle was reached and expect rally for 4-6 weeks to next 10week high.
SPX (2) holding short via SDS, entered 4898, last at 5152. I will liquidate at the opening, planning to short again near end of October.
And there's margin calls
What happens if someone steals your digital wallet? Of course, CBDC would not be restricted to a limited production. It just makes it easier to print more money. What happens if the value fluctuates wildly like Bitcoin?
The Friday rundown of indicators remained sharply bearish (23-bear and 4-bull). The bull-signs are from 2 types of indicators (1) Fosback signals, because new-highs are low, and (2) a couple of “oversold” indicators. Markets can remain oversold for some time so we can’t put too much value in those. The Fosback indicators have been bullish for a while, but I think we need to see zero new-highs before we see a low on the S&P 500. Here are the Bear signs:
-The smoothed advancing volume on the NYSE is falling.
-There have been 13 Distribution Days over the last 5 weeks.
-23 Sept was a bearish, >90%-down-volume day.
-The 10-dMA percentage of issues advancing on the NYSE (Breadth) is below 50%.
-The 50-dMA percentage of issues advancing on the NYSE (Breadth) is below 50.
-The 100-dMA percentage of issues advancing on the NYSE (Breadth) is below 50%
-The 50-dMA percentage of issues advancing on the NYSE (Breadth) has been below 50%, for 3 days in a row below 50% for my “correction-now” signal. – It hardly matters now.
-MACD of the percentage of issues advancing on the NYSE (breadth) made a bearish crossover 30 Aug.
-MACD of S&P 500 price made a bearish crossover 22 Aug.
-21 Sep was a Bearish Outside Reversal Day.
-Smoothed Buying Pressure minus Selling Pressure is falling.
-The 5-10-20 Timer System is SELL; the 5-dEMA and 10-dEMA are both below the 20-dEMA. (The 5-day is below the 10-day so short-term momentum is bearish too.)
-VIX is rising quickly.
-My Money Trend indicator is falling.
-McClellan Oscillator is negative.
-The Smart Money (late-day action) is down.
-The graph of the 100-day Count (the 100-day sum of up-days) is falling.
-Long-term new-high/new-low data.
-Short-term new-high/new-low data.
-Cyclical Industrials (XLI-ETF) are under-performing the S&P 500 and falling so I’ll call it bearish.
-Slope of the 40-dMA of New-highs is falling. This is one of my favorite trend indicators.
- 29% of the 15-ETFs that I track have been up over the last 10-days.
-S&P 500 is underperforming the Utilities (XLU).
I'm holding SH and SDS positions.
$SPX $SDS solid break of 3840 triggers obj of 3450 area. However, on so doing, a solid break of 3750 creates obj of 2800. Short via purch of SDS on close at 48.98.
Crypto looks even scarier now.
Central Bank Digital Currencies are the Bullet Train to Digital Concentration Camps
“If you can move every human into a digital concentration camp, empty their bank account any time you want, and tell them what they can and cannot spend money on, you've got complete control."
KanekoaTheGreat
Sep 19
The White House published a "comprehensive framework" on Friday attacking decentralized cryptocurrencies while promoting a U.S. government-controlled programmable Central Bank Digital Currency (CBDC), per an official press release.
Agencies that were chosen to lead the ongoing working group for the research and possible development of a CBDC include the Federal Reserve, the National Economic Council, the National Security Council, the Office of Science and Technology Policy, and the Treasury Department.
CBDCs are digital currency issued directly from a nation-state’s central bank and serve as legal tender.
Critically, CBDCs are controlled by governments and therefore represent the polar opposite of the ideas — decentralization, open-source software, permissionless, peer-to-peer transactions — that made Bitcoin and other cryptocurrencies such a revolutionary technology.
As you can guess, CBDCs will be tied to user identities and Digital IDs, which will allow for total surveillance by the State and eliminate any chance of financial privacy.
According to the Atlantic Council’s Central Bank Digital Currency Tracker, 112 countries, representing over 95 percent of global GDP, are exploring a CBDC.
11 countries have already launched a digital currency including Nigeria and numerous Caribbean nations.
14 countries are testing pilot programs including South Korea, Thailand, Saudi Arabia, Sweden, and China which is set to expand its use of the Digital Yuan in 2023.
Emerging Markets Start Sending Out Warning Signals Against The Soaring Dollar
https://www.zerohedge.com/markets/emerging-markets-start-sending-out-warning-signals-against-soaring-dollar
My Comment: EMs may be the epicenter of the next financial crisis. Of course, there are so many weak and vulnerable links, especially Europe with its escalating energy costs, China with its bursting debt bubble, and Japan with its bond market catastrophe in the making. It's just a bunch of dominoes.
There is a limit to how high the Fed will take interest rates - VanEck
https://www.kitco.com/news/2022-09-20/There-is-a-limit-to-how-high-the-Fed-will-take-interest-rates-VanEck.html
My Comment: So higher rates mean higher deficits due not only to lower revenues and increased expenditures from a recession, but also from increased Fed interest payments on its balance sheet.
Excerpts:
Not only do Foster and Casanova not expect the Fed to bring inflation back down to 2% anytime soon, but they said that the central bank could face growing political pressure to end its tightening cycle as rising interest rates will make servicing its debt more expensive.
The Federal Reserve's balance sheet, while falling, is valued at $8.8 trillion.
Quoting data from the Wall Street Journal, Foster and Casanova said that if the Fed raises interest rates to between 3.25% and 3.50%, it would cost the Treasury $195 billion annually to fund the U.S. central bank.
"As the targeted Fed Funds rate (currently 2.5%) rises above 3%, the interest it pays will exceed the revenue gained from its portfolio assets," the analysts said.
In a report in July, the Congressional Budget Office said that the government could end up paying $1.2 trillion in interest payments by 2032.
The analysts said that they expect it's only a matter of time before consumers see inflation as a threat again.
"We believe that at some point, the markets will lose patience with the Fed's talk and see that inflation is indeed out of control. Such an awakening would benefit gold," the analysts said.
The Tipping Point For Gold
https://www.zerohedge.com/commodities/tipping-point-gold
Excerpts:
The Wave 4 A-B-C correction I forecast back then is also basically complete, with the risk of a dip to 1663 next, where wave C is the same size as the decline in wave A. If this correction is indeed complete, wave 5 up to 2300+ is next.
In the meantime, China and India in particular continue to load up on physical Gold. Bridgewater is joining the party by buying into three physical-backed Gold ETFs in China. Silver is being drained from the SLV ETF, the LBMA vaults, and the COMEX futures markets. Inventories of physical metals are drying up, sending premiums over spot up to 50%, over three times their normal level and higher than in April 2020 when Swiss Gold refineries were closed due to Covid. India is loading up on physical Silver based on import data.
Russia's new gold exchange could challenge LBMA and reveal gold's 'fair' price - Matthew Piepenburg
https://www.kitco.com/news/2022-09-20/Russia-s-new-gold-exchange-could-challenge-LBMA-and-reveal-gold-s-fair-price-Matthew-Piepenburg.html
On Fridays, I summarize a number of indicators to get a weekly feel for trend. The Friday rundown of indicators turned sharply bearish (20-bear and 2-bull). These indicators tend to be both long-term and short-term, so they are different than the 20 that I report on daily. Here are the Bear signs:
-13 Sept was a bearish, >90%-down-volume day.
-The 10-dMA percentage of issues advancing on the NYSE (Breadth) is below 50%.
-The 50-dMA percentage of issues advancing on the NYSE (Breadth) is below 50.
-The 100-dMA percentage of issues advancing on the NYSE (Breadth) is below 50%
-MACD of the percentage of issues advancing on the NYSE (breadth) made a bearish crossover 30 Aug.
-MACD of S&P 500 price made a bearish crossover 22 Aug.
-26 Aug was a Bearish Outside Reversal Day.
-Smoothed Buying Pressure minus Selling Pressure is falling.
-The 5-10-20 Timer System is SELL; the 5-dEMA and 10-dEMA are both below the 20-dEMA. (The 5-day is below the 10-day so short-term momentum is bearish too.)
-There have been 8 Distribution Days over the last 4 weeks.
-VIX is rising quickly.
-My Money Trend indicator is falling.
-McClellan Oscillator is negative.
-The Calm-before-the-Storm/Panic Indicator warned on 13 September and remains in effect for 6 days.
-The graph of the 100-day Count (the 100-day sum of up-days) is falling.
-The Smart Money (late-day action) is down.
-Long-term new-high/new-low data.
-Short-term new-high/new-low data.
-Cyclical Industrials (XLI-ETF) are under-performing the S&P 500 and falling sharply so I’ll call it bearish.
-S&P 500 is sharply underperforming the Utilities (XLU).
Looks like more downside ahead.
London Silver Inventories Continue to Plummet as Metal Exits LBMA Vaults (bullionstar.com)
My Comment: The days of Silver price manipulation via paper Silver are numbered.
Excerpts:
With consistent silver outflows over the last 9 months to the end of August 2022, the LBMA silver vaults have now lost a whopping 254.5 million ozs (7915 tonnes) of silver since the end of November 2021. In other words, from a situation where the LBMA silver inventories had been 36,421 tonnes at the end of November 2021, they are now 21.7% lower at 28,506 tonnes.
To put all of this into context, the that world annual silver mining production will only be 843.2 million ozs this year. That’s 26,262 tonnes. So the LBMA vaults, with 28,506 tonnes as of the end of August 2022, now hold just less than one year’s mine supply of silver.
But that is actually only half the story, because as readers of these pages will know, a majority of the silver within the LBMA vaults is held by Exchange Traded Funds (ETFs) and is already accounted for, and is therefore not (unless it is sold out of ETFs) available to the market. Additionally, this silver in ETFs is not, as the LBMA disingenuously claims, available to “underpin the physical OTC market."
Backing this ETF silver out of the headline figure is thus even more revealing. According to the calculations of GoldCharts’R’Us, as of the end of August there were 18,110 tonnes of silver held by silver-backed ETFs which store their silver in London. This means that of the 28,506 tonnes of silver that the LBMA claims to be held in its London vaults, 63.5% of this is held in ETFs, and only 10,396 tonnes (36.4%) is not held by ETFs. This 10,396 tonnes also represents only about 40% of annual silver mining supply.
Over on COMEX in New York, the silver situation is also precarious, with ‘Registered’ in the COMEX approved warehouses practically in freefall, and at a four and a half low. See the following chart. Latest figures for 9 September show that registered inventories (those that are warranted and available to back COMEX silver futures contract delivery) are now only 46 million ozs (1430 tonnes). This is insanely low. For example, more silver left the LBMA vaults during July 2022 (1447 tonnes) than there is currently in COMEX registered silver stockpiles.
Regarding the COMEX category of ‘Eligible’ silver (which merely represents silver stored in the COMEX approved vaults which could be traded if it was put under warrant, but which realistically may have nothing to do with COMEX trading), the amount of silver in the COMEX eligible category hasn’t really fluctuated much so far in 2022 and has ebbed and flowed by about 30 million ozs (930 tonnes) within the 250-280 million ozs range
The existence of ETF silver in London is key to the ability of the LBMA bullion banks to control the market and the silver price.
LBMA bullion banks / ETF Authorised Participants appear to use London silver ETFs as a top up fund for physical silver, scaring the market by bringing the paper silver price lower and flushing out / triggering institutions and retail to sell ETF units, at which point the bullion banks pick up and convert these units, thereby obtaining extra metal that’s needed to meet physical demand. In fact, as physical silver demand rises, bullion banks will try to get the price lower so as to have access to the silver that is held by the ETFs.
Only time will tell, but with physical silver demand firing on all cylinders and massive amounts of silver leaving the LBMA London vaults, the bullion bank tactics of rinse and repeat in creating a ‘paper’ silver price unconnected to physical demand and supply is becoming more and more exposed.
| Volume | |
| Day Range: | |
| Bid Price | |
| Ask Price | |
| Last Trade Time: |


