 News
News  Market Data
  Discover
Support: 888-992-3836
Copyright © 2023 InvestorsHub Inc.


Register for free to join our community of investors and share your ideas. You will also get access to streaming quotes, interactive charts, trades, portfolio, live options flow and more tools.
$CYIO looks coiled here
Thanks . out of everything now .taking break til 1st of year . take care .
New Forex Forum Just for Us
Ok gang, I've had it with IHUB at this point. It's bad enough we have to pay to get unlimited posts and then still have to deal with ads and slowdowns, problems posting, etc. Then to have to sit back while it goes down for 2 to 3 days (yet again) is more than I can stand.
So I'm following through on my original promise several years ago...I've created a brand new Forex forum for anyone who wants to join.
1. It's totally free...forever.
2. There are NO advertisements on the forum.
3. You have unlimited posts.
4. You can use the exact same screen names that you have here...mine is already set up as Pennies2007 on the new forum.
5. Looking at posted charts is super easy...you can expand and unexpand the charts without leaving the post itself.
6. We have a free Mobile app as well, although I do have to let you know up front that the mobile app is a general mobile forum app so there are some ads there but they're not intrusive. Plus, the mobile app does a great job of allowing you to see chart screen shots.
I have nothing to sell and nothing to gain by doing this. I just want a clean place that doesn't cost a dime (that doesn't go down every time you turn around) where we can work on trading strategies.
If anyone wants to take a look, just go to this link and register for free.
http://taforextrading.createaforum.com/general-discussion/ta-forex-trading/
Looks like it dropped a bit more there for ya Kirby. Good call. I'd be pretty leery about it from here on out though on shorts.
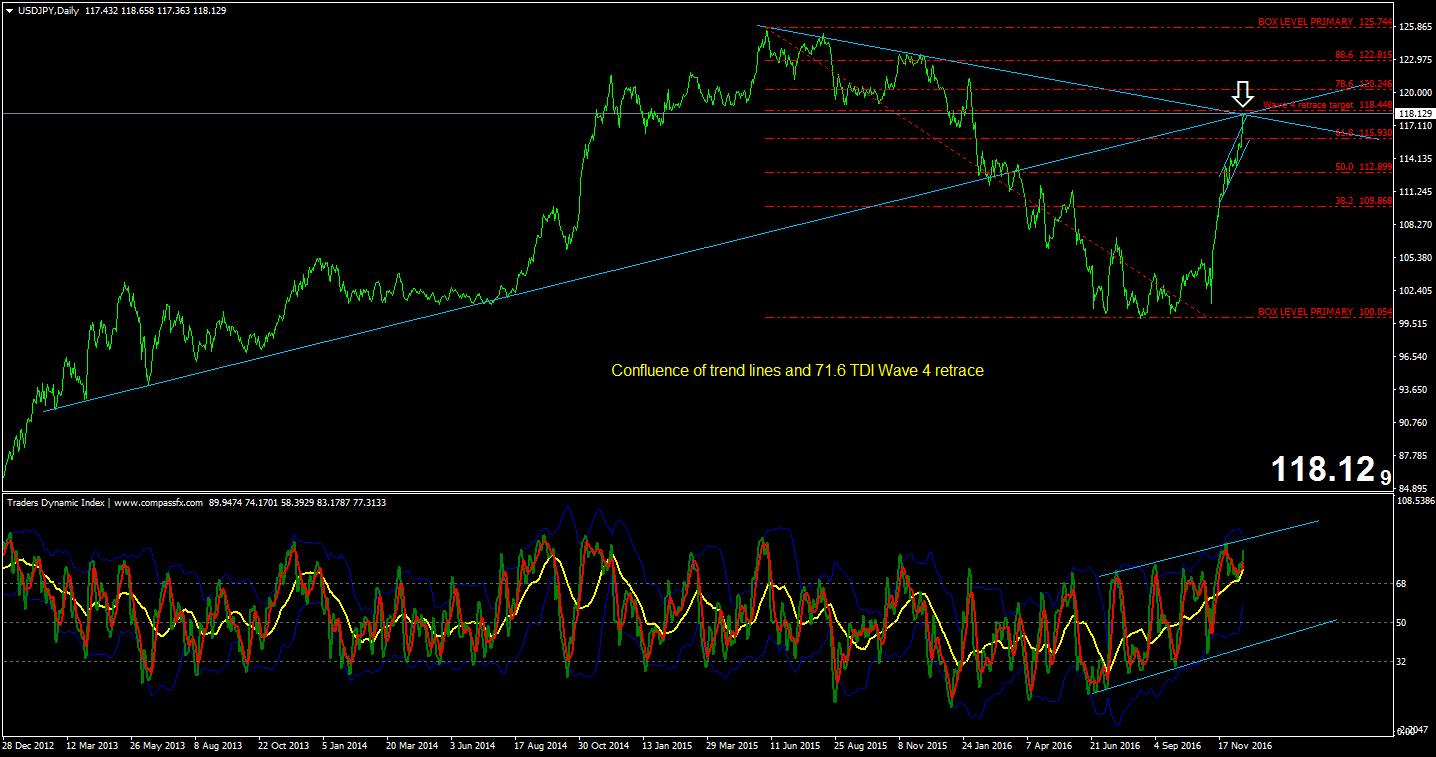
Interesting area we're in right now on the daily line chart. Really nice confluence for potential strong resistance.
Time will tell...I'm patiently waiting. 
I eased up on my E/U short . playing it safe.
Well looks like the 78.6 is around 120.
Thanks appreciate the heads up !
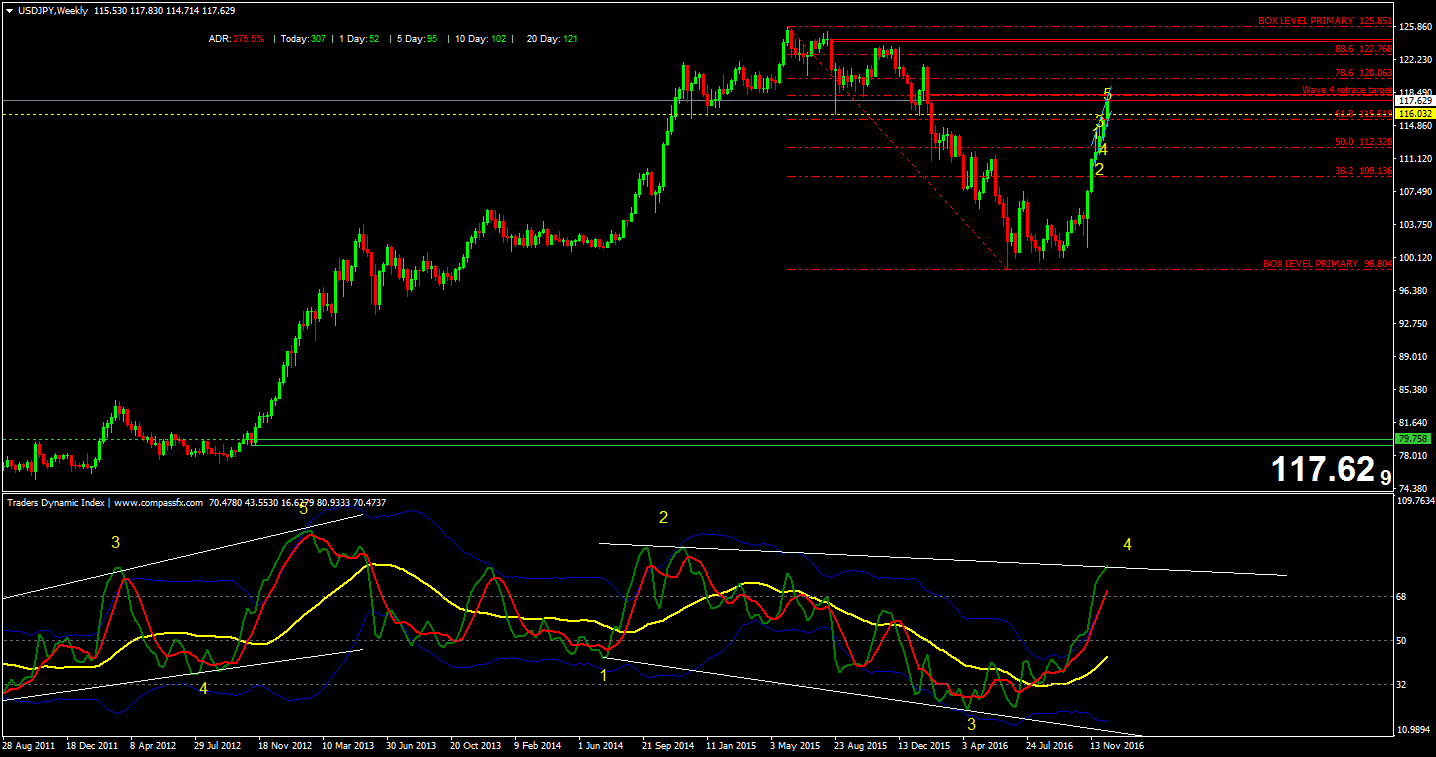
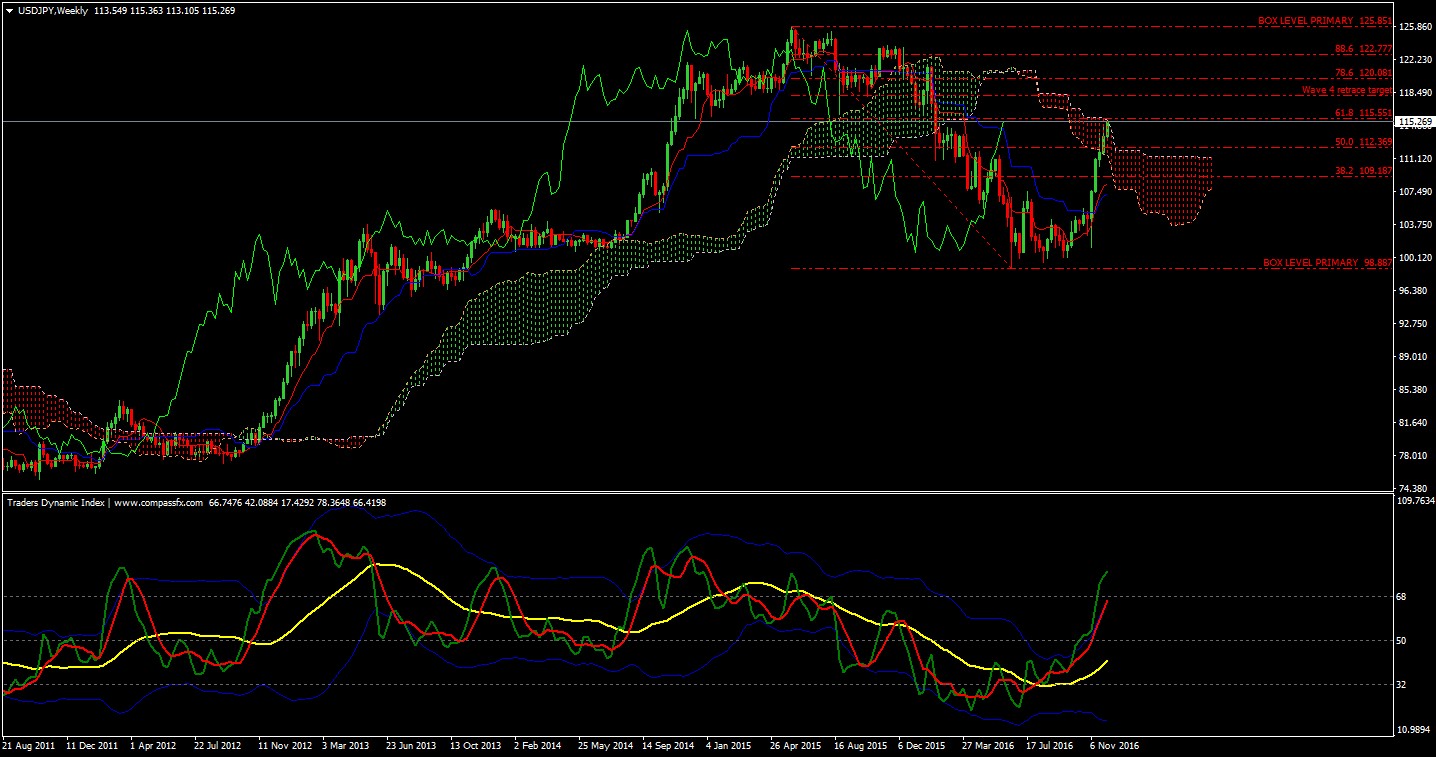
I really should have had this pegged the whole time on the end target area. This is a Wave 4 TDI movement on the UJ weekly and Wave 4 almost always move back up to between the 61.8 and the 71.6 fib, with the 71.6 fib getting hit the majority of the time.
I was thinking the exact same thing. 118 is a possibility
Hey Kirby. Watch EU carefully. I still suspect that this is just a Wave D finishing movement before it takes off north again hard. Usually, one of the 3 wave movements can overthrow the trendline, making it look like it's gonna keep going right before it pulls a hard reversal the other direction.

Yep, market went totally bonkers and took the sucker vertical right here at the end...could still make 118.
out of U/J because slowed down. waiting see if she drops here. still short E/U . took profit on both along the way.
E/U dropping thru support !!:)
There's the 117 target.
might be wrong . playing contrarian . Hoping E/U drops thru support and Long U/J . think will see soon. if it does think E/U drop will be huge !!
UJ 4 Hour Update
Capitulation candle going on here with a trendline overthrow. Key sign that the market has gone way too far. Time to double down on the shorts.
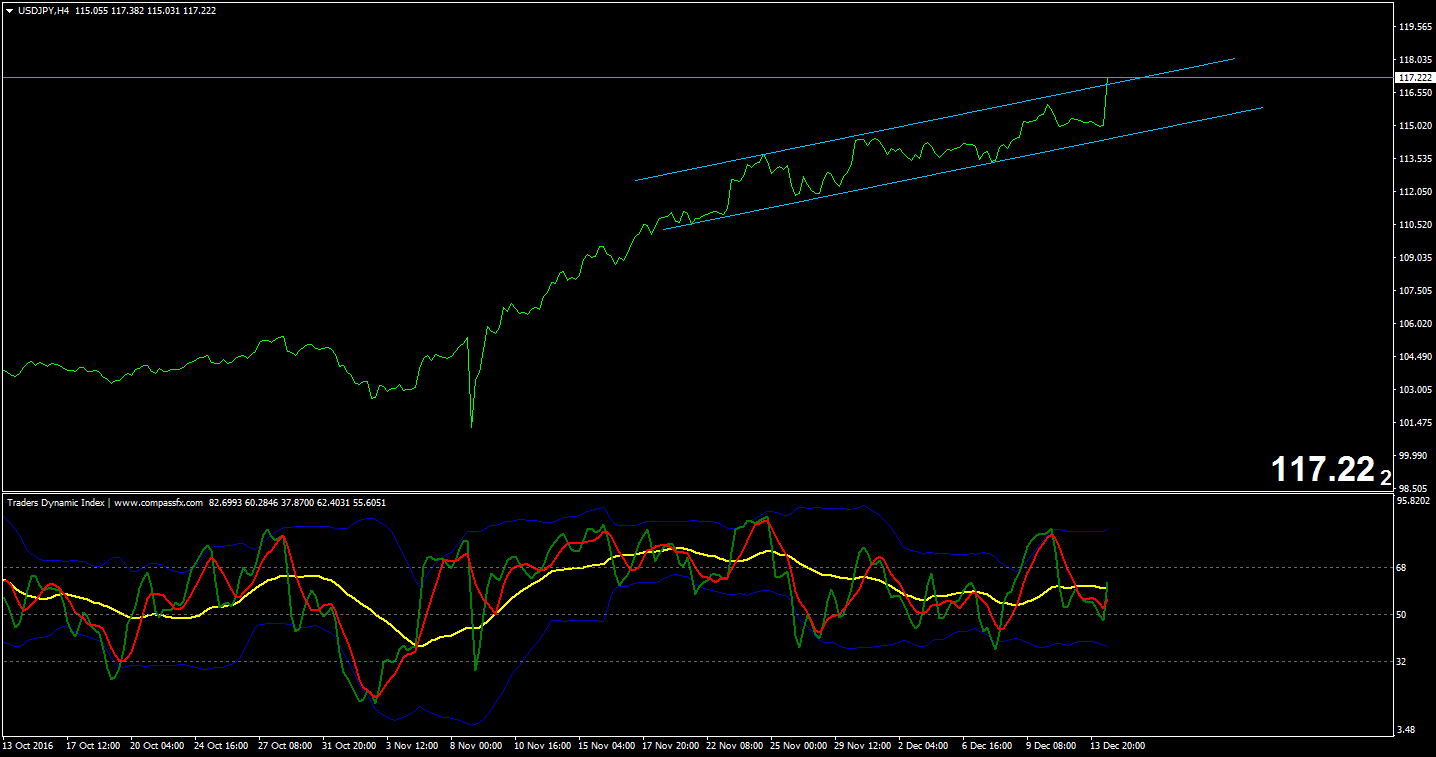
UJ 4 Hour Chart
Yellen did go ahead with the 25 basis points...fair enough. UJ is still cycling within the final movement up inside the 4 hour line chart channel here.
Final surge going on now...

The Fed's Magic Act
And so we come to it tomorrow...the big day the market has been waiting on for the year-end Fed announcement.
The entire market has priced in a 100% chance of a 25 basis point hike...literally. That's all the analysts talk about. They also say it'll be a ho-hum moment and that all they're really gonna look at is the statement after the announcement when she speaks at the press conference.
But the EU and UJ charts tell us something different. Those 2 charts are telling us that we're due for some kind of shock reversal on both pairs.
So the question is...what could cause such a shock? It certainly isn't the 25 basis point increase everyone expects, although the "buy the rumor, sell the news" story could kick into play. But that really wouldn't be that volatile.
You see, Yellen's back is really against the wall here. Every country out there is doing nothing but cuts...watering down their currency by cutting rates. Yellen really doesn't want to be the only kid on the block raising rates and risking the US dollar going even higher because she knows that's counter productive. But, she doesn't want to stop the stock market rally either.
Currently, the US dollar and the stock market have gone up together, which is unnatural. They should have an inverse relationship...market up, dollar down and vice versa.
So how does she pull a rabbit out of the hat and keep the market up and tank the dollar? What if...just what if...she pulls a shocker and only raises rates by 1/8 of a percent...only 12.5 basis points instead of 25. Or, better yet, what if she really throws em a curve ball and holds steady with NO RATE INCREASE. Now that one would severely tank the dollar and the market would love the idea of a further free ride...thus effectively killing 2 birds with one stone.
Of course, it doesn't have to be Yellen...the shock could come from another source. But I'm really wondering at this point if things won't go very differently tomorrow than what literally 100% of the analysts are all saying.
Time will tell...just putting in my humble opinion as always.
EU weekly pivot turned it 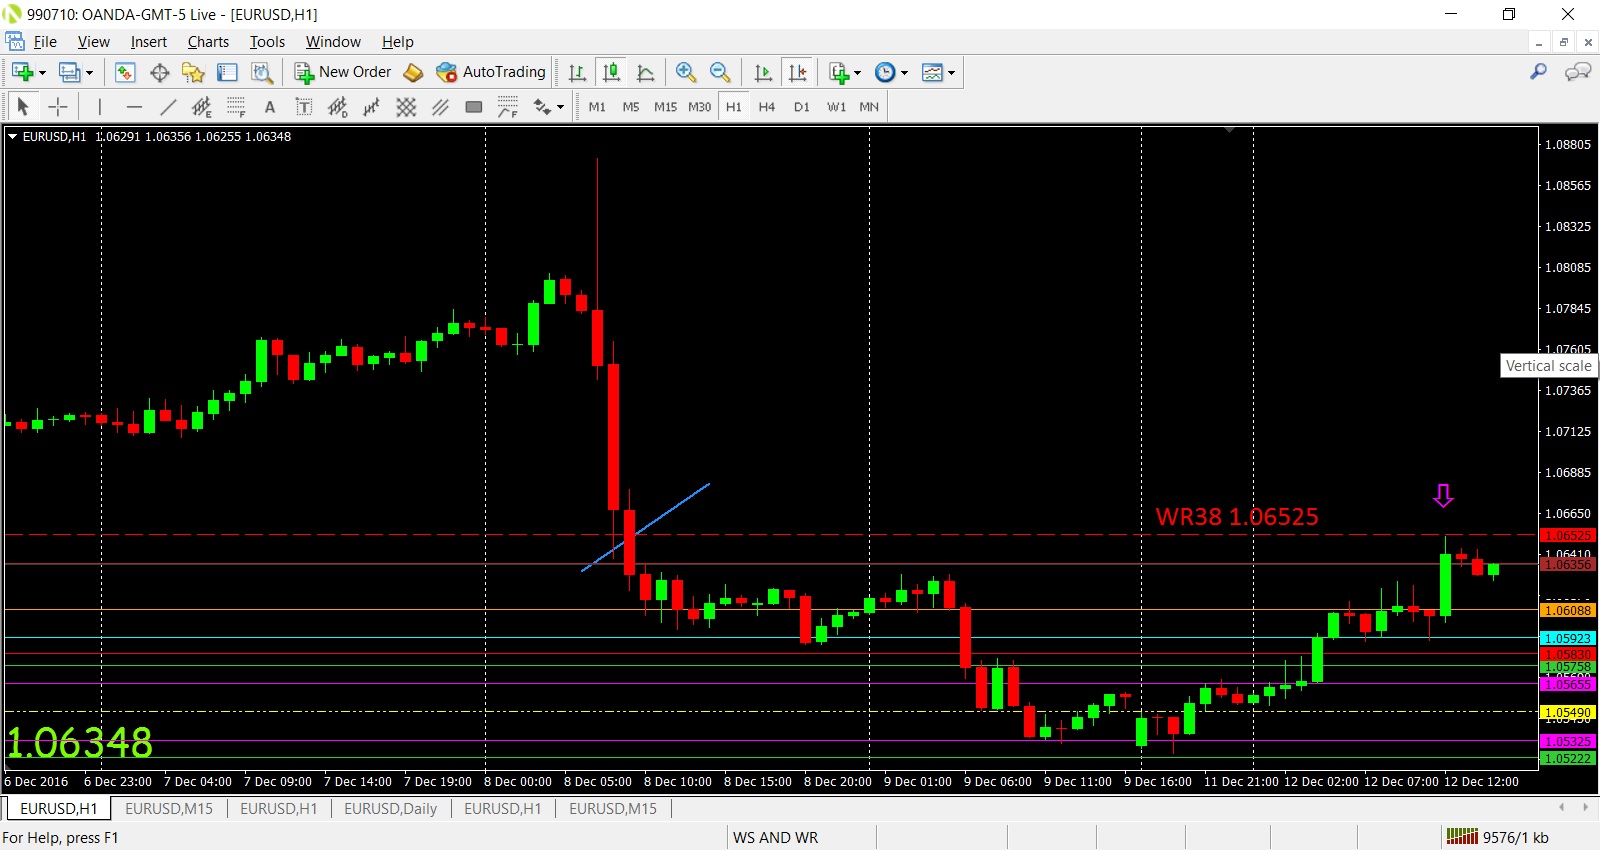 pivot turned it
new pivot indie-and can set alarms
post 4503
http://www.forexfactory.com/showthread.php?t=588764&page=226
EU Weekly Chart
Nothing has changed here so far. Still expecting the move back north again very soon.

i went back and looked at a couple of charts-yep it wasn't reliable--oh well
I haven't seen his video before but I just looked at it Jav. Pretty standard stuff...I didn't see anything new in there that I haven't seen before. The TDI squeeze was actually done by Dean Malone several years ago as a viable trade pattern. It can be useful but not when used by itself. I have seen the squeeze patterns fail if they're not coupled with other diagnostic tools to confirm a trade.
Pennies have you seen this guys video using TDI
DOW Jones Long Term Outlook...Correction
I just realized I posted an incorrect wave count on the DOW Jones chart. This chart shows the corrected version. Basically, we're wrapping up a large 5th wave expanding diagonal. The expanded flat I mentioned in the first post ended in a C wave down during the last recession.
So the sell off, when it comes, will ultimately break the expanding diagonal you see on the chart to the down side. The down side target is still down around 1000...maybe less.

UJ Weekly Chart with Ichimoku Cloud
I remember seeing this a while back and though I'd throw it out there since several of us are watching UJ. I don't use the cloud much anymore but I still glance at it from time to time.
Basically, the last big sell off on UJ caused the cloud to flip over to bearish and thicken out...that provides a really big resistance level to get through and the chances of UJ breaking through this level, combined with the 61.8 retrace, are slim to none.
No problem. Simple introduced the line chart concept to us a long time ago and then Jav made a post about a guy who was using the line charts in a unique way to trade. I just incorporated it in with my other trading methods and it seems to work well. Just another good tool in the box.
For some reason that line chart looks so much better but that's right around the area I was thinking. Thanks for posting that
One more view of the UJ 4 hour chart using the original line chart I had set up, including a wedge pattern on the top...it also shows a final topping process with a retest of the broken trend line.

And here's the UJ 4 hour chart showing the final channel 5th wave progression...it falls right in that area as well.

If we back off of the daily chart a bit, it looks like things are still gonna be wrapping up pretty soon here on UJ. We have the overall 61.8 fib retrace sitting at 115.519 and that's just below a long term prior support level now turned resistance at 116.03.
UJ is very likely to hover until the Fed announcement Wednesday where I strongly suspect it'll just be one of those "buy the rumor, sell the news" deals. A 25 basis point increase has long since been priced in on the dollar rally.
UJ Daily Chart...

Looks like UJ has put me into a 150 pip hole while waiting for the drop. Guess it's not ready just yet. Looks like the next target is on the weekly @ 117. Almost 275 pips away.
DOW Jones Long Term Chart Outlook
Well gang, it's been a long time coming but the market is finally moving up into the ecstatic "it's gonna go up forever" mentality again. Retail is finally bullish again on the overall market perspective and we've got crazy calls coming out about DOW 25,000, etc...same old garbage we always see around long term tops.
Looking at the longer term charts, the DOW has moved into the 2nd leg of a larger corrective series called an expanded flat in Elliott Wave terminology. These are tricky waves because each leg actually extends beyond the starting point of the previous wave leg. So Wave B extends itself out and the final Wave C extends itself beyond the previous Wave A peak, either up or down.
In this case, the last big recession saw the market complete a 5 wave series to the downside. Now, we're in the final throws of a large 3 wave correction topside that made new all-time highs. The next leg down is gonna be seriously ugly though. Since the C wave down has to extend beyond the previous lows, that means the previous lows around 6000 are gonna get smack-gobbered. The market could actually work it's way all the way back down to 1000 or less...yes, you heard that right...1000 or less. Basically, all of the wealth accumulated in the market since the early 70's would vanish.
But, after all of that nonsense is over with, we're gonna embark on a new bull-market that will last for many years. Hyper-inflation, massive upside gold prices, etc...you get the idea.
Here tis...

Yep Heavy, I've got things narrowed down to just the basics now...makes it much easier to see what's going on.
Near as I can tell at this point, UJ is still moving up and down in a near-term correction wave series with a peak near 114.40 or so. After that's tested again, I expect some nice downside volume movement to occur.
Talk about a basic chart pennies. I've been short UJ for a couple days now.
UJ 4 Hour Chart
Nice rejection here on the 4 hour line chart. I took another short position right at 114 in anticipation of this.
The standard 4 hour candle chart also looks like it's ready to break down as well.

Yep, I had one over a week ago I posted on EU but here it is again as it stands now Jav. The Elliott wave count pattern suggests that EU is headed back up to the top trend line to complete the final "E" wave in a large Wave 4 consolidation pattern. After that, it's likely to fall apart and head down to just below parity...somewhere around .9980. After that, it's due for a long term bounce back up.
EU Weekly Chart...

A/U climbing , decision 6 min .
Upbeat RBA to Fuel AUD/USD Rebound- 0.7530 Hurdle in View
The Reserve Bank of Australia (RBA) is widely expected to keep the official cash rate at the record-low of 1.50% at the last policy meeting for 2016, and more of the same from Governor Philip Lowe and Co. may fuel the near-term rebound in AUD/USD as the central bank appears to be gradually moving away from its easing-cycle.
Pennies have you already put up a chart on eur/usd showing that trendline?if not will you
i too took some green pips off of a small u/j short-now waiting
Evening Jav. I took profits on some flipper UJ shorts but still holding a primary short position for a 107 hit later.
I jumped into another EU long this morning but bailed out again way too fast. As I thought, it did pop nicely off that lower trend line and should continue working it's way back up towards an "E" wave completion later above 1.13 and very likely well above 1.14.
Tks shortly going to get back in on a usd/jpy short
nice trading Jav . added to my U/JPY short .
EUR/USD i set this target up Friday via the box method-and target was hit-now i got to see what is next

New Zealands Prime minister just resigned --that otta move something
Evening Pennies-took a fast profit on my Usd/jpy short earlier-will get back in tho
also got a short on nzd/usd--boxwise
|
Followers
|
386
|
Posters
|
|
|
Posts (Today)
|
0
|
Posts (Total)
|
140146
|
|
Created
|
03/18/06
|
Type
|
Free
|
| Moderator simplegreen | |||
| Assistants javalin gitonwithit tickettoride pennies2007 | |||

![]()

This is not a get rich quick scheme but patience and hard work
How to make the FX into a fulltime living. Before you do this please learn how to play first. 25 pips per day can sometimes be a dog fight to get. This will require a principal of $500 to $1000 to start but you must know how to play first.
1. 10K units=$264 principal at 25 pips per day for a month=$500 per month. Do this for 2 months straight from say Jan-Feb
END OF 2 MONTHS PROFIT=$1000
2. 30K units=$794 principal at 25 pips per day for a month=$1500 per month. Do this for 2 months straight from March-April
END OF 2 MONTHS PROFIT=$3000+$1000=$4000 TOTAL PROFIT
3. 60K units=$1590 principal at 25 pips per day for a month=$3000 per month. Do this for 2 months from May-June
END OF MONTHS PROFIT=$6000+$4000=$10,000 TOTAL PROFIT
4. 80K units=$2120 principal at 25 pips per day for a month=$4000 per month. Do this for 2 months from July-Aug
END OF MONTHS PROFIT=$8000+$10,000=$18,000 TOTAL PROFIT
5. 100K units=$2650 principal at 25 pips per day for a month=$5000 per month. Do this for 2 months from Sept-Oct
END OF MONTHS PROFIT=$10,000+$18,000=$28,000 TOTAL PROFIT
6. 150K units=$3975 principal at 25 pips per day for a month=$7500 per month. Do this for next 2 months Nov-Dec
END OF MONTHS TOTAL PROFIT=$15,000+$28,000=$43,000 TOTAL PROFIT IN A YEAR AT 25 PIPS PER DAY
7. In Jan next year you can use 200K units for 10K per month to get $120K per year. From there you can even go higher if you want to. Slow and steady wins the race. 200K units is only $5300 principal.
FOREX TRADING The Major Currencies
This Section Is Devoted Exclusively To FOREX Related Info To Try To Better Equip You In The Exciting And Lucrative World Of FOREX
FOREX Correlations Table
http://fxtradeinfocenter.oanda.com/charts_data/fxcorrelations.shtml
Link to some excellent FOREX Webinars
http://transcripts.fxstreet.com/2007/12/longer-term-sup.html
Major Currency Index Charts
$USD=US Dollar chart http://stockcharts.com/h-sc/ui?s=$USD&p=D&yr=0&mn=4&dy=3&id=p94889101590&a=123152351
$XJY=Japanese Yen chart http://stockcharts.com/h-sc/ui?s=$XJY&p=D&yr=0&mn=4&dy=3&id=p94889101590&a=123152396
$XBP=Pound chart http://stockcharts.com/h-sc/ui?s=$XBP&p=D&yr=0&mn=4&dy=3&id=p94889101590&a=123152405
$CDW=Canadian Dollar chart http://stockcharts.com/h-sc/ui?s=$CDW&p=D&yr=0&mn=4&dy=3&id=p94889101590&a=123152434
$XAD=Australian Dollar chart http://stockcharts.com/h-sc/ui?s=$XAD&p=D&yr=0&mn=4&dy=3&id=p94889101590&a=123152468
$NZD=New Zealand Dollar chart http://stockcharts.com/h-sc/ui?s=$NZD&p=D&yr=0&mn=4&dy=3&id=p94889101590&a=123152472
$XEU=Euro chart http://stockcharts.com/h-sc/ui?s=$XEU&p=D&yr=0&mn=4&dy=3&id=p94889101590&a=123152476
$XSF=Swiss Franc chart http://stockcharts.com/h-sc/ui?s=$XSF&p=D&yr=0&mn=4&dy=3&id=p94889101590&a=123152485
USD Index Intraday Chart - compliments of Idzi
quotes.ino.com/chart/

Gold Bullion Prices...
http://www.usagold.com/gold/price.html
An overview of the Forex market
The Forex market is a non-stop cash market where currencies of nations are traded, typically via brokers. Foreign currencies are constantly and simultaneously bought and sold across local and global markets and traders' investments increase or decrease in value based upon currency movements. Foreign exchange market conditions can change at any time in response to real-time events.
The main enticements of currency dealing to private investors and attractions for short-term Forex trading are:
24-hour trading, 5 days a week with non-stop access to global Forex dealers.
An enormous liquid market making it easy to trade most currencies.
Volatile markets offering profit opportunities.
Standard instruments for controlling risk exposure.
The ability to profit in rising or falling markets.
Leveraged trading with low margin requirements.
Many options for zero commission trading.
Forex trading
The investor's goal in Forex trading is to profit from foreign currency movements. Forex trading or currency trading is always done in currency pairs. For example, the exchange rate of EUR/USD on Aug 26th, 2003 was 1.0857. This number is also referred to as a "Forex rate" or just "rate" for short. If the investor had bought 1000 euros on that date, he would have paid 1085.70 U.S. dollars. One year later, the Forex rate was 1.2083, which means that the value of the euro (the numerator of the EUR/USD ratio) increased in relation to the U.S. dollar. The investor could now sell the 1000 euros in order to receive 1208.30 dollars. Therefore, the investor would have USD 122.60 more than what he had started one year earlier. However, to know if the investor made a good investment, one needs to compare this investment option to alternative investments. At the very minimum, the return on investment (ROI) should be compared to the return on a "risk-free" investment. One example of a risk-free investment is long-term U.S. government bonds since there is practically no chance for a default, i.e. the U.S. government going bankrupt or being unable or unwilling to pay its debt obligation.
When trading currencies, trade only when you expect the currency you are buying to increase in value relative to the currency you are selling. If the currency you are buying does increase in value, you must sell back the other currency in order to lock in a profit. An open trade (also called an open position) is a trade in which a trader has bought or sold a particular currency pair and has not yet sold or bought back the equivalent amount to close the position.
However, it is estimated that anywhere from 70%-90% of the FX market is speculative. In other words, the person or institution that bought or sold the currency has no plan to actually take delivery of the currency in the end; rather, they were solely speculating on the movement of that particular currency.

4)strongtower
Here is a post to a detailed way I trade http://investorshub.advfn.com/boards/read_msg.aspx?message_id=37074251
How to better read trends http://investorshub.advfn.com/boards/read_msg.aspx?message_id=37247267
___________________________________________________
_____________________________**STI(2,5) Tehnical Indicator Details**
ATTENTION BOARD:SA and I have agreed to and have decided to formally introduce all here to a technical indicator that I designed and lately some may have been noticing on my charts...we call it "Simplegreen Technical Indicator" and will refer to it as simply STI(2/5) or STI(6/14).The 2 versions are necessary IMO since the 2/5 shows "anticipated" PPS rise/fall short term whereas the 6/14 though not fully tested should give "anticipated" PPS rise/fall longer term...continuation.I have been using this quietly in the background since I developed it and have had excellent results even in a crashing market.It works exceptionally well on daytrades as well using the 2/5 period version on a 2 day daychart and 10 minute setting.Bottom reversals to peaks are easy enough for a novice to trade by IMO and I have seen real success in using it.The beauty of this indicator is easily seen by chart examples as I will soon show.This thing shows a buy trigger BEFORE the PPS rises...not AFTER it rises as in conventional indicator analysis.I also will be building scans specifically to glean the best prospects using the STI(2/5) and STI(6/14).This post is the first to introduce you to it with others to follow.In my next post I will put up a chart with annotations for the purpose of demonstration.A careful study and full understanding of the indicator is imperative to weed the false signals from true anticipated run signals.
This is a set of instructions to use for the overlay setup.Do this for both the STI(2/5) and the STI(6,14).
Set up your chart just like mine with RSI(5) first and select green for color..then below it add RSI(2) ..select red for color...then on RSI(2) on "position" select "behind indicator".Its a piece of cake!I stumbled across this idea some time back in trying to find entry point before PPS rise not after.I'm not greedy...I just want the WHOLE RUN..not just part of it(LOL)....Sharp rises can have early reversal and failures but a smooth rounded rise to trigger is very effective for prediction and you will also find strongest runs follow a depth from below 30 RSIs.The deeper the cut below 30 brings more powerful moves up from bottoms.Also there is a secondary buy trigger as RSI(5) remains bullish and approaches 70..THAT is where some serious PPS moves are found!
Any questions..feel free to ask
Simplegreen
Here is a link to an explanation of the technical indicators used on charts ..if terms confuse you then simply use this link for a quick explanation of that particular indicator...I suggest that you add this to favorite links as well
http://www.prophet.net/analyze/popglossary.jsp
WWW.STOCKFETCHER.COM
![]()
Stockfetcher has absolutely no equal when it comes to scanning for your next big play and I use Fetcher exclusively for scanning..it is phenominal..TRY IT!!Strongly Suggested!!
_______________________________________________________________
Disclaimer:All information posted by me or others on this board is opinion and I will make no claims or guarantees as to the success you may have in utilizing my personal methodology.What works well for some is a losing proposition for others.I do not intend to "pump" any stock here but rather will try to at all times find new plays that are successful for me with the intent of having uptrending stocks giving consistant profits and letting others see what I am doing.Please at all times do your own DD and make your own decisions.....Simple
$$$$$$$$$$$$$$$$$$$$$$$$$$$$$$$$$$$$$$$$$$$$$$$$$$$$$$$$$$$$$$$
Simple's Trading Methods Part1
Here is where we roll up sleeves and get to work!!This series will be quite long so monitor the board from time to time for all of this training series...
Assume first off that your account is very small and you have ..let's say $2500 cash just $500 more than needed for margin privileges(BTW I do not recommend actually using margin) Ok..you have no stock and $2500 cash so with this limitation 2 things are a MUST..EVERY BULLET MUST COUNT and PATIENCE is cultivated in your brain.At this point I will say that this is the way I treat my account even now...as if I only had that $2500 !!Burn this into your thinking and you will reduce your bad trades and losses dramatically.It is very rare that I take a loss of any significance and the percentage of bad trades I make is very low.Even Warren Buffet once said about 1 out of 8 calls turn out to be good calls and I certainly do a lot better than that but it is only because I have myself brainwashed into being "hungry" on every trade.The greed factor that Dspetry posted about is also cured by this type of thinking...If you are "hungry" you will take profits at a good profit point and not look back..you are just happy to add to that $2500 portfolio value that you started that trade with!This type of thinking IS IMPERATIVE to me and I WILL NEVER.. NOT be hungry in my trading again.When I first started years ago with $4000 I did quite well til I got up to around $11,000 I would start to backpeddle.After a few cycles of this I realized I was the problem because I was no longer "hungry" and would start getting sloppy,greedy and would make mistakes.I DO NOT, on the other hand trade to make money ,I trade to TRADE WELL! If I have made a good well planned trade in both the buying and the selling then the money is a byproduct of that trade.Read this area repeatedly and practice it religiously and it will serve you well...it has me.
________________________________________________________________
Part 2
Now I will talk about the greed factor a little more.When I determine an entry point for any stock that I intend to buy then next I must ask myself how large a position will I take.Lets say I want 50,000 shs of a stock trading at .08.Once I make that firm determination and feel it is a good entry point then I buy but only 25,000 shs which is 1/2 the shares I had decided on!Why do I do that?The reason is that if you think about it many of the problems that traders have is being too high on their entry whether thru getting caught up in a MOMO play near the high end or simply miscalculating the Market Makers intent and the MMs set the bid/ask not the traders...IOW traders may want to move it up and MMs want to open a spread and walk it down to serve their needs and you bought too high tho it seemed a good call.If you follow my method you can turn loss into profit due to the fact that you have less leverage if it goes up but you have only 1/2 the leverage against you if it goes down instead plus you have the liquity to at least break even and pull out or more often you can pick up enough shares as it bottoms too have leverage to profit on a trade that could have been a loss.Bear in mind one other fact...fewer shares mean less leverage for profit or loss but also the way I operate is usually in much more conservative position sizes so that I can move into a stock and out of a stock with relative ease!Watch how MMs like Goldman Sachs (GSCO)work...studying GSCO methods on Level II several years ago caused me to develop this style of trading that allows me to be somewhat invisible in the market but compound my profits easily without the dangers that come from trying to make a killing.If all were trading like this then it would seriously reduce the selling pressure on a perfectly good play.Huge positions tend to be counterproductive to my efforts if I am still in and momentum is gone.Trying to make a killing many times result in loss.I try to simply make a good trade that is profitable and money compounds quite easily._
**New Elliott Wave Trading Website**
Several of us who trade using EW theory have gotten together and created a website dedicated exclusively to wave theory trading. The website is still under construction but we post
our charts and our trade ideas with specifics including entries, exits, and TP levels. Just click on the Analysis tab to view trades past and present. Each chart is listed on the calendar
for each pair in play. To view details about the trade itself, click on the Trades tab at the top of the screen.
Vist us at http://www.ewtrader.com
|
Posts Today
|
0
|
|
Posts (Total)
|
140146
|
|
Posters
|
|
|
Moderator
|
|
|
Assistants
|
| Volume | |
| Day Range: | |
| Bid Price | |
| Ask Price | |
| Last Trade Time: |


