


Saturday, September 25, 2010 2:05:48 PM
Simple,
When I begin analyzing a pair, I first start on a larger timeframe such as the monthly or weekly. Once I get a valid count, it gives me an idea of where we are headed on the bigger picture. After looking at the larger picture, I move down to a 4 hour chart and do the same thing. The key is to make sure your counts on the weekly and 4 hour complement each other. So in other words if on the weekly you are expecting to see a 3 wave corrective series or are already in a corrective pattern, then you should be able to see the same counts on the 4 hour. Of course you will get more detail by zooming in and it can be easy to lose focus of where you are in the larger picture. After I complete a 4 hour count and it seems to jive with my weekly count, I move to a 30M and do the same thing. Essentially what this allows me to do is find opportunities of different degree. Now using the weekly as a guide, I can find entries using my 4 hour counts to help confirm my weekly counts. Additionally, I can use the 4 hour as a guide and use the 30M for entries. The nice thing with this is I can position myself on a weekly count for much larger targets of anywhere from say 500-2000 pip moves depending on where we are in the overall sequence while keeping my risk much lower based on using 4 hour entries. I can do the same thing using the 4 hour charts and shoot for targets of maybe 200-400 pips depending on the sequence. The 30M works the same way and usually can yield anywhere from 40-100 pips or so. What I'm working on doing now is trading the 30M counts for the smaller gains until I find a good entry for a larger move on the 4 hour and even further on the weekly. This allows me to trade the smaller waves while holding core positions through the larger waves.
As far as using channel lines, I mainly use them to help project where a specific count may end. For instance, you can get an idea of where wave 5 will end by connecting the lows of waves 2 and 4 and then drawing a parallel line to that from the wave 3 peak. Now you may see things such as under/over throw where wave 5 will fall short or go above the channel lines. This is all dependent upon the strength of the 5th wave. If the 5th wave goes above the channel line it should not stay there long (in other words there should not be a breakout) before moving back inside of the channel. Here is something for you to ponder: I used to trade primarily using S&R and channels can provide some nice trading opportunities. When trading channels, I tend to be more of a counter trend trader because there is a higher probability of the trade panning out in your favor. Now I know it seems like it goes against logic when I say that but consider this: Lets assume we are trading in an channel that is trending upwards. Now naturally as price approaches the top of the channel, buyers exit their positions because they aren't expecting price that has already been moving up in a trend to break out of a channel to the upside (this is a low probability scenario) and sellers begin shorting. Thus, the natural flow causes price to reverse. Now as price approaches the bottom of the channel, things get a bit messier. Naturally, buyers come back into the market in anticipation of the move up from the bottom of the channel. However, sellers who have entered at the top of the channel may take some profits and hold portions in anticipation of a trend reversal. So at this point you don't have the same order flow that you would typically see at the top of the channel. Additionally, you will have sellers with short orders just below the channel in anticipation of trading the break out and trend reversal. Now if you want to see an illustration of what I'm describing just look over some charts and draw channel lines. What you'll notice is that price doesn't deviate much at the top of the channel (meaning that price rarely goes above the top of the channel and when it does the deviation is very small when compared to the deviation you would see at the bottom of the channel. I hope this helps in using channels as a guide. Also note you can project corrections by drawing a trend line from the top of the move to the first pullback (in other words from wave 5 to the wave B pullback) and then draw a parallel line from the first drop from wave 5 (the A wave). This will give you an idea of where Wave C is likely to finish up.
Simple, what you are doing with the tunnel is amazing stuff. In fact, we like to refer to the tunnel as a guide for where corrections are most likely to end. Additionally, Pennies also looks at the Ichimoku Cloud to find areas of S&R. So when we are determining where a correction may end, we first draw some channel lines like I described above. Then we use some fib ratios to project the end of the correction. Then we look at where the tunnel is as well as the cloud. Typically we'll see a confluence and we then know where the correction has the highest probability of ending. Also, it gives us a range or box where price is most likely to turn around.
Here are 3 charts of N/J showing how I manage my counts across several time frames as I mentioned above (Please note that the colors aren't coded to match the counts on the other charts this is something I'm working on as far as how to coordinate the charts so they are more easily understood):
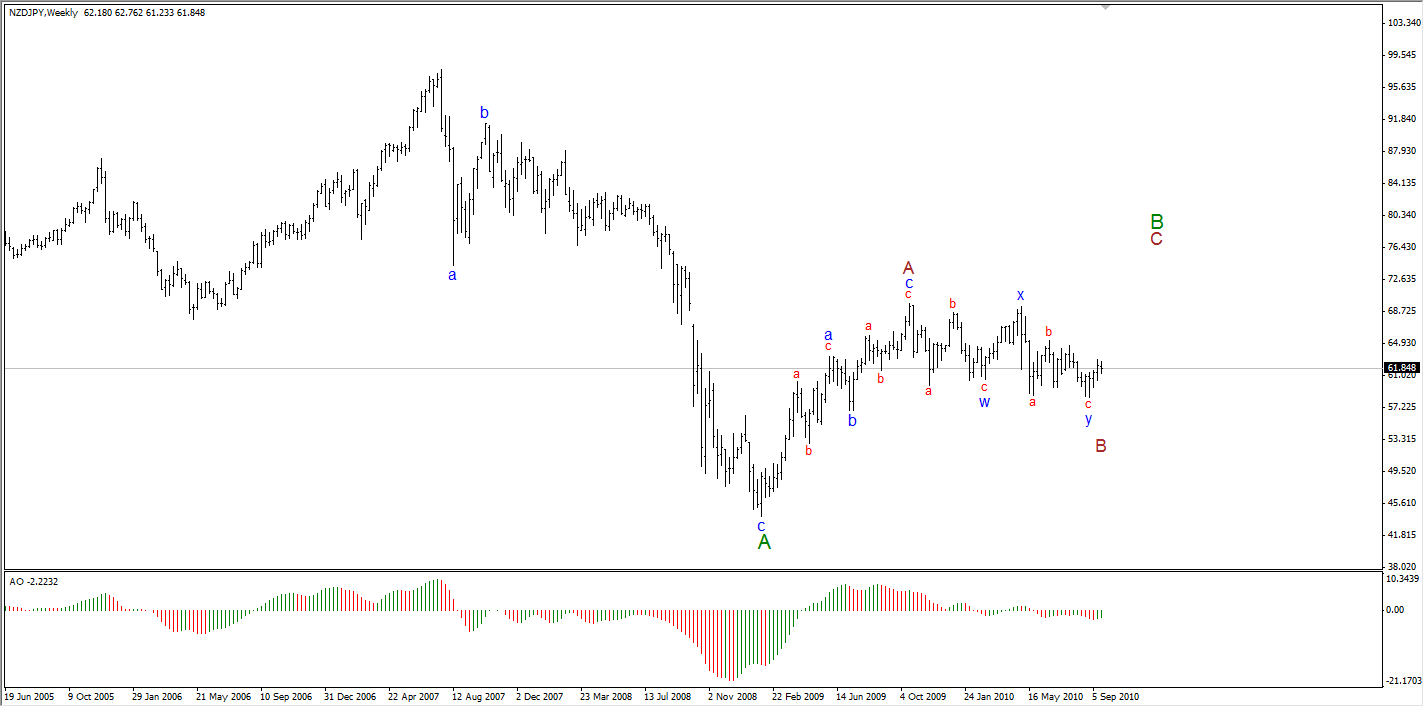
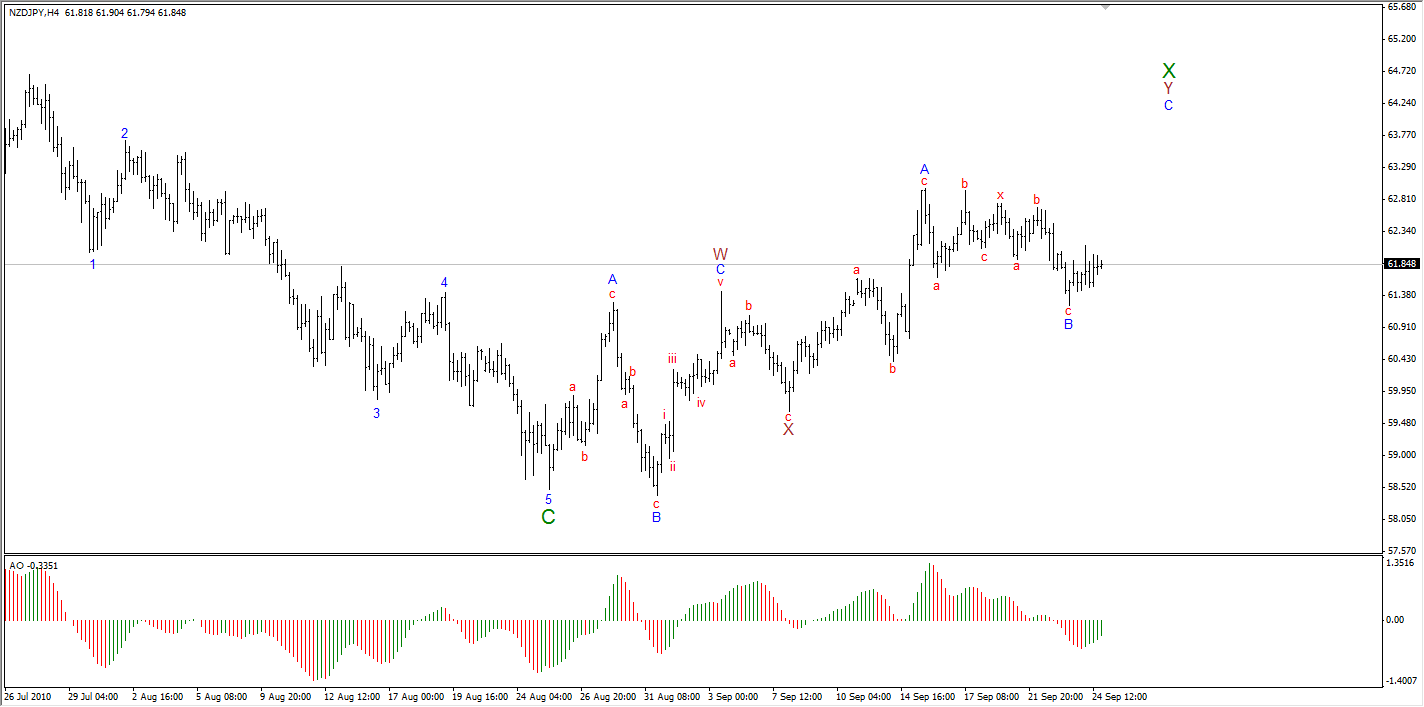
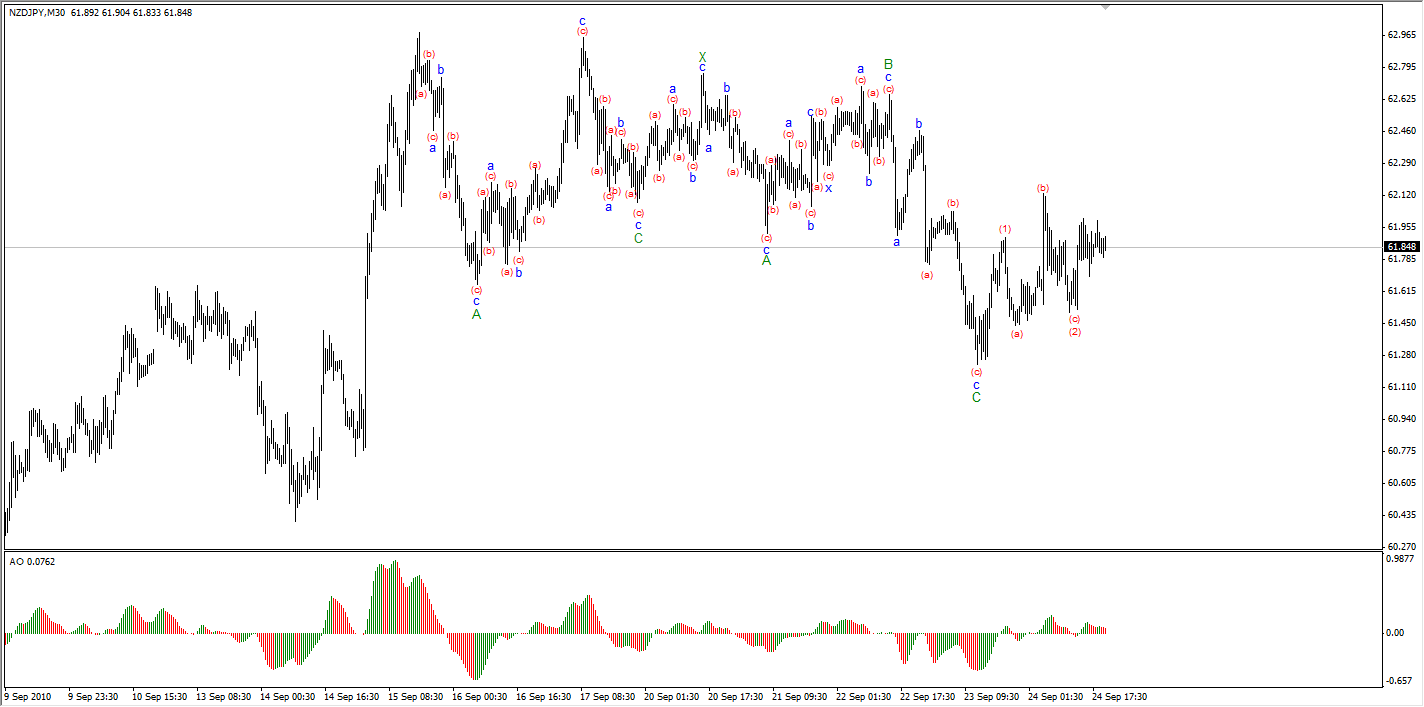


Join the InvestorsHub Community
Register for free to join our community of investors and share your ideas. You will also get access to streaming quotes, interactive charts, trades, portfolio, live options flow and more tools.

