 News
News  Market Data
  Discover

Support: 888-992-3836
Copyright © 2023 InvestorsHub Inc.


Register for free to join our community of investors and share your ideas. You will also get access to streaming quotes, interactive charts, trades, portfolio, live options flow and more tools.
$SPY Millions Worth of OTM Puts Flooding the Tape
By: Cheddar Flow | April 12, 2024
• $SPY Millions Worth of OTM Puts Flooding the Tape

Read Full Story »»»
 DiscoverGold
The 10 Top/Bottom NASDAQ 100 Index percent net change performers
By: Thom Hartle | April 12, 2024
• Today (8:34 CST), the 10 top/bottom percent net change performers in the NASDAQ 100 Index.

Read Full Story »»»
DiscoverGold
Markets Monthly Pattern »» Watchlist - Top 10
By: Marty Armstrong | April 12, 2024
• Dow Jones Industrials Index »» Pendulum Swing to Downside
• NASDAQ Composite Index »» New Pattern Forming
• NASDAQ 100 Index »» New Pattern Forming
• S&P 500 Index »» Turning BACKDOWN
• Russell 2000 Index »» Turning BACKDOWN
• US Dollar Index »» New Pattern Forming
• CBOE VIX Index »» Temp High
• NY Gold Futures »» Pressing Higher
• NY Silver COMEX Futures »» Temp High
• NY Crude Oil Futures »» New Pattern Forming
DiscoverGold
2023 Q4 Earnings Analysis and Projections Through 2024 Q4
By: Carl Swenlin | April 11, 2024
S&P 500 earnings are in for 2023 Q4, and here is our valuation analysis.
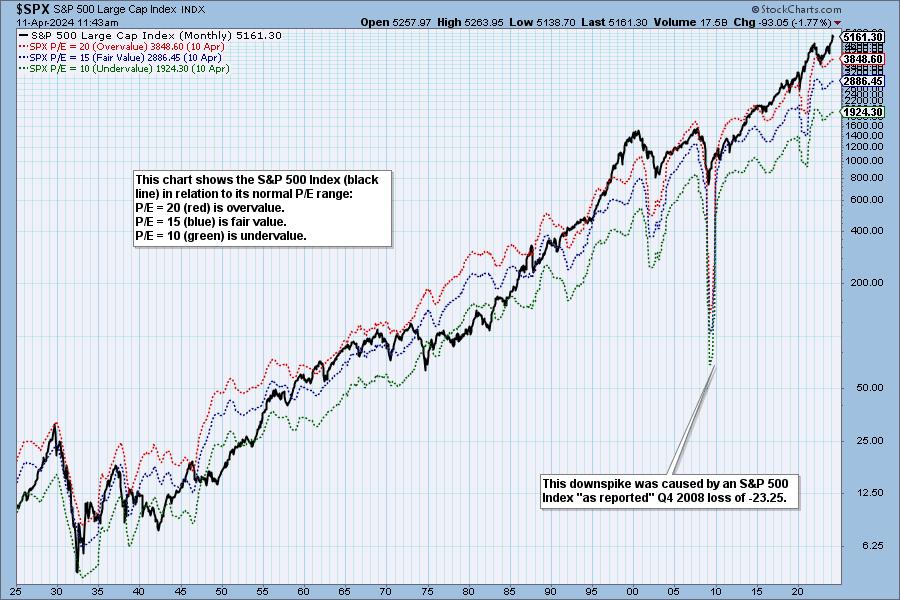
The following chart shows the normal value range of the S&P 500 Index, indicating where the S&P 500 would have to be in order to have an overvalued P/E of 20 (red line), a fairly valued P/E of 15 (blue line), or an undervalued P/E of 10 (green line). Annotations on the right side of the chart show where the range is projected to be based upon earnings estimates through 2024 Q4.
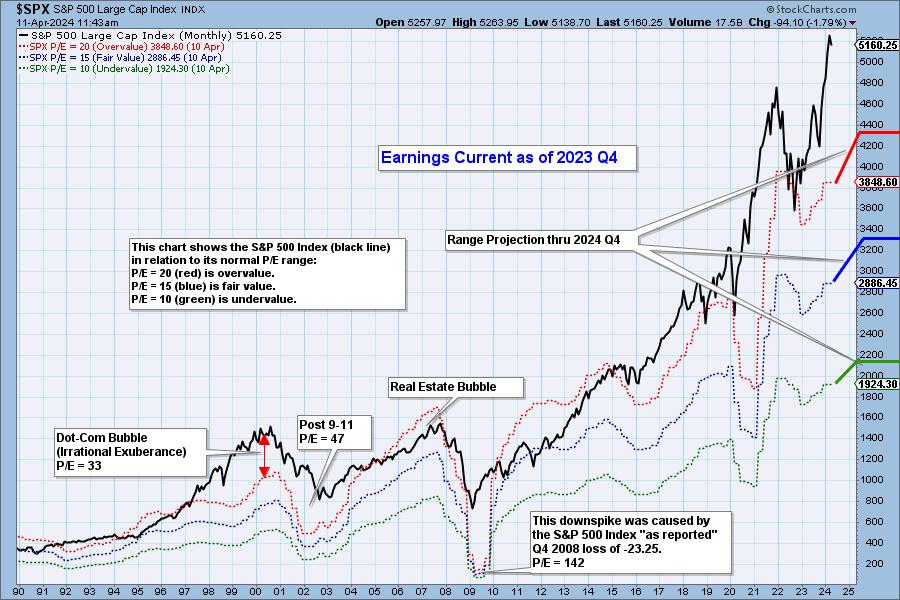
Historically, price has usually remained below the top of the normal value range (red line); however, since about 1998, it has not been uncommon for price to exceed normal overvalue levels, sometimes by a lot. The market has been mostly overvalued since 1992, and it has not been undervalued since 1984. We could say that this is the "new normal," except that it isn't normal by GAAP (Generally Accepted Accounting Principles) standards.
We use GAAP earnings as the basis for our analysis. The table below shows earnings projections through December 2024. Keep in mind that the P/E estimates are calculated based upon the S&P 500 close as of December 29, 2023. They will change daily depending on where the market goes from here. It is notable that the P/E is outside the normal range.
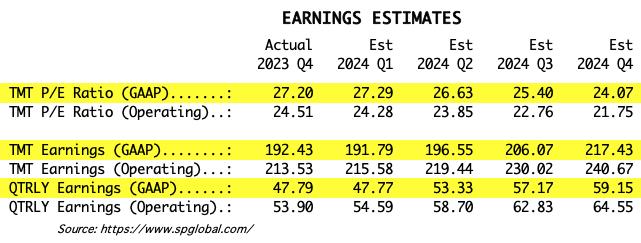
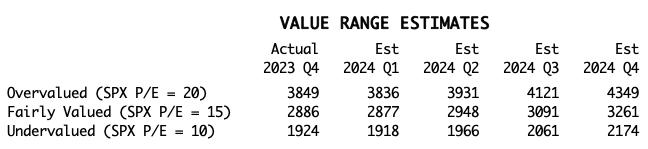
The following table shows where the bands are projected be, based upon earnings estimates through 2024 Q4.
This DecisionPoint chart keeps track of S&P 500 fundamentals, P/E and yield, and it is updated daily -- not that you need to watch it that closely, but it is up-to-date when you need it.
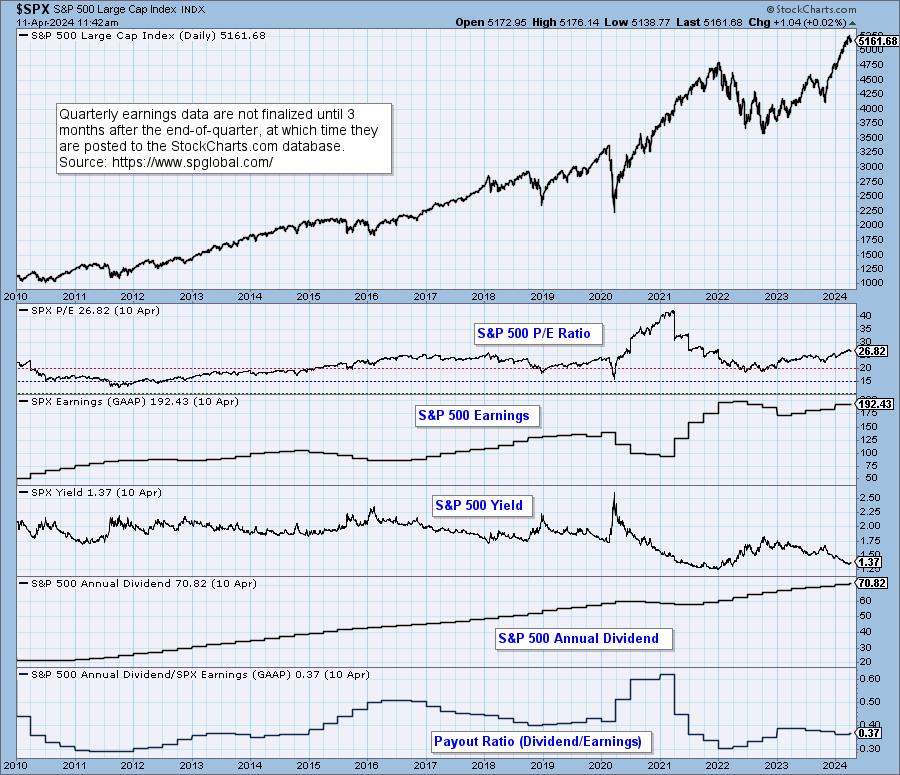
CONCLUSION: The market is still very overvalued and the P/E is still above the normal range. Earnings have ticked up, are trending up, and are estimated to be higher through the end of this year. Being overvalued doesn't require an immediate decline to bring valuation back within the normal range, but high valuation applies negative pressure to the market environment.
Read Full Story »»»
DiscoverGold
Money managers Reduced their exposure to the US Equity markets since last week...
DiscoverGold
NAAIM Exposure Index
April 11, 2024 
The NAAIM Number
81.92
Last Quarter Average
87.84
»»» Read More…
The 10 Top/Bottom S&P 500 Index percent net change performers
By: Thom Hartle | April 11, 2024
• Today (8:34 CST), the 10 top/bottom percent net change performers in the S&P 500 Index.

Read Full Story »»»
DiscoverGold
The AAII Investor Sentiment
By: AAII | April 11, 2024
Bullish 43.4%
Neutral 32.5%
Bearish 24.0%
• Historical 1-Year High
Bullish: 52.9%
Neutral: 39.5%
Bearish: 50.3%
Read Full Story »»»
DiscoverGold
Did the NASDAQ 100 Top in March?
By: Dr. Arnout Ter Schure | April 10, 2024
• A break below $17300 is still needed to confirm the top, but for now, the weight of the evidence looks Bearish and suggests a trip to $15900+/-200 should be expected.
The Recent All-time High Was Made Three Weeks Ago
In our previous update from late March, see here, we assessed where the NASDA100 (NDX) could ideally top using the Elliott Wave Principle (EWP), and we postulated back then:
“…When we assess the daily chart, see Figure 2 above, we find that the typical W-5 = W-1 relationship targets ~$18615, …, the colored dotted lines are the warning levels that will tell us if the uptrend is in jeopardy. The Bulls’ 1st warning is the blue level at $18,3000. The 2nd warning is the grey level at $18000, etc. This means that below the red warning level (the green W-4 low), the black W-4? is underway to ideally NDX15900+/-200.”
Fast-forward: The index peaked at $18464 on March 21, which is only 0.81% below the ideal target of ~$ $ $18615 and has declined since. The index has now broken below two of the four colored warning levels for the Bulls we had identified ($18300, $18000, $17750, $17300), as it is currently trading at $17980.
Moreover, it has lost the (green) 20-day Simple Moving Average (d SMA) but is sitting right at the 50d SMA. Besides, all the technical indicators (TIs) are pointing lower and are on a sell, adding weight to the Bearish evidence. However, it is still above the Ichimoku Cloud and 200d SMA. See Figure 1 below. Thus, although the weight of the evidence is Bearish, the index has yet to break below $17750. When it does that, it increases the odds it topped for the potential black W-3 in March and is heading for the ideal black W-4? target zone of $15900+/-200.
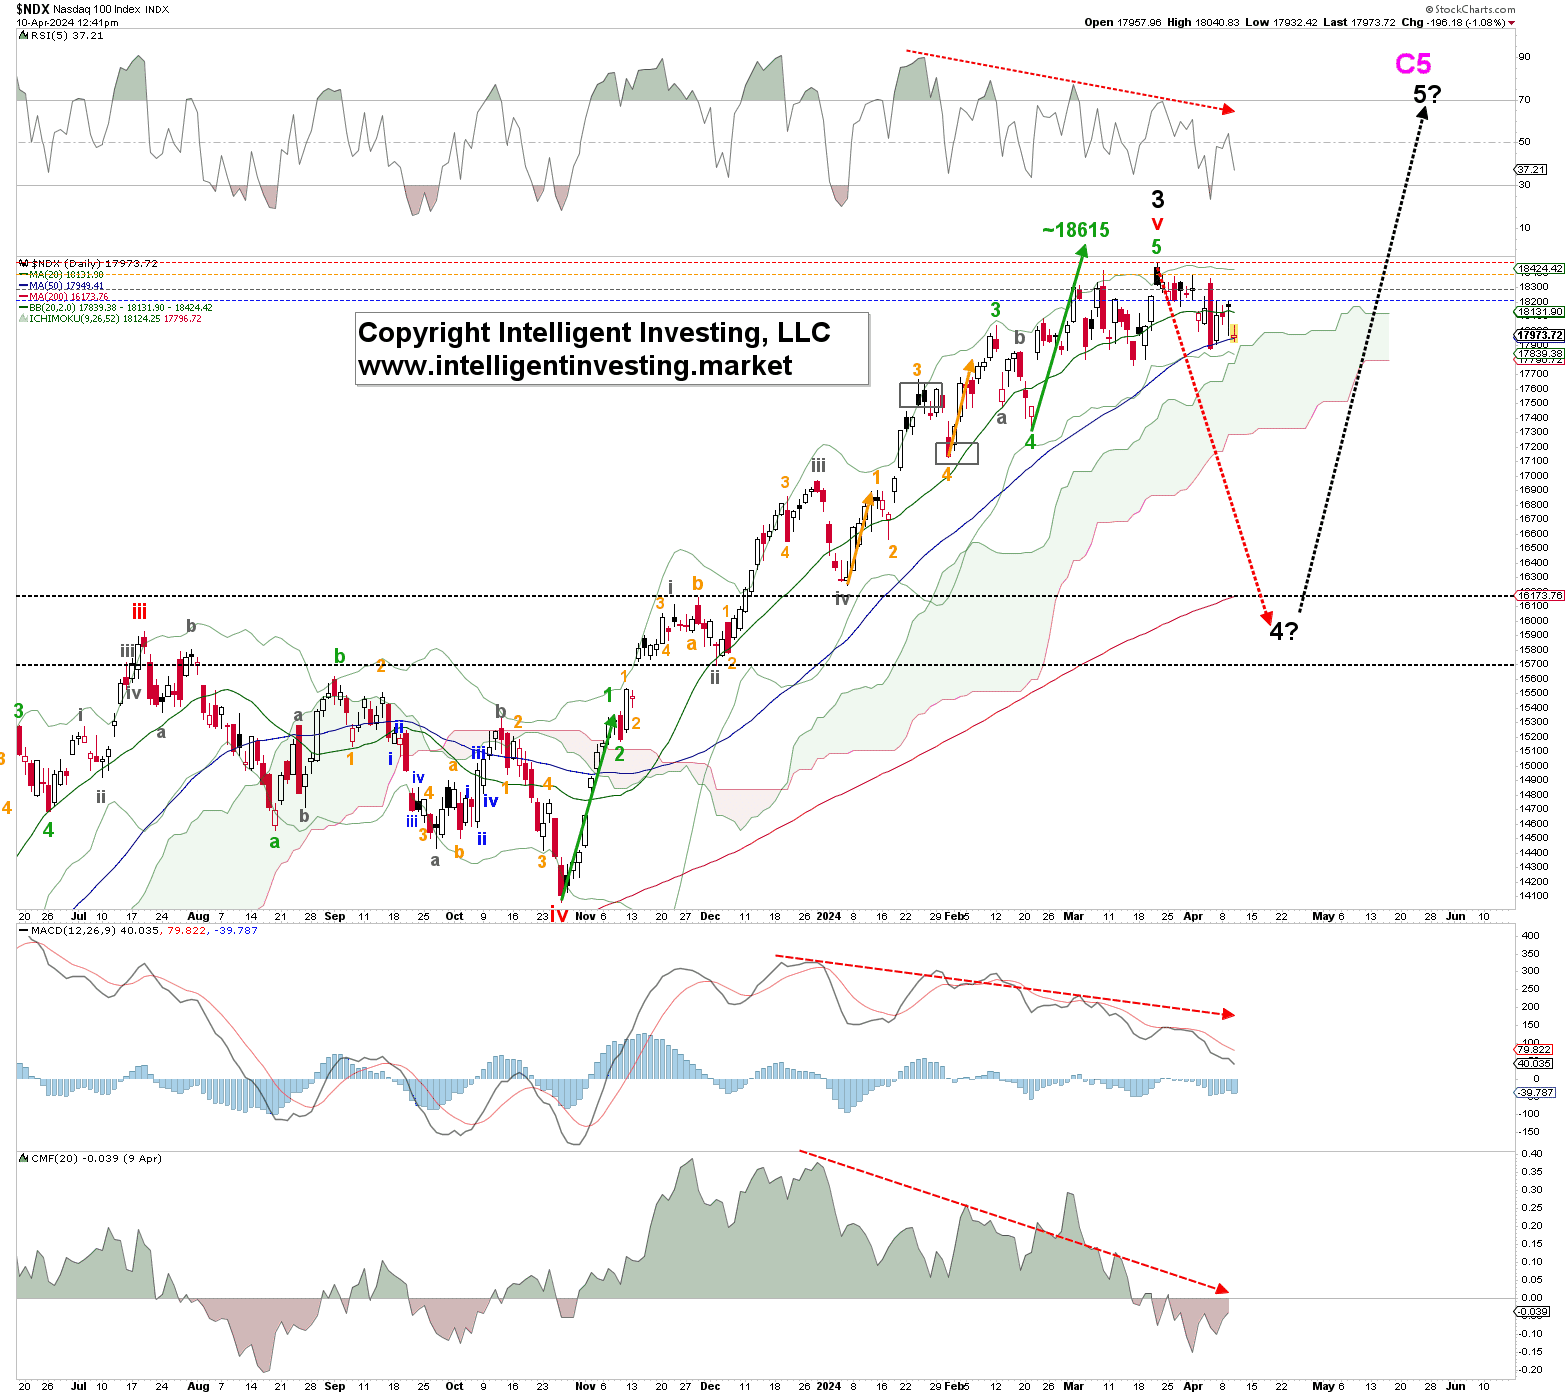
Figure 1. NDX daily chart with detailed EWP count and technical indicators
Thus, our preferred EWP count is for a larger top to have formed, contingent on holding below the colored warning levels shown in Figure 1 above.
The Bulls Have One Last Option Left
However, in a five-wave ending diagonal, the wave structure is most often a 3-3-3-3-3 count as all five of the waves of an ending diagonal break down to only three waves each, indicating exhaustion of the trend. Also, Wave 3 is not the shortest, and Wave 1 and Wave 4 may overlap.
Most ending diagonals have a wedge shape where they fit within two converging lines. In Figure 2 below, we can see that the possible W-i, ii, iii, and iv thus far are all made up of three waves and that W-iv overlapped with W-i, whereas the two grey trend lines thus far contain the price action.
Thus, our alternate EWP count is that the price action is ticking off all the boxes for an ending diagonal, contingent on holding above the colored dotted warning levels. These levels are so close to the current price that the Bulls are walking a tightrope while playing with fire, which is why we view it currently as our alternative.
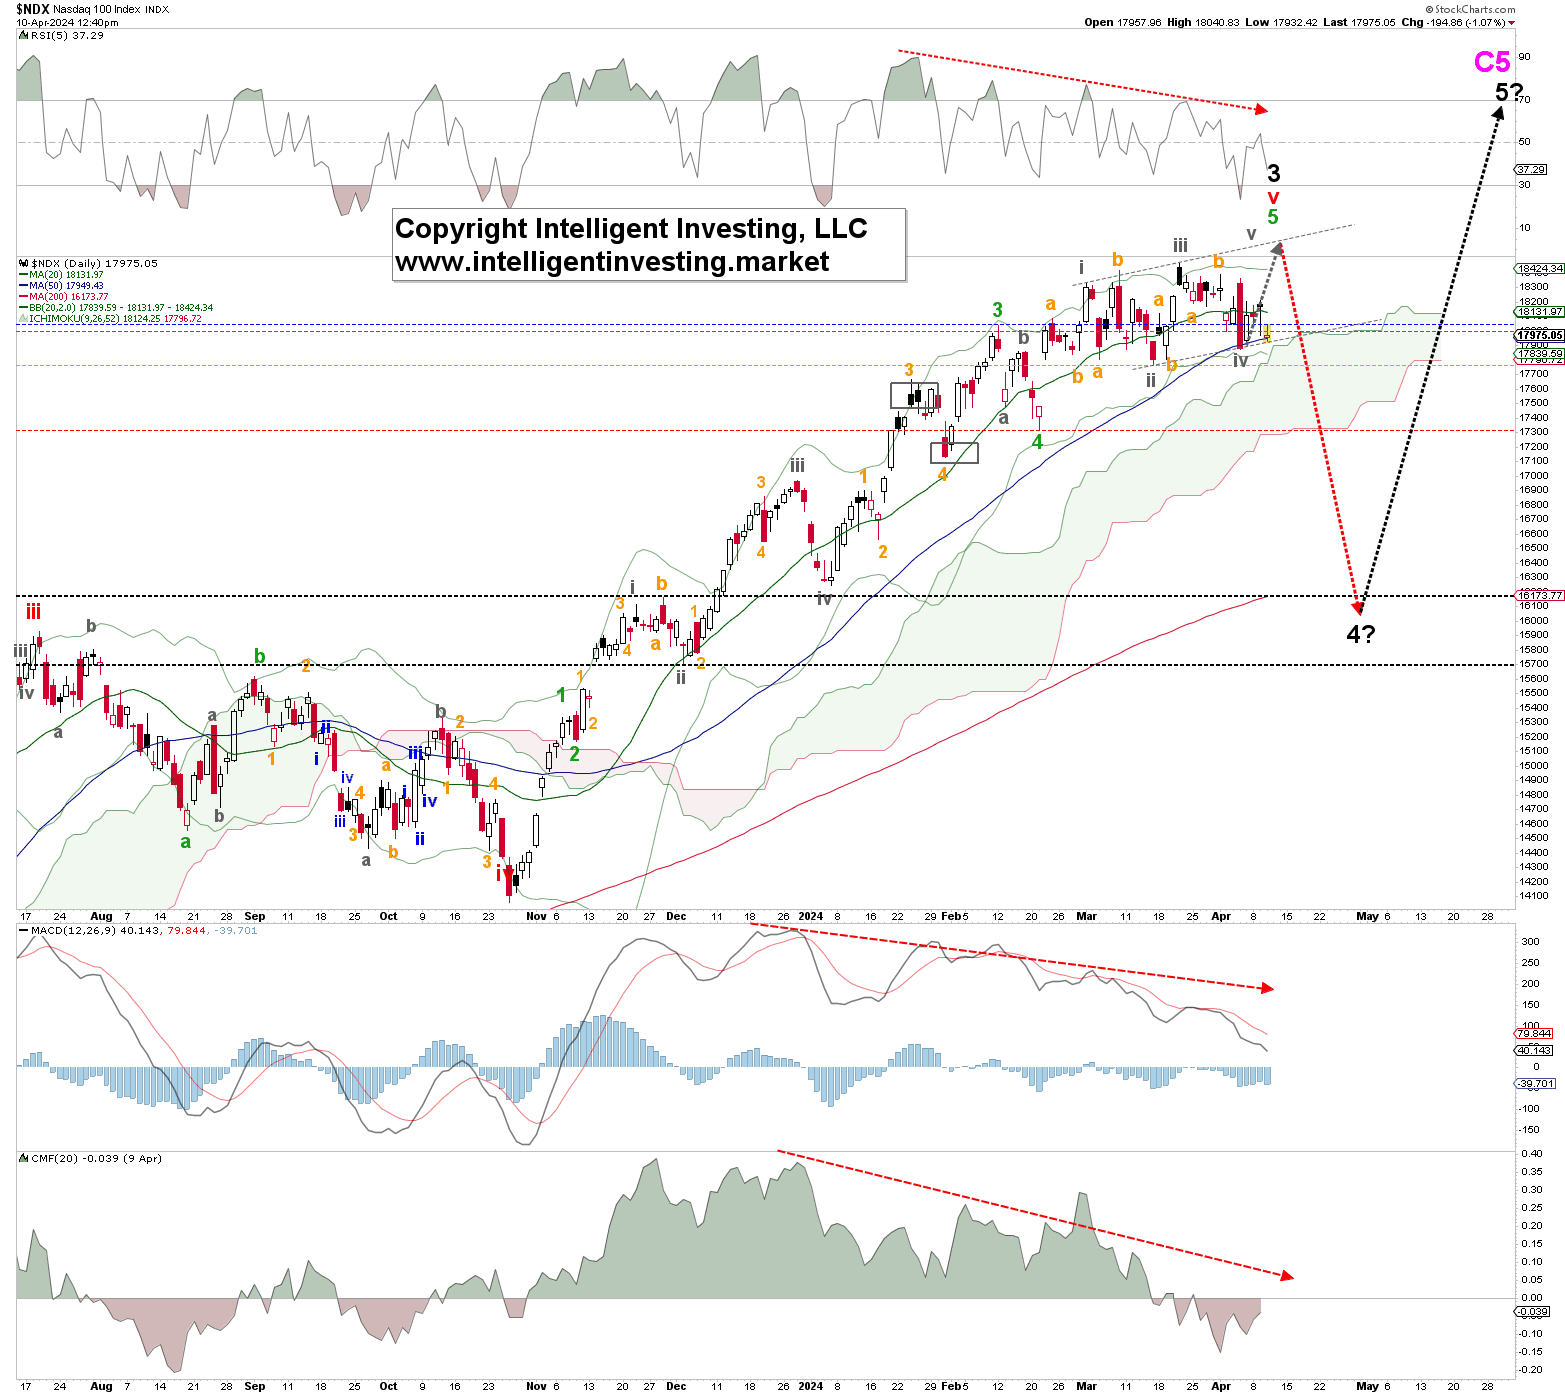
Figure 2. Daily NDX chart with detailed EWP count and technical indicators
Moreover, even if we see a last grey W-v materialize to ideally $18615, the black W-4? still looms after it. Thus, that would make for a 640p reward vs. a 2000p risk—something to consider. Lastly, please note that a break below the October 2023 low tells us the bull market is over.
Read Full Story »»»
DiscoverGold
$SPY & $QQQ Millions worth of more OTM Puts. They have been buying these all day
By: Cheddar Flow | April 10, 2024
• $SPY & $QQQ Millions worth of more OTM Puts
They have been buying these all day

Read Full Story »»»
DiscoverGold
How SPX Sectors Performed During the Rally
By: Schaeffer's Investment Research | April 10, 2024
• Breaking down the 20 sectors that made outsized moves during the recent rally
• Plus, how options traders responded to the movements
Over the last five months, stocks have been remarkably strong. Since the S&P 500 Index (SPX) bottomed in late October of last year, the broader-market index has gained over 25%. I’ve written a few articles over the past several weeks about strength in stocks. This week, I’m going to focus on sector performance during this rally. I’ll also see what option buyers have been doing during this rally compared to the timeframe just before the rally.
BEST & WORST SECTORS DURING THE RALLY
Using a list of stocks that have decent option liquidity, I separated the them into 27 sectors and summarized the returns since the start of the current rally. The table below lists the 10 sectors with the highest average stock return.
Biotech stocks lead the way, but the average is skewed by some huge individual stock returns. Note that the median return for that sector is the lowest in the table. Also, in the table, I summarized the returns for the five months before the rally. Specifically, it looks at the return from the beginning of June until Oct. 27, the low point on the SPX in October. The biotech names struggled in the period leading up to the rally.
Banks and brokerages listed in the table have also performed well. Those two sectors consist of 39 stocks combined. All 39 stocks have been positive during the rally. Real estate investment trusts (REIT) is a sector that did not crack the top 10 in average return, but does consist of 12 stocks that were all positive (they ranked 11th with an average return of 34%). It seems you could not have gone wrong with anything in the financial realm over the past five months.

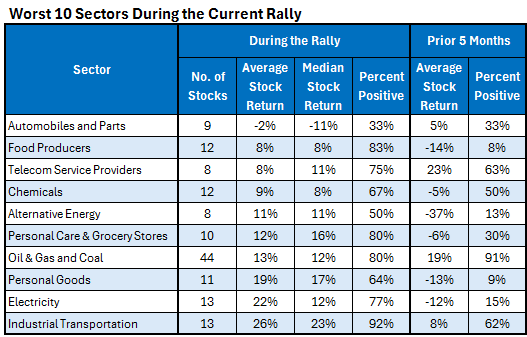
This next table shows the 10 worst sectors during the current rally. The automobiles and parts sectors is the only sector in which the stocks averaged a negative return. They averaged a 2% loss, with just three of nine stocks in that sector positive. The worst sector during the five months preceding the rally was the alternative energy sector, which averaged a 37% loss during those prior five months. It’s also been one of the worst sectors during the current rally. The eight stocks in that sector meeting the option liquidity criteria averaged an 11% return, with half of the stocks positive.
HOW HAVE OPTIONS TRADERS REACTED?
The table below shows the 10 best sectors by average stock return. So, it’s the same sectors as the first table above. The data gives a good idea about how option buyers have behaved recently during the rally compared to before the rally. I used buy-to-open (BTO) option volume which only considers option volume initiated by buyers. Looking at the pharma and biotech sector (the first row), calls were bought heavily compared to puts during rally. The BTO call/put ratio during the rally was 2.74. In the five months before the rally, calls and puts were bought almost evenly. The last column shows the volume during the rally was 12% higher than the five months before the rally (the ratio is 1.12).
Two of the sectors, despite these being the best sectors during the rally, showed fewer calls relative to puts during the rally. Those are the industrial metals and mining sector and consumer services.

Finally, this last table shows the 10 worst performing sectors during the rally. The worst performing sector has been the automobiles and parts sector. Option buyers haven’t changed their behavior much for these stocks. There has been about 10% less volume with the BTO call/put ratio being almost identical during the rally to the five months preceding the rally.
There was a huge increase in BTO option volume for the chemicals sector. Volume increased about 50% and calls have gotten popular compared to puts. The BTO call/put ratio was 1.05 in the five months before the rally but during this rally the ratio has been 2.21.

Read Full Story »»»
DiscoverGold
Markets Monthly Pattern »» Watchlist - Top 10
By: Marty Armstrong | April 10, 2024
• Dow Jones Industrials Index »» Possible Important High
• NASDAQ Composite Index »» Still BULLISH
• NASDAQ 100 Index »» Still BULLISH
• S&P 500 Index »» Still BULLISH
• Russell 2000 Index »» Turning Back Down
• US Dollar Index »» Pressing Higher
• CBOE VIX Index »» Temp High
• NY Gold Futures »» Pressing Higher
• NY Silver COMEX Futures »» Temp High
• NY Crude Oil Futures »» Possible Temp High, New Highs Still Possible
DiscoverGold
$SPY Large $2.7M Far OTM Put Buyer. This is an aggressive bet that expires in 1.5 months and is above the ask
By: Cheddar Flow | April 10, 2024
• $SPY Large $2.7M Far OTM Put Buyer
This is an aggressive bet that expires in 1.5 months and is above the ask

Read Full Story »»»
DiscoverGold
AI-generated Buy and Sell Daily Signals
By: Hedgeye | April 10, 2024

Read Full Story »»»
DiscoverGold
Best Six Months Rally Respite Underway April Tracks Election Year Seasonality
By: Almanac Trader | April 9, 2024

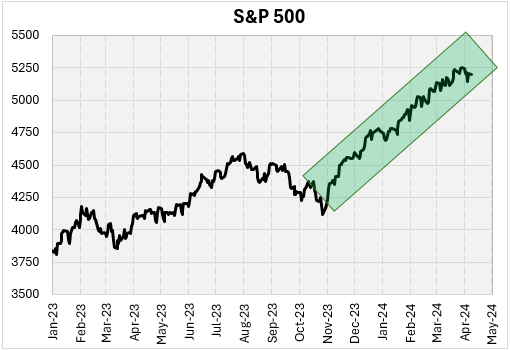
It’s been a banner “Best Six Months (BSM)” (November-April) for the Dow and S&P 500. From our Seasonal MACD Buy Signal on October 9, 2023, through our April 2, 2024 Seasonal MACD Sell Signal), DJIA gained 16.6%, S&P 500 20.1% – double the historical average BSM gains. These big gains have not left much on the table until later this year.
Risks are more elevated now. Sentiment continues to run high. Valuations are extended. Geopolitical tensions have not eased. And persistent inflation pressures have the Fed in no rush to cut rates. As the election campaign rhetoric heats up and the Best Six Months comes to a close, we are shifting to a more cautious stance.
As you can see in the chart of April 2024 compared to election year Aprils since 1950 the market is tracking the softer election year April pattern.
Read Full Story »»»
DiscoverGold
$SPY Large $2.4M OTM Call
By: Cheddar Flow | April 9, 2024
• $SPY Large $2.4M OTM Call
This is a highly unusual print that is betting on aggressive continuation to bullish momentum
*Above the Ask*

Read Full Story »»»
DiscoverGold
$SPX: Small speculators are wildly bullish. An absurdly small sample size from this particular indicator, so NOT a “sell signal” IMO. But perhaps a good place to invoke…
By: Jay Kaeppel | April 9, 2024
• Small speculators are wildly bullish. An absurdly small sample size from this particular indicator, so NOT a “sell signal” IMO. But perhaps a good place to invoke…

Read Full Story »»»
DiscoverGold
Today, the equal-weight S&P 500 fund $RSP will celebrate its 100th consecutive session levitating above its 50-day moving average...
By: Jason Goepfert | April 9, 2024
• Today, the equal-weight S&P 500 fund $RSP will celebrate its 100th consecutive session levitating above its 50-day moving average.
It's done this only 4 times in its history.
All good things come to an end.

Read Full Story »»»
DiscoverGold
S&P 500: With a reading of 87.86, the US stock market remains overbought, which is raising concerns among some investors who foresee a possible correction in the near future
By: Isabelnet | April 9, 2024
• With a reading of 87.86, the US stock market remains overbought, which is raising concerns among some investors who foresee a possible correction in the near future.

Read Full Story »»»
DiscoverGold
S&P 500: An increase of 25% or more in the S&P 500 within 100 days (using the first signal in a cluster) suggests a positive outlook for the next 12 months, historically resulting in a median gain of 13.4% since 1950
By: Isabelnet | April 9, 2024
• An increase of 25% or more in the S&P 500 within 100 days (using the first signal in a cluster) suggests a positive outlook for the next 12 months, historically resulting in a median gain of 13.4% since 1950.

Read Full Story »»»
DiscoverGold
The 10 Top/Bottom NASDAQ 100 Index percent net change performers
By: Thom Hartle | April 9, 2024
• Today (8:33 CST), the 10 top/bottom percent net change performers in the NASDAQ 100 Index.

Read Full Story »»»
DiscoverGold
AI-generated Buy and Sell Daily Signals
By: Hedgeye | April 9, 2024

Read Full Story »»»
DiscoverGold
$SPX 5200 is acting as a magnet level with the enormous options positioning at that strike across puts and calls
By: Markets & Mayhem | April 8, 2024
• $SPX 5200 is acting as a magnet level with the enormous options positioning at that strike across puts and calls.

Read Full Story »»»
DiscoverGold
Most Oversold Stocks coming into the week - $LULU $MCD $NKE $SBUX $ULTA making the list
By: Barchart | April 8, 2024
• Most Oversold Stocks coming into the week - $LULU $MCD $NKE $SBUX $ULTA making the list.

Read Full Story »»»
DiscoverGold
With a current value of 88.27, the Market Greed/Fear Index indicates an extreme level of greed within the US stock market, potentially leading to concerns about overconfidence
By: Isabelnet | April 8, 2024
• Sentiment
With a current value of 88.27, the Market Greed/Fear Index indicates an extreme level of greed within the US stock market, potentially leading to concerns about overconfidence.

Read Full Story »»»
DiscoverGold
S&P 500 after ending streak of >1 year without a -2% daily change
By: Jason Goepfert | April 8, 2024
• While some consider this frivolous trivia, I disagree.
It incorporates investor tendencies during and after periods of high momentum and low volatility.
And when these environments ended, they preceded losses of more than -10% within the next 6 months only once.

Read Full Story »»»
DiscoverGold
2 Indicators Pointing at Potential Volatility Ahead
By: Schaeffer's Investment Research | April 8, 2024
• Traders should be open to unusually large moves higher or lower this week
• The SPX channel depends on a "glass half empty" or glass half full" mindset
“There appears to be sideways action in the SPX 5,235 and 5,250 area, with the former level representing 10% above last year’s close… With respect to levels of support to watch if sellers overwhelm buyers in the near term, I recommend focusing on two levels, both of which are moving targets. The first is the bottom rail of the bullish channel connecting higher lows since mid-January, which comes into the week at 5,190, but will be at 5,225 on Friday. Another level of potential support is the SPX’s 30-day moving average, which is at 5,130 now and projected to be at 5,175-5,180 by week's end. ”
-Monday Morning Outlook, April 1, 2024
If you have been following this commentary over the past few weeks, I have been quantifying the momentum backdrop we have seen in the stock market -- measured by the S&P 500 Index’s (SPX – 5,204.34) impressive rise since late October -- in addition to potential points of resistance, such as the level that is exactly 10% above last year’s close, or 5,235.
Per the chart below, that area indeed came into play as resistance. Additionally, a bull channel began to become evident. I have mentioned the 30-day moving average as well, which contained the mid-January low. I find this interesting because it is not on the radar of most technicians, who focus on the more popular 20-day moving average.
When assessing last week’s price action, in a week that saw Federal Reserve funds futures participants push the odds of an interest rate cut in June from slightly more than a coin flip to slightly less than coin flip, one can either take a “glass half empty” or “glass half full” approach.
The former refers to the break of channel support on Thursday, which was attributed to a Fed president (who is not a voter in the monetary policy setting committee) floating the idea of no rate cuts this year. In fact, Friday’s intraday high at 5,225 was at the bottom rail of this channel.
The “glass half full” approach points to the SPX holding -- at least for now -- the 30-day moving average (at 5,160), a trendline that marked a solid buying opportunity in January.

This channel break is noteworthy because it could be suggesting that, at the very least, momentum has slowed. If the SPX quickly makes a bold move above the bottom-rail of the channel, it will confirm the 30-day moving average hold and give bulls renewed hope for more pain in the weeks ahead for bears.
Coincidentally, the bottom rail of the channel begins the week at 5,235, which is a level that coincides with 10% above the 2023 close. This channel ends the week at 5,271, which means a new high could be achieved this week, even with the SPX below the bottom rail of the channel.
Bulls should also take note of the CBOE Market Volatility Index’s (VIX – 16.01) move above 15.40, which is half the 2023 high and an area that has marked multiple peaks this year. With two closes comfortably above 15.40, be open to the possibility that the VIX is hinting at higher volatility ahead, which could mean coincidental weakness in equities.

“There was a short interest build in the second half of 2021 as stocks rallied, and this preceded notable weakness in the market from the start of 2022 that lasted into the fourth quarter of 2022. As such, it is not a given that the market will soar to new highs amid this seemingly bullish backdrop. ”
-Monday Morning Outlook, April 1, 2024
In last week’s commentary, I noted the short interest build that occurred in the first half of March. On the surface, this is bullish. But as I noted last week, if weakness in the market is in the cards, the shorts could become more aggressive and therefore add to selling.
On one hand, depending on how shorts react, they could use last week’s decline to cover losing positions, keeping pullbacks mild-natured. Or they may wait and look for opportunities to feed on additional weakness, as witnessed in 2022.
Something that intrigued me last week was Thursday’s candle, which happened on the day the bottom of the bull channel was breached. It was a bearish outside day, in which both the high and low were above the prior day’s high and low, with the close below the prior day’s low.
In fact, the SPX opened more than 0.5% higher that day and closed lower by over a percentage point. In other words, it covered a big distance from the open to the close.
I asked Rocky White, our Senior Quantitative Analyst, to investigate prior instances of this happening. Using data since 1998, he found this to be a rare occurrence, with only seven prior events and the first happening in 2008.
The good news is this signal is not overwhelmingly bearish, but the bad news is that it does hint at volatility ahead, as the VIX is currently suggesting. Note that in the five, ten, and 21 days after the SPX opens by 0.5% or higher, it closes more than one percentage point lower relative to the prior day. The average move higher is greater the average in these periods, but the average move lower is also greater than the average for these periods.
As such, if you are trading in these time frames, be open to unusually large moves higher or lower. With Fed minutes due out this week, there could be additional volatility. But for bulls, the good news is that the last time a candle occurred with the market near all-time highs was December 2021. The market was higher by four percent five and ten days later, and higher by nearly 6%, using a one-month measuring period.

Read Full Story »»»
DiscoverGold
The 10 Top/Bottom S&P 500 Index percent net change performers
By: Thom Hartle | April 8, 2024
• Today (8:33 CST), the 10 top/bottom percent net change performers in the S&P 500 Index.

Read Full Story »»»
DiscoverGold
The 10 Top/Bottom NASDAQ 100 Index percent net change performers
By: Thom Hartle | April 8, 2024
• Today (8:33 CST), the 10 top/bottom percent net change performers in the NASDAQ 100 Index.

Read Full Story »»»
DiscoverGold
AI-generated Buy and Sell Daily Signals
By: Hedgeye | April 8, 2024

Read Full Story »»»
DiscoverGold
The S&P 500's $SPY performance each year since 1994
By: Evan | April 7, 2024
• The S&P 500's $SPY performance each year since 1994
1994: +0.4%
1995: +38.1%
1996: +22.5%
1997: +33.5%
1998: +28.7%
1999: +20.4%
2000: -9.7%
2001: -11.8%
2002: -21.6%
2003: +28.2%
2004: +10.7%
2005: +4.8%
2006: +15.9%
2007: +5.1%
2008: -36.8%
2009: +26.4%
2010: +15.1%
2011: +1.9%
2012: +16%
2013: +32.3%
2014: +13.5%
2015: +1.3%
2016: +12%
2017: +21.7%
2018: -4.6%
2019: +31.2%
2020: +18.4%
2021: +28.8%
2022: -18.2%
2023: +24.2%
2024*: +9.4% (So Far)
Read Full Story »»»
DiscoverGold
Sweep orders > $500K from today on $SPY. Overwhelmingly bullish, shorter dated flow
By: TrendSpider | April 5, 2024
• We filtered for sweep orders > $500K from today on $SPY.
Overwhelmingly bullish, shorter dated flow.

Read Full Story »»»
DiscoverGold
CoT: Peek Into Future Through Futures, How Hedge Funds Are Positioned
By: Hedgopia | April 6, 2024
• Following futures positions of non-commercials are as of April 2, 2024.
E-mini S&P 500: Currently net short 78.1k, down 91.3k.

Non-commercials are actively reducing their net shorts, with holdings at a 16-week low; in the week to March 12th, they were net short 239,827 contracts, which have now been cut down to 78,122.
On March 12th, the S&P 500 closed at 5175 and went on to post a fresh intraday high of 5265 on the 28th, with the following session (April 1st), which was a Monday, ticking 5264 before weakening slightly. Non-commercials probably thought the large cap index is setting up for another breakout at 5260s. It will be interesting to find out how they reacted to Thursday’s intraday reversal to the downside (more on this here); at the session low, the cash was down 2.1 percent for the week. In the end, thanks to Friday’s 1.1-percent rally, the weekly loss was reduced to one percent.
Since last October’s low, bulls have been in absolute control and are not going to give up the momentum they have gained without a fight. They put their foot down on Friday. But they are now also dealing with a breach of trendline support from last October, not to mention an RSI divergence. Friday’s rally enabled them to reclaim 5170s, but for them to regain momentum, they will need to break out of 5260s as soon as possible.
Nasdaq (mini): Currently net short 5.2k, down 1.9k.

Thursday’s drop closed the Nasdaq 100 just under the 50-day (17915). The average has not been breached since last October when the index bottomed. Tech bulls needed to show some determination and they did do that on Friday when the intraday low tagged the average and the index rallied 1.3 percent for the session.
For the week, the index fell 0.8 percent, which was better than a loss of 2.1 percent at Thursday’s low, which is small consolation for the bulls. Their problem lies in a sideways action that has now gone on for five weeks. On March 1st, the Nasdaq 100 tagged 18333; this week’s high of 18392 was posted on Monday. The all-time high of 18465 was recorded on March 21st.
Beside the loss of momentum – with RSI divergence – the tech-heavy index (18108) is in breach a rising trend line from last October’s low three weeks ago (more on this here).
Russell 2000 mini-index: Currently net short 22.2k, up 626.

One more week and one more rejection at 2100, which has stopped small-cap bulls for the past month. The March 28th intraday high of 2135 set a two-year high, but the Russell 2000 continues to struggle staying above 2100. This week, it rallied north of the resistance twice intraday but only to close the week down 2.9 percent to 2063.
Horizontal resistance at 2100 goes back to January 2021. This level also represents a measured-move target of a 1700-1900 range breakout on December 13th. Continued rejection at 2100 raises the odds the index heads toward at least 2000 in due course.
US Dollar Index: Currently net short 1.9k, up 1.3k.

The US Dollar Index dropped 0.4 percent this week to 104.07. This came in a week in which the long end of the treasury yield curve rallied nicely. After three straight up weeks, it is possible fatigue is setting in.
Resistance at 103-104 goes back to December 2016. Tuesday’s intraday high of 104.84 just about tested the February 14th high of 104.88. Back then, after that high, the index came under pressure to eventually bottom at 102.30 on March 8th.
Odds favor the dollar index weakens in the sessions ahead.
VIX: Currently net short 50.3k, up 6.4k.

The breach two weeks ago of a rising trend line from December 12th when VIX bottomed at 11.81 is proving false. This week, the volatility index jumped 3.02 points to 16.03, with Thursday rallying as high as 16.92.
VIX remains above both the 50- and 200-day (respectively at 13.95 and 14.66), with both averages slightly rising. This is also the first time since last October the weekly RSI (at 56.22) decidedly rallied past the median.
If the weekly prevails, VIX has more room to rally. The caveat in this is that the daily is now getting extended.
Read Full Story »»»
DiscoverGold
S&P 500 Index (SPX) »» Weekly Summary Analysis
By: Marty Armstrong | April 6, 2024
S&P 500 Cash Index closed today at 520434 and is trading up about 9.10% for the year from last year's settlement of 476983. As of now, this market has been rising for 5 months going into April suggesting that this has been a bull market trend on the monthly time level which has been confirmed by electing all of our model's long-term Bullish Reversals from the key low.
ECONOMIC CONFIDENCE MODEL CORRELATION
Here in S&P 500 Cash Index, we do find that this particular market has correlated with our Economic Confidence Model in the past. The Last turning point on the ECM cycle low to line up with this market was 2009 and 2002. The Last turning point on the ECM cycle high to line up with this market was 2022 and 2007 and 2000.
MARKET OVERVIEW
NEAR-TERM OUTLOOK
The S&P 500 Cash Index has continued to make new historical highs over the course of the rally from 1974 moving into 2024. Noticeably, we have elected two Bullish Reversals to date.
This market remains in a positive position on the weekly to yearly levels of our indicating models. Pay attention to the Monthly level for any serious change in long-term trend ahead.
Looking at the indicating ranges on the Daily level in the S&P 500 Cash Index, this market remains moderately bullish currently with underlying support beginning at 520342 and overhead resistance forming above at 522920. The market is trading closer to the support level at this time. An opening below this level in the next session will imply a decline is unfolding.
On the weekly level, the last important high was established the week of March 25th at 526485, which was up 22 weeks from the low made back during the week of October 23rd. We have seen the market drop sharply for the past week penetrating the previous week's low and it closed lower. We are still trading above the Weekly Momentum Indicators so we have not undermined critical support as of yet. When we look deeply into the underlying tone of this immediate market,
INTERMEDIATE-TERM OUTLOOK
YEARLY MOMENTUM MODEL INDICATOR
Our Momentum Models are rising at this time with the previous low made 2022 while the last high formed on 2023. However, this market has rallied in price with the last cyclical high formed on 2022 warning that this market remains strong at this time on a correlation perspective as it has moved higher with the Momentum Model.
Interestingly, the S&P 500 Cash Index has been in a bullish phase for the past 12 months since the low established back in March 2023.
Critical support still underlies this market at 438504 and a break of that level on a monthly closing basis would warn that a sustainable decline ahead becomes possible. Immediately, the market is trading within last month's trading range in a neutral position.
DiscoverGold
Nasdaq Composite Index (COMP) »» Weekly Summary Analysis
By: Marty Armstrong | April 6, 2024
NASDAQ Composite Index Cash closed today at 1624852 and is trading up about 8.24% for the year from last year's settlement of 1501135. Caution is required for this market is starting to suggest it may now decline on the MONTHLY level. As of now, this market has been rising for 5 months going into April suggesting that this has been a bull market trend on the monthly time level which has been confirmed by electing all of our model's long-term Bullish Reversals from the key low.
ECONOMIC CONFIDENCE MODEL CORRELATION
Here in NASDAQ Composite Index Cash, we do find that this particular market has correlated with our Economic Confidence Model in the past. The Last turning point on the ECM cycle low to line up with this market was 2022 and 2009 and 2002. The Last turning point on the ECM cycle high to line up with this market was 2007 and 2000.
MARKET OVERVIEW
NEAR-TERM OUTLOOK
The NASDAQ Composite Index Cash has continued to make new historical highs over the course of the rally from 2009 moving into 2024. Distinctly, we have elected four Bullish Reversals to date.
This market remains in a positive position on the weekly to yearly levels of our indicating models. Pay attention to the Monthly level for any serious change in long-term trend ahead.
From a perspective using the indicating ranges on the Daily level in the NASDAQ Composite Index Cash, this market remains moderately bullish currently with underlying support beginning at 1624532 and overhead resistance forming above at 1631295. The market is trading closer to the support level at this time. An opening below this level in the next session will imply a decline is unfolding.
On the weekly level, the last important high was established the week of March 18th at 1653886, which was up 21 weeks from the low made back during the week of October 23rd. We have seen the market drop sharply for the past week penetrating the previous week's low and it closed beneath that low which was 1627917. This was a very bearish technical indicator warning that we have a shift in the immediate trend. We are still trading neutral on the Weekly Momentum Indicators and this is a warning that initial support has been breached. This strongly implies we should pay close attention now to the Weekly Bearish Reversals. If we begin to elect Weekly Bearish Reversals, then we are dealing with a more sustainable near-term correction. When we look deeply into the underlying tone of this immediate market, we see it is currently still in a weak posture.
INTERMEDIATE-TERM OUTLOOK
YEARLY MOMENTUM MODEL INDICATOR
Our Momentum Models are rising at this time with the previous low made 2022 while the last high formed on 2023. However, this market has rallied in price with the last cyclical high formed on 2021 warning that this market remains strong at this time on a correlation perspective as it has moved higher with the Momentum Model.
Interestingly, the NASDAQ Composite Index Cash has been in a bullish phase for the past 12 months since the low established back in March 2023.
Critical support still underlies this market at 1405840 and a break of that level on a monthly closing basis would warn that a sustainable decline ahead becomes possible. Immediately, the market is trading within last month's trading range in a neutral position.
DiscoverGold
SPY: Negative reversal bars at a 52-week high have a consistent tendency to lead to further short-term pullbacks of up to a week later
By: Jason Goepfert | April 5, 2024
• Negative reversal bars at a 52-week high have a consistent tendency to lead to further short-term pullbacks of up to a week later.
After that...nope.

Read Full Story »»»
DiscoverGold
Extremely Overbought Stock Market Uses Non-Voting FOMC Member Kashkari’s Hawkish Comments As Excuse To Sell Off
By: Hedgopia | April 5, 2024
It is probable US households’ equity allocation set a new high last quarter. Stocks have relentlessly rallied for over five months – without so much of a correction. With investor sentiment looking frothy, bulls are increasingly running out of tailwinds to continue to push equities higher.

In the December quarter, US households’ equity allocation jumped 1.87 percentage points sequentially to 36.2 percent (Chart 1). This was the largest quarter-over-quarter increase in three years. The all-time high of 37.7 percent was set in 4Q21 – just before the S&P 500 peaked at 4819 in January 2022; the index did not bottom until hitting 3491 in October that year.
It is probable the equity allocation set a fresh record in the March quarter. This series is contained in the Federal Reserve’s Z.1 report, which is published with a rather long lag. Numbers for the last quarter were released about a month ago, with the March quarter on schedule for early June.
The large cap index jumped 11.2 percent in 4Q23 and another 10.2 percent in 1Q24. The market capitalization of S&P 500 companies expanded by $4.1 trillion in the December quarter and by another $4 trillion in the March quarter. This should be enough to push the equity allocation past the 37.7 percent record. It is worth reviewing how investor sentiment behaved back then.

This week (as of Tuesday), Investors Intelligence bulls increased 1.9 percentage points week-over-week to 62.5 percent, while bears slid 1.1 percentage points to 14.1 percent. This respectively was the highest since April 2021 and the lowest since January 2018. The bulls-to-bears ratio printed 4.4. In three of the last four weeks, the ratio crossed four, with the prior week (the week to March 26th), coming in at 3.99, which is essentially four (Chart 2).
This was also the fourth week in a row the bullish percent remained north of 60 percent. The last time this sentiment was as elevated was the latter months of 2020 and early 2021. Back then, for 10 consecutive weeks between November 2020 and January 2021, bulls’ count remained north of 60 percent, with the bulls-to-bears ratio well north of three percent. This bullishness got hardly unwound in 2021, as, between January and July, there were 10 weeks of bulls over 60 percent. The S&P 500 suffered a minor drop in January but went on to rally in nine of the next 11 months to finish 2021 up 26.9 percent. This was when the equity allocation jumped to 37.7 percent. And this is what ultimately gave way to the 2022 collapse in stocks.

From just the sentiment perspective, it is hard to tell if the bullish boat is leaning to one side enough to capsize right away. Just going by the Investors Intelligence survey, and if past is prologue, there is room for sentiment to continue higher before it hits a tipping point. At the same time, households’ equity allocation is dangerously close to a bubble territory.
Just since the October low, the S&P 500 rallied north of 28 percent before selling off a tad this week, and this creates a situation in which it is tempting to lock in gains – at least some. For that to occur, and for stops to get taken out, the technically-oriented ones in particular are keenly watching some levels.
With one session to go, the S&P 500, down two percent this week to 5147, is now in breach of a rising trend line from last October’s low (Chart 3). A similar trend line on the Nasdaq 100 was compromised three weeks ago. Thursday’s 1.2-percent decline resulted in the S&P 500 also losing shorter-term moving averages, with the bulls unable to defend 5170s and also not able to push through 5260s. The index peaked at 5265 on March 28th.
Ironically, Thursday’s selloff was blamed – wrongly – on hawkish interest-rate comments from Neel Kashkari, Minneapolis Fed president. First, he has been hawkish for a while now. Second, he is not a voting member this year. This is an extended market looking for a reason to sell off, and there is a long way to go before the currently soapy sentiment is unwound.
Read Full Story »»»
DiscoverGold
AI-generated Buy and Sell Daily Signals
By: Hedgeye | April 5, 2024
NEW SIGNALS TODAY:
• UST 30yr Yield - Adds Buy

Read Full Story »»»
DiscoverGold
Tech put buyers are likely monetizing here after yesterday's downside $NVDA $QQQ
By: Cheddar Flow | April 5, 2024
• Tech put buyers are likely monetizing here after yesterday's downside
$NVDA $QQQ

Read Full Story »»»
DiscoverGold
$SPX Large Puts With Time Starting to Roll in
By: Cheddar Flow | April 5, 2024
• $SPX Large Puts With Time Starting to Roll in

Read Full Story »»»
DiscoverGold
Markets Monthly Pattern »» Watchlist - Top 10
By: Marty Armstrong | April 5, 2024
• Dow Jones Industrials Index »» Turning to DOWNSIDE
• NASDAQ Composite Index »» Possible Important High
• NASDAQ 100 Index »» Possible Important High
• S&P 500 Index »» Possible Important High
• Russell 2000 Index »» Turning BACK DOWN
• US Dollar Index »» Pressing Higher
• CBOE VIX Index »» Temp High
• NY Gold Futures »» Pressing Higher
• NY Silver COMEX Futures »» Near-Term BULLISH
• NY Crude Oil Futures »» Temp High
DiscoverGold
April Ends Best Six Months #1 DJIA
By: Almanac Trader | April 3, 2024

April is the final month of the “Best Six Months” for DJIA and the S&P 500. April is #1 DJIA month by average performance since 1950, 2nd best S&P 500 month and 4th best NASDAQ (since 1971).
In election years, performance and rank softens slightly, 3rd best DJIA and S&P 500 month, 6th for NASDAQ, but remains bullish. April is the last month of DJIA and S&P 500 “Best Six Months.” NASDAQ’s Best Months run through June. Election Year Aprils are up 1.3% on average for S&P 500.

Read Full Story »»»
DiscoverGold
Seasonality for QQQ (25 Years)
By: TrendSpider | April 3, 2024
• When filtering out non-election years, we can see $QQQ also has one of its lowest win rates in April:
Positive just 33% of the time over the last 25 years.

Read Full Story »»»
DiscoverGold
Can the S&P 500 Reach 5390?
By: Dr. Arnout Ter Schure | April 3, 2024
• The index reached $5260s as anticipated last and can now target $5390, a break above last week’s high. Contingent on holding above at least $5228.
Weak Bears Equals Strong Bulls
In our previous update, we anticipated using the Elliott Wave Principle (EWP) for the S&P500 (SPX):
“…the (grey) $5093 level is support, tested today, and a break below it would be a strong warning to the bulls. Ultimately, we need to see a break below $5056 … and a follow-through below $4946 … to confirm a significant top has been struck. However, if, like last, the index breaks higher because the bears fail to break below critical levels and reach the next target zone of ~$5260, support will be moved up to $5150.”
Fast forward, and the index held the $5093 level, broke higher, i.e., above the March 8 high at $5189, and reached $5264 on March 28 as anticipated. However, it has rallied over the last three weeks in an overlapping fashion, which strongly suggests an ending diagonal is forming. See Figure 1 below.

Figure 1. Daily SPX chart with detailed EWP count and technical indicators
The Dreaded Ending Diagonal
In a five-wave ending diagonal, the wave structure is most often an overlapping, confusing, 3-3-3-3-3 count as all five of the waves of an ending diagonal break down to only three waves each, indicating exhaustion of the larger degree trend. Most ending diagonals have a wedge shape where they fit within two converging lines. The 3rd, 4th, and 5th waves often reach the 100-123.60%, 50.0-61.8%, and 138.20-161.80% Fibonacci extensions of W-1, measured from the W-2 low, respectively.
In Figure 1 above, we can see that the grey W-i, ii, iii, and iv thus far are all made up of three waves and that W-iii and W-iv topped and bottomed at the exact Fib-extensions. The grey arrows show that if the length of W-i, iii, and the potential W-v are equal, the latter can target precisely the 161.80% extension at $5390.
Thus, the price action is ticking off all the ED boxes. However, as always, the forecast is contingent on holding above the colored warning levels, with a 1st warning (blue) for the Bulls below yesterday’s high, a 2n warning below Tuesday’s low, and a break below the red warning level at $5055 will trigger a drop to $4600+/-100.
Our last update found that “the negative divergences between several technical indicators are blatantly obvious, but they are a condition, not a trigger, as “divergence is only divergence until it is not.” Price is the final arbiter, and as such, the Bears have yet to break it below the colored [warning] levels …, which we use to alert our premium members the odds are for a top are increasing with each subsequent break lower.” Three weeks later, the divergences are even more apparent. Still, the index’s price has yet to respond to it, showing that, indeed, price is the final arbiter as divergences are a condition, not a trigger.
Suppose our assessment of the ending diagonal’s price pattern is correct, as they are notoriously tricky due to their overlapping price action. In that case, a breakout above last week’s high can ideally target $5390. Ultimately, we still need to see a break below $5056 with a severe warning below $5100 to confirm a significant top has been struck.
Read Full Story »»»
DiscoverGold
Money managers Reduced their exposure to the US Equity markets since last week...
DiscoverGold
NAAIM Exposure Index
April 4, 2024
The NAAIM Number
84.24
Last Quarter Average
87.84
»»» Read More…
AI-generated Buy and Sell Daily Signals
By: Hedgeye | April 4, 2024
NEW SIGNALS TODAY:
• Sell: N/A
• Buy: XLE, CAD/USD
• Close Buy: N/A
• Close Sell: N/A

Read Full Story »»»
DiscoverGold
The AAII Investor Sentiment
By: AAII | April 4, 2024
Bullish 47.3%
Neutral 30.5%
Bearish 22.2%
• Historical 1-Year High
Bullish: 52.9%
Neutral: 39.5%
Bearish: 50.3%
Read Full Story »»»
DiscoverGold
AI-generated Buy and Sell Daily Signals
By: Hedgeye | April 3, 2024
NEW SIGNALS TODAY:
• Sell: N/A
• Buy: XLI, WTI Crude
• Close Buy: Japan
• Close Sell: SOYB, WEAT

Read Full Story »»»
DiscoverGold
$SPX The Plunge Protection Team is Stepping in $52.7 Million Calls
By: Cheddar Flow | April 2, 2024
• $SPX The Plunge Protection Team is Stepping in

Read Full Story »»»
DiscoverGold
Here comes the 1st Week of April
By: Marty Armstrong | April 2, 2024
We see this coming week as a key turning point in our war index and gold. Those who think the world rotates entirely based on the Federal Reserve are starting to question our model as it does not turn down until after May 7th insofar as there is any economic decline. Stocks and bonds have fallen as Fed-cut watchers begin to lose confidence. With the US manufacturing expanding in March for the first time since 2022, with production in a strong rebound and demand still rising as it should into May 7th, those counting on a rate cut are starting to question the analysis.
DiscoverGold
Markets Monthly Pattern »» Watchlist - Top 10
By: Marty Armstrong | April 2, 2024
• Dow Jones Industrials Index »» Possible Important High
• NASDAQ Composite Index »» New Pattern Forming
• NASDAQ 100 Index »» New Pattern Forming
• S&P 500 Index »» Turning BACK DOWN
• Russell 2000 Index »» Turning BACK DOWN
• US Dollar Index »» New Pattern Forming
• CBOE VIX Index »» Moving Higher
• NY Gold Futures »» Still Making New Record Highs
• NY Silver COMEX Futures »» New Pattern Forming
• NY Crude Oil Futures »» Moving Higher
DiscoverGold
|
Followers
|
178
|
Posters
|
|
|
Posts (Today)
|
0
|
Posts (Total)
|
67996
|
|
Created
|
06/10/03
|
Type
|
Free
|
| Moderators DiscoverGold | |||
:::::::::::: Welcome to S&P 500 & Nasdaq Analysis and Trends :::::::::::::
• The purpose of this board is to help others with Short & Long term S&P 500 & Nasdaq analysis and direction.
• This is strickly an educational board helping traders to learn market direction, swing and bottom trading.
• I ask that everyone respect opinions on the board whether you agree with them or not. We are all here to make money and avoid the
minimum loss we can.
Rules of the Board
Most of this board's WATCHERS are "lurkers" who appreciate info available without the need to sift through tons of "empty" posts.
1. Respect everyone opinions on trades.
2. No Pumping of Stocks.
3. No OTCBB or PINK STOCKS
*********************************************************************************************************
To help us evaluate our performance, please "BoardMark" the board if you find it useful.
To do so, just click on "Add to Favorites" Button at Right just above the Posts Dates.
 Presently, the Board has 178 Boardmarks, Thank you!
*Information Posted on this Board is not Meant to Suggest any Specific Action, But to Point Out the Technical Signs That Can Help Our Readers Make Their Own Specific Decisions. Your Due Deligence is a Must.
EXCHANGE TRADED FUNDS~ETFs COMPONENTS~RSI and I/V charts#msg-5495097 COMPONENTSFOR ^NDX / QQQQ ~ I/V charts #msg-9787995
Gold~ Silver~ HUI~ XAU~ US$~ €uro~ Crude #msg-29347660 (thanks,bob)
Cookies/Bandwidth/Security/Privacy #msg-9353921 PIEs/Cookies/Macromedia/Flash #msg-9412363 PerformanceTips for WinXP #msg-9854670
| Volume | |
| Day Range: | |
| Bid Price | |
| Ask Price | |
| Last Trade Time: |


