 News
News  Market Data
  Discover
Support: 888-992-3836
Copyright © 2023 InvestorsHub Inc.


Register for free to join our community of investors and share your ideas. You will also get access to streaming quotes, interactive charts, trades, portfolio, live options flow and more tools.
Upgrades/Downgrades
* Updated: March 03, 2016 07:40 a.m. ET

Equity ratings changes direct from brokerage firms.
http://online.wsj.com/mdc/public/page/2_3024-UpgradesDowngrades.html?mod=topnav_2_3022
• George.
Urban Carmel: Weekly Market Summary
* Friday, February 26, 2016
Summary: Equities gained nearly 2% for the second week in a row, led by small caps and further gains in oil. SPY has now rallied to 197, the lower end of the target range we set in early February. If this is just a countertrend rally within a bear market, then risk/reward is now marginal. Despite the steep gains in recent weeks, investor pessimism persists: it would be remarkable if the rally ended without even a hint of FOMO (fear of missing out). Breadth also suggests further upside in the weeks ahead. Meanwhile, recent macro data strongly refutes the notion that economic weakness is the root cause for the fall in equities.
* * *
Equities continued to rally for the second week in a row. For the week, SPY and NDX gained 1.7%. RUT led to the upside, gaining 2.7%, making the rally broad-based.
Safe havens - treasuries and gold - which had been in high demand during the sell off in equities, each lost about 0.5% for the second week in a row.
The correlation of equities with crude oil remained the strongest in more than 30 years. For the week, oil gained nearly 3%. A strong opening for equities on Friday was squashed by a 5% intraday drop in oil.

Among the many reasons to expect a bear market in equities, an imminent recession remains the weakest. In January, real personal consumption grew 2.9% yoy. Consumption continues to be healthy: today's revised 4Q15 GDP grew 1.9% yoy, with the consumption portion growing 2.6% yoy. The meme that GDP growth is being inflated by an inventory build is misleading: GDP net of inventories also grew 1.9% in 4Q15.

The positive, reinforcing cycle the economy appears to be in is:
Better employment and wages results in rising incomes;
Which fuels greater consumption;
Consumption leads to capacity constraints, resulting in investment increases that further grow employment, wages and income;
Which then fuels more consumption. And so on.

Normally this cycle moves upwards until debt levels become saturated and/or the Fed raises rates to a level that begins to curtail consumption. The household debt burden is currently near a 30 year low; previous cycles have ended when the debt burden moved to a high, tapping out consumers' ability to spend.

Non-financial corporate debt levels have recently risen (encouraged by low rates) but are nowhere near levels from the 1990s (from JPM).

Bank lending (to fund investment) has risen 8% in the past year (from Jim O'Sullivan).

The equity market most often follows the economic cycle. For now, the balance of evidence points to the cycle continuing to be on a positive (but sluggish) path. An excellent new paper on how macro most often trends with the equity market from Philosophical Economics is here.

Three weeks ago, our view was that the sell off in equities was not over. While equities should rally in the next month, there was, importantly, no tradable low (post).
Two weeks ago, our view was that equities had put in a tradable low (post).
One week ago, our view was that equities had followed through on that low, supported by very good breadth which most often leads to still higher prices (post).
If this was even just a rally within a bear market, our view was that equities should gain a minimum of 7-8%, targeting the 197-200 resistance area (post). This week, equities rallied to 197.
The point of tracking this chronology is that equities follow a narrative, and keeping track of where the market is relative to that narrative helps to frame the risk/reward in the week(s) ahead.
While macro suggests an imminent recession is unlikely, the longer term price pattern for equities remains bearish.
SPY is trading below its monthly 20-ma (blue line). In the past two bear markets, a rally that fails to close back above that 20-ma has led into a deep contraction. That makes 199-200 a critical watch out area for the current rally. If past is prologue, SPY should test that level in the next month: a close below will be bearish, a close above bullish.

A bullish tailwind for equities is positive seasonality. The March-May period has typically been good for equities, especially in the past 20 years. Note that this is the historical tendency, not a road map. December and January are also typically positive, but closed lower this year (from Bespoke).

The biggest wild card in the next several weeks will likely continue to be the price of oil. Positive seasonality, sentiment, breadth and other factors will make no difference if crude rolls over while the correlation to equities is this tight.
Crude has rallied back to its 50-dma. So far, the pattern looks constructive. Next, look for oil to consolidate near the 50-d (which then flattens/rises), push through the pivot (green line at $35) and stay overbought (top panel) as further signs that the trend may have changed for the better.

The price of other commodities is also improving. Copper traded at a 3-month high on Friday before closing lower. A close above today's high would appear to complete a base, something to watch for next week (from Peter Brandt).

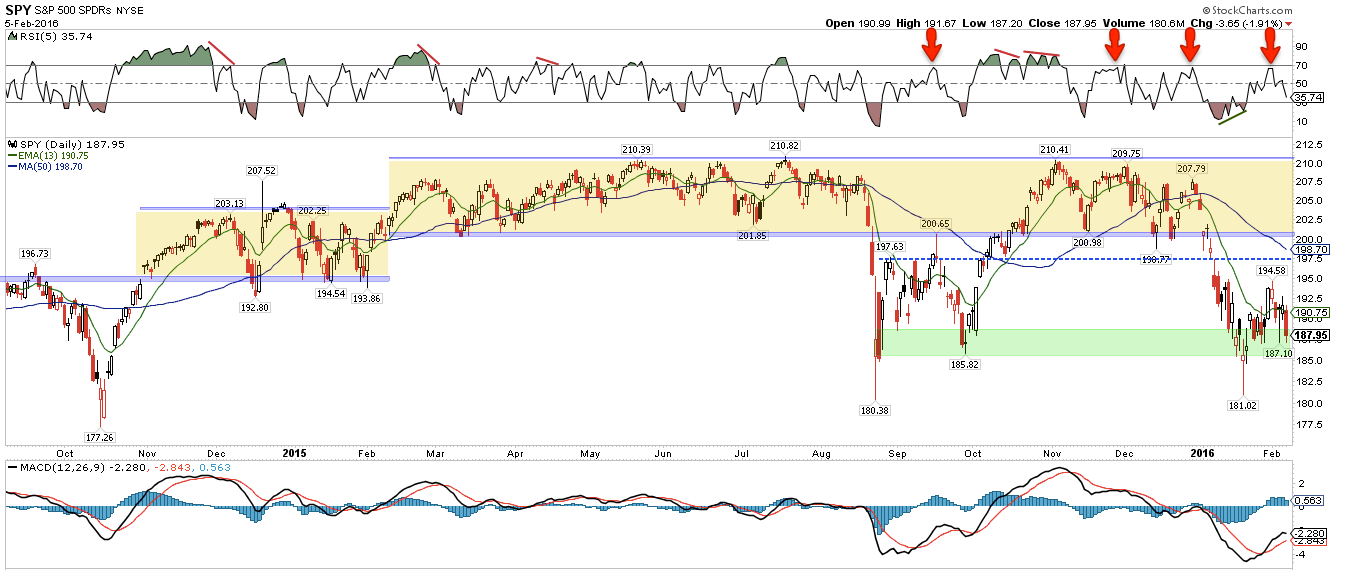
SPY moved above its rising 5-dma, 20-dma and 13-ema nine days ago. On Thursday, it closed above its 50-dma for the first time in 2016. The short to medium trend is improving.
If this rally has legs, RSI(5) should stay near 70 and not drop below 50; see October 2014 and October 2015 as examples (yellow shading in top panel). Note the small loss of momentum as this week progressed, a watch out for next week.

On a shorter timeframe (60 minute), SPY continues to stay overbought (top panel) and to hold above its rising 5-dma (green line). Friday's sell off came after SPY had been very overbought: this was not unusual. The low held above the 195 "breakout" level established over the past two months.

The cleanest set up would be if that the 195 area continued to hold. But, the upward trend will still be in place so long as the short-term moving averages are not breached: the 13-ema is currently at 192.5.
We think there is likely to be more upside, but the risk/reward has obviously declined. A bear market rally gains a minimum of 7-8% and Friday's high constituted a 7.5% gain. A move to 200 would be a further gain of 2.5% from Friday's close. So, there's the potential for more upside but the low end of our target has been reached and the lion's share of the move off the low may have taken place. When longer-term moving averages (50-dma and 200-dma) are declining, rallies are considered countertrend.
Aside from seasonality, two positives suggest further gains are possible.
First, recall from last week that strong breadth most often leads to gains over the next multi-week period (post). To wit, Monday was another major accumulation day (90% up volume), the third one since the January low in equities. Moreover, most sectors have rallied past their early February highs and have regained their 50-dma. This is a positive. The laggards are financials, energy and healthcare.

Second, extreme investor pessimism persists. There was another $2.8b outflow from equity funds this week. Equity fund flows have been negative 12 of the past 13 weeks, longer than any time during the 2007-09 bear market. Meanwhile, investors have added to the safe haven of bonds, with a further $5.1b inflow this week. Those flows have been positive 11 weeks in a row.
These flows suggest that there is very little fear of missing out (FOMO) in this rally. We would expect some improvement in investor sentiment before this rally ends. The bear market rally in March-May 2008 included several positive weeks of equity inflows, including one that was more than $20b in one week. Until there is some sign of FOMO, further upside seems likely (from Lipper and Sentimentrader).

Two investor concerns appear to be misplaced.
The first is that trading volumes are unusually low. They aren't. Equities typically sell off in a panic on high volume and then rise on lower volume as investors slowly get back in; hence the mantra "equities take the elevator down and the stairs back up." This week's volume averaged 120m shares/day in SPY, more than most weeks in 2013 and 2014. About 100m shares/day is normal; volume under 80m shares/day is anemic.

The second concern is that equities have become more volatile, and that this is indicative of instability that will inevitably lead to a collapse. A study by Morgan Housel (here) instead shows that daily, weekly, monthly and annual volatility over the past 6 years is in line with historical norms. Weekly volatility is actually at a 4 decade low.

Volatility has increased in 2016 (as measured by the width of the 2 standard deviation Bollinger Bands for SPX), but it was higher during most of 2010-12 as well as during most of 1995-2000. Recent volatility probably seems extreme as it follows the relative (and unusual calm) during 2014-15.

On the economic calendar, monthly employment data will be released on Friday.
In summary, equities gained nearly 2% for the second week in a row. SPY has now rallied to 197, the lower end of the target range we set in early February. If this is just a countertrend rally within a bear market, then risk/reward is now marginal. Despite the steep gains in recent weeks, investor pessimism persists: it would be remarkable if the rally ended without even a hint of FOMO. Meanwhile, recent macro data strongly refutes the notion that economic weakness is the root cause for the fall in equities.
http://fat-pitch.blogspot.com/2016/02/weekly-market-summary_26.html
• George.
Click on "In reply to", for Authors past commentaries.
Stocks With the Largest Short Interest
* Friday, February 26, 2016
> nyse
http://bigcharts.marketwatch.com/reports/bigmovers.asp?data=1&start=1&report=10&report_country_code=US&date=20160226
• George.
Click on "In reply to", to see reports from prior weeks.
ETF Performance Screens
* February 28, 2016
>> Best Performing ETFs Today
http://www.dogsofthedow.com/best-performing-etfs-today.htm
>> Best Performing ETFs: 12 Months
http://www.dogsofthedow.com/best-performing-etfs-12-months.htm
>> Highest Dividend Paying ETFs Today
http://www.dogsofthedow.com/highest-dividend-paying-etfs.htm
• George.
ETFs Sector Performance Today
* February 28, 2016
>> Best Performing Technolgy ETFs Today
http://www.dogsofthedow.com/best-performing-technology-etfs-today.htm
>> Best Performing Healthcare ETFs Today
http://www.dogsofthedow.com/best-performing-healthcare-etfs-today.htm
>> Best Performing Energy ETFs Today
http://www.dogsofthedow.com/best-performing-energy-etfs-today.htm
>> Best Performing Financial ETFs Today
http://www.dogsofthedow.com/best-performing-financial-etfs-today.htm
>> Best Performing Real Estate ETFs Today
http://www.dogsofthedow.com/best-performing-real-estate-etfs-today.htm
>> Best Performing Commodity ETFs Today
http://www.dogsofthedow.com/best-performing-commodity-etfs-today.htm
• George.
ETF Screener
* Friday, February 26, 2016
![]()
Select from:
» Gold ETFs
» Oil ETFs
» REIT ETFs
» Inverse (Short) ETFs
» Double 2X ETFs
» Triple 3X ETFs
» International ETFs
» SPDR ETFs
» PowerShares
» iShares
http://www.barchart.com/etf/screener.php?menus=2-0;&filters=textinput-profile.name-contains-gold;&types=7
• George.
US Equity ETFs Move Above 50-DMAs
* February 26, 2016
https://www.bespokepremium.com/think-big-blog/us-equity-etfs-move-above-50-dmas/
• George.
Upgrades/Downgrades
* Updated: February 25, 2016 07:11 a.m. ET
Equity ratings changes direct from brokerage firms.
http://online.wsj.com/mdc/public/page/2_3024-UpgradesDowngrades.html?mod=topnav_2_3022
• George.
Trading Notes: Wednesday, February 24th
By Brett Steenbarger, Ph.D.
* February 24, 2016
* Yesterday saw a significant pullback in stocks--a trend day to the downside--with weakness continuing in overnight trade. The fall in oil prices, with hopes of production cuts dimming, continues to weigh on stocks as part of a general deflationary theme, with notably weak equity performance coming out of Europe. I continue to track these macro themes closely.
* Many of my cycle measures are maturing. Should forward market strength prove unable to decisively break above the 1940s area resistance for ES, I would look for a fresh leg down in stocks. The current market action, with the larger than normal drop yesterday and early today, reminds me of the cycle that occurred early in 2008, when a January low led to a choppy, but ultimately weak, cycle higher prior to the significant drops later in that year.
* Here's how we stand on one of my favorite measures, an intermediate-term gauge of new highs versus lows specific to the SPX stocks. Despite yesterday's weakness, we're closer to overbought status than oversold.

http://traderfeed.blogspot.com/2016/02/trading-notes-for-week-of-february-22.html
• George.
Click on "In reply to", for Authors past commentaries.
Avoiding Confirmation Bias With Market Money Flow And Breadth
By Brett Steenbarger, Ph.D.
* February 21, 2016

Confirmation bias is the tendency to seek information that fits our preexisting views. The opposite of confirmation bias is open mindedness and the commitment to seek information that counters one's perspectives.
At market highs and lows, there is no lack of information to confirm bullish and bearish biases. At the highs, the economy looks strong, profits are solid, and sentiment is favorable. At the lows, fears abound; talk of recession and crisis dominates.
It's when actual market behavior deviates from these biases that we find opportunity.
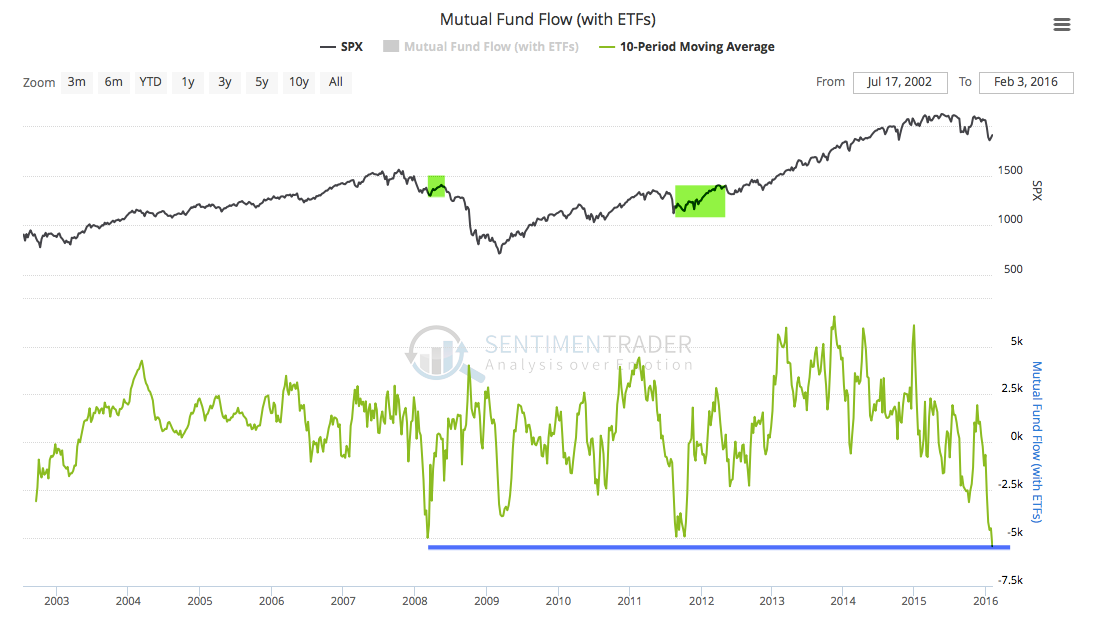
Above is a chart of money flow for the SPY ETF, which is a function of the daily closing price and the number of SPY shares outstanding. When traders are bullish, their demand creates new ETF shares; when bearish, we see a contraction in shares outstanding as shares are redeemed.
Note how money flow peaked in late 2014 and moved steadily lower during 2015 before the market declines late that year and early this year. Bearish money flows, along with breadth declines, were among the factors leading me to fade strength during this period.
Now, however, we're seeing the opposite phenomenon. With the 2016 market declines, SPY money flow is actually holding above its August, 2015 levels. Moreover, at the February lows for SPY, we've seen fewer stocks register new lows relative to January. Specifically, we had 1226 new three-month lows across all exchanges on February 11th, compared with 2663 lows on January 20th. The February lows saw 19.36% of SPX shares trading above their 200-day moving averages, compared with 17.76% at the January lows. Among SPX shares, we had 101 more 100-day new lows than new highs at the February lows, compared with 151 more lows than highs in January.
Bearishness has abounded, with concerns over high yield credit, oil prices, European banks, weak China and EM, and questions over the effectiveness of the monetary policies of central banks. Despite these factors, it is difficult to find evidence of recent weakening in the U.S. stock market. That leaves me open minded to the possibility that we've put in an intermediate-term low in stocks, even as I also share concerns over the global macro picture.
http://traderfeed.blogspot.com/2016/02/avoiding-confirmation-bias-with-market.html
• George.
Click on "In reply to", for Authors past commentaries.
Martin Armstrong: SPY Analysis for the Week of February 22, 2016
* February 20, 2016
SPDR S&P 500 Trust closing today of 192 so far is trading down about 5.822% for the year from last year's closing of 203.87. This market remains trading below last year's closing and thus is in negative territory for the year. We are trading below last month's close so currently this is still neutral to weak. This market has been in a bearish consolidation phase for the past 6 months. Some caution is necessary since the last high 212.08 was important given we did obtain a sell signal from that event established during July 2015. Analytically, my long-term view prospective in SPDR S&P 500 Trust remains in a bearish trend since we have penetrated last year's low of 180.38. This market has declined for the past 1 years since establishing its intraday high back in 2015.
Historically, this market experienced a Phase Transition from the low of 1993 to the high of 2015 which amounted to about a 600% advance. Clearly, this market remains in a bullish position on the yearly level by closing above 31.82 on an annual basis. Support now lies at 114.12. So far, this market has remained in a bearish tone since the 212.08 major high established back in 2015.
Viewing the immediate trend is turning bullish since this market has exceeded the week of February 8th's high. This is warning to focus on this trend since last month had closed lower so the upward momentum is weak on a monthly level.
On our Pattern Recognition Model, we see current projections on each time level as follows: Beginning with the yearly level, I see the pattern projection currently on a dynamic basis so far this year is pushing higher. Viewing the quarterly level, I see that here the pattern status is turning up. Considering the pattern model for the monthly level, here I can see our pattern position remains suggesting that this is a Reaction High. Turning now to the weekly level, the pattern status currently is caution pressing lower. Regarding the daily level, I can see our pattern posture remains reaction low. At this moment, this market is in a downward trend on all our indicators looking at the weekly level. Regarding the direction of this trend, we have been moving down for the past 2 weeks. The last high on the weekly level was 194.58 created during the week of February 1st. The last weekly level low was 181.02 formed during the week of January 18th. Taking a broader view, this market is in a downward trend on all our indicators looking at the monthly level. Looking at the direction of this trend, we have been moving down for the past 2 months. The last high on the monthly level was 210.41 created during November 2015. The last monthly level low was 181.02 formed during January.
• George.
Click on "In reply to", for Authors past commentaries.
ETFs Sector Performance Today
* February 20, 2016
>> Best Performing Technolgy ETFs Today
http://www.dogsofthedow.com/best-performing-technology-etfs-today.htm
>> Best Performing Healthcare ETFs Today
http://www.dogsofthedow.com/best-performing-healthcare-etfs-today.htm
>> Best Performing Energy ETFs Today
http://www.dogsofthedow.com/best-performing-energy-etfs-today.htm
>> Best Performing Financial ETFs Today
http://www.dogsofthedow.com/best-performing-financial-etfs-today.htm
>> Best Performing Real Estate ETFs Today
http://www.dogsofthedow.com/best-performing-real-estate-etfs-today.htm
>> Best Performing Commodity ETFs Today
http://www.dogsofthedow.com/best-performing-commodity-etfs-today.htm
• George.
ETF Tools
* Friday, February 19, 2016 
 New Highs / Lows - List of ETFs making new highs and lows
 Volatility - Chart the rolling realized volatility of up to five ETFs
 Correlation - See how the relationship between two ETFs has varied over time.
 Dividend Yield - Compare the dividend yield of two ETFs
 Total Return vs Price Return - See the impact of dividend reinvestment - chart the difference between price return and total return
http://www.etfreplay.com/tools.aspx
• George.
Upgrades/Downgrades
* Updated: February 19, 2016 07:56 a.m. ET
Equity ratings changes direct from brokerage firms.
http://online.wsj.com/mdc/public/page/2_3024-UpgradesDowngrades.html?mod=topnav_2_3022
• George.
Trading Notes: Tuesday, February 16th
By Brett Steenbarger, Ph.D.
* February 16, 2016
* In a new article, I expand on the idea of time mapping and offer a heatmap-inspired example. This is a technique that is particularly useful in creating the motivation and momentum to make changes in any area of life, personal or professional. There are many techniques out there in the self-help literature to help people change; not so many methods to help people find the drive to sustain change.
* We've seen some consolidation in overnight trading after a sizable rally. Note that Friday closed with only 35% of SPX stocks trading above their 10-day moving averages. Even if the current rally ends up being a bounce in a broader bear market, I expect some upside follow through as we work off the oversold condition from a very weak start to the year.
* I continue to find overbought/oversold measures utilizing event bars to be useful in finding good trade location and identifying short-term market cycles. Below is a simple rate-of-change measure using event bars, where each bar represents 500 price changes in the ES futures. Other event charts that I maintain draw the bars on the basis of number of trades and on the basis of volume transacted. My most recent trend-following system makes use of event bars and has done quite well identifying intraday swings. As of this writing, that system enters SELL mode below 1881 in the March contract. The buy and sell parameters change with each new bar and adjust in real time for market volatility.

http://traderfeed.blogspot.com/2016/02/trading-notes-for-week-of-february-15.html
• George.
Click on "In reply to", for Authors past commentaries.
Trading Notes: Monday, February 15th
By Brett Steenbarger, Ph.D.
* February 15, 2016
* We tested the January lows this past week, but--as noted in previous postings--breadth divergences were striking. Specifically, we registered 1226 fresh three-month lows across all exchanges on Thursday and 1353 new lows on Monday. At the January bottom, we saw 2663 stocks make fresh three-month lows. Since that test, we've moved smartly higher on Friday and then again in overnight trading. My short-term trend model is solidly in buy mode and has been since Friday morning.
* An ongoing research project has been assessing market cycles by tracking the performance of all NYSE stocks across a variety of technical indicators. (Raw data from stockcharts.com). The measure below takes a volatility-weighted composite of buy versus sell signals for two technical systems: Bollinger Bands and Parabolic SAR. Note that we closed Friday at levels close to those seen at intermediate-term bottoms and have quite a way to go before we see overbought levels.

* Here is yet another cycle based measure derived from breadth data (Raw data from indexindicators.com). Note that it is in oversold territory, but not at levels seen at most intermediate-term lows and well off overbought levels. If indeed we have seen a successful retest of January lows, I would expect market firmness to take these cycle measures higher.

* I would identify the greatest improvement to my trading as coming from focusing away from trends and directional movement and instead thinking of cycles and the transitions from trending to mean-reverting behavior and back again. A cycle includes phases of upward and downward trending, as well as range behavior near highs and lows. Identifying these transitions--and not getting caught up in any one phase of market behavior--is very helpful to short-term trading.
http://traderfeed.blogspot.com/2016/02/trading-notes-for-week-of-february-15.html
• George.
Click on "In reply to", for Authors past commentaries.
Amateur Investors: Outlook for Wednesday
* February 13, 2016
A chart of the S&P 500 shows that it tested it's longer term upward trend line from the 2009 low this week just above the 1800 level.

Meanwhile the S&P 500 bottomed on Thursday as it completed a 5 Wave pattern to the downside which was followed by a decent oversold bounce on Friday. Typically after you see a 5 Wave pattern complete it will then retrace on average from 50% to 61.8% to the upside as an oversold rally occurs. In this case that would give us a target range from 1964 to 2000.

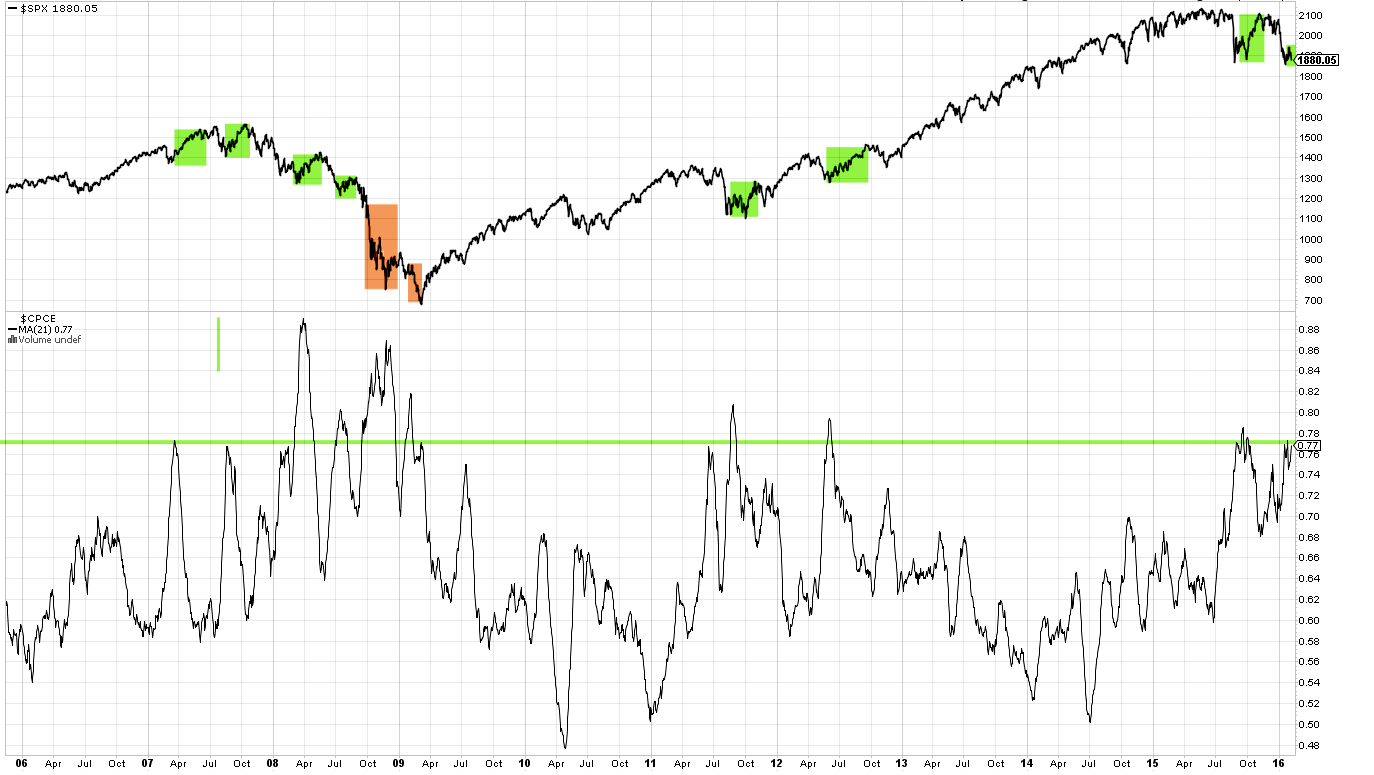
However I continue to be concerned with the lack of investor panic as the market has been falling. Once again the 5 Day Average of the Put to Call Ratio never rose above the 1.25 level like we have seen with other corrections since 2009 (points A). This suggests to me that after the oversold bounce ends that the market will eventually head lower again.

http://www.amateur-investors.com/AII_Weekend_AnalysisFeb_13_16.htm
• George.
Click on "In reply to", for Authors past commentaries.
Urban Carmel: Weekly Market Summary
* Saturday, February 13, 2016
Summary: The move into the perceived safe havens of treasuries and gold in 2016 appears to have reached a point of short-term exhaustion. That trend might resume, but odds suggest a pause is ahead. If optimism reached a peak in safe havens, pessimism likely reached a trough for equities. None of this will matter if oil and equities continue to be highly correlated and oil is unable to stop falling. A strong 2-day rally still left oil lower than it was on Tuesday. Unlike last week, equities now have a bottom to trade against.
* * *
SPY had dropped nearly 4% during the week by mid-day on Thursday; it then staged a 3% rip into Friday's close. For the week, SPY ended lower by 0.8%. NDX lost just 0.1%. The big winners were gold and treasuries, gaining 5% and 2%, respectively.
As in recent weeks, equity activity was driven by volatility in oil. At its low on Thursday, oil had lost more than 14% on the week. The subsequent rally in stocks was accompanied by a 10% gain in oil. It's repetitive, but the correlation between oil and equities continues to be very tight, and represents a significant wild card for the days and weeks ahead. Simply put, any bet on a further gain (or loss) in equities seems to be largely a bet on the direction of oil.

Lower oil prices are also driving high-yield spreads higher, as a small portion (about 15%) of high yield is exposed to the sector.

In turn, the drive upwards in high-yield spreads is fueling concern that the US and the global economy are tumbling into a recession. After all, prior spikes in 2002 and 2008 coincided with recessions.

Likewise, the continued collapse in the Baltic Dry Index (BDI, which tracks shipping rates) has been linked to worsening global trade.

But neither of these indicators are supported by other facts. Start with BDI, which has fallen primarily due to the 30% overcapacity in the shipping industry. Cargo volumes have been growing, adding 2.3% in 2015. BDI is a terrible economic measure, confusing price with volume and excess supply with growing demand.
![]()
Eurozone growth may not be strong, but it is positive. 2015 GDP for the region grew 1.5%, which is nearly equal to its average over the past 20 years (1.6%). To be sure, growth is sluggish, but it is not recessionary.

Likewise, US economic growth remains firmly non-recessionary. 1Q16 is tracking 2.7% growth. This is ahead of the consensus and would represent an improvement over 4Q's 1.8% growth (data from the Atlanta Fed).

US growth is being driven by rising employment and wages. The jobs market is sufficiently robust that workers are voluntarily quitting their old jobs for better ones at the highest rate in 8 years. In a recession, that trend would be down (red arrows), not up (data from Bloomberg).

Retail sales in January expanded by 3.4% yoy. It's at a new all-time high. Excluding the effects of lower gasoline prices, retail sales is 4.3% higher than a year ago. This is decent growth, as you'd expect when more people are working and earning higher wages.
It's also key to driving growth higher in the months ahead. Higher consumption fuels private investment which in turns leads to better employment and wages and thus better consumption. This is the positive reinforcing cycle the US economy appears to be in at present.
Which brings us back to equities, treasuries and gold.
Money has been flowing out of equity funds (including ETFs) 10 of the past 11 weeks, a period which roughly corresponds to the equity high point in December. That money has been moving primarily into the safety of treasuries, with positive flows 9 weeks in a row. Remarkably, the total return from SPY and TLT is now equivalent over the past 6 years (to January 2010).

For context, this is the first time since the week of March 10, 2009 that equity outflows have been negative 10 out of 11 weeks.
The drive higher in treasury prices (lowering yields) in 2016 has been remarkable. We've commented on the exceptional fund flows in prior posts (here and lower panel below; data from Lipper and Sentimentrader).

The reversal in oil and equities this Thursday is clearly reflected in 10-year futures: a high wick candle (arrow) followed by Friday's fall that eclipsed the prior 3 days' gains. After a near parabolic rise, that looks trend ending, at least short-term.

Similarly, gold funds have recently seen their second largest fund inflows in the past 6 years. By Thursday, gold futures had gained 20% YTD. Volume on Thursday was 700% of normal and the highest in 3 years. Spikes in volume (lower panel and vertical lines) have frequently coincided with at least a short-term change in trend for gold, both up and down.

Optimism in gold is now the highest since the equity bottom in early 2009 (lower panel). Excessive optimism has also most often coincided with at least a short-term change in trend (one exception shown with orange line; data from NDR).

In other words, the move into the perceived safe havens of both treasuries and gold in 2016 appears to have reached a point of exhaustion. That trend might resume, but odds suggest a pause is ahead. If so, this favors equities.
If optimism reached a peak in safe havens this week, pessimism likely reached a trough for equities. The oldest gauge of investor sentiment, the Investors Intelligence bull/bear ratio, dropped to a 7-year low this week. By this measure, equity investors haven't been this worried since the depths of the 2008 meltdown. Prior lows have corresponded with the ends of bear markets (1987, 2003, 2009) and the ends of recessions (1990).
It's also fair to say that lows like this have come in the middle of bear markets (e.g., March, July and October 2008). But in each of those cases, SPY rallied 12%, 9% and 20%, respectively. The rally from a similar low in sentiment last October was 12% (data from Yardeni).

The wild card, for now at least, is oil. None of the above will matter if oil and equities continue to be highly correlated and oil is unable to stop falling. The strong 2-day rally still left oil lower than it was on Tuesday.
On a short time scale, there is a nice bottoming pattern in oil. Friday's close was right at the first level of resistance, formed by last week's low and trading early this week. Holding above $27 is the near term challenge; Above $29.5 and the next upside is near $33.

Longer term, oil is still 15% below its 50-dma (blue line) that has marked first strong resistance on good rallies (arrows). Getting above the prior pivot high (green line), also 15% higher, would mark a potential change in trend. In the most optimistic scenario, there will likely be a basing period, during which a trading range develops and the 50-dma flattens, before a sustained rise in oil takes place. If this is the low in oil, it's still early in the process. More on how oil bottoms here.

The longer term trend for SPY remains bearish. SPY made a lower high in November relative to last summer and the 20-wma (blue line) is trending down; in comparison, note how the 20-wma mostly held lows during the uptrend in 2012-15. Momentum (top panel) is oversold; strong markets stay overbought but the index hasn't been overbought since early November.

To recover trend, SPY needs to first regain and hold above the 20-wma at 199, just as it did in late 2011 (left side of the chart above). Longer term, if SPY regains 210, there's a potential 'W' bottoming pattern. On a positive note, the lows from August/September/January held once again this week (green line). That support will most likely fail if retested again any time soon.
SPY is still downtrending on a shorter time scale as well: "lower highs" and "lower lows" so far in February. What to look for in the coming week:
(1) hold above the 5-dma (green line) as it did in November (green arrows);
(2) make a "higher high" above 188 (in the yellow shaded area);
(3) stay overbought, something SPY has been unable to do for much of 2016 (blue arrows in the upper panel). Friday was a good start, but follow through early next week is essential.

In the chart above, 181 support held (blue line), a key point of reference for the weeks ahead. The next support below is near 178 from October 2014.
There's an even better bottom to trade against in NDX: the low was made on Monday and then retested twice more during the week. That makes 3900 critical support. 4100 is likely to be significant resistance. There is a long way to go before NDX makes a "higher high" above 4300.

With the exception of utilities (and perhaps staples), every SPX sector is trending downward. It's notable, however, that while the indices retested (or broke) their January lows, 6 sectors did not, making "higher lows" instead (green lines). So the sell-off was selective. Moreover, 3 of the 4 sectors that fell to (or below) their January low spent the week making a base (yellow shading). Like NDX, this now presents a clear point of failure in the weeks ahead.

The weakest sector is financials (circle). Investors had bet that longer term rates would increase after the Fed raised the FFR in December; instead, yields have fallen, and so banks have been sold off hard. If treasury yields reverse upwards, financials may well lead higher. The next sell off in financials needs to hold above this week's low; right now, that low is untested.
One possible concern is that selling pressure this week was strong, and that level of persistence in selling normally doesn't abruptly end. SPX fell 5 days in a row through Thursday. Since 2011, that has happened 14 other times; 12 of these (86%) made a lower low than day 5 during the next month. The two exceptions were late December 2012 and late September 2015 (arrows). Certainly the latter case bears a resemblance to today (more than 10% fall and very negative sentiment), but the trend was positive then versus negative now (data from Index Indicators).

The Vix spiked higher this week, and then started to roll over. Has it reached a near term peak? The pattern suggests that it has: note in the chart below similar spikes to the upper Bollinger with RSI (top panel) becoming overbought. Vix and SPY move opposite each other about 80% of the time, so a move lower in Vix supports a higher SPY. Look for Vix to become oversold.

Note in the chart above that Vix has been trending higher since last summer. Is that unusual?
Probably not. Volatility has increased this year. 1% days, both up and down, have become common. That's actually less surprising than it might seem. As bull markets age, they naturally become more volatile. This year also follows the first hike in interest rates since 2006, and that has also led to an increase in volatility (data below from Sam Stovall).

The upcoming week is Options Expiration. Markets are closed on Monday. New home sales and Industrial Production data is released on Wednesday and CPI on Friday.
In summary: the move into the perceived safe havens of treasuries and gold in 2016 appears to have reached a point of short-term exhaustion. That trend might resume, but odds suggest a pause is ahead. If optimism reached a peak in safe havens, pessimism likely reached a trough for equities. None of this will matter if oil and equities continue to be highly correlated and oil is unable to stop falling. A strong 2-day rally still left oil lower than it was on Tuesday. Unlike last week, equities now have a bottom to trade against.
http://fat-pitch.blogspot.com/2016/02/weekly-market-summary_13.html?spref=tw
• George.
Click on "In reply to", for Authors past commentaries.
ETF Performance Screens
* February 13, 2016
>> Best Performing ETFs Today
http://www.dogsofthedow.com/best-performing-etfs-today.htm
>> Best Performing ETFs: 12 Months
http://www.dogsofthedow.com/best-performing-etfs-12-months.htm
>> Highest Dividend Paying ETFs Today
http://www.dogsofthedow.com/highest-dividend-paying-etfs.htm
• George.
ETFs Sector Performance Today
* February 13, 2016
>> Best Performing Technolgy ETFs Today
http://www.dogsofthedow.com/best-performing-technology-etfs-today.htm
>> Best Performing Healthcare ETFs Today
http://www.dogsofthedow.com/best-performing-healthcare-etfs-today.htm
>> Best Performing Energy ETFs Today
http://www.dogsofthedow.com/best-performing-energy-etfs-today.htm
>> Best Performing Financial ETFs Today
http://www.dogsofthedow.com/best-performing-financial-etfs-today.htm
>> Best Performing Real Estate ETFs Today
http://www.dogsofthedow.com/best-performing-real-estate-etfs-today.htm
>> Best Performing Commodity ETFs Today
http://www.dogsofthedow.com/best-performing-commodity-etfs-today.htm
• George.
Peek Into Future Through Futures
* February 13, 2016
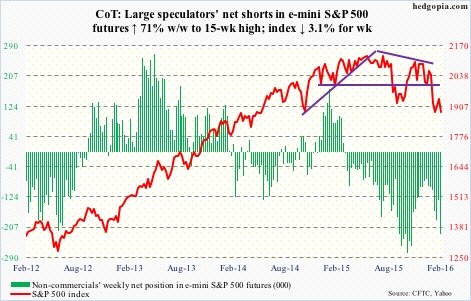
The following are futures positions of non-commercials as of February 9, 2016. Change is week-over-week.
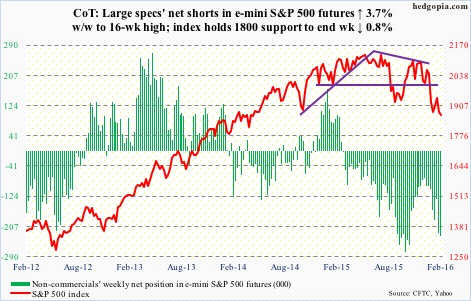
E-mini S&P 500: In the week ended Wednesday, another $1.5 billion left U.S.-based equity funds (courtesy of Lipper). One has to go back to the week ended December 30th to see inflows (to the tune of $10 billion). Since then, there have been six straight weeks of outflows, totaling a whopping $35.4 billion.
That said, during the week ended Thursday, SPY, the SPDR S&P 500 ETF, did attract a decent amount – $5.9 billion, to be exact (courtesy of ETF.com). This was before Friday’s 2.1 percent rally.
Flows need to cooperate for this rally to have legs. Obviously, 1880 is huge. Not only does this resistance go back to March 2014, but is also a confluence of 10- and 20-day moving averages.
Currently net short 234.3k, up 8.4k.
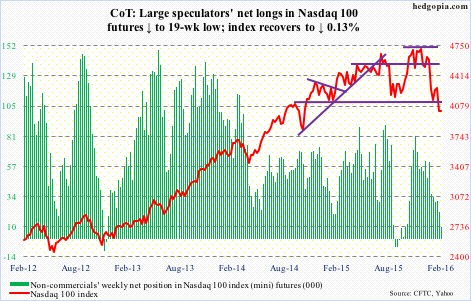
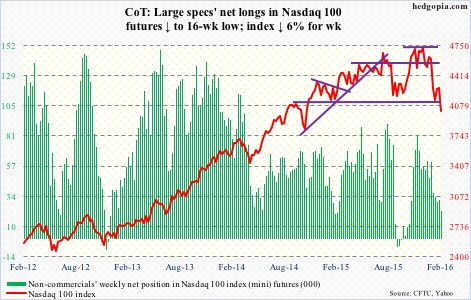
Nasdaq 100 index (mini): Down as much as 3.4 percent on Monday’s intra-day lows, the Nasdaq 100 had an impressive end to the week – only down 0.13 percent. Has tons of room to rally from here – if nothing else just to unwind oversold conditions, both daily and weekly.
The nearest resistance lies at just under 4100, and the line can be drawn as far back as September 2014. Shorter-term averages lie around there as well, and they are still dropping. More consolidation is needed so they begin to hook up.
In the week ended Thursday, $665 million came out of QQQ, the PowerShares Nasdaq 100 ETF (courtesy of ETF.com).
Non-commercials continue to reduce net longs – now sub-10k. Holdings are at a 19-week low.
Currently net long 9.6k, down 12.1k.
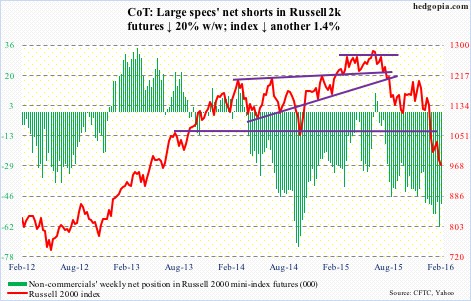
Russell 2000 mini-index: In the week ended Wednesday, $492 million moved into IWM, the iShares Russell 2000 ETF (courtesy of ETF.com).
This was before Thursday’s action when the January 20th low was breached before staging a mini-reversal. A rally is possible near-term, but needs to first take out 985 and then 1000.
Non-commercials reduced net shorts by 20 percent.
Currently net short 49.5k, down 12.4k.
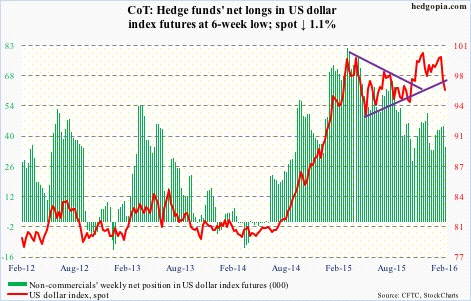
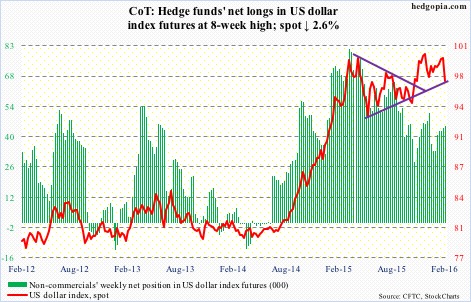
US Dollar Index: On a daily chart, the index is grossly oversold, and the action on both Thursday and Friday suggest a reprieve is in order at least near-term.
That said, the nearest resistance lies at just under 97, which also approximates the 200-day moving average (96.88).
Non-commercials continue not to show enthusiasm for the dollar index. Net longs dropped 22 percent w/w.
Currently net long 35k, down 9.9k.
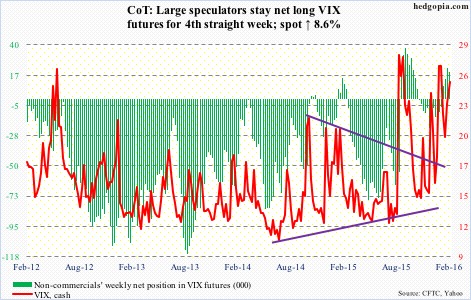
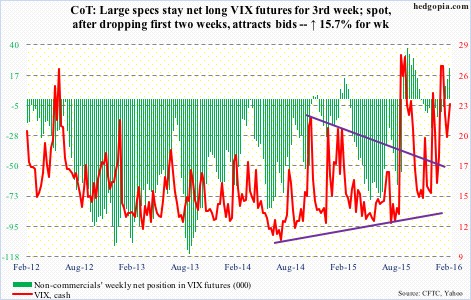
VIX: Spot VIX likely flashed a spike-reversal signal on Thursday, surging to 30.90 intra-day just outside the upper Bollinger Band. Friday, it closed at 25.40. There is plenty of room near-term for it to continue lower.
Intermediate-term, however, the 50-day moving average is now rising, as is its 200-day cousin, so they should provide support.
Incidentally, using intra-day highs on Thursday, the VIX-to-VXV ratio spiked to 1.05. This was followed by an intra-day reading of a 1.11 in the prior week. These are high readings, and once they begin to come under pressure, stocks tend to do well.
Currently net long 19.7k, down 2.8k.
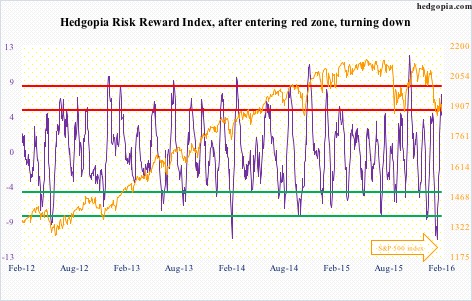
Hedgopia Risk Reward Index
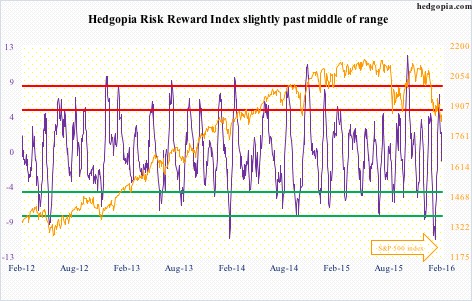
http://www.hedgopia.com/cot-peek-into-future-through-futures-30/
• George.
Click on "In reply to", for Authors past commentaries.
ETF Screener
* Friday, February 12, 2016
![]()
Select from:
» Gold ETFs
» Oil ETFs
» REIT ETFs
» Inverse (Short) ETFs
» Double 2X ETFs
» Triple 3X ETFs
» International ETFs
» SPDR ETFs
» PowerShares
» iShares
http://www.barchart.com/etf/screener.php?menus=2-0;&filters=textinput-profile.name-contains-gold;&types=7
• George.
$SPX Point & Figure chart
* February 12, 2016
• George.
Earnings Next Week 2/15 – 2/19
* February 12, 2016

http://www.cboeoptionshub.com/2016/02/11/earnings-week-of-215-219/
• George.
Upgrades/Downgrades
* Updated: February 12, 2016 07:19 a.m. ET
Equity ratings changes direct from brokerage firms.
http://online.wsj.com/mdc/public/page/2_3024-UpgradesDowngrades.html?mod=topnav_2_3022
• George.
Trading Notes: Wednesday, February 10th
By Brett Steenbarger, Ph.D.
* February 10, 2016
* It is actually relatively easy to change our behavior; relatively difficult to sustain those changes. Here's what we can do about that.
* We've seen several efforts for U.S. stocks to make new lows, only to bounce higher. That was notable yesterday, as stocks held their lows even in the face of the oil selloff. We're seeing fresh buying during London hours before today's U.S. open and I'm looking to buy dips that hold above the London lows.
* Breadth numbers during the recent weakness have also held up relatively well. On January 20th, we had 2663 stocks across all exchanges make fresh three-month lows. On Monday, that number was 1353 and yesterday it was 1086. Interestingly, while banking shares have been relatively weak, the commodity-related energy and raw materials shares (XLE, XLB) have held up relatively well.
* In some ways, this market decline reminds me of the May, 2010 episode that followed the flash crash. Stocks didn't make a price bottom until August, but there were plenty of bounces and breadth divergences along the way. Selling weakness and buying strength did not work in that environment.
* I've developed a short-term trading system using a trend-following method with event-based bars. Still early days, but it's looking promising. The system went long ES overnight at 1851.75; it exits at a closing bar below1844.50. The buy and sell points move with the market and naturally adjust to the market's volatility. I will be testing out and updating via the blog.
http://traderfeed.blogspot.com/2016/02/trading-notes-for-week-of-february-8.html
• George.
Click on "In reply to", for Authors past commentaries.
Upgrades/Downgrades
* Updated: February 10, 2016 07:44 a.m. ET
Equity ratings changes direct from brokerage firms.
http://online.wsj.com/mdc/public/page/2_3024-UpgradesDowngrades.html?mod=topnav_2_3022
• George.
Amateur Investors: Outlook for Wednesday
* February 9, 2016
Still waiting to see if a final 5th Wave down occurs. The structure is more defined in the Russell 2000.

An intra day chart of the S&P 500 suggests the bounce since yesterday may be sub wave "iv" of 5. If that's the case then we are missing "v" of 5 with a target around 1800 give or take a few points.

http://www.amateur-investors.com/AII_Daily_Report_Feb_9_2016.htm
• George.
Click on "In reply to", for Authors past commentaries.
Jeffrey Saut: The call for this week
* February 8, 2016
Last week a couple of new boogiemen arrived on the scene when Deutsche Bank shares (DB/$16.89) fell below their 2008 lows, fostering fears of a banking implosion; and Venezuela, as the Financial Times wrote, “It Could Be Too Late to Avoid Catastrophe in Venezuela.” Whatever the reason, something still feels “out of balance in the universe,” a phrase we have been repeating for many weeks. That said, we have now had one 90% Downside Day (2-2-16) and two 90% Upside Days (January 26 and 29 when 90% of total volume traded came in on the upside) reinforcing our belief that the selling stampede ended at session 21 on 1-28-16 with a “print low” for the SPX at about 1872. That intraday low has been tested twice since then. First on February 3rd and again last Friday. So far the 1872 level has contained the declines. If that level “falls,” however, it would suggest a full downside retest of the January lows between 1810 and 1820. Also if that happens, it would extend the “selling stampede,” making today session 28. As often stated, “A few stampedes have lasted 25 – 30 sessions, but it is very rare to see one go for more than 30 days.” And this morning the stampede continues, despite the Broncos’ win, as crude oil slides (-2.5%), North Korea launches ICBMs, China’s FX reserves fall to 2012 levels, Russian firepower helps Syrian forces edge toward Turkey boarder, and the U.K. considers leaving the EU; What a Wonderful World (
Upgrades/Downgrades
* Updated: February 08, 2016 06:58 a.m. ET
Equity ratings changes direct from brokerage firms.
http://online.wsj.com/mdc/public/page/2_3024-UpgradesDowngrades.html?mod=topnav_2_3062
• George.
Stocks With the Largest Short Interest
* Friday, February 5, 2016
> nyse
http://bigcharts.marketwatch.com/reports/bigmovers.asp?data=1&start=1&report=10&report_country_code=US&date=20160205
• George.
Click on "In reply to", to see reports from prior weeks.
Urban Carmel: Weekly Market Summary
* Saturday, February 6, 2016
Summary: NDX undercut its January low this week, and Friday's sell off was extreme enough that it is unlikely to mark the low. Negative investor sentiment seems to be feeding on itself, with sell offs leading to historic fund outflows and further sell offs. These extremes have reached a point where they most often reverse. Even if US equities are in a bear market, a rally of 7-10% is likely close at hand. Importantly, there has been no price action that yet suggests a reversal in the short-term trend.
* * *
After rising the past two weeks, during which oil prices rose 20% from their lows, equities fell hard this week. SPY lost 3%, RUT lost 5% and NDX lost 6%. The big winner was gold, which gained 5%.
Given the close correlation recently between equities and oil, it's no surprise that oil led to the downside, losing 8%. This continues to be the biggest wild card driving the direction of equities.
Perhaps more surprising is that the dollar index fell nearly 3%. Should this continue, this would be a net positive for equities as the repatriated profits of overseas sales benefit from a higher trading partner currency. Naturally, the dollar cost of US products also becomes more affordable with a lower dollar. There is, therefore, a close link between the dollar and revenues for SPX companies: as the dollar falls, revenue growth increases. More on this in a recent post here (chart from Yardeni).

The longer term technical picture for SPY is bearish (reviewed last week here). There was an opportunity for that to start to change this past week. Bullish markets become overbought, bearish markets do not. SPY ended near overbought last week (arrow, top panel) but instead of becoming fully overbought, it just rolled over. That is bearish price action.
SPY is not only below its longer moving averages (50-d and 200-d) but now even under short term averages (13-ema and 5-d). In the chart above, it's retesting the lows from August, September and January; the more times an area is tested, the more likely it is to break. The October 2014 lows under $180 could be next.
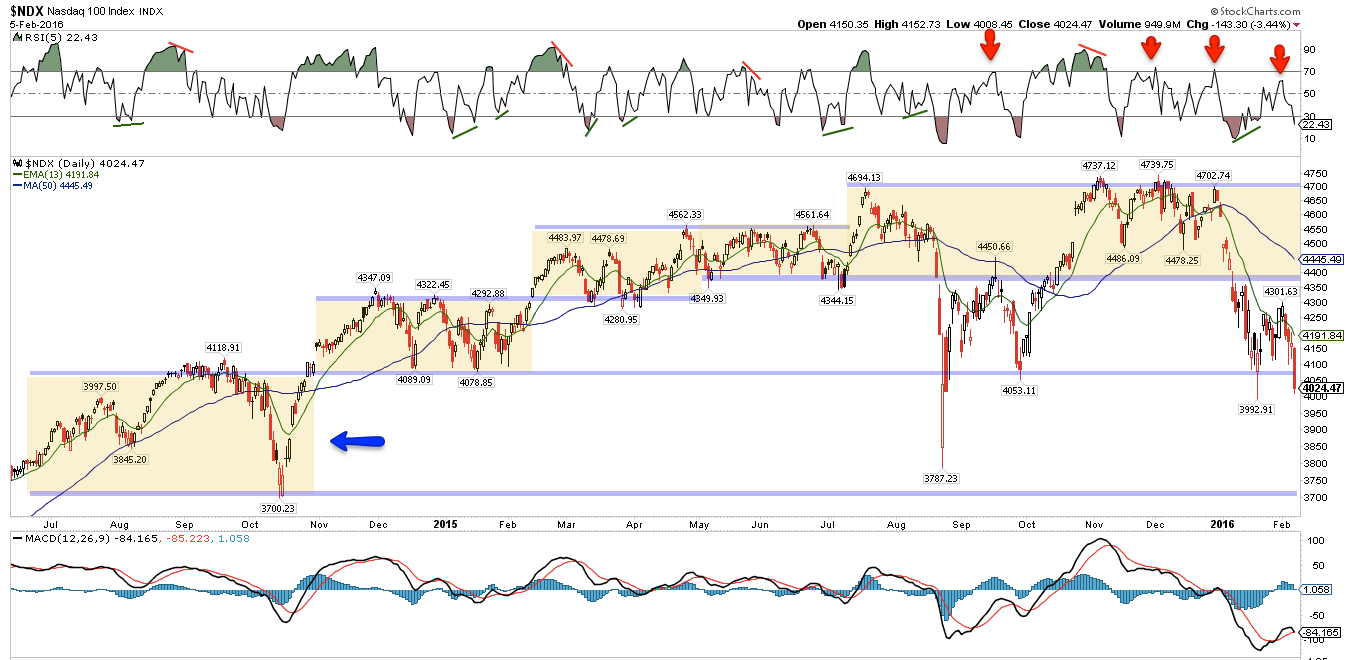
A week ago, it was possible to point to NDX as remaining in a longer term bullish configuration: it made a new ATH in December and the January low was well above the August/September low. That's no longer the case. This week, NDX led to the downside. On a closing basis, the January low has been undercut. Moreover, the recent bounce was much weaker than SPY's (arrows, top panel). It's now back in a trading range from late 2014 that extends down to the 3700 area, 7% lower (blue arrow).
The two week bounce in SPY fell short of a 50% retracement. Our guess was that a 62% retracement, to 199-200, would be possible. This also shows how weak the markets are.
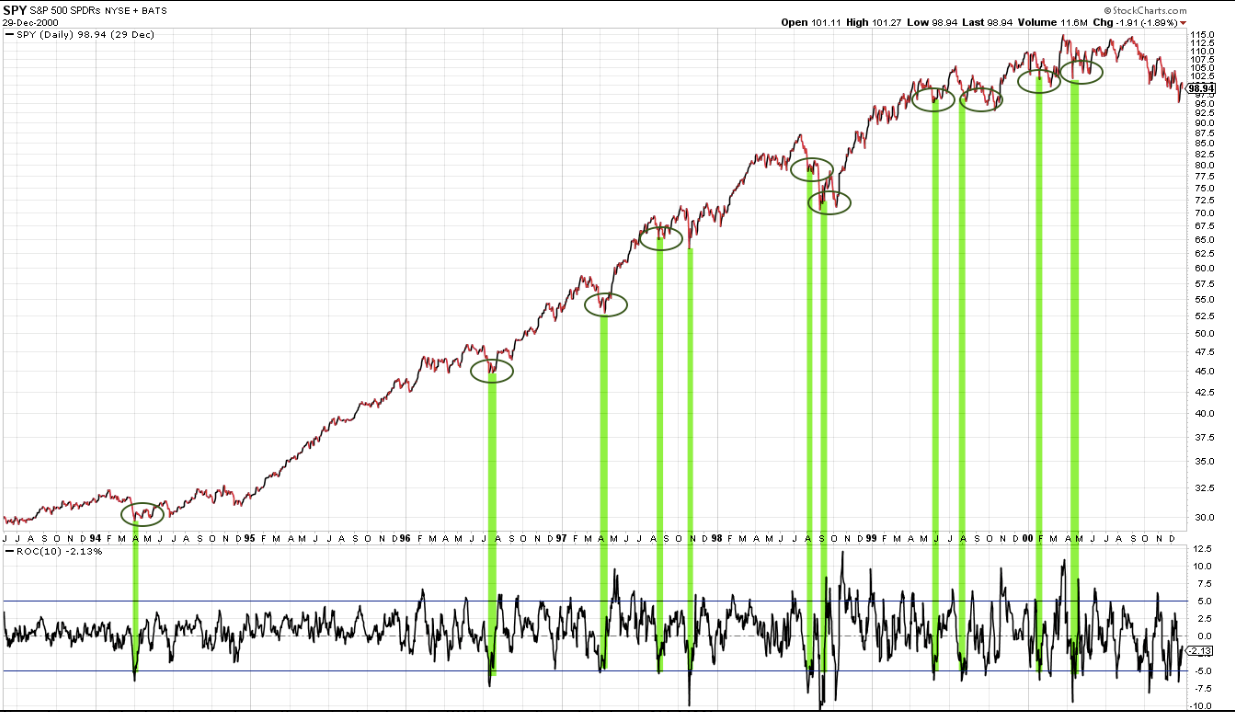
On the other hand, that SPY is now retesting its lows from January is not surprising. We showed this pattern after the January low (here). A high proportion of 5-10% corrections retest their lows in the weeks ahead (circles). That has turned out to be the case now as well. Why? Because downward momentum takes time to dissipate.
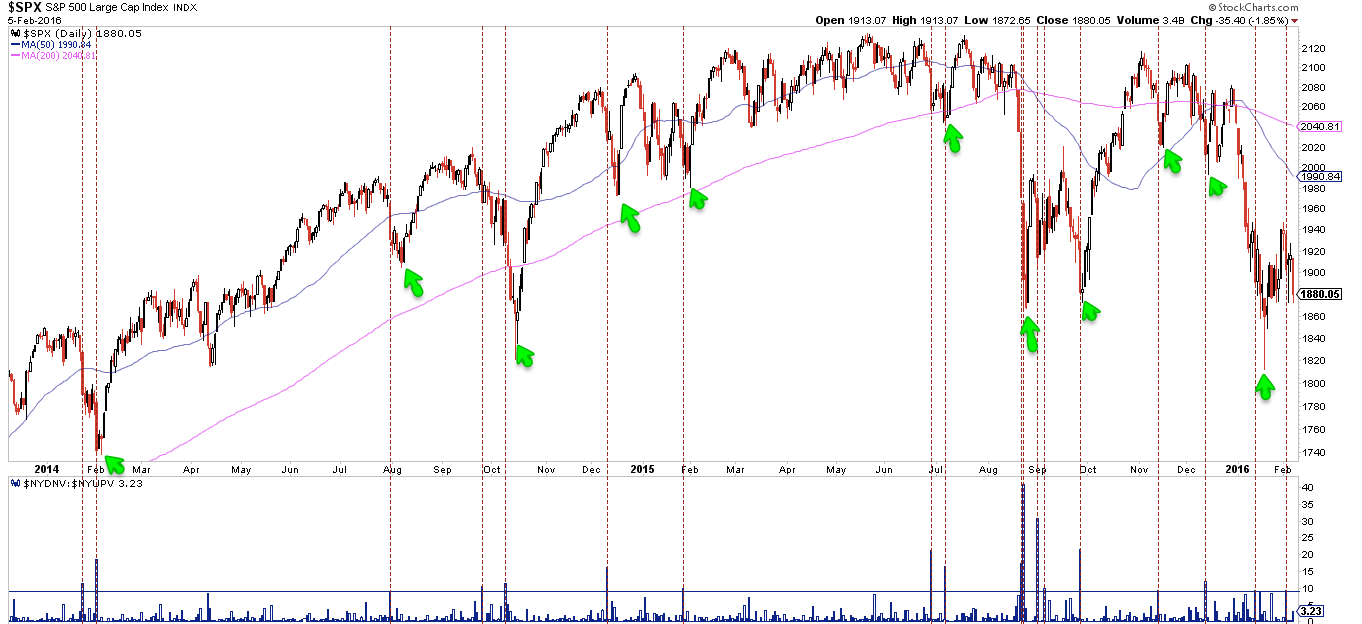
Similarly, momentum on Friday was strongly negative, with SPY losing close to 2% and NDX losing almost 3.5%. Since the start of 2014, SPY has lost a similar amount 15 times (vertical lines) and essentially every instance saw the index undercut the low in the days ahead.
Friday's sell off was not accompanied by extremes in breadth: advance/decline volume was 3:1 negative and Trin was even at 1.0. That compares with Tuesday's sell off, where A/D was more than 9:1 negative and Trin spiked to 2.3. Is the price low on Friday without breadth extremes unusual? Probably not.
The common pattern is for breadth extremes to precede price lows. A post describing this set up in Trin can be found here. The chart below looks at A/D extremes (vertical lines): in most instances, a lower low in price follows (arrows).
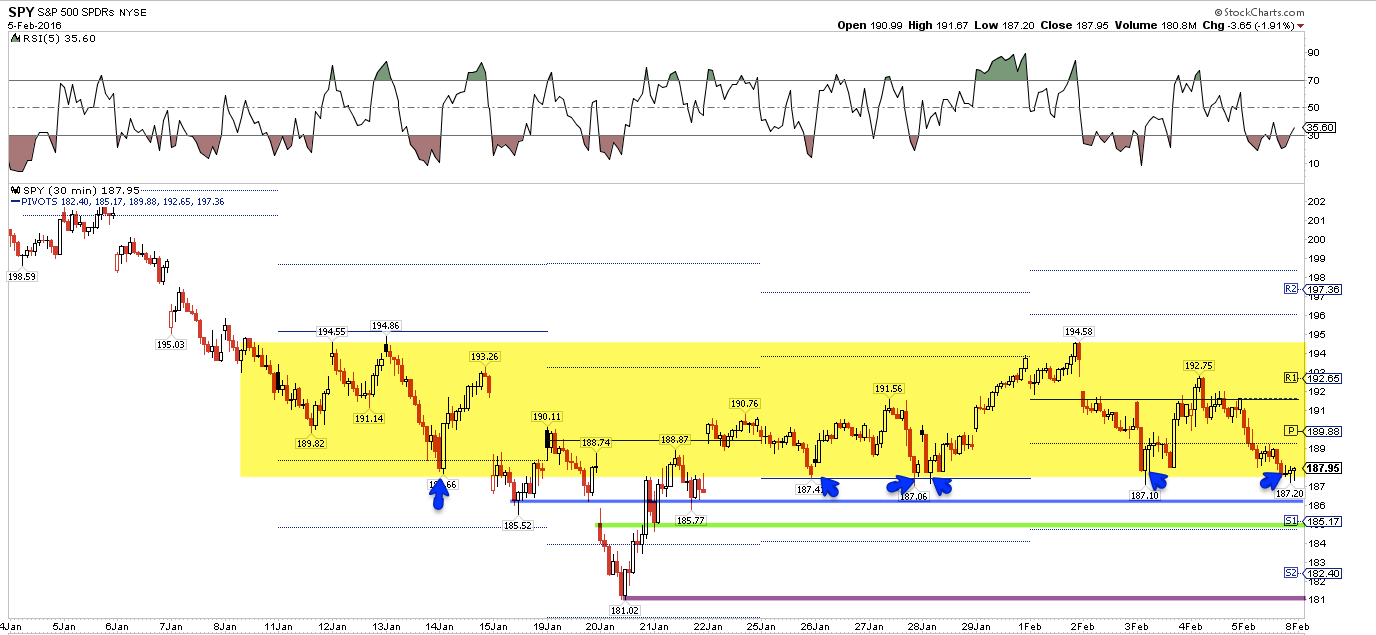
Friday's low and close near 187.5 was at the bottom of a multi-week range (in yellow). This bottom has been tested 5 times in the past two weeks. It would be a near miracle if it wasn't broken after this many tests, and the studies above suggest follow through momentum lower. The next levels to watch are 186.5 (blue line), 185 (green line; also WS1 next week; also the lower Bollinger) and 181 (purple line).

All of this sounds very bearish and, to be clear, falling prices with "lower highs" and "lower lows" is the definition of a downtrend.
The watch out is that these facts are well known. A large majority of investors are bearish and those extremes in sentiment most often reverse. That doesn't mean that new highs are imminent, but equities don't typically drill ever lower when that outcome is widely expected.
NAAIM (active investment managers) are now the equivalent of 22% long equities. This level has rarely been lower over the past decade. When these investors have been this bearish in the past, equities have risen in the weeks ahead (green shading). It may not have been the exact low, but it has been close. The only exception was in the late-2008 meltdown, a situation very unlike today (orange).
Even if US is entering a bear market, excessive pessimism is likely to be worked off before price declines further. In the chart above, note the green shading in early and mid 2008.
Similarly, equity-only put/call ratios show excessive downside protection is being sought. Again, only in the depths of the 2008 meltdown did equities fall further without any interim reprieve. The rallies in March/May 2008 and July/August 2008 were 10% and 7%, respectively. Those rallies failed, but they were significant enough to reset investor expectations. We seem to be close to a similar situation now.

The sell off seems to be mostly driven by fear itself. Earnings data has been predictably bad (here). The macro data continues to show only a minor risk of an imminent recession (recent posts on this here and here). The Nowcast expects GDP growth of 2.2% this quarter; this is far from recessionary.

The employment and wage data continues to be solid. In January, both manufacturing (+29,000) and retail trade (+58,000) saw their strongest employment growth in the past twelve months. Given the consternation over manufacturing, this is fairly remarkable.
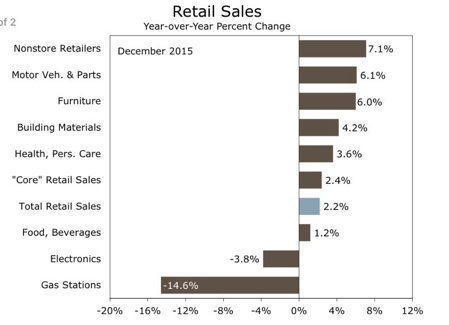
Retail sales in December were solid across a wide variety of categories. The headline figures show slowing growth almost exclusively due to the lower price of gas sold at filling stations. In a recession, growth is slow across a majority of categories. That is clearly not the case now.
The sell off seems now to be feeding on itself in a self-reinforcing cycle, with fund outflows causing sell offs that lead to further fund outflows. Investors pulled another $6.5b out of equities funds this week. Those fund flows have been negative 9 of the past 10 weeks. In more than 10 years, fund flows have never been this extreme, even in 2008. The only comparable periods were March 2008, from which SPY rose 10% in two months, and August 2011, from which a new leg in the bull market began. Further selling from here would be unprecedented (data from Lipper and Sentimentrader).

Meanwhile, inflows into the safety of treasuries has been positive 8 weeks in a row. As we showed last week, those treasury inflows are also historic. Treasury yields are now on levels from which they have previously reversed higher.
In summary, equities continue to trend lower. NDX undercut its January low this week, and Friday's sell off was extreme enough that it is unlikely to mark the low. Negative investor sentiment seems to be feeding on itself, with sell offs leading to historic fund outflows and further sell offs. These extremes have reached a point where they most often reverse. Even if US equities are in a bear market, a rally of 7-10% is likely close at hand.
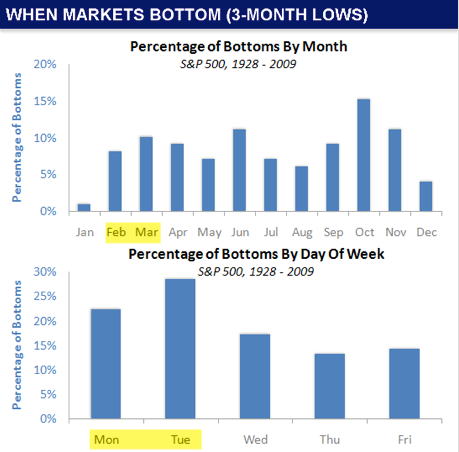
Importantly, there has been no price action that yet suggests a reversal in trend. Either a spike down lower that reverses higher or a multi-day basing pattern is needed before a price low can be identified with any confidence. In other words, we are looking for a clear low in price to trade against, a sign that larger investors are interested in putting capital into the market. It could come as early as Monday, as most price lows occur early in the week. Turnaround Tuesday could be on deck (data from Sentimentrader).
http://fat-pitch.blogspot.com/2016/02/weekly-market-summary.html?spref=tw
• George.
Click on "In reply to", for Authors past commentaries.
Amateur Investors: Weekend Analysis
* Saturday, February 6, 2016
If we take a look at several different indices a few things stand out. First most of them have held support at their longer term 23.6% Retracement Level calculated from the 2009 low. Secondly some of them have broken their longer term upward trend lines while others haven't.
The Dow has been holding support so far at its 23.6% Retrace (near 15500) the past seven months however it did break below its longer term upward trend line.

The Nasdaq has been holding support near its 23.6% Retrace as well the past several months which is now coinciding with its long term upward trend line around the 4300 level.

Next the Russell 2000 has broken solidly below its longer term trend line and 23.6% Retrace. It's next level of support appears to be near 930 which is the 38.2% Retrace.

The S&P 500 has a key support area near 1790 which corresponds to its 23.6% Retrace and longer term upward trend line.

Meanwhile the Total Market Index which contains every stock has a key support area at 450 which is right at its 23.6% Retrace and upward trend line. As I mentioned in the beginning the common theme among all of them except for the Russell 2000 is that they all have held support so far near their 23.6% Retracement Levels from the 2009 lows.

Finally as I have mentioned the last few weeks the 5 Day Average of the Put to Call Ratio still hasn't risen above the 1.25 level. Since the early 2009 low every significant low has been accompanied by a spike above the 1.25 level (points A). Thus the question is will the major averages hold support near their 23.6% Retracement Levels without a rise above the 1.25 level?

http://www.amateur-investors.com/AII_Weekend_AnalysisFeb_5_16.htm
• George.
Click on "In reply to", for Authors past commentaries.
Peek Into Future Through Futures
* February 6, 2016
The following are futures positions of non-commercials as of February 2, 2016. Change is week-over-week.
E-mini S&P 500: Heard someone on TV the other day citing 2017 earnings estimates to argue valuation support for stocks. Really? 2017? Not 2016? The year has barely started, and if one has to go all the way out to 2017, there has got to be a reason. There is.
Operating earnings estimates for 2017 started out at $141.11 three weeks ago and as of January 29th stood at $140.31. Based on these earnings, the S&P 500 trades at less than 13.5x – not terribly cheap but not very expensive either. Try to value it using 2016 estimates of $121.87, and the multiple jumps to just under 15.5x.
Even more important, how reliable are these estimates? Not very. In February last year, 2016 was expected to come in at $137.50, which has so far been slashed by more than 11 percent. Similarly, from peak estimates to the present, 2015 has been cut by more than 23 percent.
Unlike in the past, the public has easy access to these numbers, and they are probably beginning to take notice of earnings deceleration.
Money continues to leave stocks. In the week ended Wednesday, another $6.5 billion left U.S.-based equity funds (courtesy of Lipper). In the past five weeks – since 2016 started – $33.9 billion has been withdrawn, and $42.5 billion since September 30th last year.
Separately, as of Thursday, $2 billion came out of SPY, the SPDR S&P 500 ETF (courtesy of ETF.com).
Year-to-date, the S&P 500 is down eight percent, but it also rallied 7.4 percent off of the January 20th low before coming under pressure. Daily momentum indicators are overbought. That low likely is in play.
Non-commercials aggressively added to net shorts.
Currently net short 225.9k, up 94k.
Nasdaq 100 index (mini): Down six percent for the week, the Nasdaq 100 continues to underperform its major U.S. peers. Here is the problem: It is a market-cap-weighted index.
The top five weights in QQQ, the Nasdaq 100 ETF, are: Apple (AAPL), 11.4 percent; Alphabet (GOOGL, formerly Google), 9.2 percent (both A and C); Microsoft (MSFT), 8.5 percent; Amazon (AMZN), 5.8 percent; and Facebook (FB), 4.5 percent.
Last year, the ETF rallied 9.4 percent, better than its U.S. peers. AAPL was a dud, down three percent, but the rest more than made up for this. AMZN surged 117.8 percent, GOOGL 46.6 percent, FB 34.2 percent, and MSFT 22.7 percent.
So far this year, QQQ is down 12.3 percent, with contribution from all top fives. AAPL is down 10.2 percent, GOOGL 9.5 percent, MSFT 9.6 percent, AMZN 25.7 percent, and FB 0.6 percent.
And there are signs of exhaustion.
QQQ had red candles in December and January, and so far this month. This followed a monthly doji in November. Similarly, AMZN, which more than doubled last year, had a monthly doji in December, followed by a down January and a down February. Now a laggard, AAPL struggled in the $130 area from February to July last year, before giving way in August.
Similarly, after breaking out of a three-month horizontal resistance at $108 last week, FB on Tuesday produced a long-legged doji right outside the upper Bollinger Band. Also on Tuesday, in a high-volume, post-earnings session, GOOGL produced a shooting star, preceded by a doji on Monday.
Non-commercials continue to reduce net longs.
Currently net long 21.7k, down 8.5k.
Russell 2000 mini-index: In the week ended Thursday, $702 million came out of IWM, the iShares Russell 2000 ETF (courtesy of ETF.com).
The index acts weak. A retest of the January 20th low (958) looks imminent.
Currently net short 61.9k, up 13.1k.

US Dollar Index: Collapsed 1.6 percent on Wednesday. Was it reacting to January’s ISM non-manufacturing PMI, which dropped 2.3 points to 53.5 – the lowest since February 2014? Possibly.
That said, unlike U.S. manufacturing, non-manufacturing is still in expansion. Manufacturing has languished sub-50 the past four months.
Or was it reacting to the 10-year yield that swooned to 1.79 percent intra-day Wednesday before ending up two basis points to 1.88 percent? (Incidentally, with a shooting star on Wednesday, TLT, the iShares 20+ Year Treasury Bond Fund, looks like a short near-term.)
Rate-hike odds are fading… fast. The dollar index had hugged the 50-day moving average for nearly two months. Once it lost that, the reaction has been violent.
The question is, is it a double-top? The 93-plus is yet to be breached. The daily chart is oversold, with encouraging action on Friday. It now faces resistance in the 98 range.
One thing is crystal clear. Non-commercials do not wax enthusiastic over the dollar’s prospects.
Currently net long 44.9k, up 647.
VIX: On Monday, volatility bulls stepped up to support the 50-day moving average, which is now slightly rising. Ditto with the 200-day.
Near-term, there is room to unwind daily oversold conditions.
Currently net long 22.5k, up 8.3k.
Hedgopia Risk Reward Index
http://www.hedgopia.com/cot-peek-into-future-through-futures-29/
• George.
Click on "In reply to", for Authors past commentaries.
Trading Notes: Friday, February 5th
By Brett Steenbarger, Ph.D.
* February 5, 2016
* Despite a morning selloff after early strength, stocks finished the day on the firm side. 432 stocks across all exchanges touched monthly highs versus 293 monthly lows. Over 50% of SPX shares are trading above their 3, 5, 10, and 20-day moving averages. I am watching closely to see if breadth can expand in today's trade. The response to the non-farm payrolls number will have a lot to do with that.
* Interestingly, my cycle measures are near levels that have corresponded to market tops. Should we be unable to surmount the highs reached on February 1st, that would invite the hypothesis that we've put in an intermediate-term top and are likely to retest recent lows.

* Working off the oversold cycle readings with a relatively modest bounce from the lows is once again an indication that the 2016 market is different from those experienced in 2014 and 2015. The weaker US dollar has added an interesting element to stock prices. Note the recent strength of raw materials share (XLB). The bounce in housing shares (XHB) has not been impressive.
http://traderfeed.blogspot.com/2016/02/trading-notes-for-week-of-february-1.html
• George.
Click on "In reply to", for Authors past commentaries.
Put/Call - Charts
* February 5, 2016
>> S&P 500 vs Equity Put/Call
http://www.indexindicators.com/charts/sp500-vs-put-call-ratio-equity-1d-sma-params-x-x-x-x/
>> S&P 500 vs Index Put/Call
http://www.indexindicators.com/charts/sp500-vs-put-call-ratio-index-1d-sma-params-x-x-x-x/
>> S&P 500 vs Total Put/Call
http://www.indexindicators.com/charts/sp500-vs-put-call-ratio-total-1d-sma-params-x-x-x-x/
• George.
Breadth Indicators - Charts
* February 5, 2016
>> Dow Jones Industrial Average vs % of DJIA Stocks Above 5-Day Moving Average Chart
http://www.indexindicators.com/charts/djia-vs-djia-stocks-above-5d-sma-params-x-x-x-x/
>> S&P 500 vs % of S&P 500 Stocks Above 5-Day Moving Average Chart
http://www.indexindicators.com/charts/sp500-vs-sp500-stocks-above-5d-sma-params-x-x-x-x/
>> Nasdaq 100 vs % Nasdaq 100 Stocks Above 5-Day Moving Average Chart
http://www.indexindicators.com/charts/nasdaq100-vs-nasdaq100-stocks-above-5d-sma-params-x-x-x-x/
• George.
ETFs Sector Performance Today
* February 5, 2016
>> Best Performing Technolgy ETFs Today
http://www.dogsofthedow.com/best-performing-technology-etfs-today.htm
>> Best Performing Healthcare ETFs Today
http://www.dogsofthedow.com/best-performing-healthcare-etfs-today.htm
>> Best Performing Energy ETFs Today
http://www.dogsofthedow.com/best-performing-energy-etfs-today.htm
>> Best Performing Financial ETFs Today
http://www.dogsofthedow.com/best-performing-financial-etfs-today.htm
>> Best Performing Real Estate ETFs Today
http://www.dogsofthedow.com/best-performing-real-estate-etfs-today.htm
>> Best Performing Commodity ETFs Today
http://www.dogsofthedow.com/best-performing-commodity-etfs-today.htm
• George.
ETF Performance Screens
* February 5, 2016
>> Best Performing ETFs Today
http://www.dogsofthedow.com/best-performing-etfs-today.htm
>> Best Performing ETFs: 12 Months
http://www.dogsofthedow.com/best-performing-etfs-12-months.htm
>> Highest Dividend Paying ETFs Today
http://www.dogsofthedow.com/highest-dividend-paying-etfs.htm
• George.
Upgrades/Downgrades
* Updated: February 04, 2016 06:59 a.m. ET
Equity ratings changes direct from brokerage firms.
http://online.wsj.com/mdc/public/page/2_3024-UpgradesDowngrades.html?mod=topnav_2_3062
• George.
Trading Notes: Wednesday, February 3rd
By Brett Steenbarger, Ph.D.
* February 3, 2016
* Tuesday's trade in ES nicely illustrated the dynamics of a downside trend day, including an opening price near the high price for the day session; negative NYSE TICK dominating positive readings, with many readings < -800; a very negative advance/decline line; and a great majority of NYSE stocks trading below their VWAPs for the day. Trend days often feature above average volume, as directional, macro participants express an intermarket theme. In yesterday's case, we saw the resumption of the risk-off trade involving oil, stocks, high yield credit, and emerging markets. I am watching those intermarket relationships carefully from day to day.
* A useful short-term overbought/oversold measure is a five-day moving average of upticking vs. downticking among NYSE stocks. Note how we reached a short-term peak recently.

http://traderfeed.blogspot.com/2016/02/trading-notes-for-week-of-february-1.html
• George.
Click on "In reply to", for Authors past commentaries.
Upgrades/Downgrades
* Updated: February 03, 2016 08:20 a.m. ET
Equity ratings changes direct from brokerage firms.
http://online.wsj.com/mdc/public/page/2_3024-UpgradesDowngrades.html?mod=topnav_2_3022
• George.
Trading Notes: Tuesday, February 2nd
By Brett Steenbarger, Ph.D.
* February 2, 2016
* After early weakness, we continued to move higher on Monday, hitting a new high for the recent rally off the lows. Across all exchanges, we had 502 shares register fresh monthly new highs against 251 new lows. That is a modest expansion from Friday's levels. Oil continues to come well off its recent highs and we've seen selling in stocks in premarket trading. Interestingly, stocks are lower in Japan following the BOJ action and we're down in Europe as well. At least so far, the rally off the lows still strikes me as part of a bottoming process, not a fresh bull market leg.
* Here's a look at one of my primary cycle measures. My base case that this cycle will top out at a lower price high and lead to a test of the recent market lows. Should we see waning breadth on the upside on future strength, that would add credence to this view. As of Monday's close, we were short-term overbought, with over 80% of SPX shares closing above their 3, 5, and 10-day moving averages. (Data from Index Indicators; it's a great site for breadth info).

* A look at sectors from the excellent FinViz site finds that yield-sensitive utility and consumer staples shares have led market performance year-to-date. Interestingly, financial shares are among the largest losers during 2016 thus far. Given concerns over debt--China and high yield--this is not a bullish configuration of sector strength. It's clearly defensive.

http://traderfeed.blogspot.com/2016/02/trading-notes-for-week-of-february-1.html
• George.
Click on "In reply to", for Authors past commentaries.
ETFs Sector Performance Today
* February 1, 2016
>> Best Performing Technolgy ETFs Today
http://www.dogsofthedow.com/best-performing-technology-etfs-today.htm
>> Best Performing Healthcare ETFs Today
http://www.dogsofthedow.com/best-performing-healthcare-etfs-today.htm
>> Best Performing Energy ETFs Today
http://www.dogsofthedow.com/best-performing-energy-etfs-today.htm
>> Best Performing Financial ETFs Today
http://www.dogsofthedow.com/best-performing-financial-etfs-today.htm
>> Best Performing Real Estate ETFs Today
http://www.dogsofthedow.com/best-performing-real-estate-etfs-today.htm
>> Best Performing Commodity ETFs Today
http://www.dogsofthedow.com/best-performing-commodity-etfs-today.htm
• George.
Jeffrey Saut: The call for this week
* February 1, 2016
Rich man, poor man
So far this year, the “rich man” has not needed the stock market. That may have changed last week. Last Thursday, I said, “I think the equity markets are bottoming at session 21 in the typical 17-25 day ‘selling stampede’ sequence.” In Friday’s missive, I wrote, “I think the ‘selling stampede’ pretty much ended at session 21 with yesterday’s (last Thursday) whippy action between plus and minus, which is typically how bottoms are made.” About a week ago, I noted that, if we do bottom in the 17-25 session timeframe, the S&P 500’s (SPX/1940.24) first upside target zone would be 1940-1950. Well here we are, which makes this week critical. If we can get through 1940-1950, the odds that we have made a sustainable bottom increase notably. If we don’t, it would mean another downside retest. I will say that there is a FULL change of “internal energy” available for a pretty decent move from here. Stay tuned . . .
Upgrades/Downgrades
* Updated: February 01, 2016 07:29 a.m. ET
Equity ratings changes direct from brokerage firms.
http://online.wsj.com/mdc/public/page/2_3024-UpgradesDowngrades.html?mod=topnav_2_3022
• George.
Urban Carmel: Weekly Market Summary
* January 31, 2016
Summary: A more than 20% rebound in oil the past 10 days helped equities close higher a second week in a row. Importantly, there were two positive breadth thrusts this week: equities have strong tendency to add to gains over the following weeks. Despite equity's gains, investors remain very bearish, and this is also a tailwind into February. After a powerful move Friday, a giveback early in the week would be unsurprising.
* * *
US equities rose for a second week in a row. SPY was up 1.7%, the Dow was up 2.3%. In contrast, NDX was up just 0.5%.
The biggest winner was once again oil, which rose more than 4% this week. Since it's low 10 days ago, oil has risen more than 20%. There is little doubt that this has had an outsized positive affect on US equities.
The longer term technical picture remains bearish for SPX. It made a lower high in November and a lower low in January. The 20-wma (blue line) is sloped downward, as it was in 2008 but also in 2010 and 2011. The pattern is bearish until SPX at least exceeds the prior high in November (2120 area): this is what separates 2008 from 2010 and 2011 (horizontal lines).

Bullish markets become overbought; bearish markets do not. The market is now at a point where it will show its character. In the chart above, the rebound in early 2008 failed to reach overbought momentum, in contrast to 2010 and 2011 (upper panel arrows).
The same is true on a daily time frame. Support from August and September held and the index has since gained more than 4% (closing basis). Momentum is just below overbought; this is right where every rally since October has failed, and also where the rally in mid-September failed (upper panel). A key test for SPY is upon us.

The short term pattern has improved. SPY's 13-ema and 5-dma are now trending higher. There's a new "step" higher in the pattern. The rebound has now retraced about 38% of the drop from November: a weak rebound usually gets no further than this. A rebound to the 62% Fibonacci near $200 remains a distinct possibility (described in detail last week here).

In the chart above, note that short-term momentum is now very overbought; it would be unsurprising if SPY retested the 192-193 area early in the week (chart below, green line). The weekly pivot is 191.6. 195 should be stiff resistance (blue line).

NDX is not confirming the longer term bearish technical pattern in SPY. The index made a higher high December and a higher low in January. It's 20-wma is not declining. Still, the index needs to regain the 4500 area or the risk is that it too will rollover lower.

For NDX, the 4350 area will be a key test: this is where rallies have failed (late 2014, early 2015, September 2015). The same comment on momentum from SPY also applies to NDX (top panel).

Price aside, there were two other positives the past two weeks.
First, there were breadth thrust days on both Tuesday and Friday. This means that volume on the NYSE was 90% positive. It's rare enough to have a single breadth thrust day. Two in one week is exceptional. Equities have a strong tendency to add to gains in the weeks ahead. Below are returns after a single 90% up day; returns over the next month and longer are very good (data from BAML).

When there are two breadth thrust days in a week, the returns are even better, as shown below, although the market becomes overbought short term and therefore due for a rest (data from Rob Hanna in a post here).

The second positive is that, although the market is up over the past two weeks, investors remain exceptionally bearish. A rising market where investors are slow to buy the dip often pushes higher.
Recall from last week's post that $46.5b had flowed out of equity mutual funds and ETFs in the past 8 weeks. There was another $1.2b outflow this week, making flows negative 8 of the past 9 weeks. In the last 13 years, the only comparable periods were early 2008 and mid-2011. The 2011 low marked the start of a new bull leg. Even in 2008, SPY rose 8% over the next several weeks before faltering. A similar rise now would take SPY to about $200.
Investors have been on the defensive. $3.8b went into treasury funds this week, making it the 7th week in a row for inflows. A massive $13.9b went to money market funds this week alone.
Focusing just on flows into TLT, the past 10 days has seen the largest inflow ever, by a wide margin (lower panel). Prior extremes have tended to be near turning points in TLT (upper panel; data in the next two charts is from Sentimentrader).

What is a positive extreme for TLT tends to be a negative extreme for SPY. Using the same data, SPY has done well after these same extreme fund flows into TLT (SPY is in the upper panel).

Similarly, investors in Rydex funds have one of the largest percentage of their assets in bearish equity funds and in money market funds as a percentage of their total assets in the past 10 years. This too has marked near term lows in equities (chart from Cam Hui).

The Citibank Panic/Euphoria model, which we have referenced in the past (a longer term chart from September 2015 here), is now at the lowest level in many years, from which SPX has never been lower over the next 12 months and has most often gained more than 10%.

The percentage of AAII bulls sank to the lowest decile in late January, from which SPX has been higher 1 and 3 months later by 2.3% and 5.3%, respectively. Forward returns are positive during these time periods 70% and 85% of the time, respectively (data from Charlie Bilello).

The market timers with the best investment records over the past 1, 3, 5 and 10 years are bullish on equities, while those with the worst track record are bearish (article from Mark Hulbert here).

The biggest potential negative remains the outsized influence of the price of oil on equities. The tick for tick correlation between the two lessened as the week went on, but the overall pattern remains in sync. There's little doubt that the rally the past 10 days has been sparked by the 22% rise in oil.

The same is true for junk bonds.

January ended with SPY lower by 5%. December was also lower. Does the combination of a failed Santa Rally (SCR) and a lower January (JB) lead to bearish results for the rest of the year? The answer is no. When those two have both happened in the past, SPX has been higher the rest of the year 5 out of 8 times (data from Stock Almanac).

That said, the probability of a positive end to the year is lower than when January is up and the return for the year is normally below average (data from Mark Hulbert).

If past is prologue, equities will chop sideways the next 3 months and then make a lower low in early summer, from which the best rally of the year will take place (red line). A difficult market environment might remain for the time being (data from Stock Almanac).
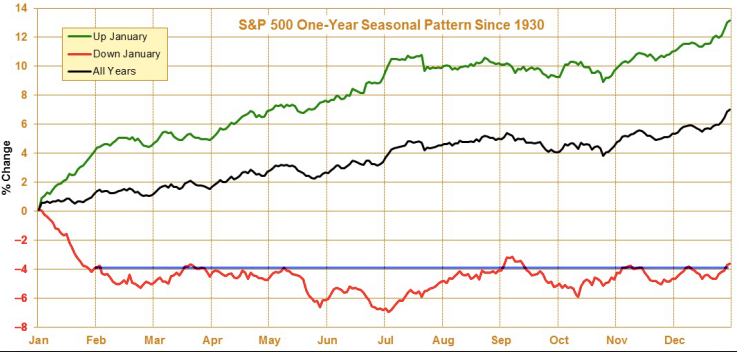
This is another big week for earnings, after which we will have a very good grasp on how companies are performing. Companies can engage in buybacks after reports are issued, a potential tailwind.

On the economic calendar, personal consumption data is Monday, auto sales on Tuesday and the all-important payroll report is on Friday.
Equities ended the past week fairly overbought on a short-term basis. Some give back early in the week would be unsurprising. But there were two breadth thrusts this week, and investors remain very bearish, two tailwinds as we enter into the month of February.
http://fat-pitch.blogspot.com/2016/01/weekly-market-summary_31.html?spref=tw
• George.
Click on "In reply to", for Authors past commentaries.
Clive Maund: ELITES SET TO WIPE OUT SHORTS BEFORE NEXT DOWNWAVE...
* January 30, 2016
The recovery rally in the US stockmarket that we have been expecting for a week or two started on Friday with a robust advance that gathered strength into the close. The trigger was Japan’s announcement that it is going into NIRP (Negative Interest Rate Policy) in a big way, which means that as they slip deeper into the abyss of bankruptcy they are going to resort to robbing savers. This is real “endgame stuff” – another milestone on the road to ruin, and it looks like it was the result of the Japanese attendees at Davos being taken to one side and given their “marching orders”. The US stockmarket reveled in this news of course, because it means that the Fed’s proposed interest rate rises will never happen and instead they will get ready to launch a massive QE blitz, in concert with Central Banks around the world, in a desperate effort to fend off the gathering forces of deflation. The end result of this QE blitz will be hyperinflation and chaos. At some point the penny will drop with investors and there will be a stampede into gold and silver, although latest COTs suggest that this is still some way off.
On the 6-month chart for the S&P500 index, we can see how the index finally broke out upside from an intermediate base pattern on Friday, with a big bullish white candle appearing. The large white candle portends a continuation of the rally. First stop should be the resistance shown in the 2000 area, and it may well rise further, as we will see on other charts, with a fairly precise target for the move provided by the chart for the Dow Jones Transports, which we will look at later.
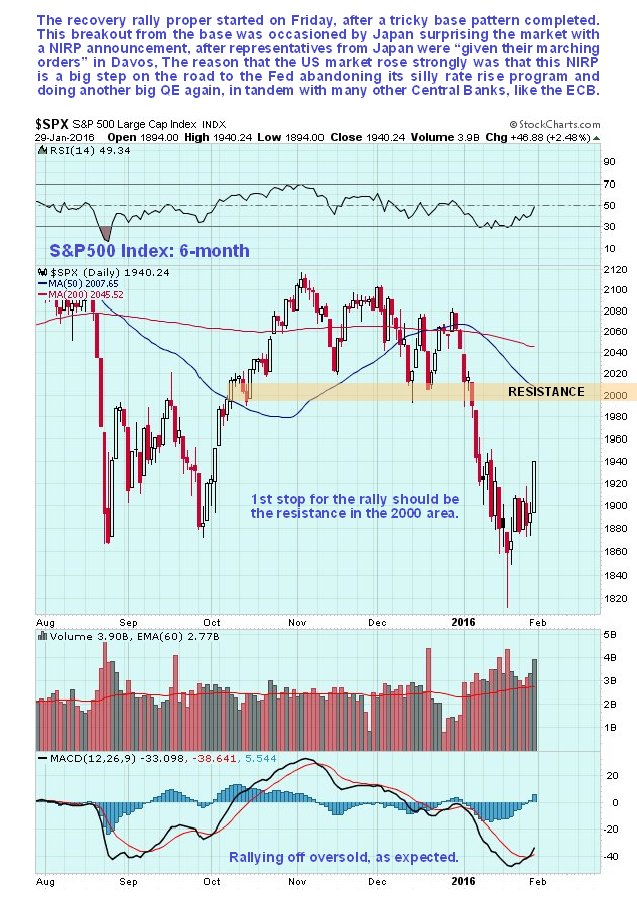
On the 2-year chart for the S&P500 index we can see more clearly how far this countertrend rally is likely to get. The first stop will be the resistance shown in the 2000 area, as pointed out above, but the vigor of Friday’s advance suggests that it is quite likely that it will push on higher to the Dome boundary again, as it did after the August plunge. That the market is rallying here should hardly be surprising, given that it had dropped to become extremely oversold on its MACD indicator and at a zone of support at the lower boundary of its large Head-and-Shoulders top.
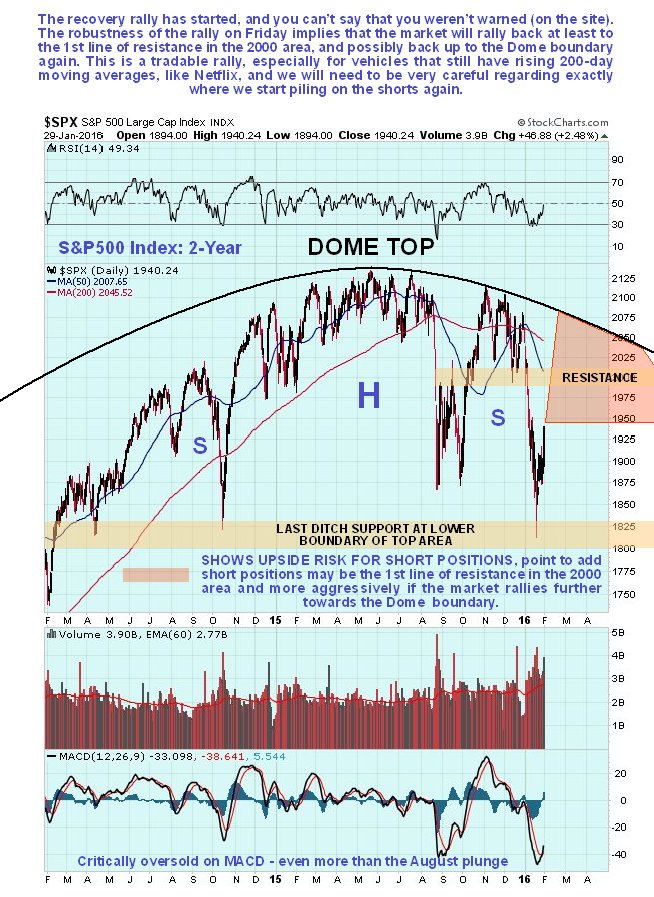
The 5-year chart shows the big picture, and what is likely to happen after the index reaches the Dome boundary again, if it gets that far.
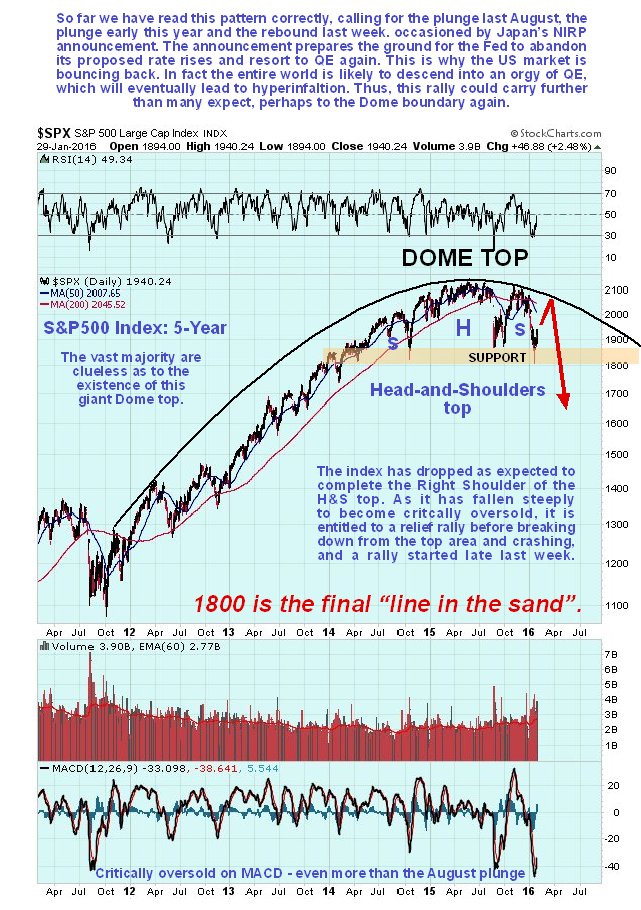
Whilst it is rather tricky to determine how far this countertrend rally will get on the charts for the S&P500 index, happily this is not the case with the chart for the Dow Jones Transports, which provides us with a fairly precise target, as we will now see.
On the 2-year chart for the Transports, we can see that after it broke down from the clear Head-and-Shoulders top right at the start of the month, it plunged to become extremely oversold. Now, it is very common after a breakdown from a Head-and-Shoulders top for a pullback to the neckline of the pattern to occur, before the bearmarket that it portends gets underway in earnest. After the basing action of the past couple of weeks that is what it looks like we are now going to see, in which case the Transports will rally back up to the 7300 – 7400 area in coming weeks, where we will offload our short-term long positions and probably go heavily short. That’s the plan – let’s see what happens.
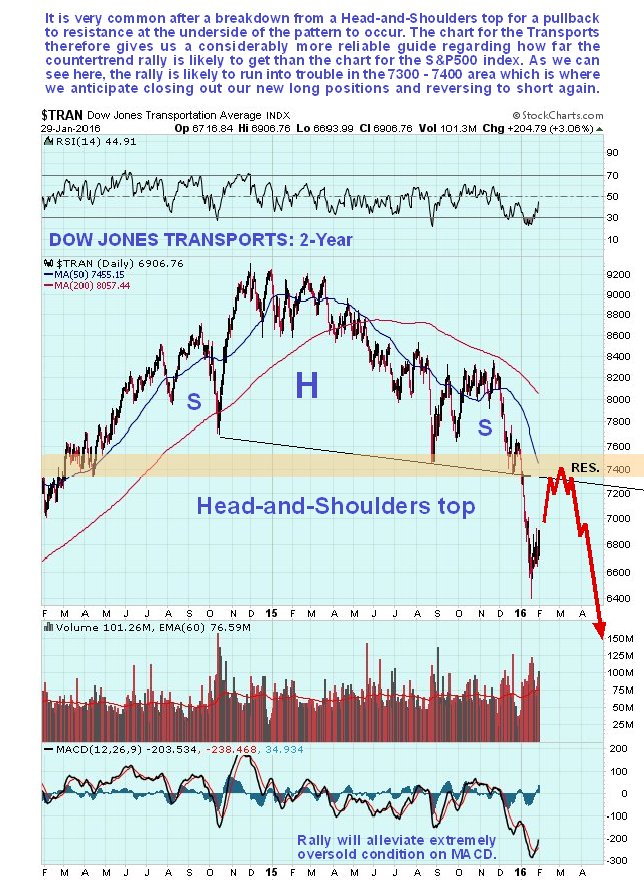
Now here are some other indicators that back up our contention that a sizeable countertrend rally has just started.
First we have the latest Odd Lot Short Sales chart, which shows that almost everyone has been piling in on the short side in recent weeks, and since “that many people can’t be right” it follows that Big Money will now fleece these shorts by engineering a sizeable short-covering rally. Once they have been wiped out the market will be free to drop again.
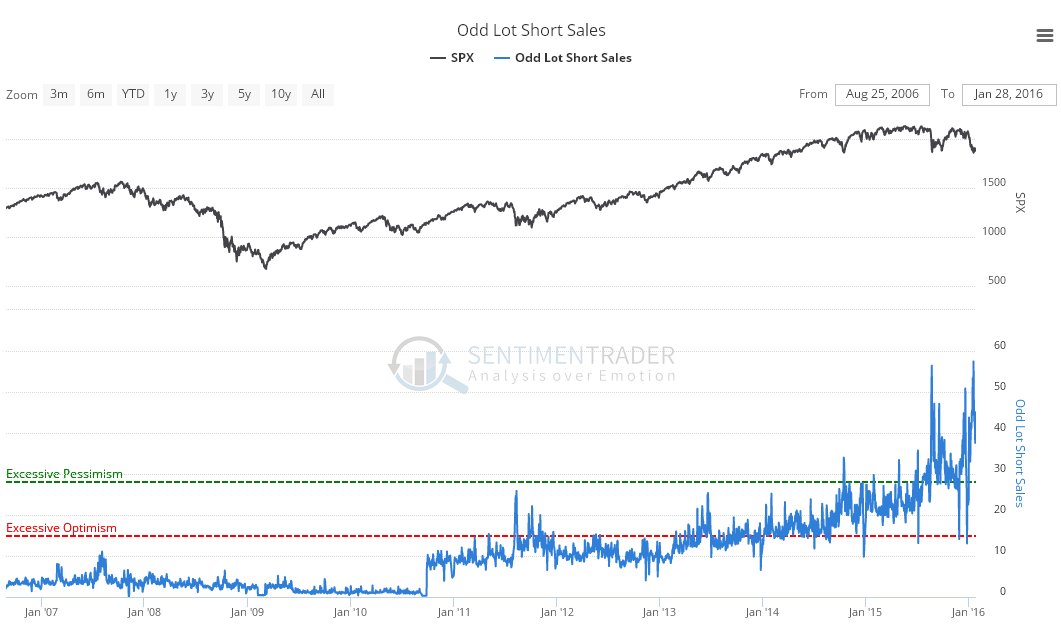
Chart courtesy of www.sentimentrader.com
The extremely low appetite for risk of the past couple of weeks is another indication that the market is ripe for a rally, as we can see on the latest Risk Appetite Index shown below.
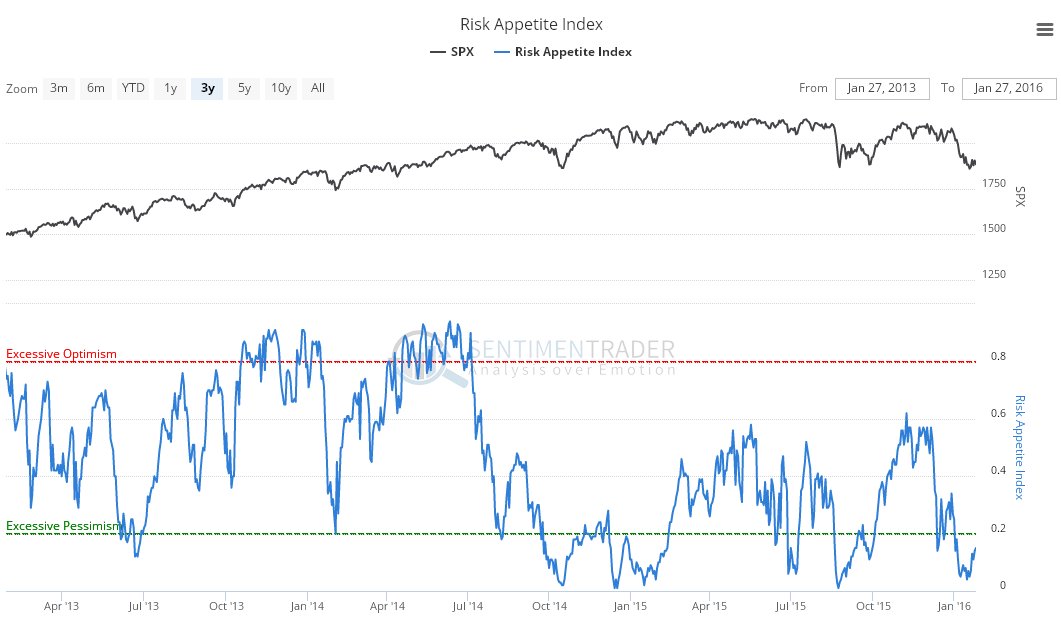
Chart courtesy of www.sentimentrader.com
Since 2008 we have been traversing the eye of a gigantic financial hurricane, and you may recall that it was pointed out on the site back in November that the eyewall at the back side of this storm was about to hit, as we can see to advantage on this photo from the International Space Station, and we can also see how NIRP will precede the final acts of desperation of a broken system – bail-ins and the brazen looting of pension funds…

In a separate article we will be looking at some vehicles for making money on the long side during the expected rally in coming weeks, before piling on the shorts again.
http://www.clivemaund.com/article.php?art_id=3699
• George.
Click on "In reply to", to see reports from prior weeks.
Stocks With the Largest Short Interest
* Friday, January 29, 2016
> nyse
http://bigcharts.marketwatch.com/reports/bigmovers.asp?data=1&start=1&report=10&report_country_code=US&date=20160129
• George.
Click on "In reply to", to see reports from prior weeks.
Amateur Investors: Weekend Analysis
* Saturday, January 30, 2016
The major averages finished with a negative return in January. Once of the old sayings on Wall street is the way January goes the Year goes. The chart below shows all of those years since 1900 in which the Dow had a negative return in January and how the year ended performance wise. Overall the odds of both a Negative January Return and Negative Yearly Return is 62% (26 out of 42). The correlation worked in 2015 but didn't in 2014, 2010 and 2009.
Year	        Jan	Yearly		Year	        Jan	Yearly		Year	         Jan	Yearly
               Return	Return			        Return	Return			       Return   Return
 1/31/1901	-5.5	-8.7	Y	1/31/1940	-3.3	-12.7	Y	1/29/1982	-0.4	19.6	N
 1/31/1907	-2.8	-37.7	Y	1/31/1941	-5.3	-15.3	Y	1/31/1984	-3.0	-3.7	Y
 1/29/1909	-1.8	15.0	N	1/30/1942	-1.7	7.6	N	1/31/1990	-5.9	-4.3	Y
 1/31/1910	-7.2	-17.8	Y	1/30/1948	-3.4	-2.2	Y	1/31/2000	-4.8	-6.2	Y
 1/31/1912	-1.7	7.7	N	1/30/1953	-0.7	-3.8	Y	1/31/2002	-1.0	-16.8	Y
 1/31/1913	-4.7	-10.3	Y	1/31/1956	-3.6	2.3	N	1/31/2003	-3.5	25.3	N
 1/31/1916	-8.6	-4.2	Y	1/31/1957	-4.1	-12.8	Y	1/31/2005	-2.7	-0.6	Y
 1/31/1919	-1.9	30.5	N	1/29/1960	-8.4	-9.3	Y	1/31/2008	-4.6	-33.8	Y
 1/30/1920	-2.8	-32.9	Y	1/31/1962	-4.3	-10.8	Y	1/30/2009	-8.8	18.8	N
 1/31/1923	-0.8	-2.7	Y	1/31/1968	-5.5	4.3	N	1/29/2010	-3.5	11.0	N
 1/31/1927	-0.5	27.7	N	1/30/1970	-7.0	4.8	N	1/31/2014	-5.3	7.5	N
 1/31/1928	-1.1	49.5	N	1/31/1973	-2.1	-16.6	Y	1/30/2015	-3.7	-2.2	Y
 1/29/1932	-2.2	-23.1	Y	1/31/1977	-5.0	-17.3	Y	1/29/2016	-5.5	?
 1/31/1935	-2.2	38.6	N	1/31/1978	-7.4	-3.2	Y
 1/31/1939	-7.1	-3.0	Y	1/30/1981	-1.7	-9.2	Y


|
Followers
|
38
|
Posters
|
|
|
Posts (Today)
|
0
|
Posts (Total)
|
2987
|
|
Created
|
11/04/07
|
Type
|
Free
|
| Moderators | |||
* SSO - ProShares Ultra S&P500 (the Fund), formerly Ultra S&P500 ProShares, seeks daily investment results that correspond to twice
the daily performance of the S&P 500 Index.
* UPRO - ProShares UltraPro S&P500 (the Fund), seeks daily investment results that correspond to three times the daily performance of the S&P 500 Index.
* The S&P 500 Index is a measure of large-cap United States stock market performance. It is a capitalization weighted index of 500
United States operating companies and real estate investment trusts (REITs) selected by an S&P committee through a non-
mechanical process that factors criteria, such as liquidity, price, market capitalization, financial viability and public float.
Reconstitution occurs both on a quarterly and on an ongoing basis.
* The Funds take positions in securities and/or financial instruments that, in combination, should have similar daily return
characteristics as 200% for the SSO and 300% for the UPRO of the daily return of the SPDR (SPY) Index. The Fund’s investment
advisor is ProShare Advisors LLC.
http://finviz.com/quote.ashx?t=sso
| SPY [NYSE] SSO [NYSE] UPRO [NYSE] |
| SPDR S&P 500 ETF |
| Financial - Exchange Traded Fund - USA |
All information posted on this board is not meant to suggest any specific action, but to point out the technical signs that can help our readers make their own specific decisions. Your Due Diligence is a must!
| Volume | |
| Day Range: | |
| Bid Price | |
| Ask Price | |
| Last Trade Time: |


