


| Followers | 0 |
| Posts | 148553 |
| Boards Moderated | 7 |
| Alias Born | 03/10/2004 |
Saturday, February 13, 2016 9:28:14 AM
Peek Into Future Through Futures
* February 13, 2016
The following are futures positions of non-commercials as of February 9, 2016. Change is week-over-week.
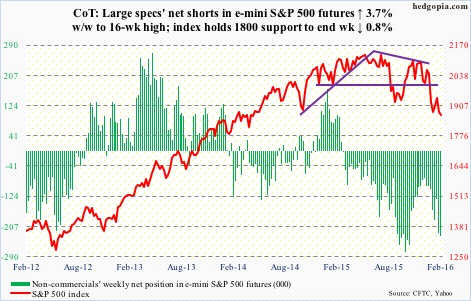
E-mini S&P 500: In the week ended Wednesday, another $1.5 billion left U.S.-based equity funds (courtesy of Lipper). One has to go back to the week ended December 30th to see inflows (to the tune of $10 billion). Since then, there have been six straight weeks of outflows, totaling a whopping $35.4 billion.
That said, during the week ended Thursday, SPY, the SPDR S&P 500 ETF, did attract a decent amount – $5.9 billion, to be exact (courtesy of ETF.com). This was before Friday’s 2.1 percent rally.
Flows need to cooperate for this rally to have legs. Obviously, 1880 is huge. Not only does this resistance go back to March 2014, but is also a confluence of 10- and 20-day moving averages.
Currently net short 234.3k, up 8.4k.
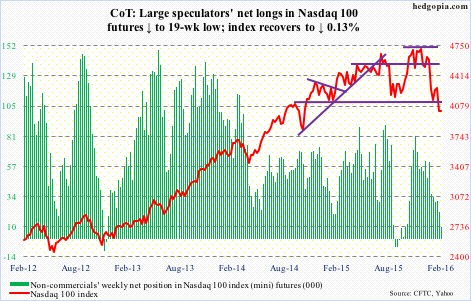
Nasdaq 100 index (mini): Down as much as 3.4 percent on Monday’s intra-day lows, the Nasdaq 100 had an impressive end to the week – only down 0.13 percent. Has tons of room to rally from here – if nothing else just to unwind oversold conditions, both daily and weekly.
The nearest resistance lies at just under 4100, and the line can be drawn as far back as September 2014. Shorter-term averages lie around there as well, and they are still dropping. More consolidation is needed so they begin to hook up.
In the week ended Thursday, $665 million came out of QQQ, the PowerShares Nasdaq 100 ETF (courtesy of ETF.com).
Non-commercials continue to reduce net longs – now sub-10k. Holdings are at a 19-week low.
Currently net long 9.6k, down 12.1k.
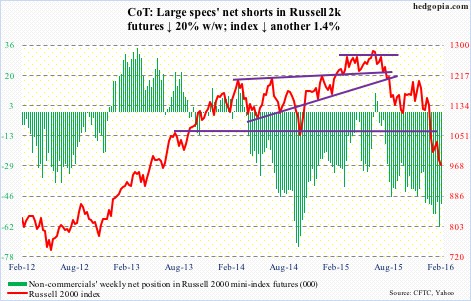
Russell 2000 mini-index: In the week ended Wednesday, $492 million moved into IWM, the iShares Russell 2000 ETF (courtesy of ETF.com).
This was before Thursday’s action when the January 20th low was breached before staging a mini-reversal. A rally is possible near-term, but needs to first take out 985 and then 1000.
Non-commercials reduced net shorts by 20 percent.
Currently net short 49.5k, down 12.4k.
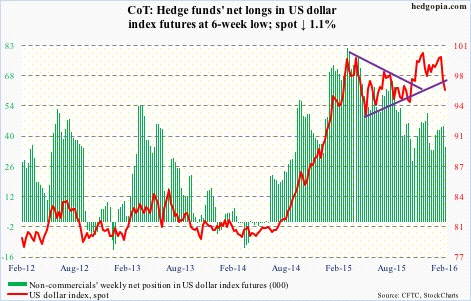
US Dollar Index: On a daily chart, the index is grossly oversold, and the action on both Thursday and Friday suggest a reprieve is in order at least near-term.
That said, the nearest resistance lies at just under 97, which also approximates the 200-day moving average (96.88).
Non-commercials continue not to show enthusiasm for the dollar index. Net longs dropped 22 percent w/w.
Currently net long 35k, down 9.9k.
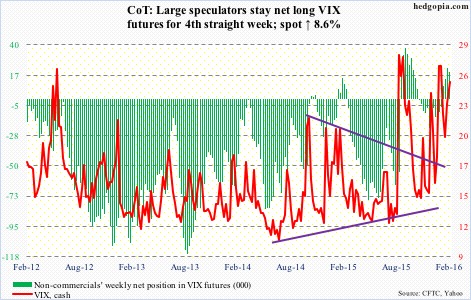
VIX: Spot VIX likely flashed a spike-reversal signal on Thursday, surging to 30.90 intra-day just outside the upper Bollinger Band. Friday, it closed at 25.40. There is plenty of room near-term for it to continue lower.
Intermediate-term, however, the 50-day moving average is now rising, as is its 200-day cousin, so they should provide support.
Incidentally, using intra-day highs on Thursday, the VIX-to-VXV ratio spiked to 1.05. This was followed by an intra-day reading of a 1.11 in the prior week. These are high readings, and once they begin to come under pressure, stocks tend to do well.
Currently net long 19.7k, down 2.8k.
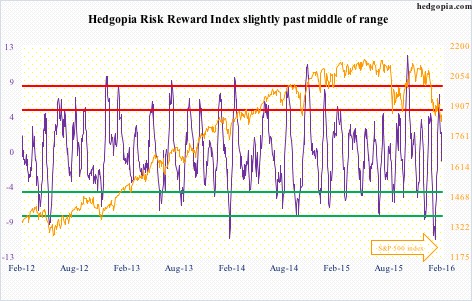
Hedgopia Risk Reward Index
http://www.hedgopia.com/cot-peek-into-future-through-futures-30/
• George.
Click on "In reply to", for Authors past commentaries.
* February 13, 2016
The following are futures positions of non-commercials as of February 9, 2016. Change is week-over-week.
E-mini S&P 500: In the week ended Wednesday, another $1.5 billion left U.S.-based equity funds (courtesy of Lipper). One has to go back to the week ended December 30th to see inflows (to the tune of $10 billion). Since then, there have been six straight weeks of outflows, totaling a whopping $35.4 billion.
That said, during the week ended Thursday, SPY, the SPDR S&P 500 ETF, did attract a decent amount – $5.9 billion, to be exact (courtesy of ETF.com). This was before Friday’s 2.1 percent rally.
Flows need to cooperate for this rally to have legs. Obviously, 1880 is huge. Not only does this resistance go back to March 2014, but is also a confluence of 10- and 20-day moving averages.
Currently net short 234.3k, up 8.4k.

Nasdaq 100 index (mini): Down as much as 3.4 percent on Monday’s intra-day lows, the Nasdaq 100 had an impressive end to the week – only down 0.13 percent. Has tons of room to rally from here – if nothing else just to unwind oversold conditions, both daily and weekly.
The nearest resistance lies at just under 4100, and the line can be drawn as far back as September 2014. Shorter-term averages lie around there as well, and they are still dropping. More consolidation is needed so they begin to hook up.
In the week ended Thursday, $665 million came out of QQQ, the PowerShares Nasdaq 100 ETF (courtesy of ETF.com).
Non-commercials continue to reduce net longs – now sub-10k. Holdings are at a 19-week low.
Currently net long 9.6k, down 12.1k.

Russell 2000 mini-index: In the week ended Wednesday, $492 million moved into IWM, the iShares Russell 2000 ETF (courtesy of ETF.com).
This was before Thursday’s action when the January 20th low was breached before staging a mini-reversal. A rally is possible near-term, but needs to first take out 985 and then 1000.
Non-commercials reduced net shorts by 20 percent.
Currently net short 49.5k, down 12.4k.

US Dollar Index: On a daily chart, the index is grossly oversold, and the action on both Thursday and Friday suggest a reprieve is in order at least near-term.
That said, the nearest resistance lies at just under 97, which also approximates the 200-day moving average (96.88).
Non-commercials continue not to show enthusiasm for the dollar index. Net longs dropped 22 percent w/w.
Currently net long 35k, down 9.9k.

VIX: Spot VIX likely flashed a spike-reversal signal on Thursday, surging to 30.90 intra-day just outside the upper Bollinger Band. Friday, it closed at 25.40. There is plenty of room near-term for it to continue lower.
Intermediate-term, however, the 50-day moving average is now rising, as is its 200-day cousin, so they should provide support.
Incidentally, using intra-day highs on Thursday, the VIX-to-VXV ratio spiked to 1.05. This was followed by an intra-day reading of a 1.11 in the prior week. These are high readings, and once they begin to come under pressure, stocks tend to do well.
Currently net long 19.7k, down 2.8k.

Hedgopia Risk Reward Index

http://www.hedgopia.com/cot-peek-into-future-through-futures-30/
• George.
Click on "In reply to", for Authors past commentaries.
Information posted to this board is not meant to suggest any specific action, but to point out the technical signs that can help our readers make their own specific decisions. Your Due Dilegence is a must!
• gtsourdinis


