


| Followers | 0 |
| Posts | 148553 |
| Boards Moderated | 7 |
| Alias Born | 03/10/2004 |
Saturday, February 06, 2016 8:12:29 AM
Peek Into Future Through Futures
* February 6, 2016
The following are futures positions of non-commercials as of February 2, 2016. Change is week-over-week.
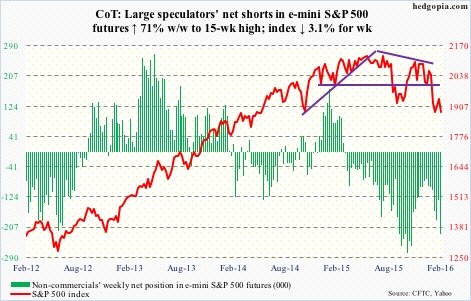
E-mini S&P 500: Heard someone on TV the other day citing 2017 earnings estimates to argue valuation support for stocks. Really? 2017? Not 2016? The year has barely started, and if one has to go all the way out to 2017, there has got to be a reason. There is.
Operating earnings estimates for 2017 started out at $141.11 three weeks ago and as of January 29th stood at $140.31. Based on these earnings, the S&P 500 trades at less than 13.5x – not terribly cheap but not very expensive either. Try to value it using 2016 estimates of $121.87, and the multiple jumps to just under 15.5x.
Even more important, how reliable are these estimates? Not very. In February last year, 2016 was expected to come in at $137.50, which has so far been slashed by more than 11 percent. Similarly, from peak estimates to the present, 2015 has been cut by more than 23 percent.
Unlike in the past, the public has easy access to these numbers, and they are probably beginning to take notice of earnings deceleration.
Money continues to leave stocks. In the week ended Wednesday, another $6.5 billion left U.S.-based equity funds (courtesy of Lipper). In the past five weeks – since 2016 started – $33.9 billion has been withdrawn, and $42.5 billion since September 30th last year.
Separately, as of Thursday, $2 billion came out of SPY, the SPDR S&P 500 ETF (courtesy of ETF.com).
Year-to-date, the S&P 500 is down eight percent, but it also rallied 7.4 percent off of the January 20th low before coming under pressure. Daily momentum indicators are overbought. That low likely is in play.
Non-commercials aggressively added to net shorts.
Currently net short 225.9k, up 94k.
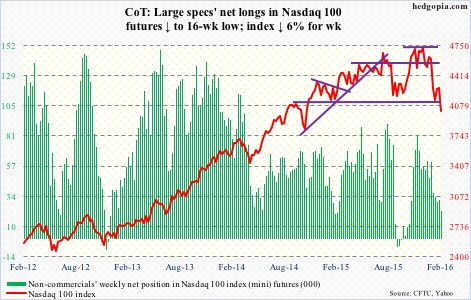
Nasdaq 100 index (mini): Down six percent for the week, the Nasdaq 100 continues to underperform its major U.S. peers. Here is the problem: It is a market-cap-weighted index.
The top five weights in QQQ, the Nasdaq 100 ETF, are: Apple (AAPL), 11.4 percent; Alphabet (GOOGL, formerly Google), 9.2 percent (both A and C); Microsoft (MSFT), 8.5 percent; Amazon (AMZN), 5.8 percent; and Facebook (FB), 4.5 percent.
Last year, the ETF rallied 9.4 percent, better than its U.S. peers. AAPL was a dud, down three percent, but the rest more than made up for this. AMZN surged 117.8 percent, GOOGL 46.6 percent, FB 34.2 percent, and MSFT 22.7 percent.
So far this year, QQQ is down 12.3 percent, with contribution from all top fives. AAPL is down 10.2 percent, GOOGL 9.5 percent, MSFT 9.6 percent, AMZN 25.7 percent, and FB 0.6 percent.
And there are signs of exhaustion.
QQQ had red candles in December and January, and so far this month. This followed a monthly doji in November. Similarly, AMZN, which more than doubled last year, had a monthly doji in December, followed by a down January and a down February. Now a laggard, AAPL struggled in the $130 area from February to July last year, before giving way in August.
Similarly, after breaking out of a three-month horizontal resistance at $108 last week, FB on Tuesday produced a long-legged doji right outside the upper Bollinger Band. Also on Tuesday, in a high-volume, post-earnings session, GOOGL produced a shooting star, preceded by a doji on Monday.
Non-commercials continue to reduce net longs.
Currently net long 21.7k, down 8.5k.
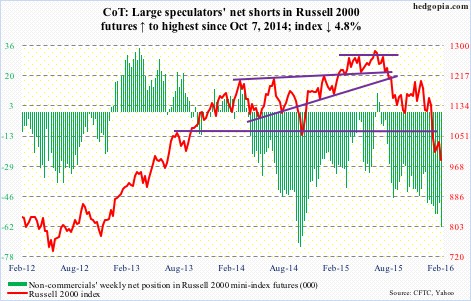
Russell 2000 mini-index: In the week ended Thursday, $702 million came out of IWM, the iShares Russell 2000 ETF (courtesy of ETF.com).
The index acts weak. A retest of the January 20th low (958) looks imminent.
Currently net short 61.9k, up 13.1k.
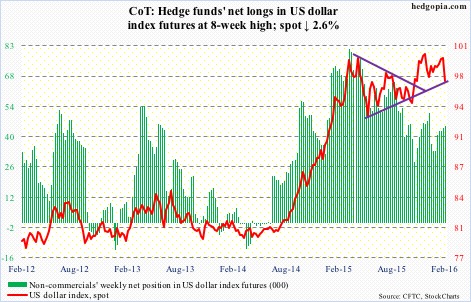
US Dollar Index: Collapsed 1.6 percent on Wednesday. Was it reacting to January’s ISM non-manufacturing PMI, which dropped 2.3 points to 53.5 – the lowest since February 2014? Possibly.
That said, unlike U.S. manufacturing, non-manufacturing is still in expansion. Manufacturing has languished sub-50 the past four months.
Or was it reacting to the 10-year yield that swooned to 1.79 percent intra-day Wednesday before ending up two basis points to 1.88 percent? (Incidentally, with a shooting star on Wednesday, TLT, the iShares 20+ Year Treasury Bond Fund, looks like a short near-term.)
Rate-hike odds are fading… fast. The dollar index had hugged the 50-day moving average for nearly two months. Once it lost that, the reaction has been violent.
The question is, is it a double-top? The 93-plus is yet to be breached. The daily chart is oversold, with encouraging action on Friday. It now faces resistance in the 98 range.
One thing is crystal clear. Non-commercials do not wax enthusiastic over the dollar’s prospects.
Currently net long 44.9k, up 647.
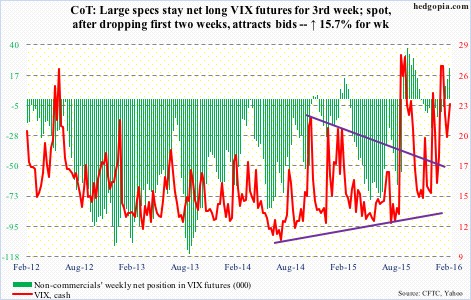
VIX: On Monday, volatility bulls stepped up to support the 50-day moving average, which is now slightly rising. Ditto with the 200-day.
Near-term, there is room to unwind daily oversold conditions.
Currently net long 22.5k, up 8.3k.
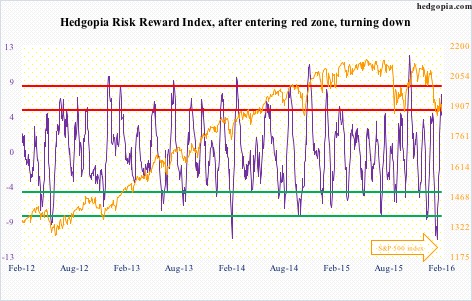
Hedgopia Risk Reward Index
http://www.hedgopia.com/cot-peek-into-future-through-futures-29/
• George.
Click on "In reply to", for Authors past commentaries.
* February 6, 2016
The following are futures positions of non-commercials as of February 2, 2016. Change is week-over-week.
E-mini S&P 500: Heard someone on TV the other day citing 2017 earnings estimates to argue valuation support for stocks. Really? 2017? Not 2016? The year has barely started, and if one has to go all the way out to 2017, there has got to be a reason. There is.
Operating earnings estimates for 2017 started out at $141.11 three weeks ago and as of January 29th stood at $140.31. Based on these earnings, the S&P 500 trades at less than 13.5x – not terribly cheap but not very expensive either. Try to value it using 2016 estimates of $121.87, and the multiple jumps to just under 15.5x.
Even more important, how reliable are these estimates? Not very. In February last year, 2016 was expected to come in at $137.50, which has so far been slashed by more than 11 percent. Similarly, from peak estimates to the present, 2015 has been cut by more than 23 percent.
Unlike in the past, the public has easy access to these numbers, and they are probably beginning to take notice of earnings deceleration.
Money continues to leave stocks. In the week ended Wednesday, another $6.5 billion left U.S.-based equity funds (courtesy of Lipper). In the past five weeks – since 2016 started – $33.9 billion has been withdrawn, and $42.5 billion since September 30th last year.
Separately, as of Thursday, $2 billion came out of SPY, the SPDR S&P 500 ETF (courtesy of ETF.com).
Year-to-date, the S&P 500 is down eight percent, but it also rallied 7.4 percent off of the January 20th low before coming under pressure. Daily momentum indicators are overbought. That low likely is in play.
Non-commercials aggressively added to net shorts.
Currently net short 225.9k, up 94k.

Nasdaq 100 index (mini): Down six percent for the week, the Nasdaq 100 continues to underperform its major U.S. peers. Here is the problem: It is a market-cap-weighted index.
The top five weights in QQQ, the Nasdaq 100 ETF, are: Apple (AAPL), 11.4 percent; Alphabet (GOOGL, formerly Google), 9.2 percent (both A and C); Microsoft (MSFT), 8.5 percent; Amazon (AMZN), 5.8 percent; and Facebook (FB), 4.5 percent.
Last year, the ETF rallied 9.4 percent, better than its U.S. peers. AAPL was a dud, down three percent, but the rest more than made up for this. AMZN surged 117.8 percent, GOOGL 46.6 percent, FB 34.2 percent, and MSFT 22.7 percent.
So far this year, QQQ is down 12.3 percent, with contribution from all top fives. AAPL is down 10.2 percent, GOOGL 9.5 percent, MSFT 9.6 percent, AMZN 25.7 percent, and FB 0.6 percent.
And there are signs of exhaustion.
QQQ had red candles in December and January, and so far this month. This followed a monthly doji in November. Similarly, AMZN, which more than doubled last year, had a monthly doji in December, followed by a down January and a down February. Now a laggard, AAPL struggled in the $130 area from February to July last year, before giving way in August.
Similarly, after breaking out of a three-month horizontal resistance at $108 last week, FB on Tuesday produced a long-legged doji right outside the upper Bollinger Band. Also on Tuesday, in a high-volume, post-earnings session, GOOGL produced a shooting star, preceded by a doji on Monday.
Non-commercials continue to reduce net longs.
Currently net long 21.7k, down 8.5k.

Russell 2000 mini-index: In the week ended Thursday, $702 million came out of IWM, the iShares Russell 2000 ETF (courtesy of ETF.com).
The index acts weak. A retest of the January 20th low (958) looks imminent.
Currently net short 61.9k, up 13.1k.

US Dollar Index: Collapsed 1.6 percent on Wednesday. Was it reacting to January’s ISM non-manufacturing PMI, which dropped 2.3 points to 53.5 – the lowest since February 2014? Possibly.
That said, unlike U.S. manufacturing, non-manufacturing is still in expansion. Manufacturing has languished sub-50 the past four months.
Or was it reacting to the 10-year yield that swooned to 1.79 percent intra-day Wednesday before ending up two basis points to 1.88 percent? (Incidentally, with a shooting star on Wednesday, TLT, the iShares 20+ Year Treasury Bond Fund, looks like a short near-term.)
Rate-hike odds are fading… fast. The dollar index had hugged the 50-day moving average for nearly two months. Once it lost that, the reaction has been violent.
The question is, is it a double-top? The 93-plus is yet to be breached. The daily chart is oversold, with encouraging action on Friday. It now faces resistance in the 98 range.
One thing is crystal clear. Non-commercials do not wax enthusiastic over the dollar’s prospects.
Currently net long 44.9k, up 647.

VIX: On Monday, volatility bulls stepped up to support the 50-day moving average, which is now slightly rising. Ditto with the 200-day.
Near-term, there is room to unwind daily oversold conditions.
Currently net long 22.5k, up 8.3k.

Hedgopia Risk Reward Index

http://www.hedgopia.com/cot-peek-into-future-through-futures-29/
• George.
Click on "In reply to", for Authors past commentaries.
Information posted to this board is not meant to suggest any specific action, but to point out the technical signs that can help our readers make their own specific decisions. Your Due Dilegence is a must!
• gtsourdinis


