 News
News  Market Data
  Discover
Support: 888-992-3836
Copyright © 2023 InvestorsHub Inc.


Register for free to join our community of investors and share your ideas. You will also get access to streaming quotes, interactive charts, trades, portfolio, live options flow and more tools.
AFFL will explode to $105.3768, $18.3515, and $16.568 respectively based on its two peer's MV at peak and its Record-High MV!
LOL, even buying its OTC peer (FCCN: Record-High $41.3) at 07/12/2024-high $5.15 = buying AFFL at $13.1402 which is 328.505 Times of current Super-Ridiculous-Low price $0.04! Which means Easy 328-Bagger Giant & Quick Rally here!
LOL, even buying its OTC-CI-tier peer (SSHT: Record-High $4.1) at June's High $0.95 = buying AFFL at $4.2522 which is 106.305 Times of current Super-Ridiculous-Low price $0.04! Which means Easy 106-Bagger Giant & Quick Rally here! Note, SSHT has -$54,256 Deeper Negative Net Asset or Shareholder's Equity Value v.s. AFFL only has -$33,935 Minor Negative Net Asset or Shareholder's Equity Value!
So, AFFL is Super Undervalued now!
AFFL is the Cheapest CLEAN-Shell with the Sought-After FIXED Super Tiny SS and Debt-FREE Excellent Financial Balance Sheet plus Only A Few Millions Shares Minor Float Available For Trading! Which means that this Diamond-In-Rough can Easily and Quickly soar Over 100-Bagger from here with just about A Couple Of Millions shares of Slapping-Volumes...
AFFL is also at Hyper Oversold status based on its Record-High $6.00!
Note, its recent high was $0.089!
$AVOI .0196:
https://stockcharts.com/h-sc/ui?s=AVOI
COLUMBA High-Grade Silver Mine
• Large Drilling Program to define and expand high grade for Maiden Resource.
LACIGARRA*
• (1) Build new geological model to optimize grade with the intent to (2) advance to updated resource and (3) PEAdecision.
Kootenay Silver -
https://kootenaysilver.com/assets/docs/2022-NOVEMBER-Website-Corporate-Presentation-FINAL.pdf
With 16,5% Gain In The Silver Spot Price In 1 Month - IMO The Silver Bull Run Has Started.
Do always your own d d
GLTA
GoldMine Developer Starts Construction 2023
https://investorshub.advfn.com/Euro-Sun-Mining-Inc-16633
3 weeks trend up for silver; 25 July 18.40 dollars - 15 August 20.82 dollars
https://goldprice.org/gold-price-chart.html
Potential leverage to the current increase in the silver price;
https://investorshub.advfn.com/Kootenay-Silver-Inc-19323
CGAC SBES
Both Caren Currier plays taking off
PBHG: A Fully-Reporting Current-Information-tier Marijuana & NFT stock! Easy 11-Bagger Quick rally to hit last-February-high 0.0055 again...
Buying its peer INND at 0.098 = buying PBHG at 0.1522 which is 304.4 Times of Bottom price 0.0005!
So PBHG is Much Much Much Cheaper than INND and LWLG now!
#DDAmanda Chart on: $BCEL Up 211%:
You can scan for these before they run.

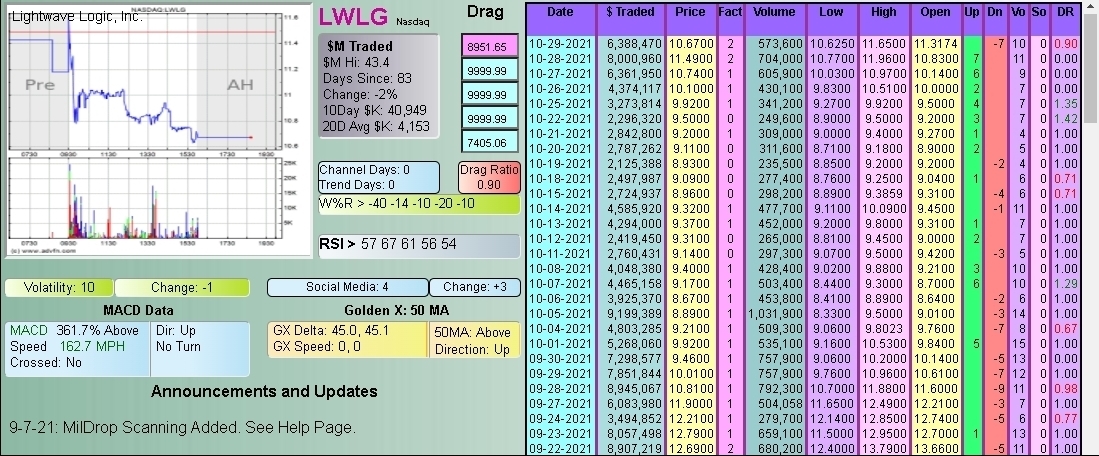
What the Fact (Factor) Column is:
The Factor is a proprietary indicator used for scanning in #DDAmanda.
It's defined as Today's $Traded divided by the average daily $Traded (20 day avg).
SO, if a stock has say a 10 Factor that day, it means she traded 10 Times the $ she normally trades.
That's significant, and many times indicates that a run in the stock is coming.

#DDAmanda Chart on: $LWLG
You can scan for these before they run.
#DDAmanda Promo Code: dsh888
What the Fact (Factor) Column is:
The Factor is a proprietary indicator used for scanning in #DDAmanda.
It's defined as Today's $Traded divided by the average daily $Traded (20 day avg).
SO, if a stock has say a 10 Factor that day, it means she traded 10 Times the $ she normally trades.
That's significant, and many times indicates that a run in the stock is coming.
$SNPW TWEET>.015^ ($200m Solar Farms ongoing): Design all done for Durango using trackers $$, working on Queensland layouts and plans. Between these two we will have over 150MW in our solar portfolio platform. Cant wait till these go live, and as we also work on expanding our waste to energy platform. $SNPW #solar #waste Design all done for Durango using trackers $$, working on Queensland layouts and plans. Between these two we will have over 150MW in our solar portfolio platform. Cant wait till these go live, and as we also work on expanding our waste to energy platform. $SNPW #solar #waste
2:36 PM · Jun 25, 2021·Twitter Web App
icymi
Latest SNPW NEWS/UPDATES on the Solar Projects.
Stock Price Forecast $2+ in approx 1 year
More Solar Farms Needed> https://www.energy.gov/articles/doe-releases-solar-futures-study-providing-blueprint-zero-carbon-grid
GREAT NEWS FOR $SNPW
GROSSLY UNDERVALUED
NEWS SOON
#DDAmanda Chart on: $AMC
You can scan for these before they run.
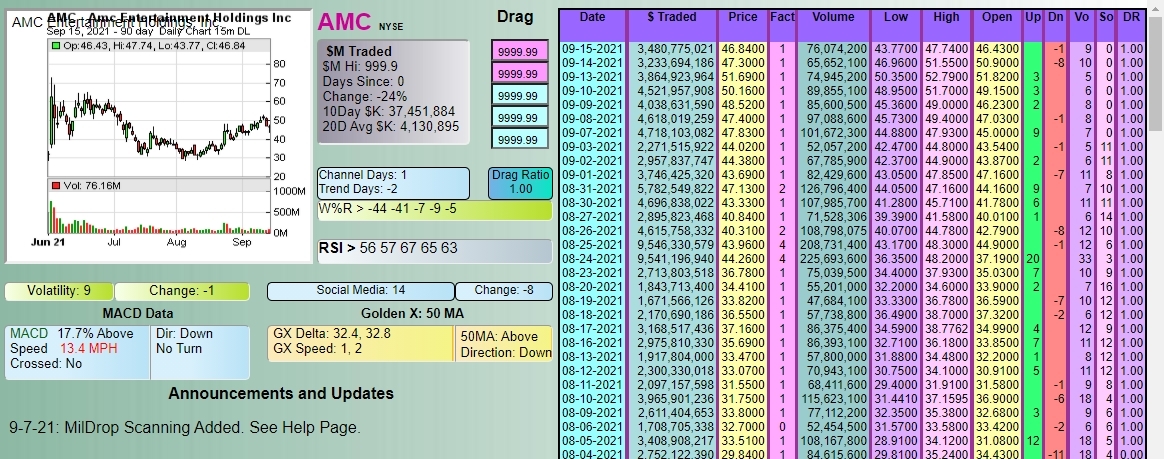
What the Fact (Factor) Column is:
The Factor is a proprietary indicator used for scanning in #DDAmanda.
It's defined as Today's $Traded divided by the average daily $Traded (20 day avg).
SO, if a stock has say a 10 Factor that day, it means she traded 10 Times the $ she normally trades.
That's significant, and many times indicates that a run in the stock is coming.
Re: INCC .0032
#DDAmanda Chart on: $NWBO
You can scan for these before they run.
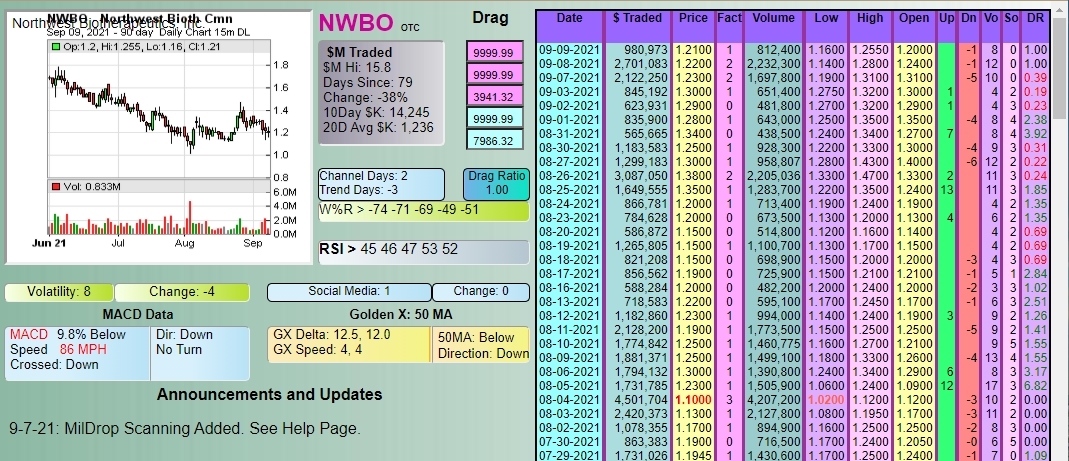
#DDAmanda Promo Code: DSH888
What the Fact (Factor) Column is:
The Factor is a proprietary indicator used for scanning in #DDAmanda.
It's defined as Today's $Traded divided by the average daily $Traded (20 day avg).
SO, if a stock has say a 10 Factor that day, it means she traded 10 Times the $ she normally trades.
That's significant, and many times indicates that a run in the stock is coming.
FRCN: "REINSTATEMENT" with Nevada on August 23! At ridiculous low New bottom 0.0003 now with mere 520,333,445 shares FIXED Tiny OS! On Big Fire most recently! 250% Big bouncing to 0.0014 from 0.0004 most recently! Easy to hit recent high 0.0024 again...
Buying its Same-Bottom peer (INND) at recent high 0.098 = buying FRCN at 1.129 which is 3763.333 Times of current ridiculous low price 0.0003!
Buying its Same-most-recent-low (0.0004) peer (HPIL) at 0.0119 = buying FRCN at 0.3241 which is 648.2 Times of current ridiculous low price 0.0003!
Buying its Same-Bottom peer (WDSL) at recent high 3.00 = buying FRCN at 0.2529 which is 843 Times of current ridiculous low price 0.0003!
Buying its Same-most-recent-low (0.0004) peer (MDCE) at 0.03 = buying FRCN at 0.1708 which is 569.333 Times of current ridiculous low price 0.0003!
Buying its Same-Bottom peer (ENTI) at recent high 0.0018 = buying FRCN at 0.1035 which is 345 Times of current ridiculous low price 0.0003!
Buying its Same-Bottom peer (NOHO) at recent high 0.0038 = buying FRCN at 0.0731 which is 243.667 Times of current ridiculous low price 0.0003!
So FRCN is Much Much Much Much Much Cheaper than IMTL, CLOV, INND, HPIL, WDSL, MDCE, ENTI, and NOHO now!
ORMTQ: Easy 1000-Bagger rally killer! It is the Cheapest CH11-CLEAN-Shell with the FIXED Sought-After Super Tiny SS! A ideal Reverse-Merger candidate or Custodianship-Taking-Over target! Easy to shoot the Dime Land based on its peer's market value! Huge potential to hit the Dollar Land in the short term!
Its peer ALLMQ (the New symbol is "ALLM": 245,865,278/500M shares Large OS/AS) did run 36.4-Bagger from $0.0022 to $1.5 within only several months! To match the Same market value, ORMTQ (18,662,272/100M shares Small OS/AS) will create a New Record-High $19.7617 v.s. at Giant discount price $0.01 now!
Buying its peer CBLAQ at its Post-CH11-High $0.33 = buying ORMTQ at $3.4759 vs at ridiculous low price $0.01 now!
So ORMTQ is Much Much Much Much Much Cheaper than CBLAQ and ALLMQ now!
$NAK Northern Dynasty Minerals The Pebble Mine contains billions of pounds of rare earth elements. It is rich in two important rare minerals—palladium and rhenium, containing enough rhenium to supply the entire world’s needs for nearly half a century. Rhenium is used in the construction of military jet engines and as a catalyst in high-octane fuel combustion. https://www.instituteforenergyresearch.org/renewable/pebble-mine-could-reduce-dependence-on-china-for-critical-metals/
$CEMI Coronavirus Testing
$IDEX Ideanomics is shaping the future of commercial fleet operations by assembling a synergistic ecosystem of subsidiaries and investments across the three key pillars of EV: Vehicles, Charging, and Energy. With cutting-edge proven solutions, we are reducing the total cost of ownership for fleet operators, together with harmful greenhouse gas emissions.
https://ideanomics.com/
Re: IMTL .0021
Hemp Fusion CBD New Quarterly On Monday
HempFusion Reports Q1, 2021 Financial Results
T.CBD.U | May 17, 2021
HempFusion Wellness Inc. (TSX: CBD.U) (OTCQX: CBDHF) (FWB:8OO) (“HempFusion” or the “Company”), an industry leader in full-spectrum cannabidiol (CBD) hemp extract wellness products and probiotics, today reported financial results for the first quarter ended March 31, 2021. All dollars are stated in US Dollars.
Q1-2021 Financial Highlights
Consolidated revenue increased 7.6% to $983,496 from $913,646 in Q4-2020
DTC sales increased 59.3% to $244,255 from $153,305 in Q4-2020
International sales increased to $75,994 from nil in Q4-2020
Gross profit of $280,205 or 28.5% of net revenue
Operating expenses were $6,306,703, an increase of 42.9% from $4,414,792 in Q1-2020, primarily attributed to IPO related expenses as well as marketing and digital related expenses
Strong cash position ending the quarter at $17,074,030
Q1-2021 Business Highlights
Completed a $17 million initial public offering (IPO) and commenced trading on the Toronto Stock Exchange (the “TSX”), becoming the first U.S.-based CBD and wellness products company to list directly on the TSX (senior board).
Became the No. 2 most recognized CBD brand in America according to Brightfield Group
As of the end of January 2021, NielsenIQ data rank HempFusion as the No. 1 in product sales and units sold in one of the largest food/drug/mass (“FDM”) retailers
E-Commerce success has shown a 62% increase in online traffic with a significant increase in conversion including a shift from 16.8% online sales in Q4-2020 as a percent of net revenue to 24.8% in Q1-2021
The Company launched the Probulin store on Amazon and early 2021 traction is encouraging. Consolidated net revenue for the three months ended March 31, 2021 increased 7.6% quarter-over-quarter to $983,496 versus $913,646 in Q4-2020. Direct to consumer (“DTC”) e-commerce net revenue increased 59.3% reflecting increased marketing efforts, a targeted DTC team and targeted digital promotions.
Not only did sales increase for both Probulin and HempFusion but the traffic has increased by 62% in Q1 2021 versus Q4 2020 with a conversion rate increase for Probulin of 2.1% to 3.2% and a current conversion rate for HempFusion of 3.4%. E-commerce accounted for 24.8% of net revenue in the first quarter of 2021 versus 16.8% for Q4, 2020. HempFusion's Probulin has seen 10% or greater month-over-month growth since launching on Amazon .
Officially launched Probulin on the world's largest e-commerce platform, Alibaba's Tmall Global, with HempFusion CBD following in a subsequent Q2 event!
Submitted dossier to the United Kingdom's Regulatory Food Safety Agency
"With nearly all international business paused due to COVID throughout 2020 and Q1 2021, and with slower than expected reopenings, the Company still achieved an incremental QoQ growth of 7.6% . Now, with vaccine rollouts taking place across the country, we are encouraged with reopening rates and excited that our sales, which currently take place in approximately 75% brick-and-mortar businesses, are beginning to reopen," commented Jason Mitchell, N.D., HempFusion's Co-Founder and Chief Executive Officer.
"We remain committed to developing new revenue channels and have entered additional countries including China, Ireland, and the United Kingdom, and we are excited with subsequent quarterly events in which new purchase orders were received, showing early signs of the return of international business. These international POs have the potential to drive millions in revenue. We are working feverishly to accelerate sales through organic channels and the continued pursuit of M&A opportunities; early indications have Q2 shaping up to be our best quarter yet," continued Dr. Mitchell.
Statements of Loss and Comprehensive Loss
The Below is from the Unaudited Condensed Interim Financial Statements for the Three Months Ended March 31, 2021 and 2020; Please Refer to the Complete Report, Including the Notes, Other Statements and Other Contents Therein.
Consolidated net revenue for the three months ended March 31, 2021 increased 7.6% quarter-over-quarter to $983,496 versus $913,646 in Q4-2020, and DTC e-commerce net sales increased 59.3% reflecting increased marketing efforts, a targeted DTC team, and targeted digital promotions. Site traffic increased by 62%, and conversion rates increased to 1.9%. DTC accounted for 24.8% of total revenue in the first quarter of 2021 versus 16.8% for Q4-2020.
International sales increased to $75,994 from nil showing a return to normal from Q4-2020, and early indication of future international orders accelerating and producing incremental quarterly gains. H empFusion maintains a leadership position in retailers across the United States, including the #1 in sales by dollar volume and SKUs in one of the top five largest FDM channel retailers.
Gross profit of $280,205 or 28.5% of net revenue is primarily attributed to improvement in inventory and supply chain management.
Operating expenses were $6,306,703, an increase of 42.9% from $4,414,792 in Q4-2020, primarily attributed to IPO related expenses, including D&O insurance and listing fees, as well as marketing and digital expenses.
Balance Sheet | Cash Position
The Below is from the Unaudited Condensed Interim Financial Statements for the Three Months Ended March 31, 2021 and 2020; Please Refer to the Complete Report, Including the Notes, Other Statements and Other Contents Therein.
The Company ended Q1-2021 with a strong cash position of $17,074,030 ensuring the capital requirements of the Company are met, with ample room for strategic M&A. The Company incurred $2,655,134 in general and administrative expenses and $3,651,569 in sales and marketing expenses.
“In 2019, HempFusion (combined with Probulin on a pro forma basis with respect to 2019) achieved net revenue of $4,627,544, followed by $3,823,638 in 2020. The impact COVID has had on our business is clear. We have adapted. It’s important to note we have strategically bolstered the Company’s online presence with the help of new channels such as Amazon for Probulin and Alibaba’s Tmall for both brands. Our efforts have resulted in early traction and success, as we continue to strengthen our foothold in the direct-to-consumer CBD market. This quarter showed a strong DTC sales increase of 59.3%. We expect this trend to continue as DTC now accounts for 24.8% of total revenue in the first quarter of 2021 versus 16.8% for Q4-2020,” commented Dr. Mitchell.
Conference Call
Management of the Company will host a conference call to discuss the Company's first quarter 2021 results at Monday, May 17, 2021 at 4:15 p.m., Eastern Time. To participate in the call, please dial 888-506-0062. For international callers, dial 973-528-0011. Use Participant Code: 795055. To join the webcast: https://www.webcaster4.com/Webcast/Page/2710/41342 .
A replay will be available from the Investor Relations section of HempFusion’s website at HempFusion.com/corporate-information .
ABOUT HEMPFUSION;
HempFusion CBD Wellness to buy female-focused CBD product group Sagely Enterprises
BUNM: Ready to soar! Its Heavy-Debt & Negative-Equity peer (PDMI) just exploded to 0.0016 from 0.0002 yesterday! BUNM has Much-Much--Lower SS, Much-Much-Stronger financial data, Debt-Free, and CLEAN-shell status!
Buying its peer AFTC at $0.0038 = buying BUNM at $0.099 which is 198 Times of New bottom price $0.0005!
Buying its peer MDCE at $0.03 = buying BUNM at $0.0322 which is 64.4 Times of New bottom price $0.0005!
Buying its peer PDMI at last-Friday's high 0.0016 = buying BUNM at 0.0019 which is 52-week-high or 3.2 Times of current price 0.0005!
So BUNM is Much Much Much Cheaper than AFTC, PDMI, and MDCE now!
$IBIO iBio, Inc. (NYSEA:IBIO) (“iBio” or the “Company”), a biotech innovator and biologics contract manufacturing organization, today announced that preclinical studies of IBIO-202, its subunit vaccine candidate that targets the nucleocapsid protein (“N protein”) of SARS-CoV-2, demonstrated a robust, antigen-specific, memory T-cell response.
https://finance.yahoo.com/news/ibio-reports-successful-preclinical-immunization-211000069.html
PDMI is Much Much Much cheaper than the majority of its peers! Ready to soar like MDCE, MWWC, and PUGE etc.!
$APTY Loaded up that Late Dip Friday... Strong_Rebound_Upcoming_Next Week_$$
Last weeks high .0185
100-300% possible Next Week!

ENAB: New 52-week-high today! As of 06/11/2021, only total 23,315,933 shares OS of which just 10,993,888 shares are floating and 12,322,045 shares are restricted!
To match the Same market value with its peer INND at 0.0018, PDMI will hit a New 52-week high $23.8964 which is 1651.45 Times of its current ridiculous low 52-week-high $0.01447!
So ENAB is Much Much Much Much Much Cheaper than INND and ECPL now!
Great Silver Panther Announces 2021 AGM Results
https://finance.yahoo.com/news/great-panther-announces-2021-agm-112000301.html?.tsrc=rss
Current Rating; https://www.barchart.com/stocks/quotes/GPL/overview
$NAK The Pebble Project is the most significant undeveloped copper and gold resource in the world.
https://instituteforenergyresearch.org/renewable/pebble-mine-could-reduce-dependence-on-china-for-critical-metals/
Medical Marijuana Inc $MJNA CEO Honored as 2020 Best Business Leader in the United States by Global Brands Magazine
https://www.globenewswire.com/news-release/2021/01/19/2160682/0/en/Medical-Marijuana-Inc-CEO-Honored-as-2020-Best-Business-Leader-in-the-United-States-by-Global-Brands-Magazine.html
$MJNA First Company to Have CBD Products Listed in U.S. Physicians’ Desk Reference
$SNDL Sundial Growers
$NKLA The 7 analysts offering 12-month price forecasts for Nikola Corporation have a median target of 20.00, with a high estimate of 30.00 and a low estimate of 13.00. The median estimate represents a +87.62% increase from the last price of 10.66.
https://money.cnn.com/quote/forecast/forecast.html?symb=nkla
$EEENF has $14.85 Million in cash
https://finance.yahoo.com/quote/EEENF/key-statistics?p=EEENF
Nikola Motor Company $NKLA Hydrogen Fueling Station Network
EIPC .0015 down -42% guess monday was nothing
EIPC >004 outta no where been holding forever wonder what up
MWWC: Super-Tiny-SS player! Super Undervalued now! At Hyper Oversold status! MWWC is the Cheapest 0.0001-Bottom OTC stock! Reverse-Merger or Buy-Out Ready! Ideal Custodianship-Taking-Over target! Go-Current very soon...
To match the Same market value with AFTC at $0.0038, MWWC will create a New 52-week high $6.8735 which is 17,183.75 Times of New bottom price $0.0004!
To match the Same market value with FTXP at $0.0155, MWWC will create a New 52-week-high $0.9317 which is 2,329.25 Times of New bottom price $0.0004!
So MWWC is Much Much Much Cheaper than AFTC, FTXP, and SNDD now!
LGTT: A GME-Type-Huge-Shorting-Squeezing OTC stock! 52M Shorted shares which is the Largest number among over 1,000 of 0.0001-botom peers! Only 469M shares of Maxmial trading volume in history! Easy to soar 100-Bagger Quickly!
To match the Same market value with RITE at 0.0033, LGTT will create a New 52-week high 0.0040 which is 33 Times of its bottom price 0.0001!
To match the Same market value with BOTY at 0.0089, LGTT will create a New 52-week high 0.0079 which is 79 Times of its bottom price 0.0001!
So LGTT is much much much cheaper than RITE, BOTY, and PLYZ now!
$SKDI keeps pulling in solid weekly sales, growing company:
https://finance.yahoo.com/news/sun-kisseds-sflmaven-exceeds-220k-130000835.html
Sun Kissed's SFLMaven Exceeds $220K in Weekly Sales on Strong Thursday Night Auction Results
New York, New York--(Newsfile Corp. - March 10, 2021) - Sun Kissed Industries Inc. (OTC Pink: SKDI), d/b/a SFLMaven ("SFLMaven" or the "Company"), a leading provider of high-end luxury goods, is excited to announce another strong result in its latest "Famous Thursday Night Auction" event.
For the week ended Thursday, March 4th, 2021, the Company booked a total of $223k in gross weekly sales, including c.$196k from its Thursday Night Auction event alone.
Thursday's auction was highlighted by the sale of an 18k Art Deco 19.97ct Diamond Ruby Filigree bracelet, which closed for more than $6,700, and an 18k 8.06ct VS/F diamond Eternity Band, which closed for $4,660.
"This was another impressive auction highlighted by a number of truly spectacular pieces, ultimately ending up in the hands of impassioned bidders - an exciting evening event that resulted in strong sales," noted Joseph Ladin, CEO of SFLMaven. "So far, 2021 has started with a bang for SFLMaven. We have generated a lot of buzz around our auction events, and we look forward to another strong show later this week."
Follow SFLMaven on Twitter: @sunkissinc
About Sun Kissed Industries, Inc.
Sun Kissed Industries Inc. (OTC Pink: SKDI), now doing business as SFLMaven, is a provider of high-end luxury goods to discerning clientele around the world. SFLMaven has been in business since 2003, driving more than $130 million in sales since inception. Well known for its "Famous Thursday Night Auction" events, the Company is currently a top-rated seller on Ebay and has earned over 98,000 positive feedbacks from customers on its Ebay sales platform. For more information, please visit us at www.sflmaven.com.
FORWARD-LOOKING STATEMENTS:
This press release may contain forward-looking statements, including information about management's view of Sun Kissed Industries Inc.'s future expectations, plans and prospects. In particular, when used in the preceding discussion, the words "believes," "expects," "intends," "plans," "anticipates," or "may," and similar conditional expressions are intended to identify forward-looking statements. Any statements made in this news release other than those of historical fact, about an action, event or development, are forward-looking statements. These statements involve known and unknown risks, uncertainties and other factors, which may cause the results of Sun Kissed, its subsidiaries and concepts to be materially different than those expressed or implied in such statements. Unknown or unpredictable factors also could have material adverse effects on Sun Kissed's future results. The forward-looking statements included in this press release are made only as of the date hereof. Sun Kissed cannot guarantee future results, levels of activity, performance or achievements. Accordingly, you should not place undue reliance on these forward-looking statements. Finally, Sun Kissed undertakes no obligation to update these statements after the date of this release, except as required by law, and also takes no obligation to update or correct information prepared by third parties that are not paid for by Sun Kissed.
SOURCE: Sun Kissed Industries Inc.
Corporate Contact
info@sflmaven.com
Public Relations
EDM Media, LLC
https://edm.media
(800) 301-7883
|
Followers
|
651
|
Posters
|
|
|
Posts (Today)
|
0
|
Posts (Total)
|
89270
|
|
Created
|
08/27/10
|
Type
|
Free
|
| Moderator SuperC | |||
| Assistants gumzsa pennyonfire funnyG986 | |||

If you find a symbol of value why on earth would you take a loss only too move on with less
money only too take a loss if that symbol doesn't move quickly enough either?
We've held stocks over a year to make a profit.
This is not gambling. This is not Vegas
Millionaires are not made overnight!
If you have the idea everything traded on iHub is a POS...
You've already lost the battle; please move on~
Remember the definition of insanity?
Doing the same thing over and over thinking you'll get different results!!!
If your Due Diligence or [virtue of hard work rather than the sin of careless] doesn't suggest you hold it until profits are available? Why are you trading/investing? STUPID!!!
Here at the Pro Traders Forum each MOD does his/her on thing.
This is what I do... SuperC in this order>>> I have a number of different trading/investtment strategies I've learned over the course of 19-years.... That is Different Foruma's!
One of Many
Find symbols that have not been played too death here on iHub
Find companies with unique intellectual property / patents / very interesting business models
Post
SYMBOL
Chart
Brief News
Why I like this
So in a NUTSHELL I prefer unique bottom plays, unique biz-models, companies with patents, companies not played too death and give you enough researched information so that YOU can make an informed decision after YOU further due diligence said company.
NOTE: You will see on a regular bases our STICKY NOTES posted with NEW SYMBOLS>>>>>
Why?
I like for frequent visitors too research new plays, just like myself even though YOU / I may not be playing said SYMBOL
Not everything you see in our Sticky Notes is being played....
Do not buy based on someone else buying or our notes... without further DD!
This is NOT a Promotion Station
STICKY NOTES are ALERTS_ONLY  with DD!
This is one Formula I use here, ONE of Many:
http://investorshub.advfn.com/boards/read_msg.aspx?message_id=70538131
At this forum you'll find:
10Day Alerts
Trading Strategies
Short & Long Term Picks
YOU NEED: Chart_Data + Stock_Data + iHub_Data = Buy?
A few important notes before you get started:
http://investorshub.advfn.com/boards/read_msg.aspx?message_id=88784820
http://investorshub.advfn.com/boards/board.aspx?board_id=21832
http://investorshub.advfn.com/boards/read_msg.aspx?message_id=75469893
http://investorshub.advfn.com/boards/read_msg.aspx?message_id=72280845
http://investorshub.advfn.com/boards/read_msg.aspx?message_id=71995122
http://investorshub.advfn.com/boards/read_msg.aspx?message_id=71995487
http://investorshub.advfn.com/boards/read_msg.aspx?message_id=65923174
http://investorshub.advfn.com/boards/read_msg.aspx?message_id=64052910
http://investorshub.advfn.com/boards/read_msg.aspx?message_id=63676196
http://investorshub.advfn.com/boards/read_msg.aspx?message_id=59316343
http://investorshub.advfn.com/boards/read_msg.aspx?message_id=61717463
http://investorshub.advfn.com/boards/read_msg.aspx?message_id=61888830
http://investorshub.advfn.com/boards/read_msg.aspx?message_id=64290958
http://investorshub.advfn.com/boards/read_msg.aspx?message_id=62160306&txt2find=opmg
For those interested in searching Pro Traders Forum in reference to 10Day Alerts, you can use the link below if your a paid subscriber. If your not a subscriber it's well worth what on average will only cost you about $ 0.75cents a day. Subscription link is listed at end of the ibox.
** You CANNOT be a successful investor without utilizing a Chart, iHub_Data plus Stock_Data. Our 1st choice is a 10Day Volume Alert **
Your premium subscription to Investors Hub renewed yesterday. Thank you for your premium subscription! The amount was $12.99
If you can't afford this you can't afford too trade!
Explaining a few basics of the 10Day Alert System with recent RUN: http://investorshub.advfn.com/boards/read_msg.aspx?message_id=68926148
We also try and not post anyting with an extreme float either way. The best floats for trading are between 10 million to 50 million.
10Day Volume Alerts Speak of: Unusual Trading Patterns But Very Little %Gains [A good thing ![]() ]
]
Since there are thousands of OTCBB stocks bought and sold each day, one of the features here is to look for unique PICKS ! Symbols, which haven't been played over and over again, and with the right tools show the possibility of being more than just a day trade.
We will be using a set formula, one in which has proven to be effective. It is a step-by-step process adding quick DD tools too effectively make a decision on whether or not to buy. Even if you decide not to buy, the values set with these tools WILL help you to become a better trader.
As you read through the ibox remember this FORMULA:
10Day Average Volume with 7 to10x disparity + Stock_Data + Ihub_Data = Should I Buy?
BEFORE the stock moves NOT AFTER A RUN
10Day Volume Average Search:
http://investorshub.advfn.com/boards/read_msg.aspx?message_id=63642662
http://investorshub.advfn.com/boards/read_msg.aspx?message_id=62100490
http://investorshub.advfn.com/boards/read_msg.aspx?message_id=62851937
http://investorshub.advfn.com/boards/read_msg.aspx?message_id=62607598
http://investorshub.advfn.com/boards/read_msg.aspx?message_id=62672317
http://investorshub.advfn.com/boards/read_msg.aspx?message_id=62619732&txt2find=runs
http://investorshub.advfn.com/boards/read_msg.aspx?message_id=62619726&txt2find=runs
http://investorshub.advfn.com/boards/read_msg.aspx?message_id=62607451&txt2find=runs
As you can see from my years here on iHub [look for the 10day-vol-avg posts] http://investorshub.advfn.com/boards/Profile.aspx?user=52013 this is one of the three values I use in making a timely decision. Too be able to trade effectively one needs a starting point or set of tools. Then after you've mastered these set of tools AS A WHOLE, variables that lie inside the boundaries of each are dictated by [what's assembled inside you as an individual person]
I can't state this enough.... as you read all parts of the ibox, the 10Day Alert 'rule' is TRULY a very simple tool, one in which you can use when you find new symbols, when you desire to further your DD on Long Term Picks, Short Term Picks, when you find new and FRESH Plays, that HAVE NOT been played to death here on iHub.
The 10Day Alert allows you:
1.) Find new plays fresh to iHub [this along has tremendous value since the new play has VOLUME!
2.) See patterns in front loading by individuals [ususally a single entity] someone know's something
3.) Helps to create value in your next Long Term Play and Short Term Play
4.) Helps you to initially decide whether or not to further.... your DD!
5.) For those who have yet to become Chartist, this very simple 10Day Alert rule helps too further your charting environment
6.) Helps you too understand the value-of-VOLUME 'changes'.
Why I did this:
* I like anyone else am here to make money, but I'm also here to help those I see daily... chase!
* Who are totally new too this.
* Who are willing to take the time to see the value in this very simple system, which of course you'll see..... leads to many UNIQUE formula's you'll create on your own.
It's like someone telling you HOW to plant something in the ground for the very first time. You need a shovel. You need a Plant. You need Water. But then after you've learned the basics, [don't think you'll master it quickly - it's taken me years] it's then up to you where to plant, and what to plant.
Everyone on IHUB who you think is a good trader has a niche. But also those who have a niche no doubt ran through many trial and error periods, experimenting, then setting in on a formula that works for them.
That's where a majority of you reading this may need to expand on what you're doing here on iHub... because too become a better trader no matter what your buying or selling patters are; you'll always need a Chart, Stock Data, and iHub Data.
How 10 Day Averages Work:
Moving averages are very simple, yet extremely useful tools for investors. A moving average is simply the average of a series of numbers over a period of time which is constantly updated by dropping the oldest value and then adding the newest value and recalculating the average. So a 10-day moving average of stock prices would add up the closing prices for the last 10 days and then divide that total by 10. After the next trading day, we would drop the oldest day and calculate the average with the latest days' price in its place. So over time the average moves as new data is added and old data is dropped.
Here's a free link to view a 10Day Volume Chart: http://www.profitspi.com/stock-quote/ebdc.aspx under the last section "price & performance" at the bottom right you'll see 5day 10day and more averages. We are after the 10day volume here.
**** We also trade at the PRO Forum just like other boards on news, rumors, and basic DD. What we try and do on top of this is specialize in a set of quick DD tools.
Ultimately... the tools needed to HELP find your own picks!
Remember the formula: 10day avg vol with a 7x to 10x resembling a post like this:
BGTH .008 125k vs 12k volume 10day average
When YOU spot it [always on the LEFT] verses Last 9 Days [always on the RIGHT]
The larger volume will always be on the LEFT [showing a huge shift]
Another recent example: http://investorshub.advfn.com/boards/read_msg.aspx?message_id=62247622
The above symbol was spotted in real-time within two different time periods in 2010 here on iHub. Once early in the year, and once late in the year.
Why does that matter? Well it DOESN'T matter that I was first, what matters is finding it before it runs, right? In early 2010 when spotted there was very little 10Day_Moving_Volume 'change'. But late in the year? On one day there was 125k volume verses 12k volume, that's a 10x volume-change. K = 1000
One of my recent posts on Jan 7th was this: BKSD .003 800k vs 105k_vol10dayavg that's an 8x volume change over that particular 10 day period.
***** Go back and notice the changes, which occurred on the 3 pages listed; what do you see? Well above average buying before a run
http://investorshub.advfn.com/boards/msgsearchbyboard.aspx?boardID=18631&srchyr=2010&SearchStr=bksd
Now, we do not care how or why it runs, this is not ours to figure out. What matters is being able to spot a huge change in volume before it occurs and ABSOLUTELY... before it makes a major move. Your going to find there are variables in the above, but this is the fun part, so be ready!
Other Important Steps:
We are going to describe the values in using a real-time activities bar, that is a menu which shows symbols changing quickly as trades happen in real-time. New symbols come and go, old symbols come around more often. Simply said it's a way to get to know the majority of stocks, which trade OTC_BB.
EACH post you find here [when making a 1st for that particular symbol] will have DD. When you spot a re: at the start of a post, that is there to show you it's linked to the last post or hopefully, linked to the 1st 10day_vol alert if applicable. You may also see then linked to several posts leading back to the 1st post with the most DD. http://investorshub.advfn.com/boards/read_msg.aspx?message_id=58553388
One of the posts leading back to the one you'll see will have this:
It is our goal to provide more than just a Day Trading *hit & run* at the PRO_TRADERS Forum
Always remember finding a stock you like needs more than just a volume change as you continue to read, it needs:
10Day Volume + stock_data + iHub_data = buy ? If you remember this formula, you'll do well!!
We've briefly discussed what to expect, and what posts will look like when we give alerts. Now let's discuss the intricacies of the 10dayavg_vol DD tools.
Isn't it true at least from a risk factor [however you perceive risk] that the higher PPS, the less risk you have? Simply said if you buy a stock at .05c and buy a stock at .0005, which has the higher risk value? The point is here on this particular forum we are lowering the factors of risk, and in part, by staying away from micro-picks .0001 to .0009's [there are Pros on Ihub ___ go find them]
Ihub offers many research tools that are helpful if used correctly and in the sequence I show you. This should bring your confidence level up considerably!
This is a process that takes time, lots of time over an extended period.
My suggestion is to run this strategy on paper.
If you've ever watched a roulette wheel go round and round the analysis here fits. Imagine if you will a very large roulette wheel with 2500 letters instead of numbers in front of you ever-changing, [spinning ~ spinning ~ spinning]! You'll notice 90% of those letters keep coming up day after day, week after week, and month after month.
Notice the Activities Bar:

OTCBB __________ SHARES TRADED ___________ 1 Min
SYMBOL ___________ %EXE ___________ SHARES
The above image is from Ameritrade Command Center. It is set up on Shares-Traded instead of Number of Shares [per minute /5min/ 30min/ etc.
What you want is the [1] Minute allowing you quick access to individual trades and not a set of trades from one stock. You want it the flash quickly as not to miss an opportunity. What opportunity? Answer: The symbols, which are not played over and over again on Ihub. There's a very good reason for this so continue >>>>
Question: Do you think you would step up to a roulette wheel in Vegas without looking at what was in front of you before putting your money down?
Something to think about : If I buy a stock today I see on Ihub, can I then come back within a few days or week and watch it grow? Or, do I need to buy and sell within a very short period of time? My answer is: Over 80% of stocks bought and sold here on IHUB are Day Trades or Very Short Trade.
If you would have asked me that back in the early 90's when I bought my 1st computer, an Acer 60 scream'n megahertz Computer for $2,300 dollars, and an online baud rate of 33k when I was first on Prodigy trading; I would have said NO! Things have changed and continue to evolve!
In general, here are a few things we look for at the Pro Traders Forum before getting into the step by step process of DD.
NOTE: If you decide to buy something on PDT's, this is your DECISION and yours alone. If you decide to work within this system or any other system, you'll need to be in front of your computer most of the time when the market is open. You cannot do well otherwise Fact, not Fiction!
~ All Steps Listed Below Have The Same Values ~ All Steps Are Important ~
Remember the Spinning Wheel Analysis
Lets look at this one more time:
Notice: OTC_BB ------ Shares Traded ----- Per_Minute [SCREEN]
A very important piece to this system is monitoring symbols IN REAL_TIME <as they trade!>
With this particular WINDOW, which is part of Ameritrade Command_Center, you can CLICK on the Shares_Traded, and use TRADES.
Two choices, Trades, or Shares_Traded. You want to use Shares-Traded and by the minute.
Note: There are other here using different platforms, but you must be able to monitor OTC_BB in real time!
Each trading platform has unique advantages, look for them
I say this knowing what other real-time activity bar online systems bring up verses what Ameritrade brings up. There is a difference. For example when you 'public message search' http://investorshub.advfn.com/boards/msgsearch.aspx?SearchStr=bgth back and you'll see I had the 1st post.
**** Sometimes certain symbols do not come up, or do not come up as quickly on different trading platforms ****
Here's what happened during 2010 in regards to BGTH:
| DAYTRADER'S FORUM | BGTH.008 'watching' | SuperC | 01/15/2010 09:39:13 AM |
What matters is finding it before it makes it's initial run, thus not having to hold it for an extended period of time!
| PRO_TRADERS 10day-moving-averages | BGTH>008 125k vs 12k_vol 10dayavg"watch" | SuperC | 12/28/2010 01:41:08 PM |
It's the 10 Day Avg_vol change, which in this case was 125k vs 12k volume or 10x that set an inner alarm off + symbol_data + ihub_data
This system does not mean you catch everything before it moves, nor is it set up to sometimes see it first. But what happens over the course of learning this system, and most of all... you get to know what NOT TO PLAY [you make that decision over a period of time], in order to understand what MIGHT BE A GOOD PLAY. Find picks yourself, find picks that have yet to move by: 10dayavg_vol + stock_data + ihub_data = Buy?
1.) 10Day Average Volume: Ameritrade Image>>>  If you look closely at the bottom left you'll see a time of 2:31 ET 1/13/11.. just above that you'll see Avg Vol (10day) it doesn't matter what it say's here, this is where you find in on Ameritrade Command Center. Within the same page check out all the other DD, which is important when trying to find the Share_Outstanding, 52wk hi/low, and of course the chart. When you double click the chart, it brings up values as you scroll down, which are also useful. Accumulation/Distribution, etc. These are excellent quick reference pages...
2.) Stock Data: The above reference is only part of your stock-data, there are others. Ihub provides a search tool for paid subscribers, which is something you absolutely need! Here is a link to find out what ihubbers are saying about TDCP http://investorshub.advfn.com/boards/msgsearch.aspx?SearchStr=tdcp and have now for over 12 pages since the first of 2011. You get trememdous value for less than $.50c a month, this is just one of them.
3.) iHub Data This is also referenced by using many link as above, by dropping the last 4 digits and putting in the stock you want to research. iHub Data as you scan a stock symbol comes in many flavors, meaning, you need time to decipher which is false, what is DD that someone else has posted, and many other factors. Take time to understand what's being said as you scan down each post. You do not need to open these posts, just glean the first few lines, there's plenty there! Over time you'll begin to realize that by assembling what's being written, based on news, rumors, who's saying it, when it's being said... things start to take shape. Easy Does It
Recent 10 Day Movers:
| PRO_TRADERS 10Day_Moving_Average Forum | LHPT.0011 Signals_UP 'watchit' | SuperC | 01/05/2011 11:03:01 AM |
| PRO_TRADERS 10Day_Moving_Average Forum | BGBV.0061 415kvs15k_vol10dyavg'just-watching' | SuperC | 03/09/2011 03:35:32 PM |
LHPT 1st IHUB Call for 2011
* BGBV.0061 415k vs 15k_vol10dyavg to .04cents [2 weeks idle before moving, which is the norm]
* OHAQ.0004 109k vs 0k_vol10dayavg to [.10c 33,223% gain]
ihub 1st http://investorshub.advfn.com/boards/read_msg.aspx?message_id=60109774
* TGLO.0015 1.1mil vs 29k_vol10dayavg [.006]
* TRTH.016 350k vs 27k_vol10dayavg [.054c]
* TWOS .002 250k vs 10k_vol10dayavg
* LHPT .0011 Signals_UP [.008] 1st mover that day
* EGOH .025 Signals_UP [.20c] one of the 1st movers
* BGTH .008 125k vs 12k_vol 10dayavg [.034] 1st to spot
* DMGM .002 510k vs 0 k volume 10dayavg [.21c] 1st to spot
* TMSH .005's 220k vs 0k vol 10dayavg [.75c] 1st to spot
* SFOR .0075 Signals_UP .079 HOD 1st to spot
Many more to numerous too mention: Day Trades _ Short-Term Trades _ Long Term Plays
http://investorshub.advfn.com/boards/msgsearchbyboard.aspx?boardID=18631&srchyr=2011&SearchStr=10day
Do you notice anything significant about the above numbers? When you see it [always on the LEFT] verses Last 9 Days [always on the RIGHT]
Most of the really good runs have very little if any volume in the past 10days... But just as important, you can't conclude you have the best possible evidence of a new and fresh play unless you include Stock_Data + IHub_Data
If you spot a huge 10day disparity, and if it doesn't move that day, log it. If you buy? HOLD IT if it doesn't move!!
The first thing I learned to do is to be able to type in all the ticker symbols running in real time as mentioned so you get to know what's being played on a daily bases...
Type, write them down, write down each ticker you see on ihub. Log those you don't see on a regular bases.
Get to know a little about the symbols that pop up. You don't need to know the float or even the companies name, know how they trade, and know how many shares are traded per sale. If you don't play micro's, that is .0001 to .0009 you know which stocks to stay away from.
Using the Per_Minute Bar will help you to do that.
Within Ameritrade https://wwws.ameritrade.com/cgi-bin/apps/Main at the bottom of this main page, when your command center is up and running you'll find a place for QUOTES. Insert symbol then the bid/ask come up, then you can click on the symbol linking you quickly to the next and most important page.
This page is the only page you'll need in your Ameritrade account: http://www.tdameritrade.com/tradingtools/commandcenter.html
What your looking for:
9.8M
24.8K
52wk Range .0005 to .07
http://investorshub.advfn.com/boards/board.aspx?board_id=18631 Pro Traders Forum
http://investorshub.advfn.com/boards/msgsearch.aspx?SearchStr=dnad [back click on URL and trade out the last for within seconds each time you search]
http://investorshub.advfn.com/boards/board.aspx?board_id=15223 [Public Float Updates]
http://www.otcmarkets.com/stock/GNPG/news
Many more links listed below...

 B
B
Between Tabs and Command Center, and Strategy Desk,
I'm clicking back & forth watching the Activities Bar / L2 - Last Sale - 9 tab references every few seconds..... tick tick tick ~ click click click
Then if it meets my criteria of, * yet to move * looks interesting * may be a new play *hasn't dropped even one .0001 point... I move that symbol from my L2 to my Last_Sale Screen. I want to know how fast it's moving, are there sales large, etc. Does it look like a quick momo play ready to begin, or, possible a new symbol whereas someone could be loading? You'll figure all this out in time, just be patient.
If I see that it's not moving too fast, it hasn't dropped, it hasn't moved up to much on the Price Per Share 'pps', I'll then take the time to scan iHub.
http://investorshub.advfn.com/boards/msgsearch.aspx?SearchStr=twos
What do I look for?
During the entire process so far I'm always going back to my L2 & Last_Sale to see how it's moving.
Always move back and forth quickly between watching your L2 & Last_Sale while DD for that pick continues.
You'll find yourself moving from iHub DD, then back to your L2, always switching back and forth scanning quickly to see how it's moving while you scan for other important data.
Always, and I mean always click back and see if there's a new symbol coming up [they refresh about every 10sec's] while your DD.
KEY: If I don't like what I read on my L2, after I first spot a pick, I halt and move on. If I don't like what the L2 is telling me I move on, no need for the next step. If it's already gone up, it it's dropped, if it's being played too much, if the float is to high or two low, if news out is unimportant I MOVE ON!
Remember the roulette wheel, also remember if you will... there's another another bus within the route of each day!
You and only you can build this data.....!!!
Now, I've found the pick I like, it hasn't been played much if at all, it has value, it's close to it's 52wk low, the 10dayavg_vol is great, float is good, nothing real negative at this time on ihub, I've checked the latest float board: http://investorshub.advfn.com/boards/board.aspx?board_id=15223 I then move it from my 1st L2 to my 2nd L2 for further analysis 'watch it' unless I feel there's enough information to buy.
I'm always continuing to shift from left to right moving possible plays in and out, thus when I lose interest after reviewing all data into a storage bank. I use Strategy Desk from Ameritrade. It allows you the simplicity, [see one of my ProTrader images], to watch percentage gainers automatically IF the PPS moves up.
Always BUY before you POST if your going to buy!
Remember what CD's are paying now, 2% at the most! If you make 20% or better, hmmm NICE!
Remember that as soon as you buy, set a price to sell immediately! Don't think about it!!!
Example:
Buy: LHPT.002 200k $400.00
Sell: Lhpt.0045 200k $900.00
Putting your price in helps others to maintain a run, you'll always be selling at the ASK. But if you're greedy you will get burned!
Even a $50 dollar profit several times a day is substantial. Beats working at Burger King!
Quickly>>>>>>>>
REMEMBER: Every stock symbol on the OTC Market is YOUR ADVERSARY........ treat each one as so and you'll do fine.
_ _ _ _ _ _ _ _ _ _ _ _ _ _ _ _ _ _ _ _ _ _ _ _ _ _ _ _ _ _ _ _ _ _ _ _ _ _ _ _ _ _ _ _ _ _ _ _ _ _ _ _ _ _ _ _ _ _ _ _ _
*** Also, don't forget to log all your interesting OTC_BB finds: [I use Strategy Desk] from Ameritrade.
Once you log.... continue too watch in real-time during trading hours... as this is another part of real-time DD.

The list grows each day for stocks I select to watch between .001 to .05c
I have a number of these links opened using Fox Browser to include Ameritrade:
http://investorshub.advfn.com/boards/board.aspx?board_id=18631
http://investorshub.advfn.com/boards/msgsearch.aspx?SearchStr=vaev
http://investorshub.advfn.com/boards/board.aspx?board_id=7946
http://investorshub.advfn.com/boards/board.aspx?board_id=15223
http://nvsos.gov/index.aspx?page=6
http://investorshub.advfn.com/boards/board.aspx?board_id=3017
http://ih.advfn.com/p.php?pid=trades&symbol=plhi
http://ih.advfn.com/p.php?pid=historical&cb=1264248899&symbol=erfw
http://www.otcmarkets.com/home
http://www.profitspi.com/stock-quote/erfw.aspx
http://pro.edgar-online.com/profile.aspx?CompanyID=71642
http://investorshub.advfn.com/boards/board.aspx?board_id=18534
I also have favorites: People I follow + Boards [keep your favorites to a minimal so you can easily reference during trading hours]
_____________________________________________________________________________________________________________________________
If you need help in a few areas:
http://stockhideout.com/images/flash/level.html
http://investorshub.advfn.com/boards/satutorials.asp?video=R
Ticker Symbol Meanings [commonly known as the 5th letter]
A Class A.
B Class B.
C Exempt from Nasdaq® listing requirements for a limited period of time.
D A new issue of an existing stock. (Often the result of a reverse split.)
E Delinquent in required filings with the SEC as determined by the NASD®.
F Foreign.
G First Convertible Bond.
H Second Convertible Bond, same company.
I Third Convertible Bond, same company.
J Voting.
K Non-voting.
L Miscellaneous situations such as foreign preferred, preferred when-issued, a second class of units, a third class of warrants, or a sixth class of preferred stock.
M Fourth preferred, same company.
N Third preferred, same company.
O Second preferred, same company.
P First preferred.
Q In bankruptcy proceedings.
R Rights.
S Shares of beneficial interest.
T With warrants or with rights.
U Units.
V When-issued and when-distributed.
W Warrants.
X Mutual Fund.
Y ADR (American Depositary Receipts).
Z Miscellaneous situations such as a second class of warrants, a fifth class of preferred stock, a stub, a foreign preferred when-issued, or any unit, receipt, or certificate representing a limited partnership interest.
http://www.nasdaq.com/asp/symbolchangehistory.asp?SortBy=EFFECTIVE&Descending=N&PrevSortBy=EFFECTIVE
I'll update the Sticky_Note Section Weekly ~
Below are links to comments made by SuperC and Friends!
http://investorshub.advfn.com/boards/read_msg.aspx?message_id=61642973
http://investorshub.advfn.com/boards/read_msg.aspx?message_id=62858947
http://investorshub.advfn.com/boards/read_msg.aspx?message_id=61326035
http://investorshub.advfn.com/boards/read_msg.aspx?message_id=60697655
http://investorshub.advfn.com/boards/read_msg.aspx?message_id=60078972
http://investorshub.advfn.com/boards/read_msg.aspx?message_id=60109774
http://investorshub.advfn.com/boards/read_msg.aspx?message_id=59019315
http://investorshub.advfn.com/boards/read_msg.aspx?message_id=58839291
http://investorshub.advfn.com/boards/read_msg.aspx?message_id=58839691
http://investorshub.advfn.com/boards/read_msg.aspx?message_id=58837439
http://investorshub.advfn.com/boards/replies.aspx?msg=58839489
http://investorshub.advfn.com/boards/read_msg.aspx?message_id=58825065
http://investorshub.advfn.com/boards/read_msg.aspx?message_id=58476540
http://investorshub.advfn.com/boards/read_msg.aspx?message_id=58425931
http://investorshub.advfn.com/boards/read_msg.aspx?message_id=58323475
http://investorshub.advfn.com/boards/read_msg.aspx?message_id=58476540
http://investorshub.advfn.com/boards/read_msg.aspx?message_id=58727962
http://investorshub.advfn.com/boards/read_msg.aspx?message_id=58726693
http://investorshub.advfn.com/boards/read_msg.aspx?message_id=58717498
http://investorshub.advfn.com/boards/read_msg.aspx?message_id=58715503
http://investorshub.advfn.com/boards/read_msg.aspx?message_id=58774911
http://investorshub.advfn.com/boards/read_msg.aspx?message_id=58784683
http://investorshub.advfn.com/boards/read_msg.aspx?message_id=58930694
http://investorshub.advfn.com/boards/msgsearchbyboard.aspx?boardID=18631&srchyr=2010&SearchStr=erfw
Learn More: http://learn.advfn.com/index.php?title=Main_Page http://ihwiki.advfn.com/index.php?title=Site_Map
Don't forget that in order to use TOOLS effectively you need to sign up:
Subscribe! http://ih.advfn.com/p.php?pid=smatrix
NOTE: I want to make this perfectly clear, I do not work for ihub, but ihub works for me, and, the
| RECURRING CHECK CARD XXXXX0080 INVESTORS HUB | $12.95 to $16.99 Basic |
IS WELL WORTH IT!!!
Pro Traders realize... you need Chart_Data + iHub_Data + Stock_Data to make an informed decision!
Once you know the basic's of the system there's plenty of time too hone your skills before you actually buy!
Volume Speaks
Voume Buys
Volume Sells
Trade Well
SuperC & Friends

|
Posts Today
|
0
|
|
Posts (Total)
|
89270
|
|
Posters
|
|
|
Moderator
|
|
|
Assistants
|
| Volume | |
| Day Range: | |
| Bid Price | |
| Ask Price | |
| Last Trade Time: |


