News
News  Market Data
  Discover
Support: 888-992-3836
Copyright © 2023 InvestorsHub Inc.


Register for free to join our community of investors and share your ideas. You will also get access to streaming quotes, interactive charts, trades, portfolio, live options flow and more tools.
Consider Apexfutures for intraday patterns on the e-mini's
Flags and wedges are always printing intraday in the e-mini's...
Open an account and they provide their excellent ApexTrader software free -
You could have up to 10 charts open at a time, each with a different market:
i.e. 2 or 3 Indices, a couple for currency pairs, some for commodities etc.
I would think that pattern recognition software packages do exist but I'm not familiar with any off-hand...
Higher end packages like TradeStation, Ensign, Q-Trades probably include pattern scans...
You could also check some of the ones listed here
Years and years ago I had an "easy language" software package that I could design my own scan parameters but they are gone now...I think CyberTrader had some too.
I have used the free versions of StockCharts.com and Worden's FreeStockCharts.com scans but I don't think
they list any for patterns like flags...check with Worden Brothers, their TC200 premium package might include some.
I'm looking for pattern recognition software which will be able to scan for wedges and/or flags intraday. Does such a program or service exist to the best of your knowledge? I know this is a range chart but I was thinking of scanning the stock universe for wedges on 5 min. charts.
__3_4_2015.jpg)
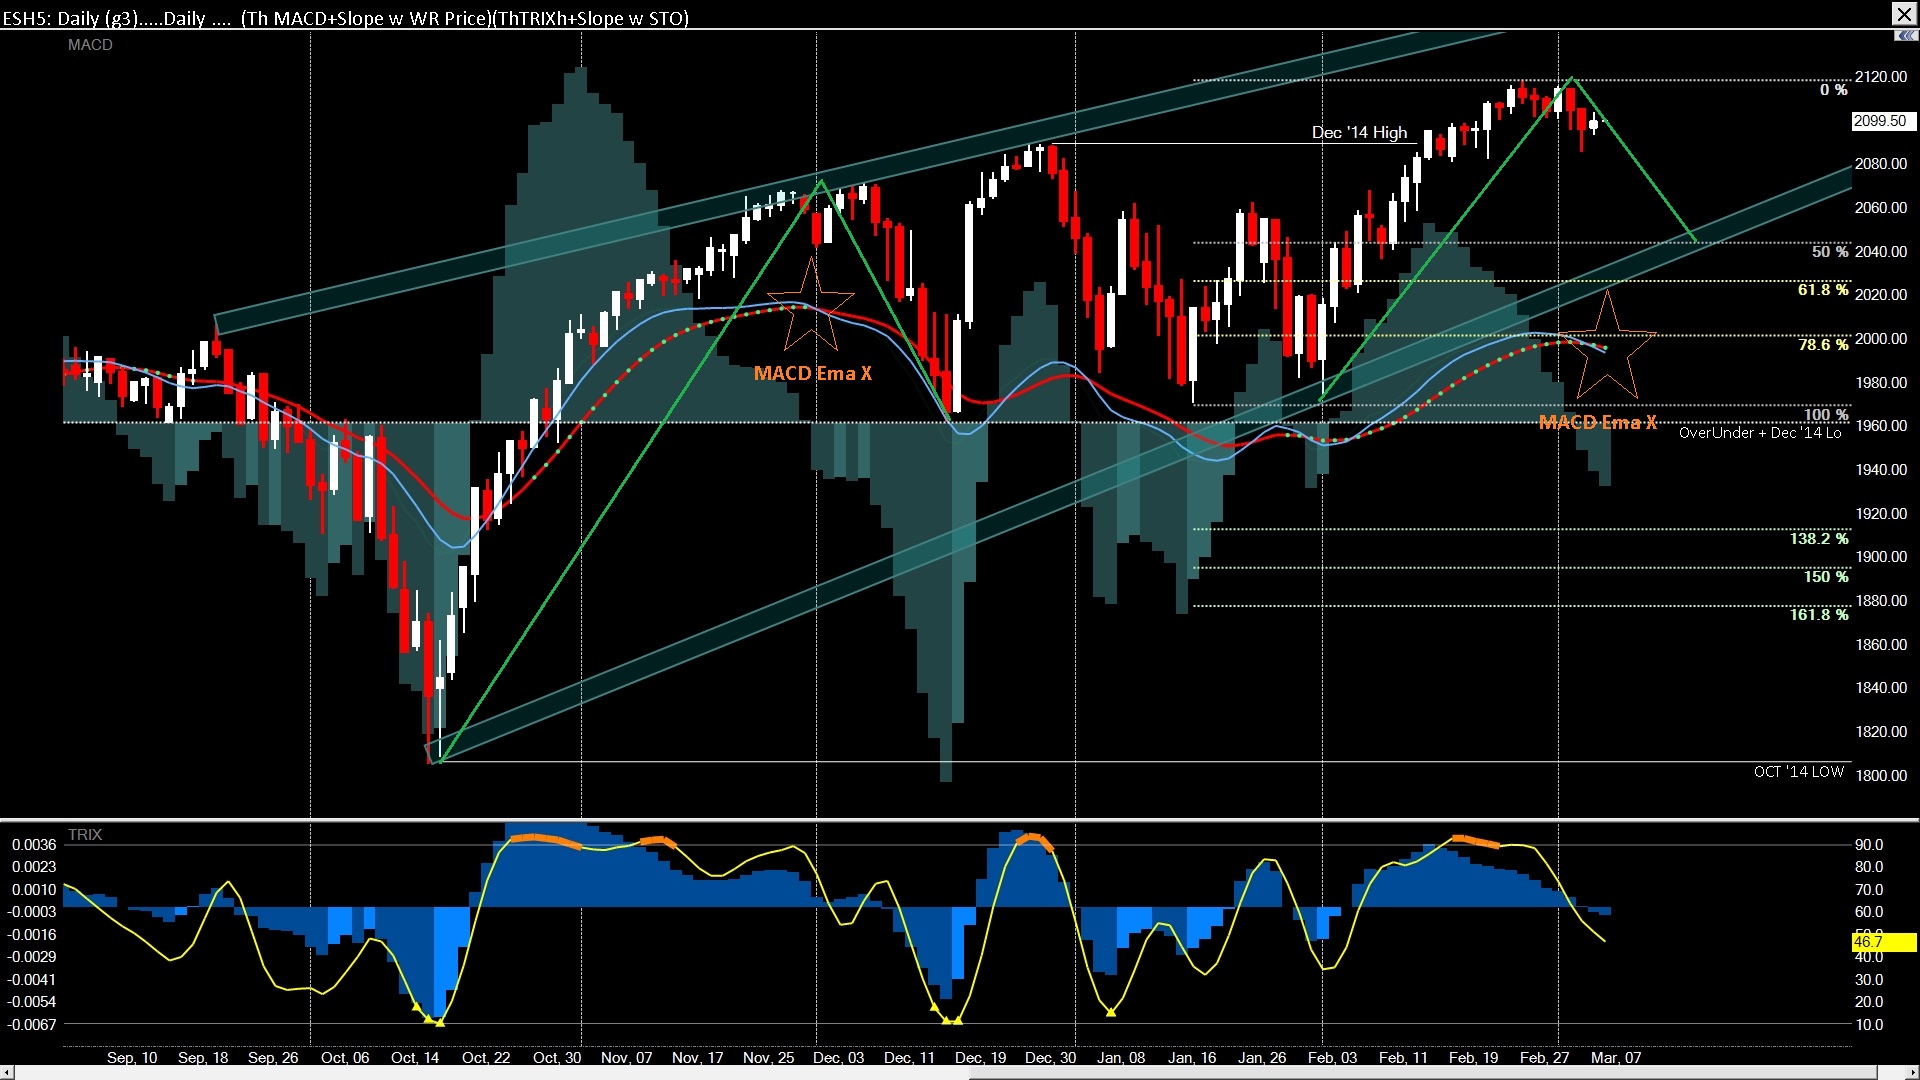
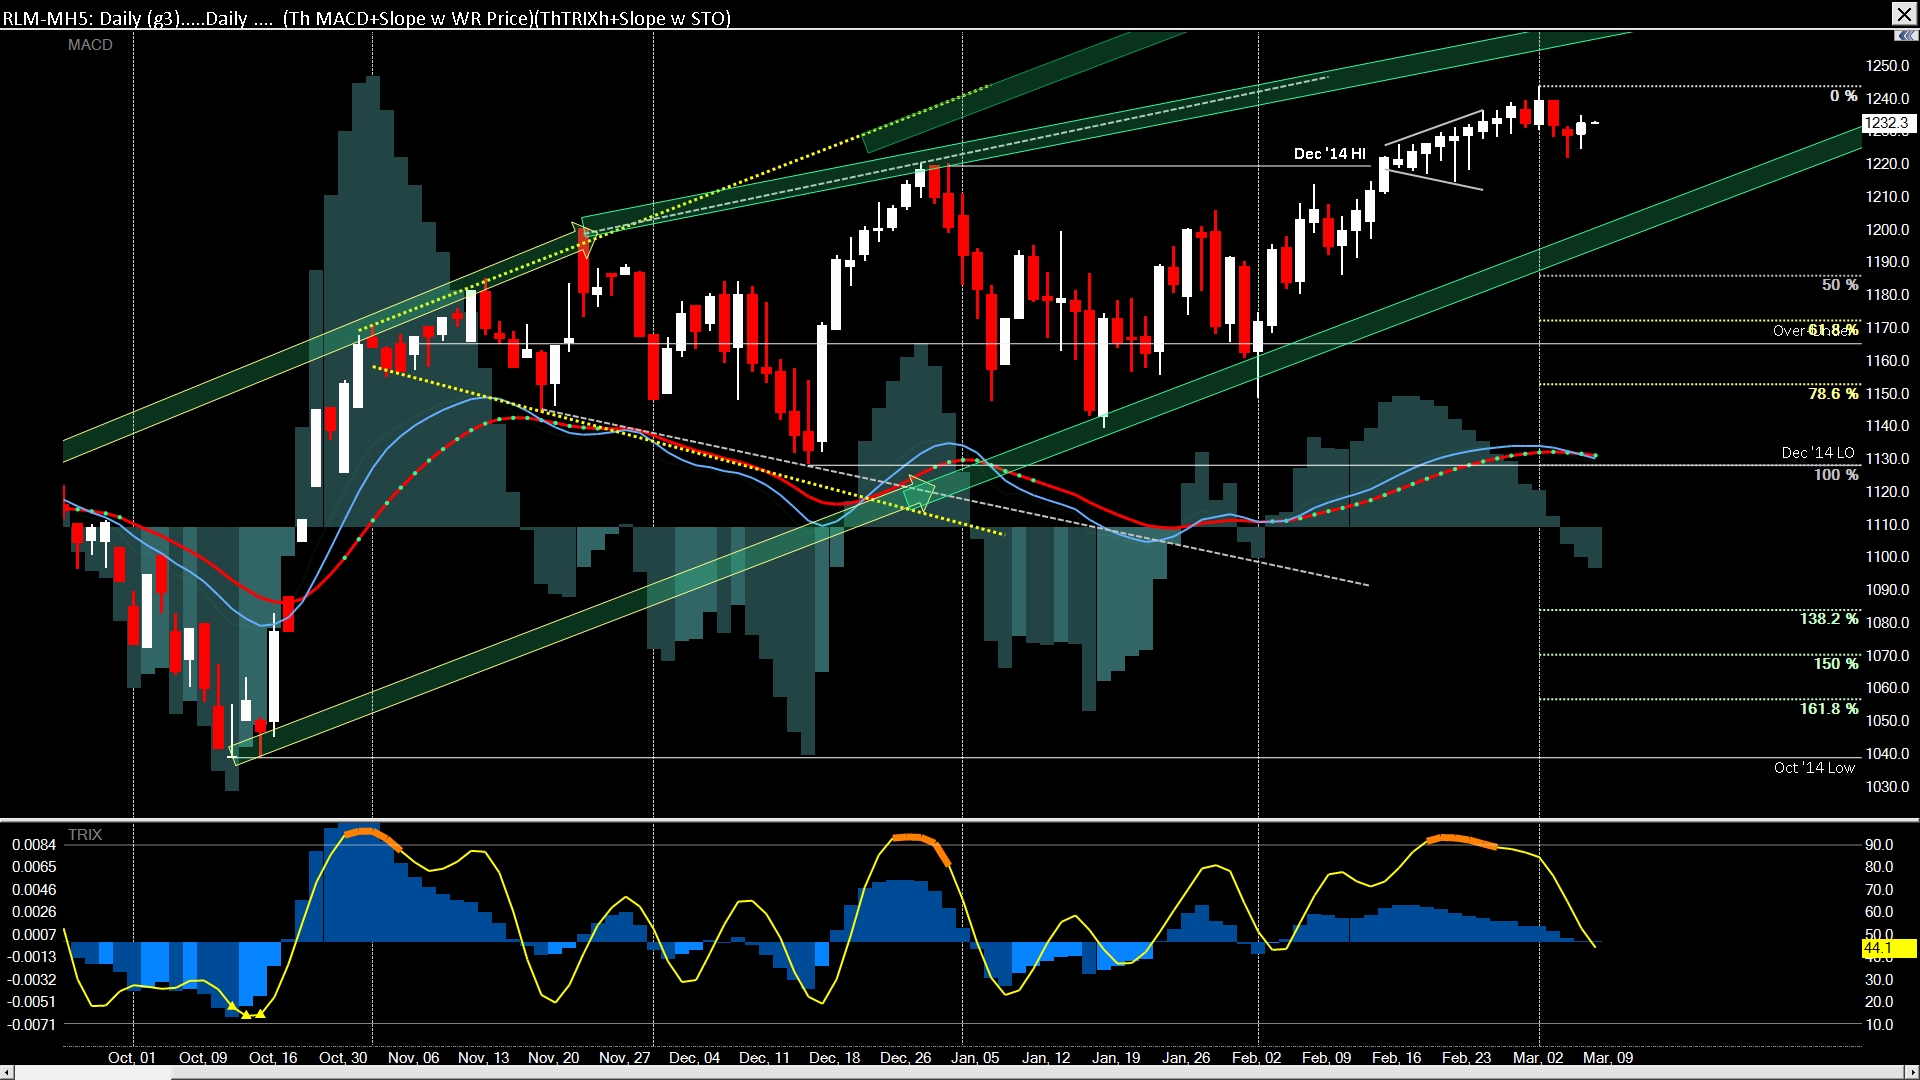
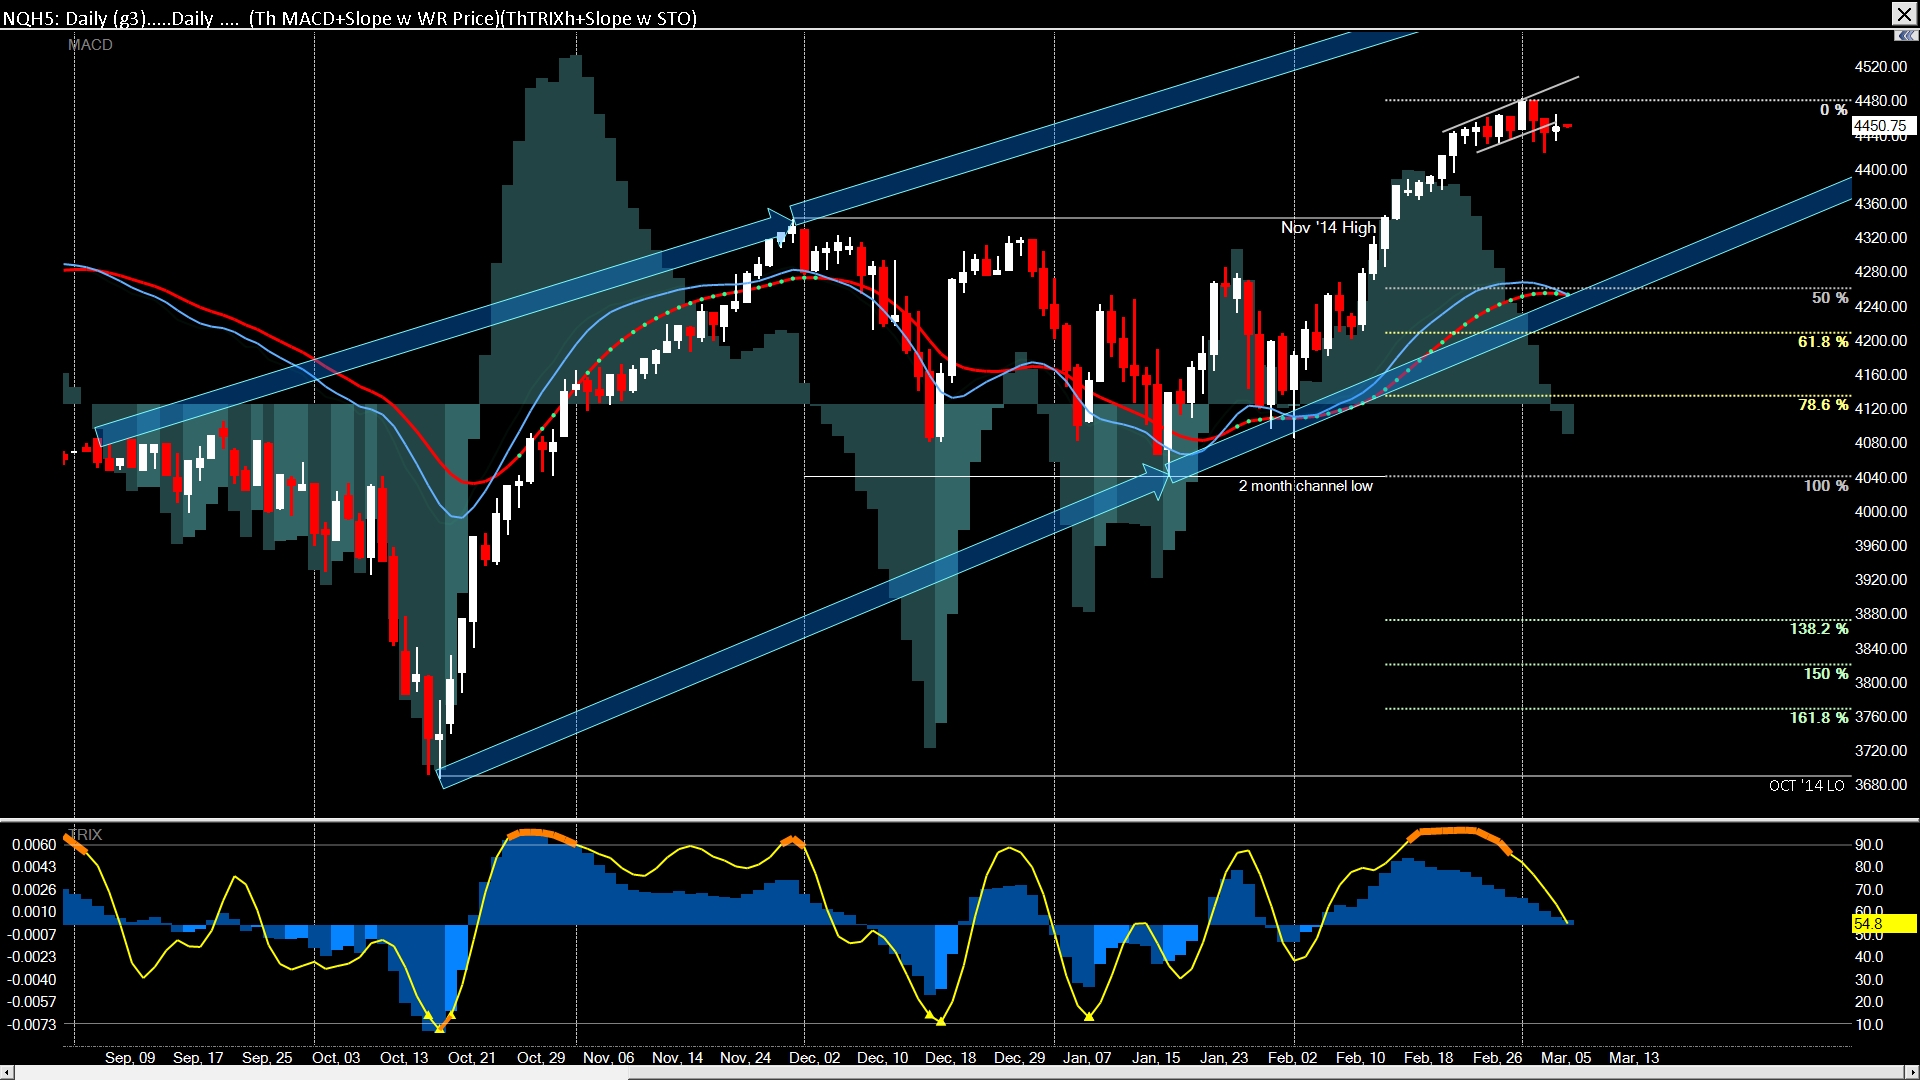
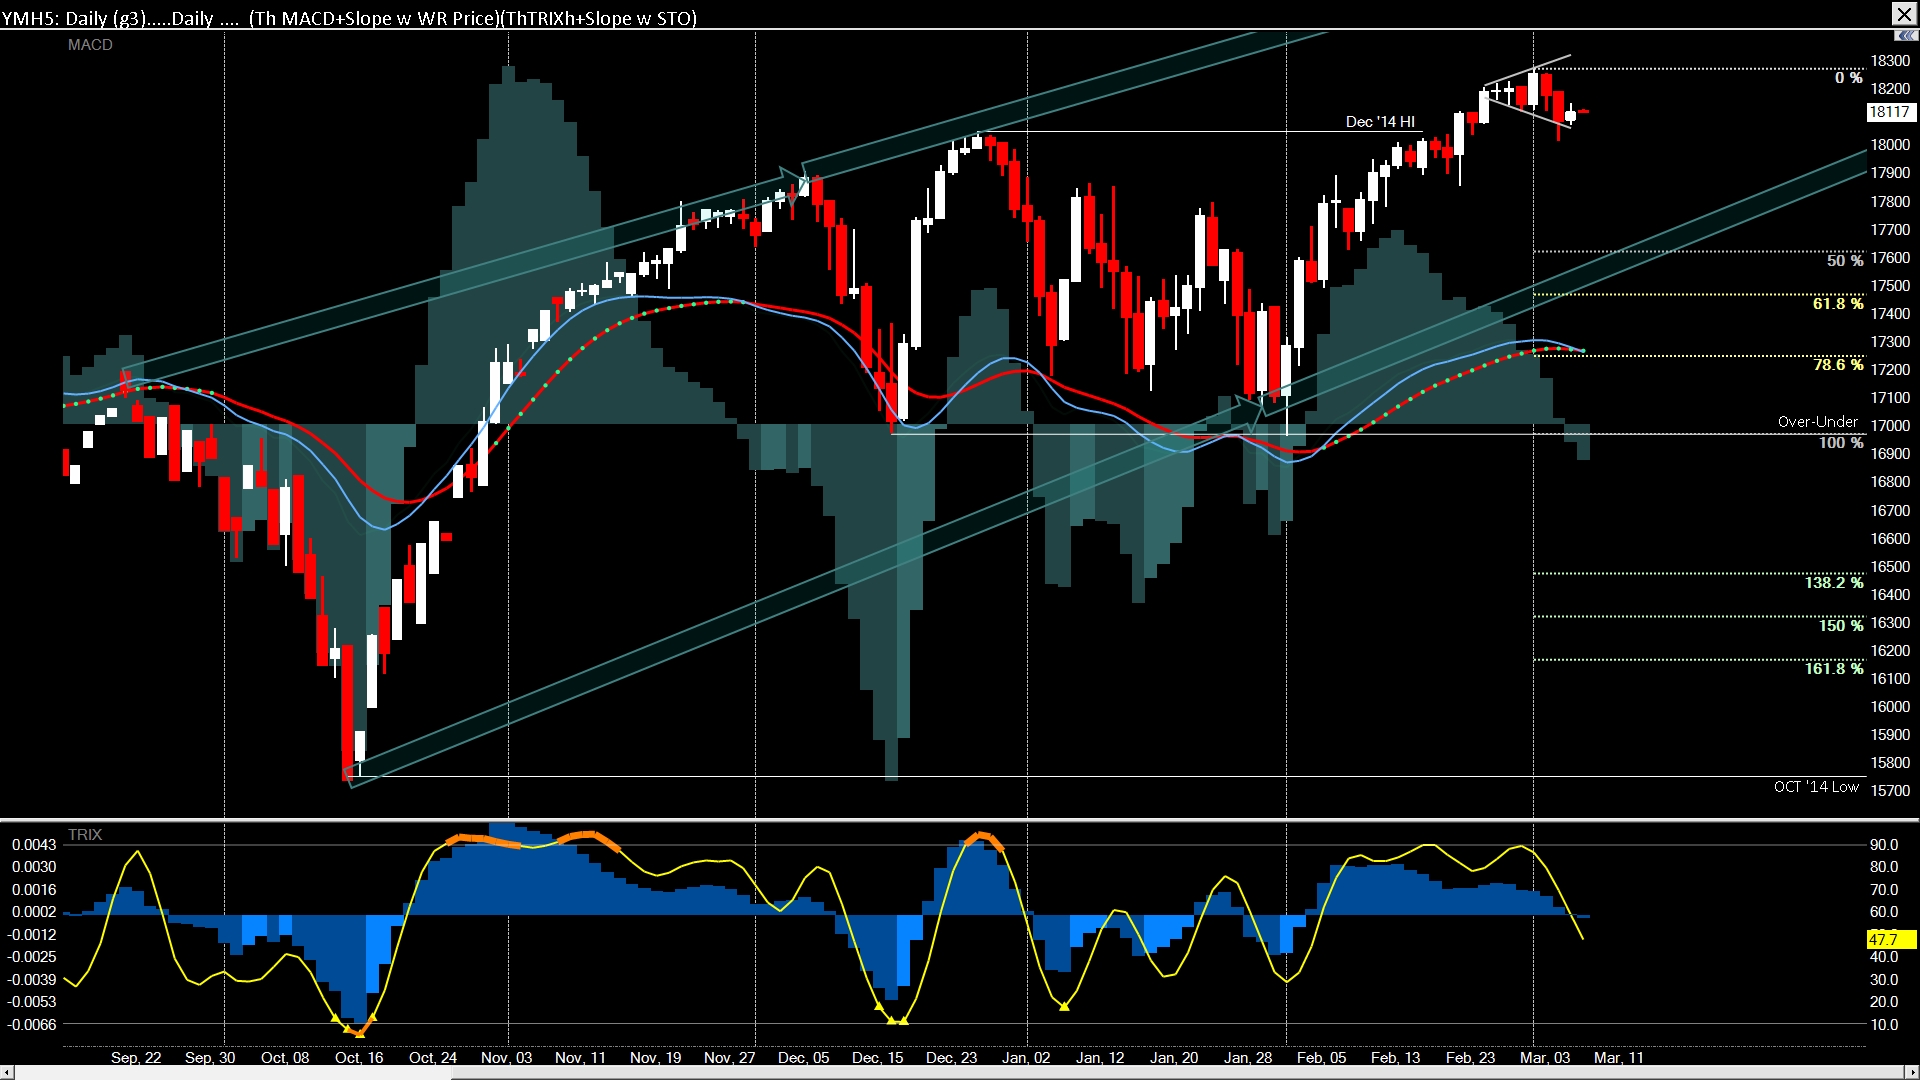
FUTs wedges - another look


FUTs...Right in the middle of rising wedges.
Stochastic is dropping and MACD Emas are crossing down. Last time this happened (Dec '14) there were pull backs
in the range of the 38-50% Fibonacci levels.
So if the pattern repeats and we continue to move down, the lower wedge lines could be the target areas...
Short term Cup & Handle...a continuation pattern
Good for 25 ticks or $250 per contract - taking only 5 minutes or so...

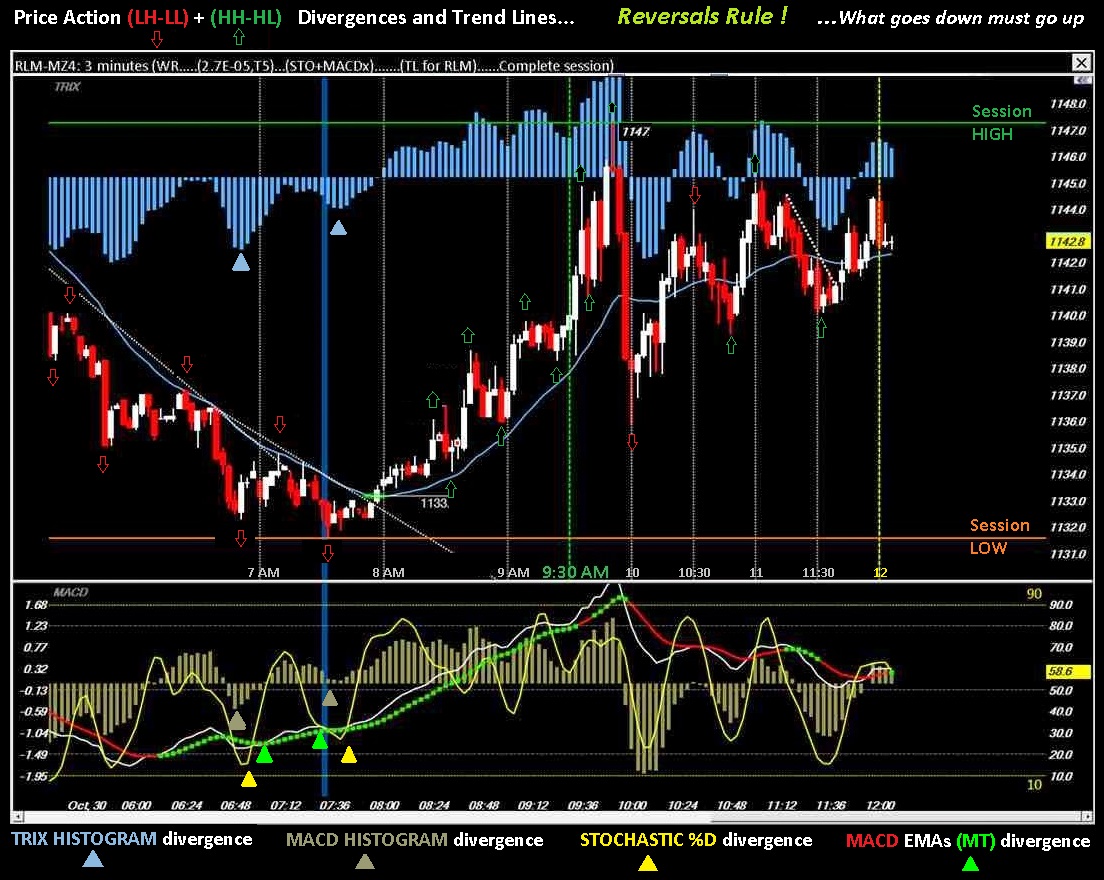
Eating the Bear for breakfast
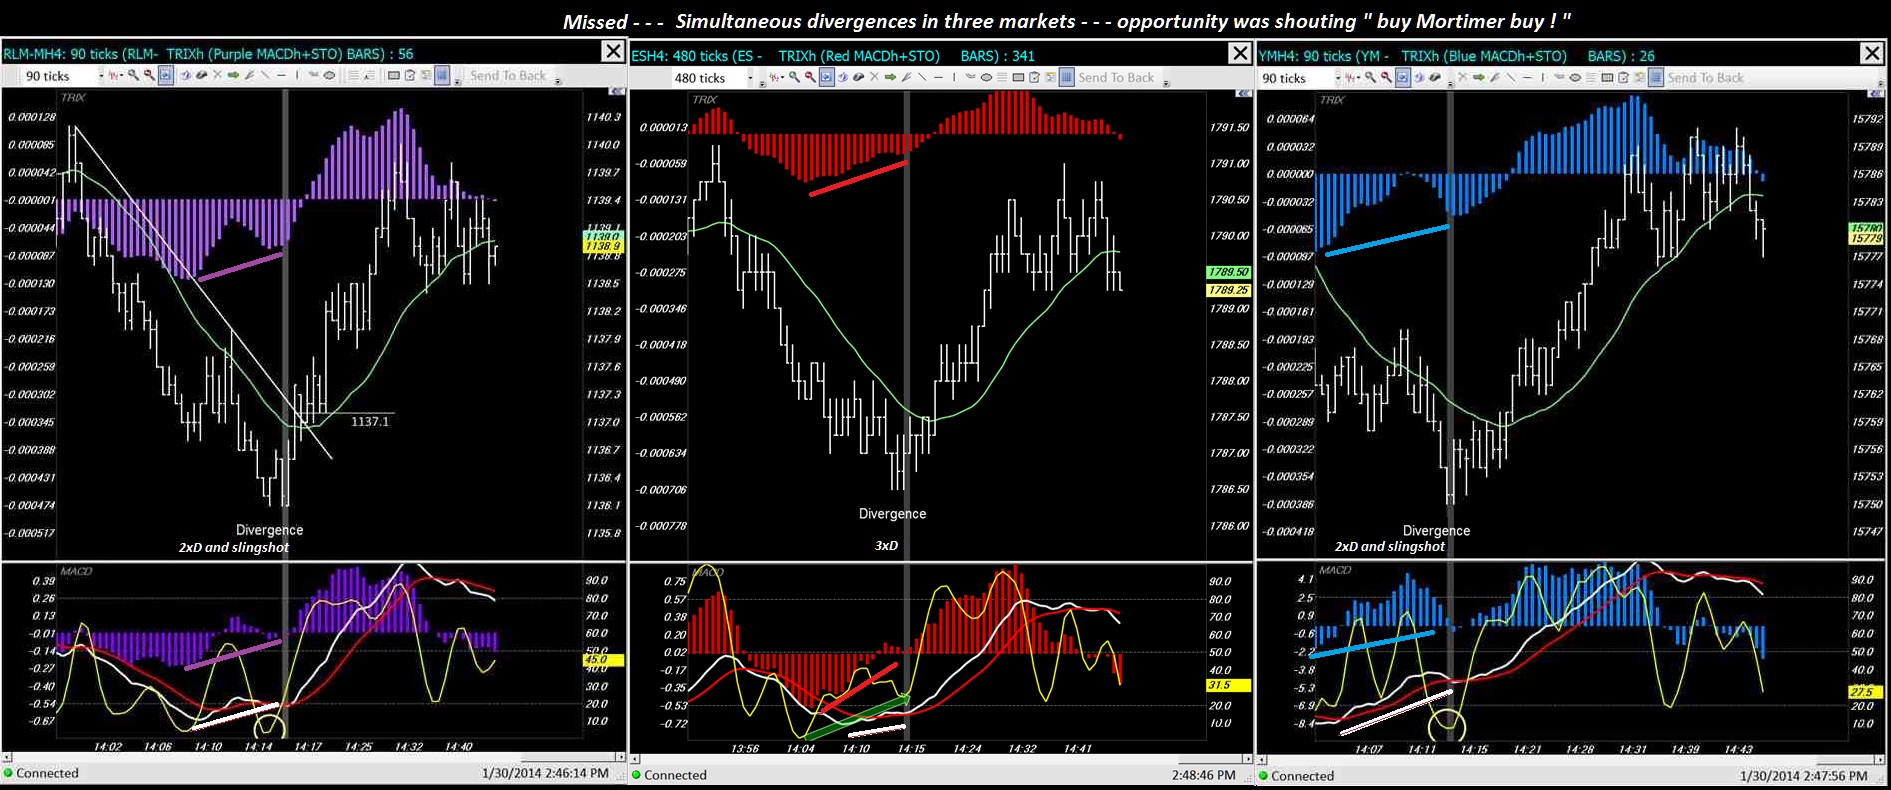
Utilizing Price Action, patterns, Trend Lines, Divergences and Multiple Time Frames...
Often all the things listed above come together at the same time which adds to the probability of a reversal in trend.
The following charts show an exceptional trade that presented itself in the Russell 2000 e-mini market.
Hopefully, you can get past the busy-ness of the annotations on the charts below to catch my drift.
3 Minute per bar chart spanning the early morning session into lunchtime.
75 tick per bar very short term trade entry chart spanning 2 hours of the same session as the 3 minute chart above...the wider blue vertical lines mark the bottom on all charts.
It shows all the same Price Action, patterns, Trend Lines, Divergences that I drew on the chart above.

The picture below includes excerpts from my Sharpshorts Day Trading blog.
Please visit if you have an interest in learning more about "How I Do It" (click my profile for link)
The information presented there comes with no strings attached. There are no
sign-up pages, no ads, no hidden agenda and I do not track visitor's addresses.
Eating the Bear for breakfast
Utilizing Price Action, patterns, Trend Lines, Divergences and Multiple Time Frames...
Often all the things listed above come together at the same time which adds to the probability of a reversal in trend.
The following charts show an exceptional trade that presented itself in the Russell 2000 e-mini market.
Hopefully, you can get past the busy-ness of the annotations on the charts below to catch my drift.
3 Minute per bar chart spanning the early morning session into lunchtime.
75 tick per bar very short term trade entry chart spanning 2 hours of the same session as the 3 minute chart above...the wider blue vertical lines mark the bottom on all charts.
It shows all the same Price Action, patterns, Trend Lines, Divergences that I drew on the chart above.
The picture below includes excerpts from my Sharpshorts Day Trading blog. Please visit if you have an interest in learning more about "How I Do It"
The information presented there comes with no strings attached. There are no
sign-up pages, no ads, no hidden agenda and I do not track visitor's addresses.
The RUT...channels, wave counts and Brach Zone retracements
LH chart - sessions since Monday describing a channel with wave counts and Brach Zone reversal area.
The RH daily with it's down channel...price is approaching it's 4th wave top with its Brach Zone target area down around the 1125 level.

Later in the day:
The daily with the long bar down after being repulsed at the upper channel (end of wave 4)...
The session chart on the right...showing the turn down from the short term upward channel that describes this week's P/A (end of wave 5)

Prancing Pony Pattern . . . . .
Sometimes its giddy up and off to the races...sometimes its not.

Try again - an hour lator :


.
Thx and best wishes on your quest ...
Just so you're aware, I'm day-trading the e-mini futures exclusively now.
I won't be posting many equity charts...(I still follow a bunch)
I just closed my long-term equity/options account with MBTrading so the only
data feed I have for equity charts is 6 month EOD QuoteTracker (fed by Yahoo)
and of course the free charts via Stockcharts, Finviz, BigCharts etc...
I do believe the e-mini price action represents the over-all markets' movements just as well as any...
Well, you have a follower here.
I gave a quick glance over your posts and, based on my initial impressions, I've concluded that you're more than competent at market analysis, likely moreso than myself, and seem to have valuable insight that may improve my own understanding. Thus, I will be using you as a resource towards accumulating massive wealth.
...that is, so long as you don't mind, lol.
Having vented all that, I'll share what I originally came here to post. I found a stock in STV that appears to be forming what professional trader Thomas Bulkowski calls a "high and tight" flag; that is, a flag that forms after a stock has risen 90 or more percent in the last 2 months.
According to Bulkowski's research, comparing the data of many hundreds of trades, using nearly all patterns and the traditional methods of trading that go with each of them, the high and tight flag is the most dependable pattern on the market, far moreso than the more common flags found within the market.
More can be read about it here - link directs you to Bulkowski's website. According to his research, having observed 253 of these pattern formations, 90% of them reached price target after breakout.
Yours are amongst the reasons I created this...board...
As you can see, I started several other boards which have resulted in the same lack of interest as is shown here...
Maybe it's too hard to find, but a simple Board Search using Flags as the keyword returns the link to this board.
So I don't think much will change going forward.
You are welcome to post whatever you like here whether it's trading related or not...
Feel free to promote it if you care to. I agree that more interest would help anyone who gets involved.
I don't understand why boards for flag patterns don't get more interest (attention) than they do here on I-hub. It's a pattern that, based on my own experience and what I've read and heard from other traders, is common and has a relatively high success rate compared to other patterns.
If we could somehow form a small community of traders who're willing to share their scan result candidates for patterns like this, we'd likely all benefit.
If this community could organize an intelligent way to cut down on the time and effort that it takes each member, individually, to come up with a reasonable list of "playable" (profitable) candidates - perhaps have one portion of members scan for stocks that have had high monthly gains and another portion for high weekly gains that have re-traced on the previous day and still more scanning one sector specifically and others scanning a different sector, etc., all looking specifically for one or two patterns - which, IMO, is the aim of a stock-market forum like I-hub,then we would all set ourselves up to be more profitable.
Instead, it seems that I-hub is mostly people who try to push others into buying high risk penny-stocks as a means to either recover some of their loses on shares that they're still holding of that stock or are trying to pump the already rising price up to even higher gains to increase their existing profits. Either that, or people who just can't let go of the fact that they made poor trading/ investing decisions in the past and do everything within their power to defend their sensitive and overly inflated egos by finding people to project their rationalizations onto.
Why can't we just be intelligent as group for once? Yes, greed is a part of our nature. Yes, self-acceptance is a common struggle for all. But why can't we just set that aside for a moment and focus on the fact that this forum presents us with a vehicle to improve one very important aspect of our lives, if only we can clear up the fog within our heads for mere moments a day: our financial well-being.
If a mere ten people could come together on this forum and each managed to keep their focus on the best ways to benefit from this medium, each keeping in mind that the main goal is to increase chances for profit for themselves, ideally, in a way that cuts down on work and utilizes all the available resources to their maximum potential, then all of those ten people would benefit, because those 10 (clear) minds will naturally design solutions more intelligent than either one of them could have individually.
Using other people as resources to inflate, or hold together, our own egos or as outlets to our greedy nature is mostly wasted efforts. People collaborating and basically agreeing to use each other as resources towards a goal, THAT's intelligence and that's how progress is made.
Summer rally into the fall and continuing ... into the elections*...
ETFs as proxies for the DJIA, S&P 500, Nasdaq 100 and RUT 2000...
Since JAN/FEB's lows, the big caps held the line while the techs and smaller issues dumped thru MAY...
The Q's have recovered a lot since then but I think the RUT is positioned to gain the most from any summer rally...


*Personally, I think the markets are anticipating a major shift from the six years of anti-capitalist and liberal-social agenda
of the current Congress, Senate and administration...
It's been eight years of economic sluggishness if you consider the 2006 Congressional & Senate take-over as the starting point...
Those nasty freedom loving conservative right wing extremists have a good chance to wrest it away from the 'caring' ruling class and you know they just love to support the 1 percenters (i.e. those that make money and make things happen)...
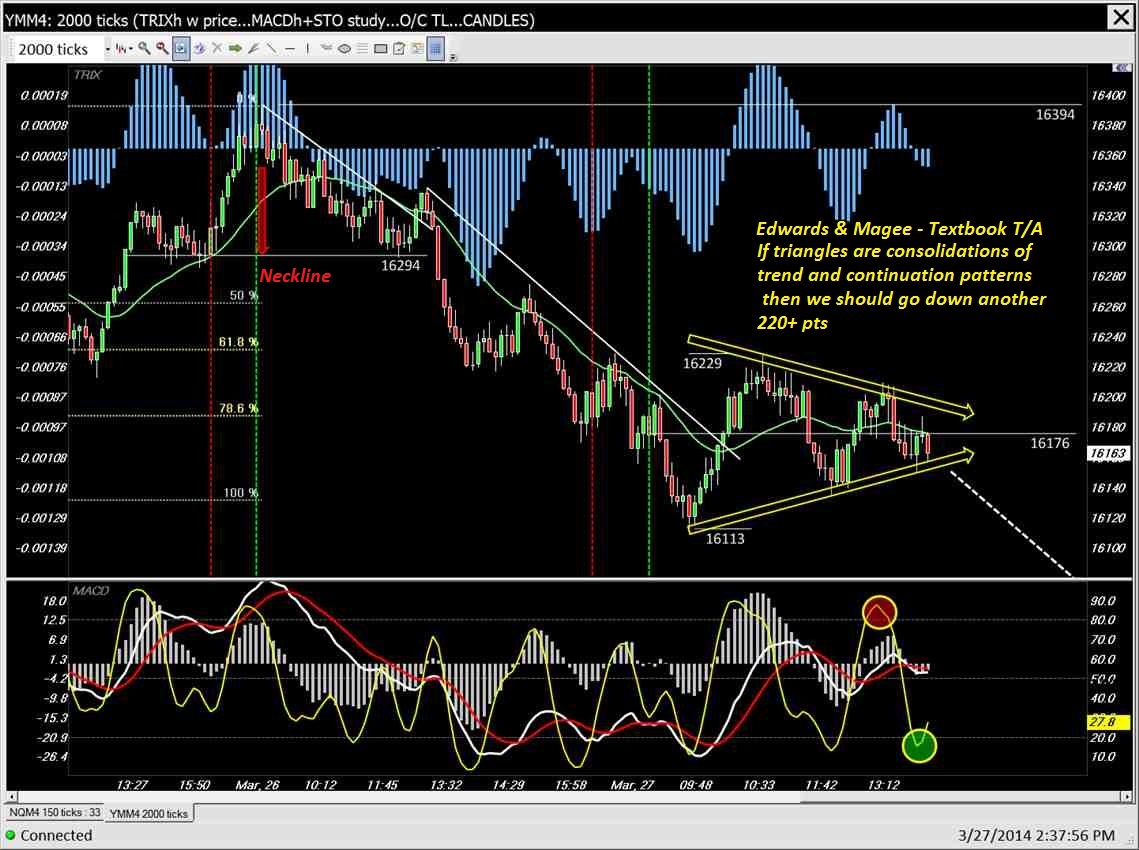
I'll try a different idea... a retrace back to the Brach Zone

Broke the triangle upward - so much for my continuation pattern idea...
couple of pretty well defined patterns
BBG - HUMP busted, next stop TOP-of-Tail

Previously . . . . . .

Might be time to nibble - Handle is pretty well defined and the Stoch-RSI over-sold signal fired off.
Broad strength across the markets today as depicted in the Stocks/Futures watchlists.

Updating
Another way to gauge market strength is the ADV/DEC

Survey about your T/A and Trading preferences ...
Please take the survey
WFC Wells Fargo bank cup & trend ...
Pattern - cup & handle (forming now?) in a strong LT up trend.

CIG...Nice wedge break with volume. Might wait for a pull back from the round number $10 level.
High RSI and O/B stochastic on the daily but can stay that way for some time...

Updating:
FUTs flag chart update...still bullish IMO
Here's a link to a picture viewer that should let the charts fit the screen better (show them smaller).

FUTs Flags on poles...continuation signals

1 2 3 ...pre-major market opening...two out of three is not bad for +13 points per contract.
1) just a feeling...lucky but not a really good entry rational
2) entry on anticipatory 2B potential...not a really good entry rational
3) indicator divergence within the wedge...a good entry rational
Sharpshorts Day Trading

Hate to think could-shoulda but sometimes I can't help it...#3 woulda been a great trade...

BBG broke out of the flag on good volume.
MACD is above the zero line, STO coming out of O/S and TRIXh is moving higher.
Price hit the 50% Fib level then retested the 38%...the BZ 78% and 62% are the next test areas on the way
up to the Measured Move around $27 (which is the 2B HUMP area on the weekly.

CAT KO XOM misc DJI patterns


WONDERING IF THE WEDGE EVENTUALLY BREAKS DOWN
I may have the waves incorrectly numbered - wave 1 could be moved back to the top formed in early 2011 with wave 2 in mid 2011...perhaps wave 3 marks the end of a 1 year, 3 or 5 wave move within the larger wedge (Sept 2011 thru Sept 2012).
LBYE Fibonacci grid to consider...last March through this yr has retraced the down trend to the 50% level so far. Next target area is the BZ (62-78% level)

Here's a 3 month daily and 1 1/2 yr daily

LBYE - looks like a Bull Flag has formed...Can you annotate a chart for me on LBYE
same ol same ol,
What if we just filled the biggest gap in history with the SNP?
Were playing UVXY and TVIX now; I would buy at the end of today.
It would be nice to see the chart from last year from Today date in 2012 through end of june,
Regarding YANG, your aware of YINN?
regards
Re UVXY and YANG - the only similarity in patterns I see is the extended down trends both have been in since they were created.
YANG is slated for a 1 for 5 reverse split April 1st...will it reinvigorate volume interest or is it more of an April fools joke on it's players?
Weekly charts since inception:

Sharp, lets review UVXY similar pattern to YANG
thanks
Sharp, Go long YINN... don't look back for a while
regards,
YANG pattern did repeat...from here...where?
Possibly a little further into the BZ between 61.8% and 78.6%, towards $13 and the down trend line drawn on the weekly...there's an over-under line there that runs through the middle of the BZ area, starting from Sept.'s low thru the end of November that may add a bit more resistance.
Anyway, it has been a pretty satisfying technical move.

Updating:
SHW - triple top pattern but to short it just because of the pattern, in a market like this seems nuts...perhaps just some puts for a quick pull back in a strong trend...
I find it odd that there wasn't a message board set up for this stock. I started one today [here] but forgot to add myself as moderator...I didn't create an intro figuring I would do it later but I must post at least 3 more messages for iHub to consider adding me...anyone want the job?
Looks like it may have broken out today...

UPDATING TECHNICAL CHART:
Inch by inch, YANG bear crawling

YM simple 2x reverse divergence scalp.
For more details using indicator divergence, visit my blog - Sharpshorts Day Trading.
180 Tick chart showing the divergences and entry point at the trend line break:

180 and 90 tick charts show the trend lines drawn on the 180T transferred to the 90T:

For perspective compare these 18 minute bar, 2 minute bar, 180 tick and 90 tick charts

Looks like they can repeat...
Too early to be counting profits but a nice start.

Housing stocks at a glance...
Weekly- trend since 2011...5 year charts

Daily- one year charts

Weekly without studies

Daily without studies

YANG T/A patterns - Do patterns repeat?
Measured move down, 5+ pts per leg, breaking the down trend lines on increased volume after histogram divergence. Now just looking for the pull back to enter. Target @ $12 if price can retrace the 2nd leg move towards the 61% level as it did last November with the 1st leg.

YANG updating:
|
Followers
|
6
|
Posters
|
|
|
Posts (Today)
|
0
|
Posts (Total)
|
196
|
|
Created
|
02/15/12
|
Type
|
Free
|
| Moderator sharpshorts | |||
| Assistants | |||

|
|
| Volume | |
| Day Range: | |
| Bid Price | |
| Ask Price | |
| Last Trade Time: |