 News
News  Market Data
  Discover
Support: 888-992-3836
Copyright © 2023 InvestorsHub Inc.


Register for free to join our community of investors and share your ideas. You will also get access to streaming quotes, interactive charts, trades, portfolio, live options flow and more tools.
GG wedge
Very much like GG and can find lots of my favorite technical reasons for a long entry - O/S, divergent histogram, 5 wave wedge and has retraced the previous rally into the BZ Fibonacci reversal area...

Updating:
MHK Triangle in a LT channel
Daily updating:
Weekly updating:
Monthly updating:
Daily static:
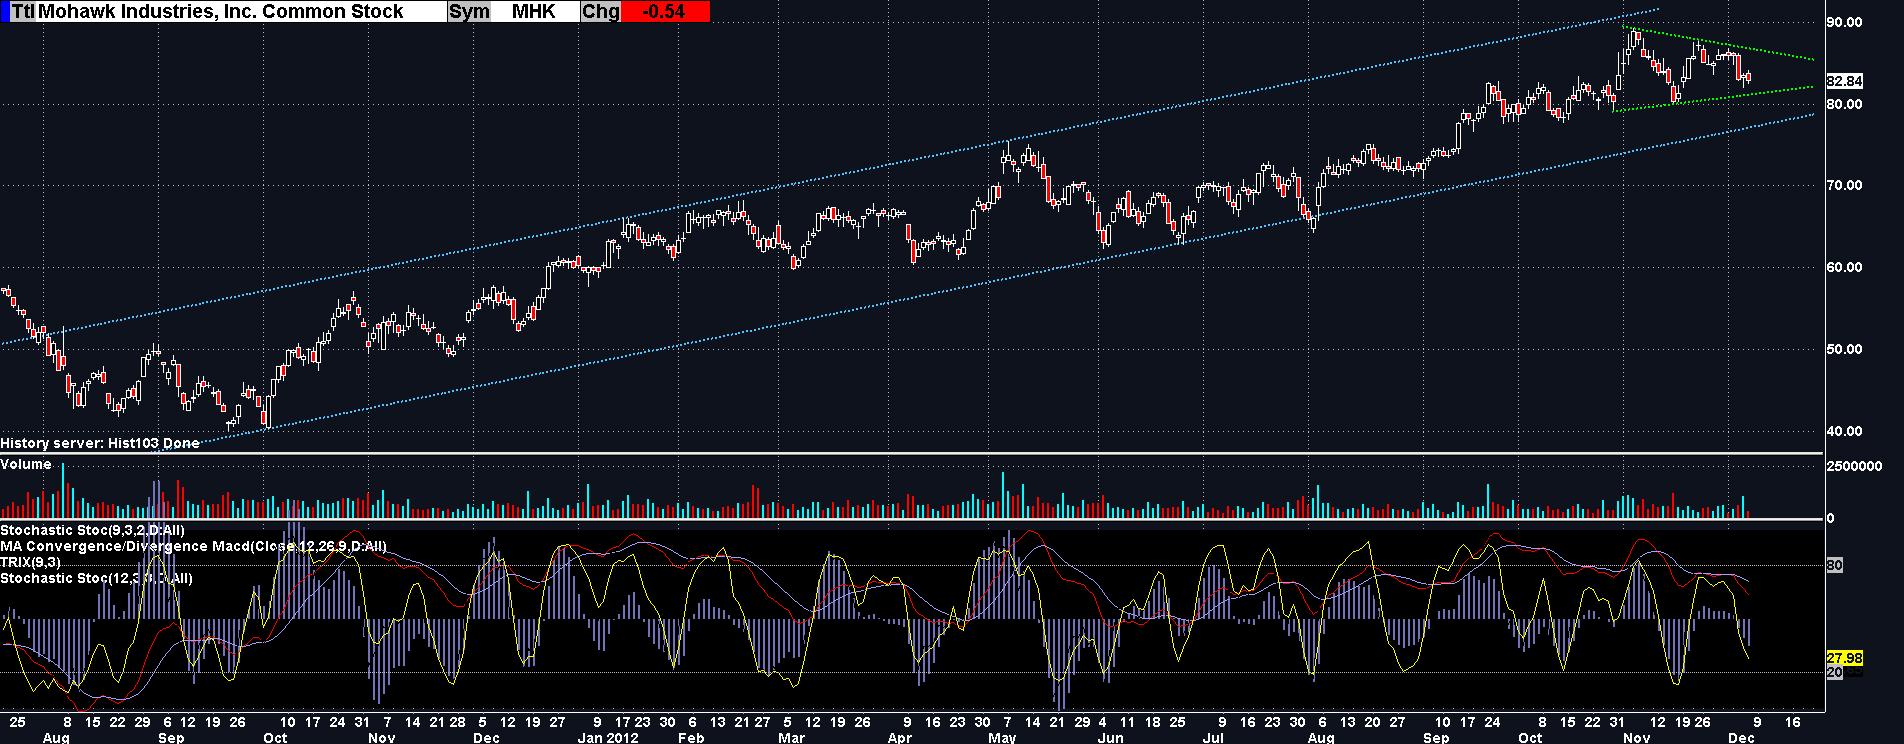
CLR 5 wave wedge and Brach Zone* projection; a possible target area is suggested to ~80.
Price has retraced the Aug-Sept run up, directly into the Brach Zone 61.8-78.6% reversal area
and there is RSI and MACD histo divergence from the recent low.
*Trading in the Brach Zone

Updating:
MANH flagging
Spotted it today (Sunday)...broke the upper flag line Thursday.
The little retrace yesterday sets up a good entry.
Volume conforms to classic flag pattern and stochastic is oversold
The chart below is from kensey's new beta site (he developed ClearStation back in the 1990's)

UPDATING chart from Finviz.com
NEM flagging after driving thru the 2B dragon's hump resistance.
Weekly shows there's still room to move

SPXU bottom call...hammered a bottom Friday albeit outside the wedge...there is some indicator divergence and it's oversold...

Was wrong with this one...
(don't know how this happened...it's never happened to me before)
SIL possible exhaustion gap after the shooting star

Trending...Bottom left to upper right...
Elecric utilities Bermuda
Chemicals USA
Resturants USA
Medical equip USA
more here:
Bottom left to upper right
D...triangle in a channel
Posted by gtlackey on StockTwits

UPDATING:
JAG flagging at the bottom?

Recent "V" bottom on $XAU...

Another minor miner recent flag:

And FCX's action looking bullish to me...

Updating:
QID...another ETF flagging
FAZ...more bear food...flagging after multi bottoms and VXX...FOR THE BEARS...

COG JULY PUTS

COG Bear patterns

COG diamond on daily, H&S on weekly

Weekly

Updating daily
CERN flag on a pole in a nice up trend

Measured move to ~40

Good video seminar...Flag & Pennant Patterns
"An archive recording will be available at www.worden.com/ tomorrow."
Worden Brothers
"The Flag and Pennant patterns don't always get the attention they deserve. As continuation patterns they are often overlooked - a huge oversight on the part of the active investor. Both of these patterns are prevalent, highly recognizable, include actionable signals to buy or sell and have straightforward price objectives. If you have never given this pattern a chance, you should!"

The seminar covers:
How to identify flag and pennant patterns
What the trade implications are for flag and pennant patterns
Common analysis mistakes and how to avoid them
How to create custom formulas you can use to scan for flag and pennant patterns"
...
APC 5 wave down trend break out

updating:
ERX wedge completed... 5th wave bottom was in the BZ fibonacci retrace area and price has
made a break away from the upper trend line although volume has not been that great (may re-test the breakout area).
...the bear H&S came close to it's measured move down (~42).
Upside target - back towards 60.


Updating:
ERX H+S target ~$42 with the (revised) 5th wave
of the wedge resolving in the Brach Zone fibonacci area...

HHSE Flag Breakout on UNDERVALUED $0.03
(2year+ ACCUMULATION looking for break through $0.066. 2yrs ago
CEO paid $0.13 for this profitable transparent revenue generator:
http://investorshub.advfn.com/boards/read_msg.aspx?message_id=73972709
(NOTE: Tick change from TDGI to HHSE for uplisting by YE2012)


4.3.2012


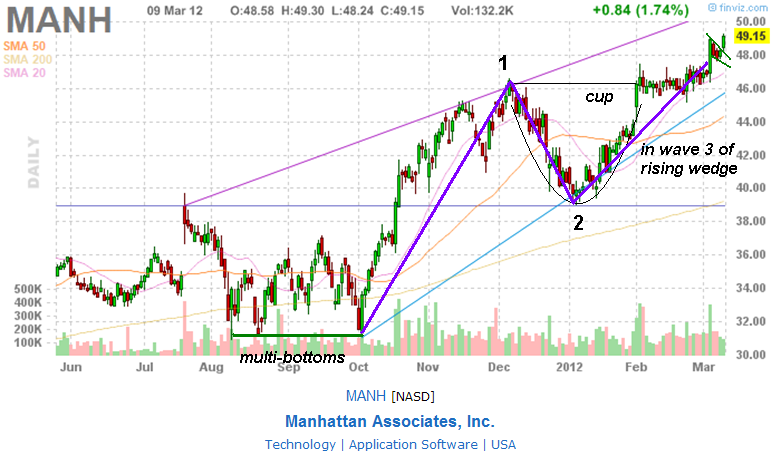
MANH target $50+ for last wave of the rising wedge

FCX BZ 5 WAVE CHANNEL with divergence...
might be worth watching for a break-out of channel

Updating
HOT is building a bear wedge after nice run.
Daily

Weekly

Updating
TZOO's wedge may be breaking after consolidating...
Spec play with April 25 calls, under a buck.

Updating:
MANH BROKE UP OUT OF FLAG...bullish technicals
Chart by BTFOStocks on CHARTLY

MULTIPLE BOTTOMS in Aug and Oct, been driving up since.
Nice cup n handle continuation pattern from Dec thru Feb...
It's in wave 3 of an ascending wedge but looks like there's still much more left...
Updating:
YOKU - a DIAMOND consolidation of the cup's handle

LNKD breaking the flag handle of the larger cup
Chart by JFDI ON CHART.LY

SINA 5-wave wedge completed
Chart by JFDI ON CHART.LY

ASPS FLAGGING
Chart by PennyWallet on StockTwits

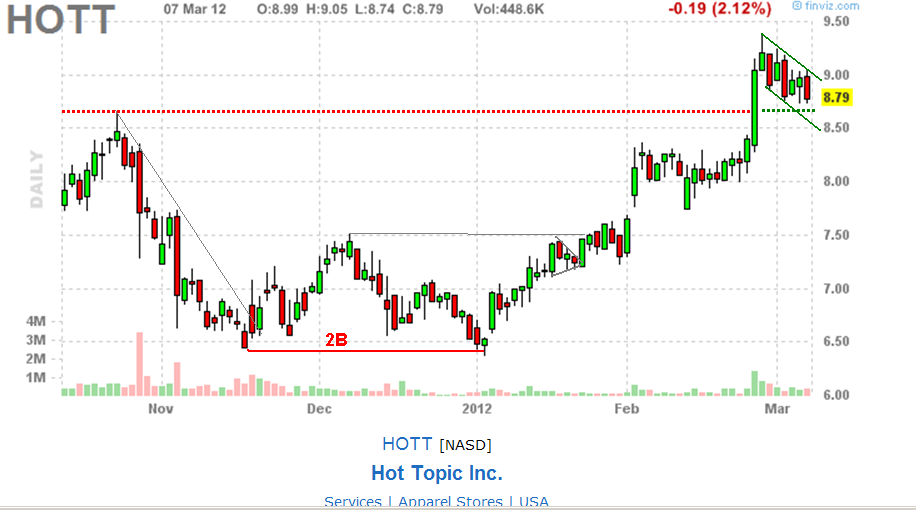
HOTT Flag on a pole above resistance... 2B dragon started the run this year
|
Followers
|
6
|
Posters
|
|
|
Posts (Today)
|
0
|
Posts (Total)
|
196
|
|
Created
|
02/15/12
|
Type
|
Free
|
| Moderator sharpshorts | |||
| Assistants | |||

|
|
| Volume | |
| Day Range: | |
| Bid Price | |
| Ask Price | |
| Last Trade Time: |


