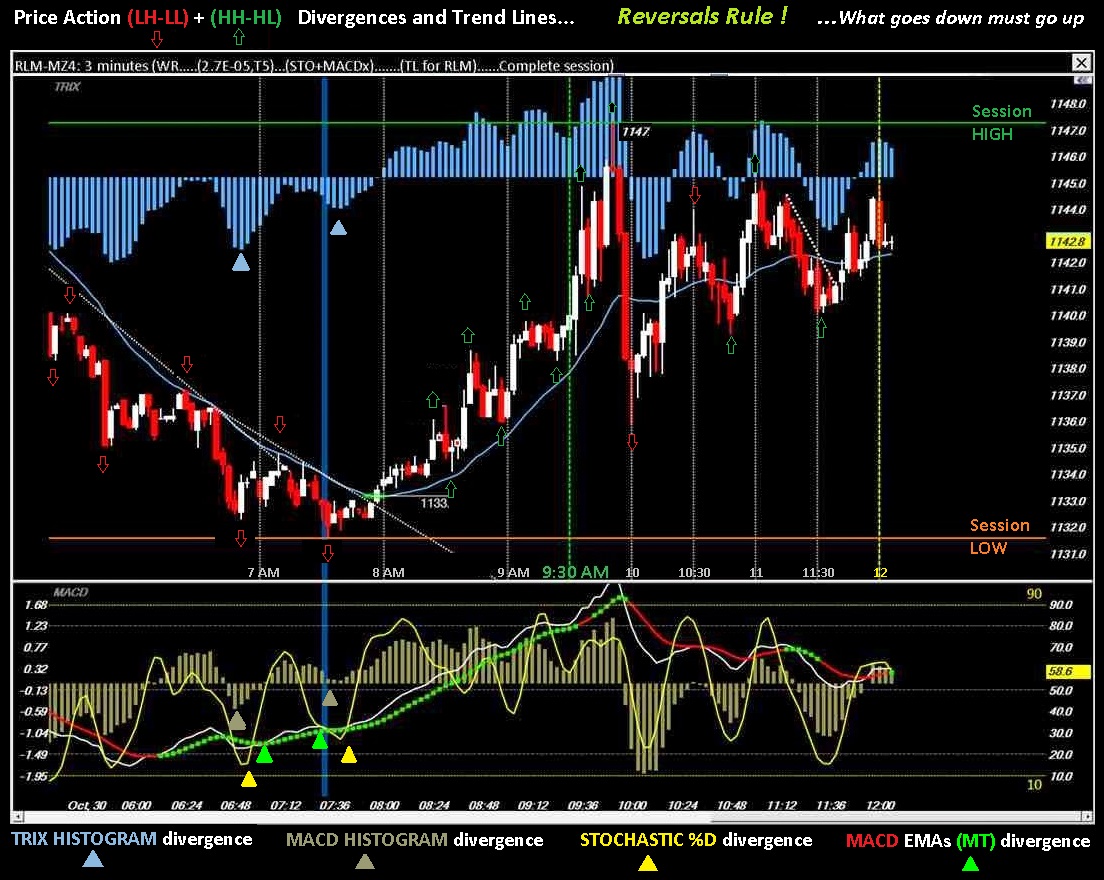
Utilizing Price Action, patterns, Trend Lines, Divergences and Multiple Time Frames... Often all the things listed above come together at the same time which adds to the probability of a reversal in trend. The following charts show an exceptional trade that presented itself in the Russell 2000 e-mini market. Hopefully, you can get past the busy-ness of the annotations on the charts below to catch my drift.
3 Minute per bar chart spanning the early morning session into lunchtime.
75 tick per bar very short term trade entry chart spanning 2 hours of the same session as the 3 minute chart above...the wider blue vertical lines mark the bottom on all charts. It shows all the same Price Action, patterns, Trend Lines, Divergences that I drew on the chart above.
The picture below includes excerpts from my Sharpshorts Day Trading blog. Please visit if you have an interest in learning more about "How I Do It" (click my profile for link) The information presented there comes with no strings attached. There are no sign-up pages, no ads, no hidden agenda and I do not track visitor's addresses.
Register for free to join our community of investors and share your ideas. You will also get access to streaming quotes, interactive charts, trades, portfolio, live options flow and more tools.
 News
News  Market Data
  Discover