Register for free to join our community of investors and share your ideas. You will also get access to streaming quotes, interactive charts, trades, portfolio, live options flow and more tools.
YM BZ retraces and other patterns
Starting with a H&S on the left hand side - this was the day the markets reacted
to news of a major Futures Put option purchase...
Then a triangle - I expected it to be a continuation pattern of the previous down trend...but no...
The next session's rally retraced into the BZ before retracing again into the BZ.
Currently running to the 16500 area forming a bit of an ascending triangle over the past two sessions...
The lime and red vertical lines represent the major markets' open/close...
More examples of BZ areas on fast charts...
The Brach Zone Fibonacci levels (between 61.8% and 78.6%) in a down trend
on a 60 TICK YM chart shows how very often they may occur at times...
YM 2B Dragon with 3xD and BZ target.
Nice set of patterns showing on the 2 hour chart: In a perfect chart pattern world
the e-mini would build a consolidating head ~14480 on Sunday-Monday's sessions before breaking
the dragon's hump ~14500 on its way toward the BZ ~14600.
Some indicator divergences at the dragon's feet too... (2B - double bottom explained here)
CALLING a TOP...in the major markets. I am taking some 'very speculative' bearish swing positions here based mainly on gut feel. The Russel 2000 led the major markets after an inverted H&S with its 'head' last November. All but the tech indices have caught up...the old adage that a sustained rally can't be had without leadership from the technology issues has been bugging me since November...
Trades using SDS ProShares UltraShort S&P 500 ETF:
A 5-wave down trend on the daily has 3xD...looks like the trend line is about to be broken. Target into the BZ ... ... Might also look at SPXU, TNA and DXD
Updating SDS
Some BZ Fibonacci oil charts...may not be that conclusive.
Do we need oil to power up our economy anymore?
[SIC]
1) We are making such great strides with green energy technology
2) Fracking has diminished 'Peak Oil' fear-mongering
3) Global warming will solve the problems related to using oil for heating
4) We can print our way to prosperity
Soon we'll all be singing cume-bah-yah in perfect harmony...
Yes, Silly human, silly human race at around 7:30
Oil will come back eventually but I'm getting tired of waiting to get the Kinks out...
Sharp, please send me an email, I would like to send you a chart for you to evaluate, design a new one with some real TNA software and post somewhere.
gmushk@walla.com
Putting it all together - from my blog
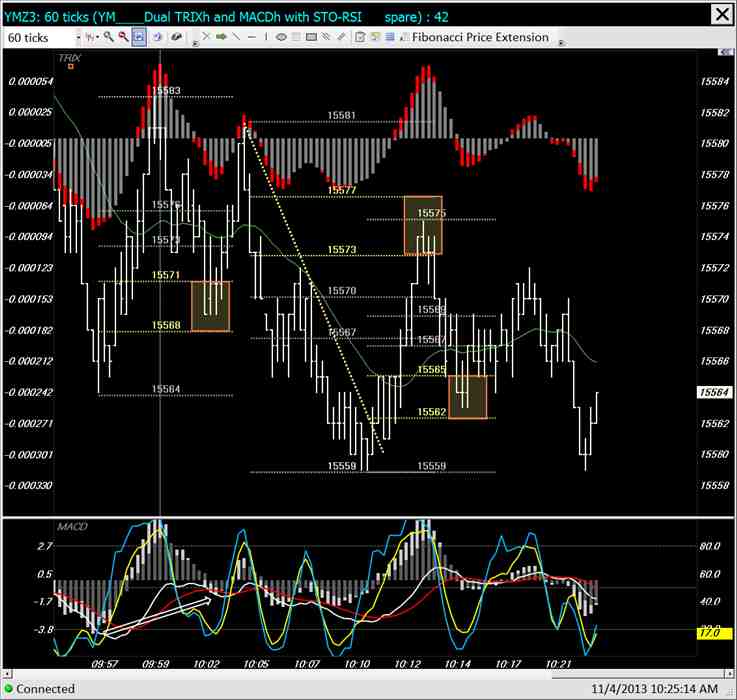
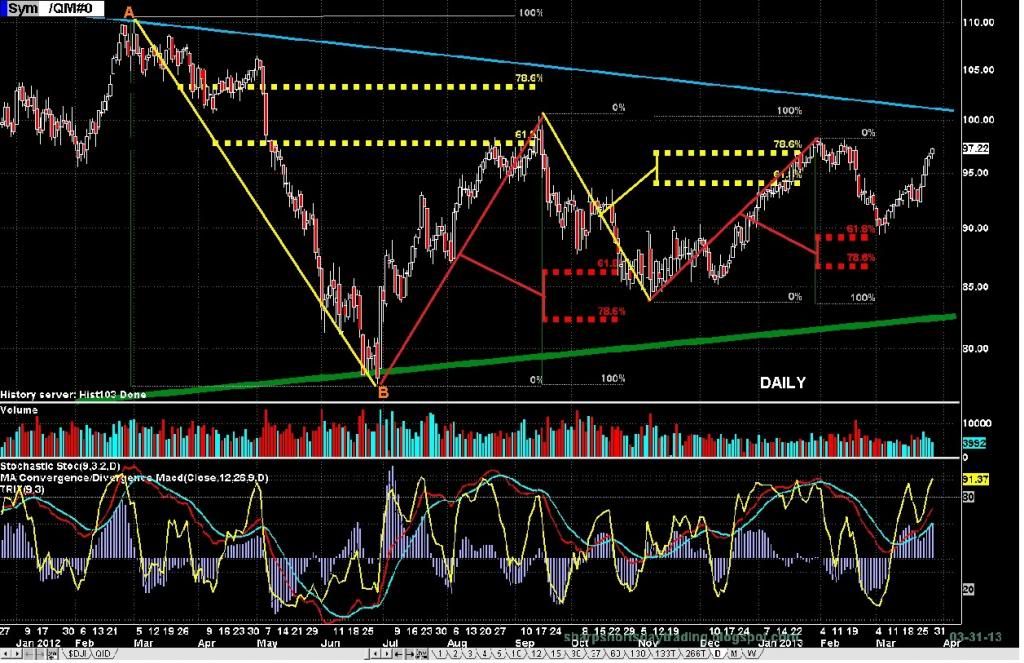
Once you become adjusted to the idiosyncratic nature of all the stuff presented on my blog it becomes second nature - you see the patterns shown in the picture below every time you glance a chart. Not they they always occur at the same time, but sometimes they do...
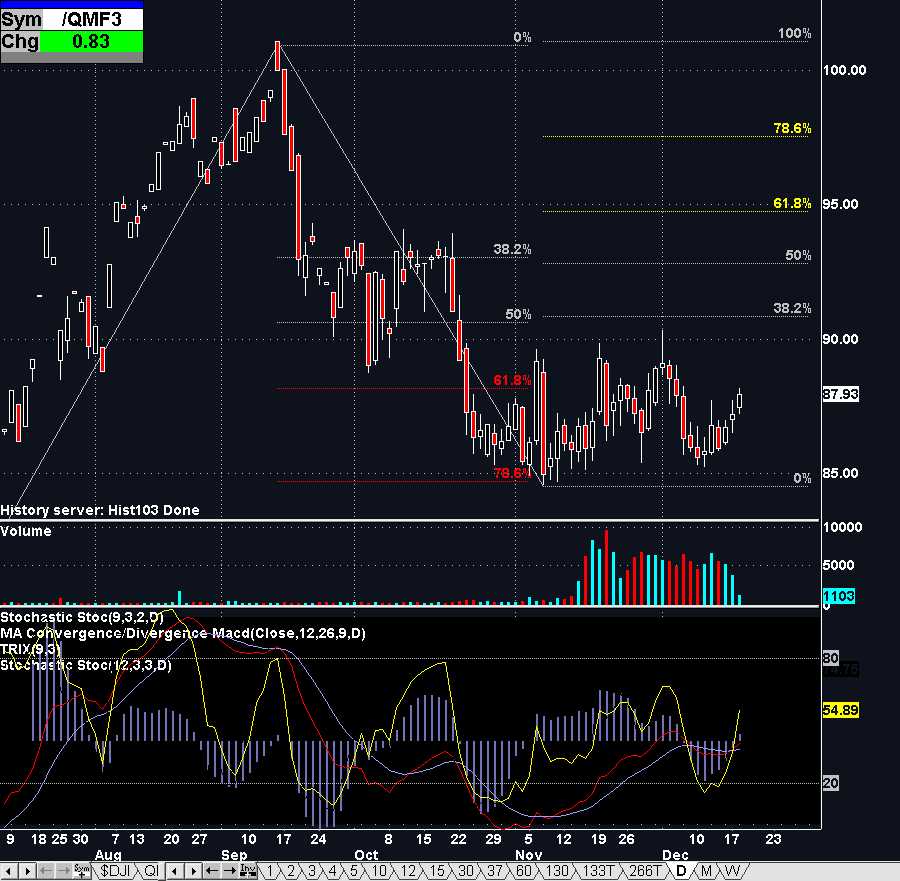
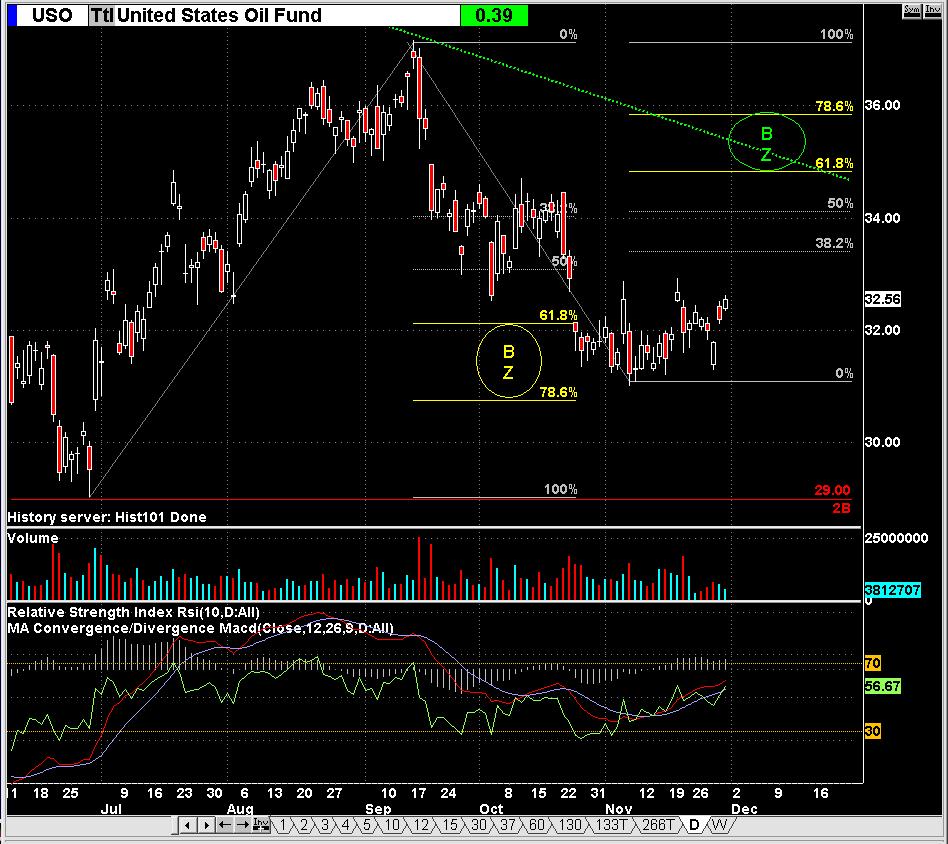
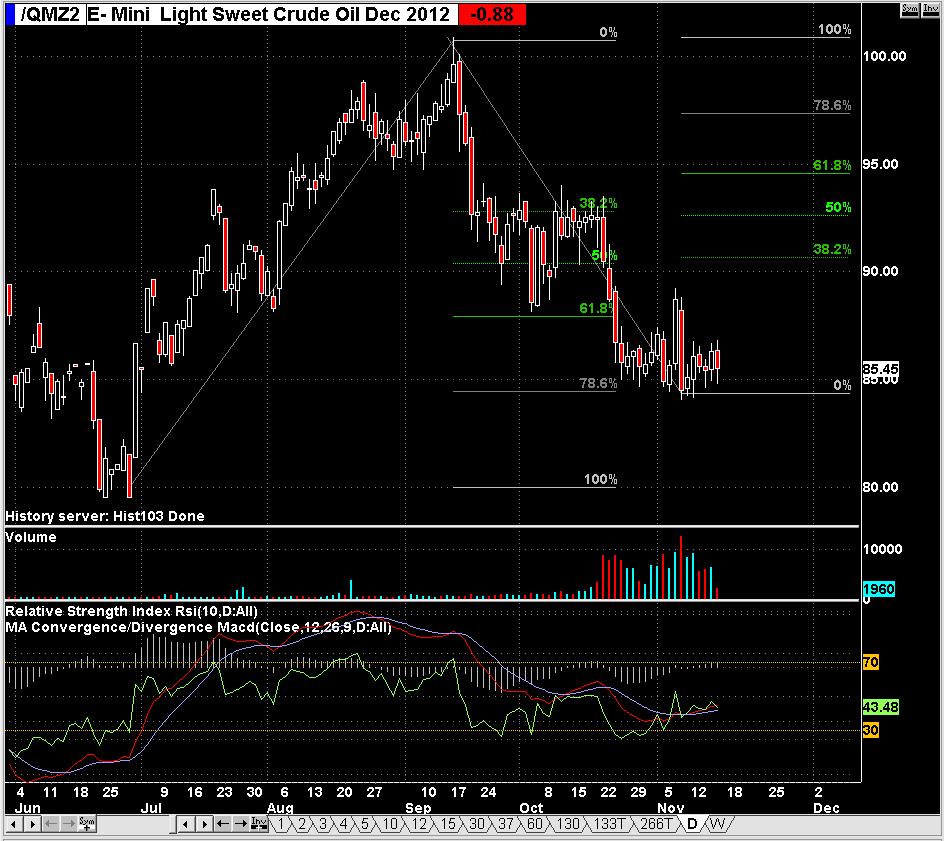
On the left hand side there is a 5-Wave down trend, roughly confined within a Declining Wedge. There just happens to be another, smaller 5-Wave pattern on leg 2-3 of the larger one.
Note: usually the 2-3 wave is the longest of the 5.
Next a small 2B Dragon forms its front feet while 3xD Divergence becomes apparent.
At this point I drew a Brach Zone Fibonacci Grid from the high print at 9:35 AM to the low print around the 10:00 Reversal Zone.
Next we have the Trend Line Break at the circled area. This consolidation creates the Dragon's Head which is just under the level of the Dragon's Hump.
All that's left to do is to get a TTO order filled...Then just sit back and enjoy the ride as price ascends toward the Brach Zone.
...its just that simple :^) .
Updated GDXJ analysis - it did have more downside....though it popped up for a few days before continuing down, it actually overshot the BZ by half a buck or so.
Price is now at resistance for the third time in 30 days - just about where it was in the post this one is replying to when this level served as short term support.
If GDXJ has bottomed ~$19 then the new BZ target can be drawn. The updating Finviz chart below mine looks like it has printed a sloppy inverse H&S.
Followers
|
2
|
Posters
|
|
Posts (Today)
|
0
|
Posts (Total)
|
72
|
Created
|
12/01/12
|
Type
|
Free
|
Moderator sharpshorts | |||
Assistants |
|
|
Volume | |
Day Range: | |
Bid Price | |
Ask Price | |
Last Trade Time: |