 Market Data
  Markets
 News Focus
SPONSORED

Support: 888-992-3836
Copyright © 2023 InvestorsHub Inc.


News Focus
SPONSORED
Explore small cap ideas before they hit the headlines.
* A brief on chart Indicators
https://investorshub.advfn.com/boards/read_msg.aspx?message_id=146368673
chart & TA post thread
https://stockcharts.com/h-sc/ui?s=BDPT&p=W&yr=1&mn=0&dy=0&id=p34307943936&a=1105106922&listNum=2

https://thepatternsite.com/ThreeOutsideUp.html
https://thepatternsite.com/KRD.html
https://thepatternsite.com/gaps.html
https://marketrebellion.com/news/trading-insights/mind-the-gap-gaps-fills-and-how-to-trade-them/
https://school.stockcharts.com/doku.php?id=technical_indicators:trix
https://stockcharts.com/h-sc/ui?s=BDPT&p=D&yr=0&mn=5&dy=0&id=p34906681448&a=639143585

https://stockcharts.com/h-sc/ui?s=BDPT&p=d&yr=0&mn=3&dy=0&id=p24986097784&listNum=23&a=1113701411

https://stockcharts.com/h-sc/ui?s=OTCM&p=D&yr=0&mn=6&dy=0&id=p54835519992

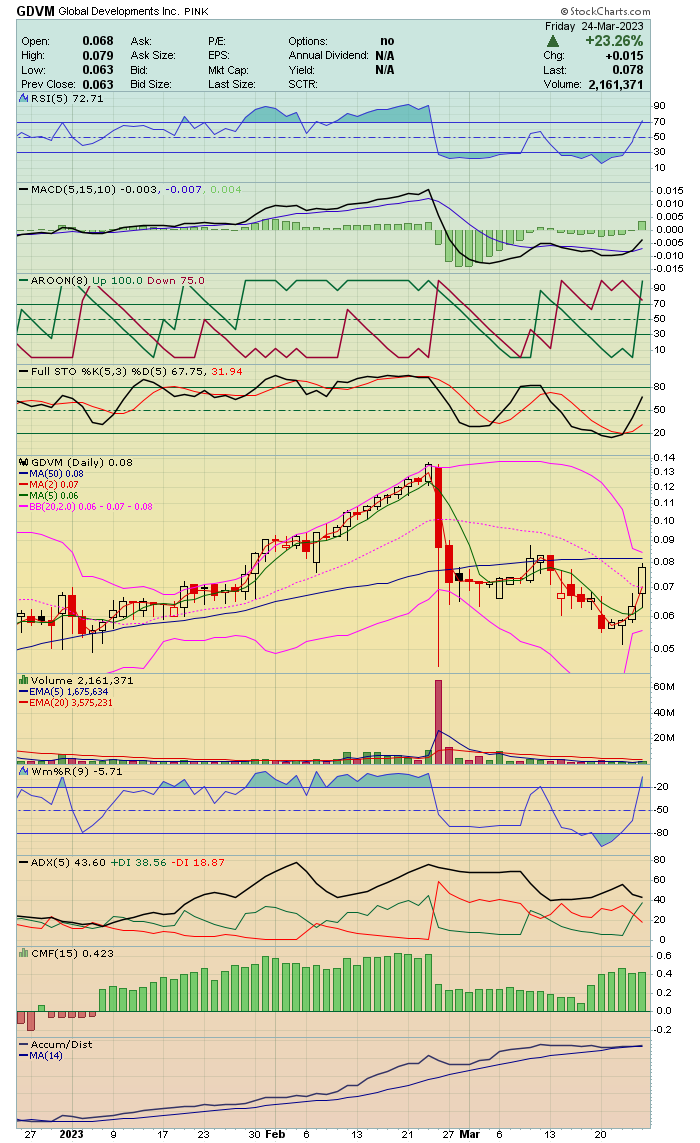
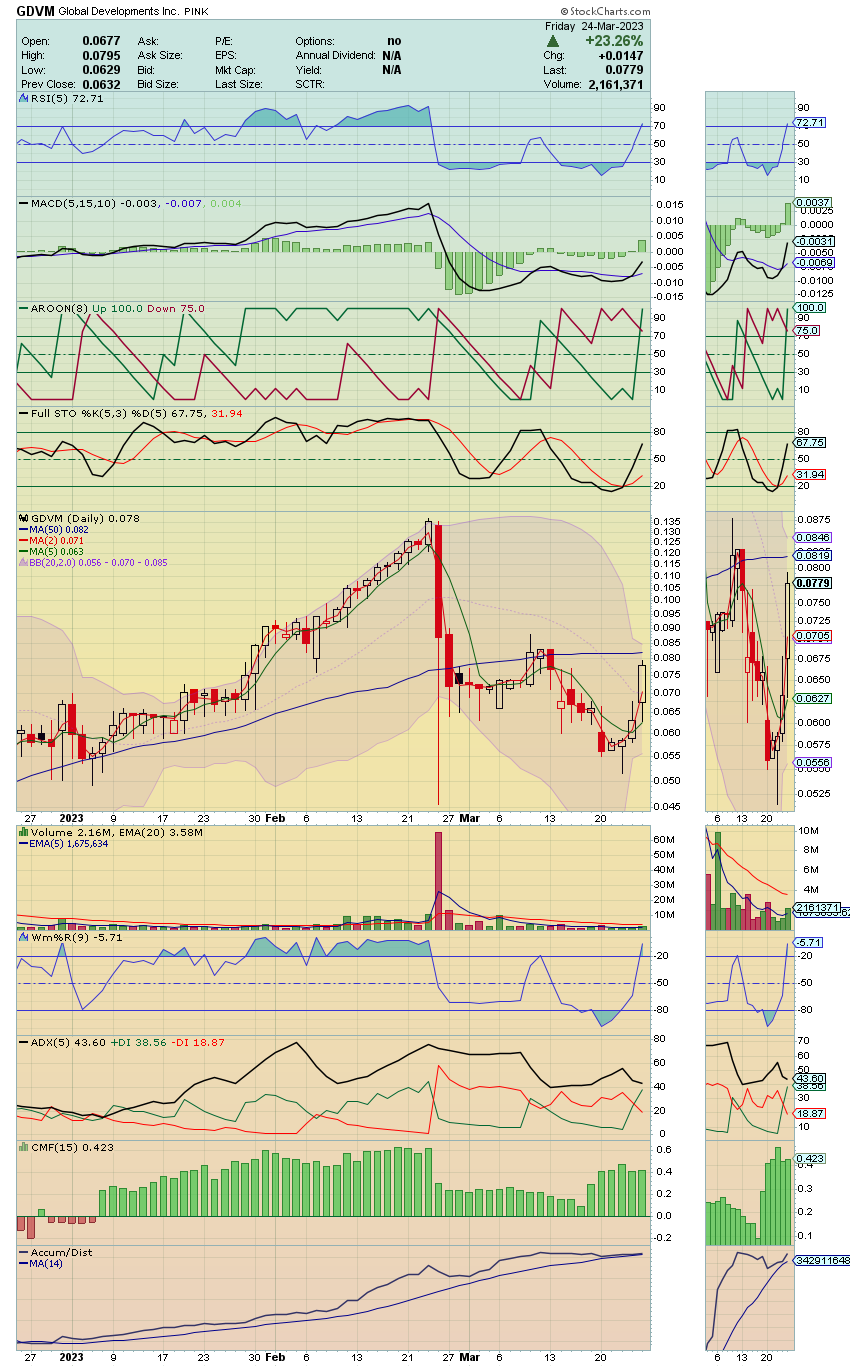
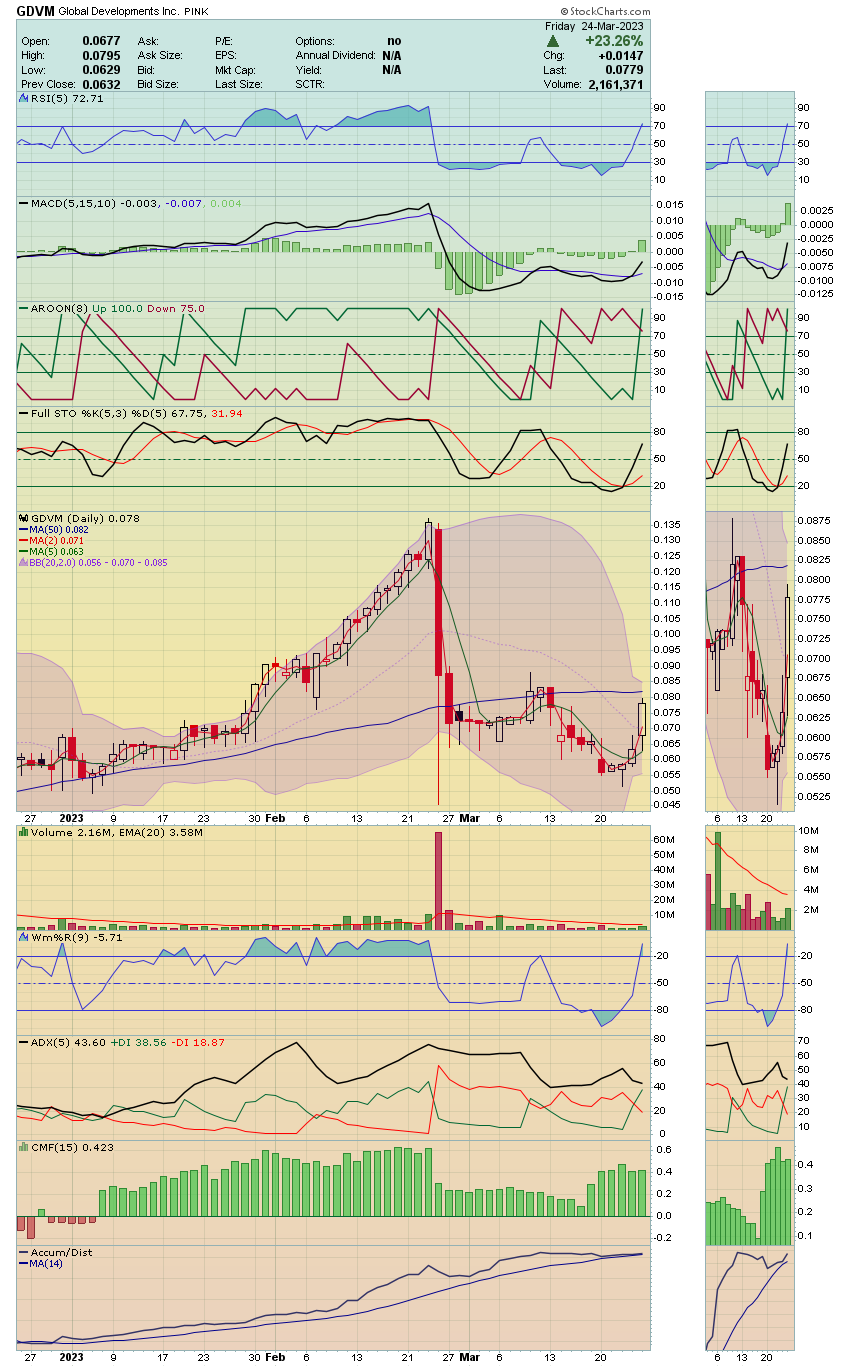
GDVM compound chart~~~ MA(2) & (5) crossed today. There was a Q4 share reduction 92% of the Outstanding Shares. On this one the CEO owns 90% of the float and it is essentially locked, The forth quarter 10-Q is expected this month. The company has undergone a SPAC merger with submission as of February 21 and is awaiting FINRA registration & name change to Veemost Technology Holdings , INC.
Trades	Volume	    VWAP	Dollar Volume	 52 Week Range
 166  	2,161,421   $ 0.07138	$ 154,283	 0.0023 - 0.137

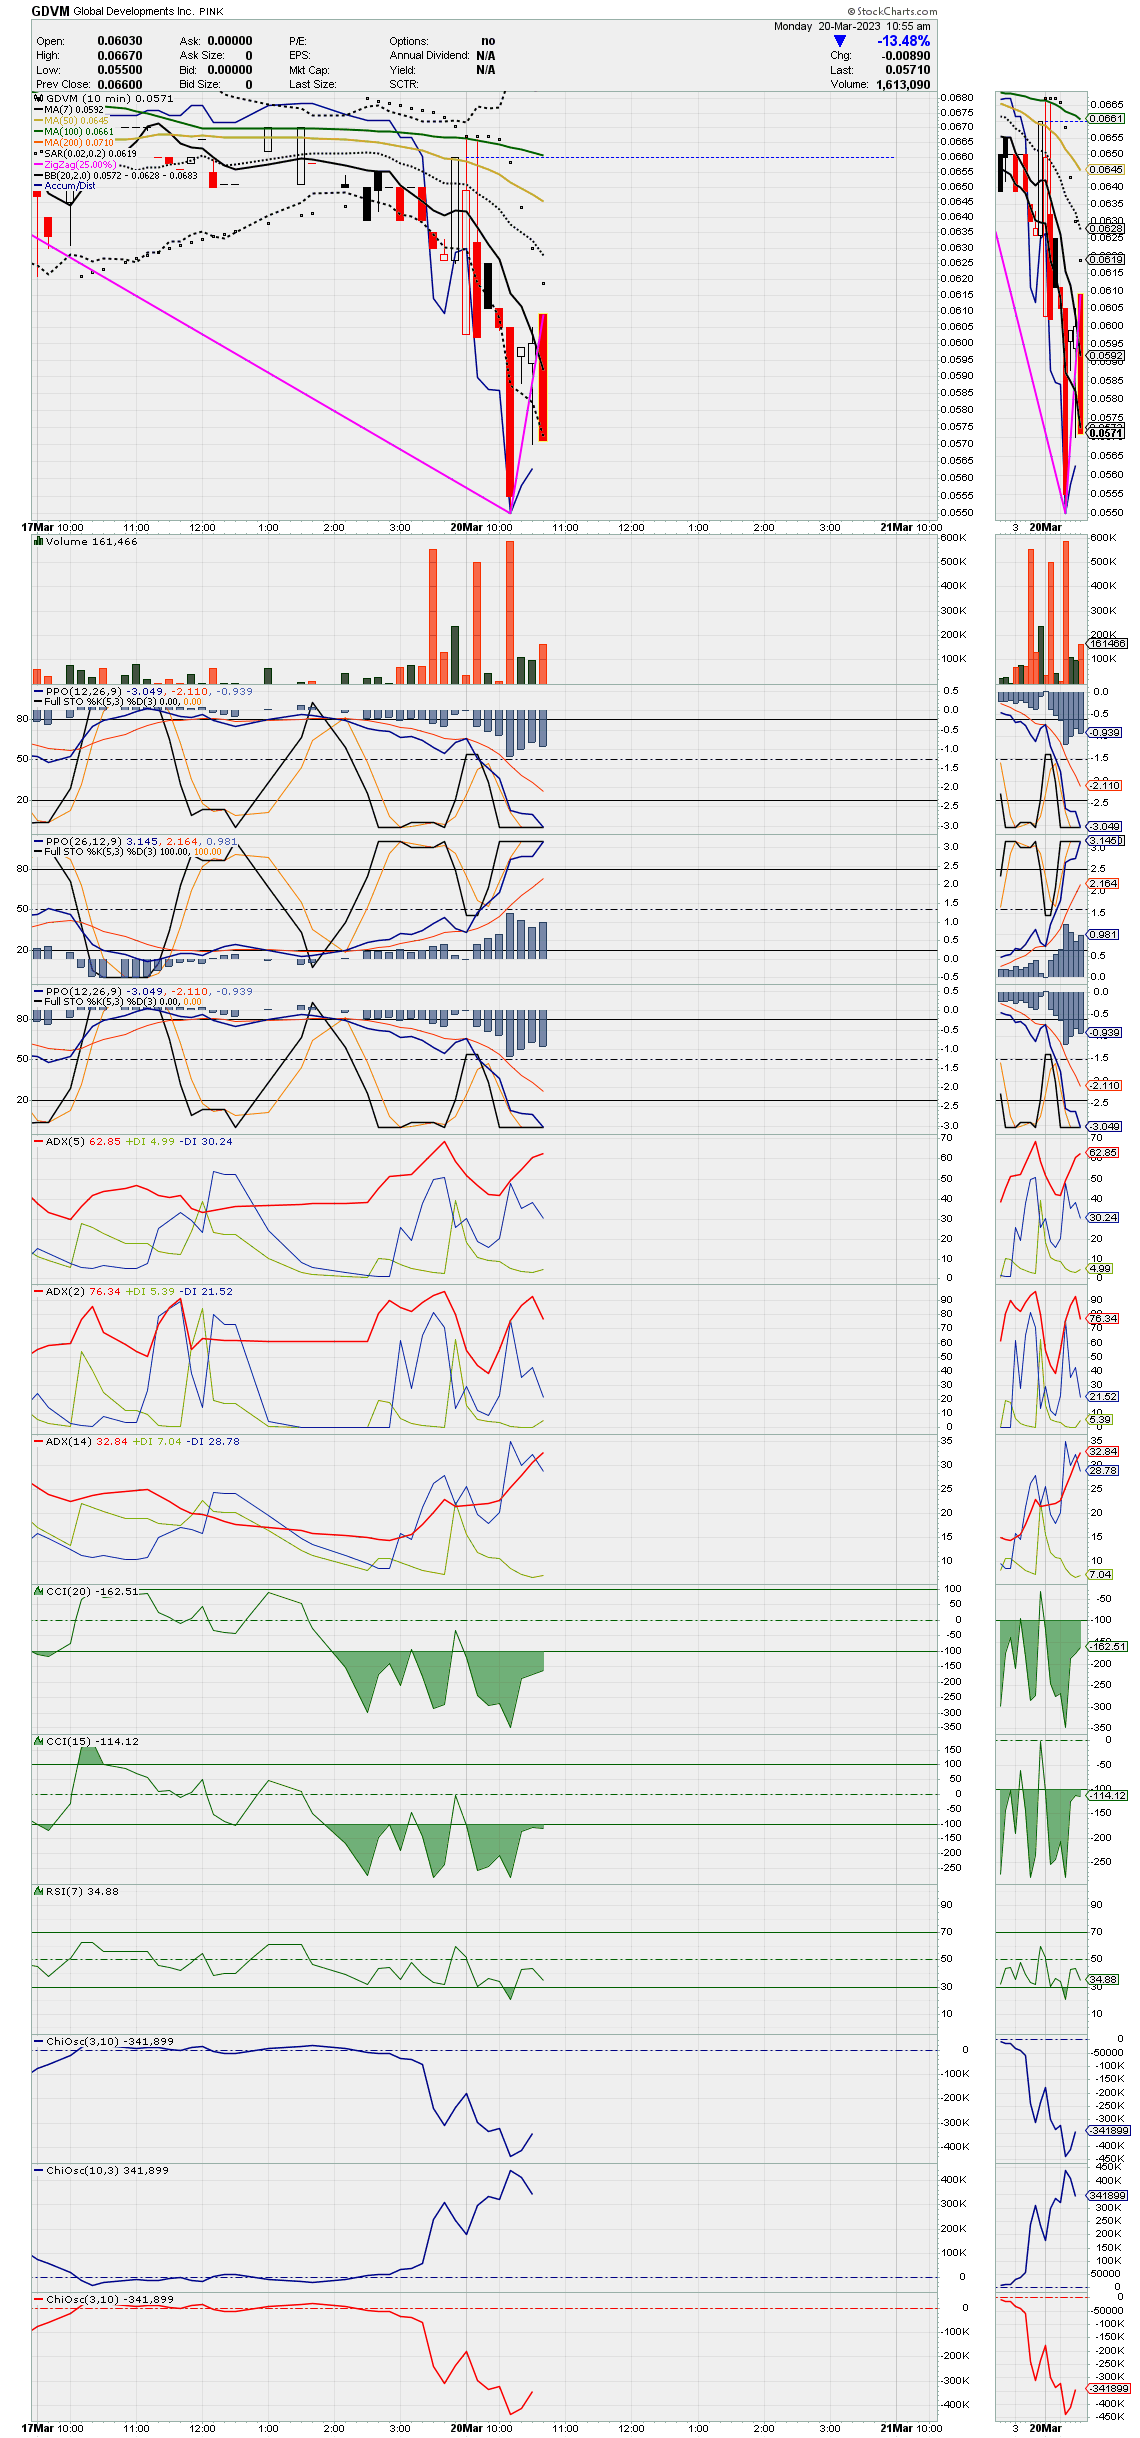
GDVM intraday.charts~~~ Included is inverted 10min. PPO chart.
https://stockcharts.com/c-sc/sc?s=GDVM&p=1&yr=0&mn=0&dy=1&id=p69741074503&a=1100650802&listNum=23

https://stockcharts.com/c-sc/sc?s=GDVM&p=5&yr=0&mn=0&dy=2&id=p69741074503&a=1100650802&listNum=23

https://stockcharts.com/c-sc/sc?s=GDVM&p=15&yr=0&mn=0&dy=7&id=p13378160109&listNum=23&a=1120870561

Short Term Pinch charting~~~ Up-date
This chart only works as 2d 10min
Source & text
http://investorshub.advfn.com/Short-Term-Pinch-(STP)-32033/
  UPDATE: Abbreviated PPO/FullSTO Short Term Pinch or “STP” Chart Explanation May 27th 2017
  You will Find that I made My Chart Very Simple to Follow as you are looking at a Moving Picture.
  With the Abbreviated Chart there are Only 3 Main things to watch,
  The THREE PPO/FullSTO Setups Just Below the Volume and the Candles, The ADX5 with +DI and -DI,
  And the CCI20. That’s it. Follow those and you will Always be Right, Always.

 NOTE A1: When I Say “STP” I am Referring to a “Short Term Pinch”
 NOTE A2: When I SAY CONNECT I am talking about the "Main Blue Line" of the Middle PPO/FullSTO as it Connects to Either the Top PPO/FullSTO or Bottom PPO/FullSTO doing, Very Simple)
  1.Watch the Middle PPO Blue Line and see where it goes. .
  A. If it Coonects to the Bottom PPO the Stock will go Up
  B. If it Connects to the Top PPO the Stock will go Down.
  C.This is what makes Stocks Change Direction.

  2.BUYING: Once you see the Blue PPO Line Connect at the Bottom, Look at the CCI20 and ADX5
  A. Usually the ADX5 +DI will Cross through the -DI first as a Confirmation.
  B. Then Watch and see what the CCI20 does and if it shoots straight up and past the +100 Line The Stock WILL GO UP.
  C. If the CCI20 starts to go up and then rolls over to the right, it’s not ready and you have to wait for it to Complete as it is always best to wait for it to go up through the +100 Line, Could take Second, Minutes, or Hours. (Volume Matters)
  D. Once all this Happens you will see how the Middle and Top PPO’s have Pinched Together and then come apart and keep getting Wider and Wider and at the same time the Stop keeps going Up. Very Simple, This is what these Indicators show, Stock Price Movement.

  3.The Potent Short Term Pinch or “STP”
 When you see Every Line from the Middle PPO/FullSTO go down to the very bottom and Connect, look at the ADX5 just below it.
  If the ADX5 has shot up and gets Really High and almost touches the Point where all 4 of the PPO/FullSTO lines are connected at the Bottom
  this is called a “Short Term Pinch” or “STP”. Once again, Check the CCI20 for Conformation of Completion.These are Very Powerful and the Stock almost always shoots up considerably. This is very Important as it usually from 5 Minutes to a Half Hour for a (STP) develop and Complete and will give everyone time to get money ready to take a position once the (STP) Completes

 Note: If no StockCharts account
  (1) For live chart open link above the chart in a new tab.
  (2) Click on the suppressed image to "explode it".
  (3) Use browser refresh to keep it alive and repeat step 2 explosion.
  http://stockcharts.com/c-sc/sc?s=GDVM&p=10&yr=0&mn=0&dy=2&i=p61286934807&a=527889566&r=1496692598960


  The EZ way to Understand My Abbreviated Short Term Pinch Known as (Big Sams ASTP Chart),

  The Top PPO/FullSTO is the Buying indicator
  The Bottom PPO/FullSTO Is the Sell Indicator.

  The Top and Bottom PPO/FullSTO are Identical

  The Middle PPO/FullSTO Indicator is the Opposite of the Top and Bottom PPO/FullSTO Indicators and is the Key to how it works as it will go to the Top or the Bottom.

  The Heavy Blue Line for the PPO is the Main Indicator Line and when it Hits the FullSTO just ahead of the Other Indicator Lines it sets in motion when buying or selling will occur and gives you a Very Clear Picture of what is Going to Happen,
  If Middle Pinches at the Top, The Price Will Go Up
  If the Middle Pinches at the Bottom the Price Will Drop.
  When all the Lines Come together it looks like an Arrow as they all come to a Point.
  When this Arrow Point Starts to Come Apart it Signals when Buying or Selling will start pending on which PPO/FullSTO Indicators came together (Top is Buying, Bottom is Selling, Really EZ to understand and follow) There is a Chart Below showing SLV in a Full Blown Short Term pinch and also Shows how the Loines Come togther and then Apart. Very Easy to Follow.

  THE "Short Term Pinch" or "STP"
  When you see the ADX5 Spike up and at the same time all 4 lines from the Bottom PPO/FullSTO drop down to the bottom and they Sort of Come Together and then Come Apart, this is called a "Short Term Pinch" or (STP) (The ADX will usually Go up, get close, and then curve back down and right as this happens the 4 PPO/FullSTO Lines Start to Turn up (Called, lifting it’s toes up)
  When this happens the Stock will shoot up and run. (Remember, These are Short Term plays and why they are called a “Short Term Pinch”)
 Make sure you confirm it with the CCI20 as there are Fake outs.
  Need the CCI20 to go straight up and usually past 100 and hold above it to Confirm it.
  Many times it will lay flat over to the right and you have to wait.
  Watch and learn. Once you get the hang of it you will be able to buy before the CCI20 Completes but I don’t want anyone losing money and this is a type of Fail Safe.
  I also check my ADX +DI and -DI Indicators and when the ADX +Indicator crosses up Through the ADX -DI it is a Very Positive Sign. If it crosses Down It’s Negative.
  If you See the ADX14 +DI Crosses up through the ADX14 -DI its a really Good Sign, If the ADX14 +DI Crosses down through the ADX14 -DI I will usually Sell Some Shares
  But you need to look at the whole Picture and the more you watch the better you will get at this and the more Money you will make, Believe me, It becomes Very EZ once you realize what it is you are seeing. I had an AHA Moment when I figured it out.
GDVM compound chart.~~~.December 9 was the day
https://stockcharts.com/h-sc/ui?s=GDVM&p=D&yr=0&mn=3&dy=0&id=p29397895492&listNum=23&a=1093863074

color=green] Compound Chart[/color]
#1. AROON- 8 You watch as the AROON DOWN crosses the 75 down and the AROON UP comes up from zero. Most important. (\0/)
#2. WILLIAMS%R- 9 You watch the line cross the 50.
#3. CMF- 15 You will usually only see growth when the CMF is in the negative.
#4. ADX/DMI-5 You watch as the D+ line either crosses the D-, or crosses above the 20.
#5. MACD histogram- 5,15,10 You watch the negative bars register -50% smaller then the bar before it, or -50% smaller then the largest in the grouping.
#6. Full Stoch- 5,3 You watch the fast line cross the slow line while the AROON DOWN(8) crosses the 87.50. Crossing the 20 would be best, when the Williams agrees.
#7. Bollinger Band 20,2 You watch for the Magic Box to occur when the negative close touches above the lower bolly and the next day’s close to it is positive growth in a white candle.
#8. RSI 5 you watch as the indicator crosses above the 50 for a quick pop.
#9. MA(2) Watch the 2 day MA cross above the 5 day MA. That’s helpful.
#10. MA(2) To sell it just watch the 2 day MA kiss the bottom center of the red candle body.
THE MAGIC BOX
(A) The Magic Box is a pure two-day pattern. Basically the "close" of a red candle printing on or near lower Bollinger Band with the next day printing an "open white candle."
A gift from The Seasonality Stock Reports Board
The reason that I named this setup the Magic Box was so that you could relate to it and remember it faster. Without relationship to something, it is nothing to us. It must be something memorable to you before you can set it into your subconscious mind and see it always.
(A1) On day one the Aroon Down is setting at 100 on the indicator and price is near the lower Bollinger Band. The Candlestick is dark-shadowed.
(A2) On day two, to form the Magic Box, the Aroon Down must drop to 87.50, and price to form a white candle, to complete the box. No other indicator is watched until this occurs for this setup, just the Bollinger Band and the Aroon Down.
If you see a Magic Box develop, that being, on the first day the Aroon Down going from 100.00 while the close is either on or just above the lower Bollinger Band and the second day the Aroon Down is now 87.50, you have a Magic Box.
(B) The buy opportunity occurs when the confirmation of two things happens: on day three or few days later the Aroon Down goes to 75.00 and the Williams%R comes above the -50%. That is the buy. The Williams must come through the -50%. It may take more than three days but you must wait for the confirmation of the William%R. I have seen again and again, the Aroon Down come down from 100.00 to zero without the Williams ever crossing the -50%, those are the ones you pass on. There will be no growth when this happens. At most there is consolidation or a small drop. During this process the Aroon Up can rise slowly but without the Williams you have nothing.
There are other Magic Boxes that develop in a stock's life cycle, too, and they, too, can give great growth. These are the supported median, the floating, and the rising Magic Boxes. The buy-in criteria, though, will remain the same for all of them. The Aroon Down comes to the 75.00 and the Williams crosses the -50%. June 7th, 8th, and 9th accomplish this in the 2007 HGR chart, though the William%R took until June 13th to confirm. You must wait.
Trading: It is highly recommended that you paper trade the system to familiarize yourself with it thoroughly. As with anything in life nothing is guaranteed, so, always use appropriate stop loss according to your risk tolerance.
Kenneth J. Goodrich
http://investorshub.advfn.com/SEASONALITY-STOCK-REPORTS-1616/
Example
http://investorshub.advfn.com/boards/read_msg.aspx?message_id=37119243
Sell trigger
https://investorshub.advfn.com/boards/replies.aspx?msg=40130527
GDVM magic box~~~ August 26 was breakout day MA(2) & MA(5) crossed. First target sell October 11 when MA(2) crossed lower third of red candle however after a -20% drop during the week we saw a buy October 17 with another MA 2 & 5 cross... and we are still cruising North.
Note: Using both log & linear charts so we don't miss stuff.
https://stockcharts.com/h-sc/ui?s=GDVM&p=D&yr=0&mn=3&dy=0&i=p8114168745c&a=635806730&r=1544761759229

https://stockcharts.com/h-sc/ui?s=GDVM&p=D&yr=0&mn=3&dy=0&id=p29397895492&listNum=23&a=1093863074

Compound Chart
#1. AROON- 8 You watch as the AROON DOWN crosses the 75 down and the AROON UP comes up from zero. Most important. (\0/)
#2. WILLIAMS%R- 9 You watch the line cross the 50.
#3. CMF- 15 You will usually only see growth when the CMF is in the negative.
#4. ADX/DMI-5 You watch as the D+ line either crosses the D-, or crosses above the 20.
#5. MACD histogram- 5,15,10 You watch the negative bars register -50% smaller then the bar before it, or -50% smaller then the largest in the grouping.
#6. Full Stoch- 5,3 You watch the fast line cross the slow line while the AROON DOWN(8) crosses the 87.50. Crossing the 20 would be best, when the Williams agrees.
#7. Bollinger Band 20,2 You watch for the Magic Box to occur when the negative close touches above the lower bolly and the next day’s close to it is positive growth in a white candle.
#8. RSI 5 you watch as the indicator crosses above the 50 for a quick pop.
#9. MA(2) Watch the 2 day MA cross above the 5 day MA. That’s helpful.
#10. MA(2) To sell it just watch the 2 day MA kiss the bottom center of the red candle body.
THE MAGIC BOX
(A) The Magic Box is a pure two-day pattern. Basically the "close" of a red candle printing on or near lower Bollinger Band with the next day printing an "open white candle."
A gift from The Seasonality Stock Reports Board
The reason that I named this setup the Magic Box was so that you could relate to it and remember it faster. Without relationship to something, it is nothing to us. It must be something memorable to you before you can set it into your subconscious mind and see it always.
(A1) On day one the Aroon Down is setting at 100 on the indicator and price is near the lower Bollinger Band. The Candlestick is dark-shadowed.
(A2) On day two, to form the Magic Box, the Aroon Down must drop to 87.50, and price to form a white candle, to complete the box. No other indicator is watched until this occurs for this setup, just the Bollinger Band and the Aroon Down.
If you see a Magic Box develop, that being, on the first day the Aroon Down going from 100.00 while the close is either on or just above the lower Bollinger Band and the second day the Aroon Down is now 87.50, you have a Magic Box.
(B) The buy opportunity occurs when the confirmation of two things happens: on day three or few days later the Aroon Down goes to 75.00 and the Williams%R comes above the -50%. That is the buy. The Williams must come through the -50%. It may take more than three days but you must wait for the confirmation of the William%R. I have seen again and again, the Aroon Down come down from 100.00 to zero without the Williams ever crossing the -50%, those are the ones you pass on. There will be no growth when this happens. At most there is consolidation or a small drop. During this process the Aroon Up can rise slowly but without the Williams you have nothing.
There are other Magic Boxes that develop in a stock's life cycle, too, and they, too, can give great growth. These are the supported median, the floating, and the rising Magic Boxes. The buy-in criteria, though, will remain the same for all of them. The Aroon Down comes to the 75.00 and the Williams crosses the -50%. June 7th, 8th, and 9th accomplish this in the 2007 HGR chart, though the William%R took until June 13th to confirm. You must wait.
Trading: It is highly recommended that you paper trade the system to familiarize yourself with it thoroughly. As with anything in life nothing is guaranteed, so, always use appropriate stop loss according to your risk tolerance.
Kenneth J. Goodrich
http://investorshub.advfn.com/SEASONALITY-STOCK-REPORTS-1616/
Example
http://investorshub.advfn.com/boards/read_msg.aspx?message_id=37119243
Sell trigger
https://investorshub.advfn.com/boards/replies.aspx?msg=40130527
GDVM another clean, low volume shell. See if this one works Frankiy.
Looks like we are on the second consolidation step of this run.
https://stockcharts.com/h-sc/ui?s=gdvm&p=D&yr=0&mn=3&dy=0&id=p29397895492&listNum=23&a=1093863074

JPEX chart~~~ Inverted PPO in the Short Term Pinch.
Short Term Pinch charting
This chart only works as 2d 10min
Source & text
http://investorshub.advfn.com/Short-Term-Pinch-(STP)-32033/
UPDATE: Abbreviated PPO/FullSTO Short Term Pinch or “STP” Chart Explanation May 27th 2017
You will Find that I made My Chart Very Simple to Follow as you are looking at a Moving Picture.
With the Abbreviated Chart there are Only 3 Main things to watch,
The THREE PPO/FullSTO Setups Just Below the Volume and the Candles, The ADX5 with +DI and -DI,
And the CCI20. That’s it. Follow those and you will Always be Right, Always.
NOTE A1: When I Say “STP” I am Referring to a “Short Term Pinch”
NOTE A2: When I SAY CONNECT I am talking about the "Main Blue Line" of the Middle PPO/FullSTO as it Connects to Either the Top PPO/FullSTO or Bottom PPO/FullSTO doing, Very Simple)
1.Watch the Middle PPO Blue Line and see where it goes. .
A. If it Coonects to the Bottom PPO the Stock will go Up
B. If it Connects to the Top PPO the Stock will go Down.
C.This is what makes Stocks Change Direction.
2.BUYING: Once you see the Blue PPO Line Connect at the Bottom, Look at the CCI20 and ADX5
A. Usually the ADX5 +DI will Cross through the -DI first as a Confirmation.
B. Then Watch and see what the CCI20 does and if it shoots straight up and past the +100 Line The Stock WILL GO UP.
C. If the CCI20 starts to go up and then rolls over to the right, it’s not ready and you have to wait for it to Complete as it is always best to wait for it to go up through the +100 Line, Could take Second, Minutes, or Hours. (Volume Matters)
D. Once all this Happens you will see how the Middle and Top PPO’s have Pinched Together and then come apart and keep getting Wider and Wider and at the same time the Stop keeps going Up. Very Simple, This is what these Indicators show, Stock Price Movement.
3.The Potent Short Term Pinch or “STP”
When you see Every Line from the Middle PPO/FullSTO go down to the very bottom and Connect, look at the ADX5 just below it.
If the ADX5 has shot up and gets Really High and almost touches the Point where all 4 of the PPO/FullSTO lines are connected at the Bottom
this is called a “Short Term Pinch” or “STP”. Once again, Check the CCI20 for Conformation of Completion.These are Very Powerful and the Stock almost always shoots up considerably. This is very Important as it usually from 5 Minutes to a Half Hour for a (STP) develop and Complete and will give everyone time to get money ready to take a position once the (STP) Completes
Note: If no StockCharts account
(1) For live chart open link above the chart in a new tab.
(2) Click on the suppressed image to "explode it".
(3) Use browser refresh to keep it alive and repeat step 2 explosion.
http://stockcharts.com/c-sc/sc?s=JPEX&p=10&yr=0&mn=0&dy=2&i=p61286934807&a=527889566&r=1496692598960
* Workbench for annotations only if you have StockCharts account.
http://stockcharts.com/h-sc/ui?s=JPEX&p=10&yr=0&mn=0&dy=2&i=p61286934807&a=527889566&r=1496692598960

The EZ way to Understand My Abbreviated Short Term Pinch Known as (Big Sams ASTP Chart),
The Top PPO/FullSTO is the Buying indicator
The Bottom PPO/FullSTO Is the Sell Indicator.
The Top and Bottom PPO/FullSTO are Identical
The Middle PPO/FullSTO Indicator is the Opposite of the Top and Bottom PPO/FullSTO Indicators and is the Key to how it works as it will go to the Top or the Bottom.
The Heavy Blue Line for the PPO is the Main Indicator Line and when it Hits the FullSTO just ahead of the Other Indicator Lines it sets in motion when buying or selling will occur and gives you a Very Clear Picture of what is Going to Happen,
If Middle Pinches at the Top, The Price Will Go Up
If the Middle Pinches at the Bottom the Price Will Drop.
When all the Lines Come together it looks like an Arrow as they all come to a Point.
When this Arrow Point Starts to Come Apart it Signals when Buying or Selling will start pending on which PPO/FullSTO Indicators came together (Top is Buying, Bottom is Selling, Really EZ to understand and follow) There is a Chart Below showing SLV in a Full Blown Short Term pinch and also Shows how the Loines Come togther and then Apart. Very Easy to Follow.
THE "Short Term Pinch" or "STP"
When you see the ADX5 Spike up and at the same time all 4 lines from the Bottom PPO/FullSTO drop down to the bottom and they Sort of Come Together and then Come Apart, this is called a "Short Term Pinch" or (STP) (The ADX will usually Go up, get close, and then curve back down and right as this happens the 4 PPO/FullSTO Lines Start to Turn up (Called, lifting it’s toes up)
When this happens the Stock will shoot up and run. (Remember, These are Short Term plays and why they are called a “Short Term Pinch”)
Make sure you confirm it with the CCI20 as there are Fake outs.
Need the CCI20 to go straight up and usually past 100 and hold above it to Confirm it.
Many times it will lay flat over to the right and you have to wait.
Watch and learn. Once you get the hang of it you will be able to buy before the CCI20 Completes but I don’t want anyone losing money and this is a type of Fail Safe.
I also check my ADX +DI and -DI Indicators and when the ADX +Indicator crosses up Through the ADX -DI it is a Very Positive Sign. If it crosses Down It’s Negative.
If you See the ADX14 +DI Crosses up through the ADX14 -DI its a really Good Sign, If the ADX14 +DI Crosses down through the ADX14 -DI I will usually Sell Some Shares
But you need to look at the whole Picture and the more you watch the better you will get at this and the more Money you will make, Believe me, It becomes Very EZ once you realize what it is you are seeing. I had an AHA Moment when I figured it out.
IMUC yes. We are in the RM waiting game, put it in your Alert box for now.
Thanks for responding here, it's been awhile. 
@tothe
Your IMUC needs some more volume.
Frankiy; IMUC. I think this is a sleeper. I am the only MOD on the board keeping the IBOX updated. OBV shows recovery from a big dip last week. It is a RM in progress that looks more like a Reverse Takeover of a clean shell.
https://stockcharts.com/h-sc/ui?s=IMUC&p=D&yr=0&mn=3&dy=10&i=p3561776201c&a=646884267&r=1550521699656

8-34 technical
https://stockcharts.com/h-sc/ui?s=IMUC&p=D&yr=0&mn=3&dy=2&id=p82428392653&a=1091653751&listNum=23

https://stockcharts.com/h-sc/ui?s=IMUC&p=W&yr=2&mn=1&dy=0&id=p13951696155&listNum=23&a=1088694599

Spifster posted bail for.you on the ZNOG board. So welcome back!
I sent a message to the Admin that had banned JRyan, and now JRyan's name does not appear on the ban list. If you have a way to contact him, please let him know he should be able to post again.
LGBS 8/34 chart~~~ Live, Stockscores
* We did have the EMA(8) and EMA(34) cross today.
This is a TREND, VOLUME, MOMO collinear chart, however Volume Money is represented by CMF (Volume Money pressure) and MFI (RSI of Volume Money)
Chart source
https://www.stockscores.com/charts/charts/
Template & Image address, live
https://www.stockscores.com/chart.asp?TickerSymbol=LGBS&TimeRange=180&Interval=d&Volume=1&ChartType=CandleStick&Stockscores=None&ChartWidth=1100&ChartHeight=480&LogScale=None&Band=None&avgType1=EMA&movAvg1=8&avgType2=EMA&movAvg2=34&Indicator1=ADX&Indicator2=StochRSI&Indicator3=CMF&Indicator4=MFI&endDate=2021-9-2&CompareWith=&entryPrice=&stopLossPrice=&candles=redgreen
DTCC rule change B14811-21 March 24, 2021
https://www.dtcc.com/legal/important-notices?pgs=1

Pete; NewJerichoMan prints the INQD spreadsheet. I was requesting him to post the spreadsheet every month during the dilution phase.
I did not request him to post one for March because there was no dilution.
If you want you could ask him to post an update by posting a message to him on the link below. Then I could cut & paste to the IBOX. Thank you for your interest on this issue.
https://investorshub.advfn.com/boards/replies.aspx?msg=161444730
JRyan could you post another spreadsheet for ZNOG.
It is possible that your probationary period may be over. I as an ZNOG Moderator will put in a good word to reinstate you, it has worked for BahamaPete.
She removed the restriction, thanks for your help tothe...
As a Mod on the ZNOG board you should appeal to IH Admin [Shelly] first for unlimited posts on ZNOG board and promise to be a good buoy.
And me as a MOD on the same board use an link to this post as an Character Reference on your resume.
This is the link to this message post:
https://investorshub.advfn.com/boards/read_msg.aspx?message_id=160096160
I think this would be the proper protocol to restore your posting privileges on the ZNOG board. Your DD would be an asset to the board by the way..
Short Term Pinch charting
This chart only works as 2d 10min
Source & text
http://investorshub.advfn.com/Short-Term-Pinch-(STP)-32033/
UPDATE: Abbreviated PPO/FullSTO Short Term Pinch or “STP” Chart Explanation May 27th 2017
You will Find that I made My Chart Very Simple to Follow as you are looking at a Moving Picture.
With the Abbreviated Chart there are Only 3 Main things to watch,
The THREE PPO/FullSTO Setups Just Below the Volume and the Candles, The ADX5 with +DI and -DI,
And the CCI20. That’s it. Follow those and you will Always be Right, Always.
NOTE A1: When I Say “STP” I am Referring to a “Short Term Pinch”
NOTE A2: When I SAY CONNECT I am talking about the "Main Blue Line" of the Middle PPO/FullSTO as it Connects to Either the Top PPO/FullSTO or Bottom PPO/FullSTO doing, Very Simple)
1.Watch the Middle PPO Blue Line and see where it goes. .
A. If it Coonects to the Bottom PPO the Stock will go Up
B. If it Connects to the Top PPO the Stock will go Down.
C.This is what makes Stocks Change Direction.
2.BUYING: Once you see the Blue PPO Line Connect at the Bottom, Look at the CCI20 and ADX5
A. Usually the ADX5 +DI will Cross through the -DI first as a Confirmation.
B. Then Watch and see what the CCI20 does and if it shoots straight up and past the +100 Line The Stock WILL GO UP.
C. If the CCI20 starts to go up and then rolls over to the right, it’s not ready and you have to wait for it to Complete as it is always best to wait for it to go up through the +100 Line, Could take Second, Minutes, or Hours. (Volume Matters)
D. Once all this Happens you will see how the Middle and Top PPO’s have Pinched Together and then come apart and keep getting Wider and Wider and at the same time the Stop keeps going Up. Very Simple, This is what these Indicators show, Stock Price Movement.
3.The Potent Short Term Pinch or “STP”
When you see Every Line from the Middle PPO/FullSTO go down to the very bottom and Connect, look at the ADX5 just below it.
If the ADX5 has shot up and gets Really High and almost touches the Point where all 4 of the PPO/FullSTO lines are connected at the Bottom
this is called a “Short Term Pinch” or “STP”. Once again, Check the CCI20 for Conformation of Completion.These are Very Powerful and the Stock almost always shoots up considerably. This is very Important as it usually from 5 Minutes to a Half Hour for a (STP) develop and Complete and will give everyone time to get money ready to take a position once the (STP) Completes
Note: If no StockCharts account
(1) For live chart open link above the chart in a new tab.
(2) Click on the suppressed image to "explode it".
(3) Use browser refresh to keep it alive and repeat step 2 explosion.
http://stockcharts.com/c-sc/sc?s=EVIO&p=10&yr=0&mn=0&dy=2&i=p61286934807&a=527889566&r=1496692598960
* Workbench for annotations only if you have StockCharts account.
http://stockcharts.com/h-sc/ui?s=EVIO&p=10&yr=0&mn=0&dy=2&i=p61286934807&a=527889566&r=1496692598960

The EZ way to Understand My Abbreviated Short Term Pinch Known as (Big Sams ASTP Chart),
The Top PPO/FullSTO is the Buying indicator
The Bottom PPO/FullSTO Is the Sell Indicator.
The Top and Bottom PPO/FullSTO are Identical
The Middle PPO/FullSTO Indicator is the Opposite of the Top and Bottom PPO/FullSTO Indicators and is the Key to how it works as it will go to the Top or the Bottom.
The Heavy Blue Line for the PPO is the Main Indicator Line and when it Hits the FullSTO just ahead of the Other Indicator Lines it sets in motion when buying or selling will occur and gives you a Very Clear Picture of what is Going to Happen,
If Middle Pinches at the Top, The Price Will Go Up
If the Middle Pinches at the Bottom the Price Will Drop.
When all the Lines Come together it looks like an Arrow as they all come to a Point.
When this Arrow Point Starts to Come Apart it Signals when Buying or Selling will start pending on which PPO/FullSTO Indicators came together (Top is Buying, Bottom is Selling, Really EZ to understand and follow) There is a Chart Below showing SLV in a Full Blown Short Term pinch and also Shows how the Loines Come togther and then Apart. Very Easy to Follow.
THE "Short Term Pinch" or "STP"
When you see the ADX5 Spike up and at the same time all 4 lines from the Bottom PPO/FullSTO drop down to the bottom and they Sort of Come Together and then Come Apart, this is called a "Short Term Pinch" or (STP) (The ADX will usually Go up, get close, and then curve back down and right as this happens the 4 PPO/FullSTO Lines Start to Turn up (Called, lifting it’s toes up)
When this happens the Stock will shoot up and run. (Remember, These are Short Term plays and why they are called a “Short Term Pinch”)
Make sure you confirm it with the CCI20 as there are Fake outs.
Need the CCI20 to go straight up and usually past 100 and hold above it to Confirm it.
Many times it will lay flat over to the right and you have to wait.
Watch and learn. Once you get the hang of it you will be able to buy before the CCI20 Completes but I don’t want anyone losing money and this is a type of Fail Safe.
I also check my ADX +DI and -DI Indicators and when the ADX +Indicator crosses up Through the ADX -DI it is a Very Positive Sign. If it crosses Down It’s Negative.
If you See the ADX14 +DI Crosses up through the ADX14 -DI its a really Good Sign, If the ADX14 +DI Crosses down through the ADX14 -DI I will usually Sell Some Shares
But you need to look at the whole Picture and the more you watch the better you will get at this and the more Money you will make, Believe me, It becomes Very EZ once you realize what it is you are seeing. I had an AHA Moment when I figured it out.
INQD collinear chart with TREND, MOMO & VOLUME.MONEY
* For color vision impaired, good for your IPAD.
* Example of an low volume continuation and strong market sentiment waiting for release of two late 10Q's.
http://stockcharts.com/h-sc/ui?s=INQD&p=D&yr=0&mn=3&dy=0&i=p4631216300c&a=642509717&r=1548546033126

Good job. You are board MODERATOR and I am your assistant!
Review the deleted posts on this board to get a feel how ADMIN manages from the sidelines as the hidden moderator.
Instead of PMs to me you can post here publicly.
You have my permission to use any of my chart templates for posting charts for any other stock board.
Tothe, what a finish Friday for INQD. I was on level-11 for 5 million shares with another trader for 8 million when the feeding slowly began. However, someone ran it from .0024 to .0031 in possibly a single trade just before the close!
Looking forward to the new chart and thanks for your fair and honest approach!
FYI: this is my 4th post, reapplying today…
BP
Welcome to the board. Yes, I forgot about 4 post rule. Post a chart and run a dialog with yourself, then reapply.
You would think I learned by now, been lurking for 25 years and still get peed-off and let it fly too much. I'll do my best...lol
BP
Excellent. Now become a MOD here and learn the rules!
Tothe, I was also banned back in 2018, however I recently emailed the admin requesting another shot at posting on the ZN board. I was approved for only one post a day.
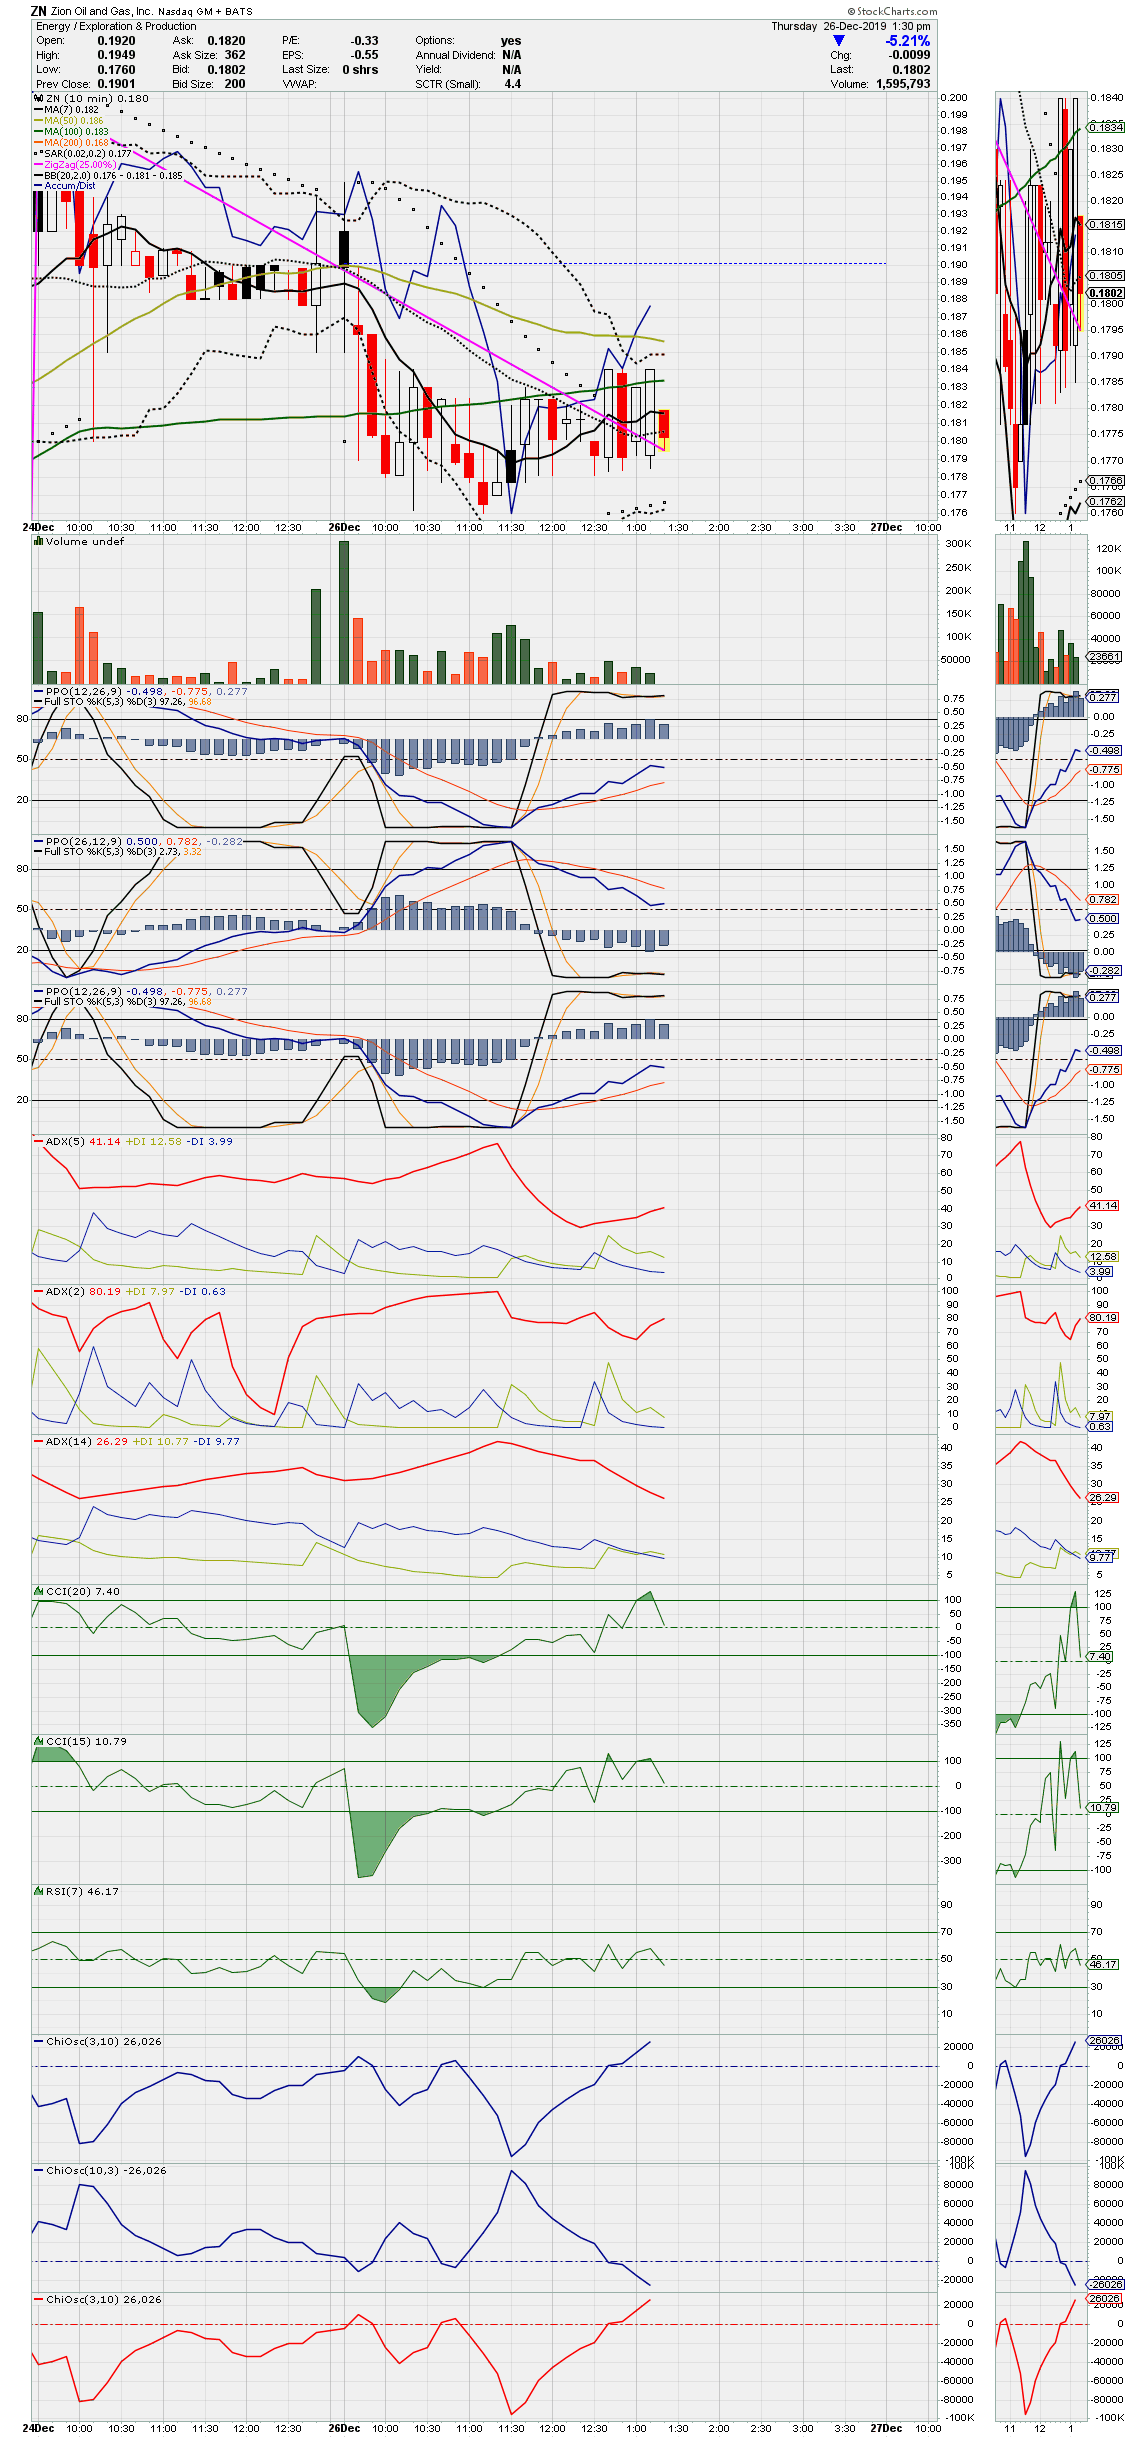
ZN 8/34 chart: Setup days starting Mar 31 followed by bullish crossover Apr 3.
~~~ It looks like tomorrow (May 21) we will have the 100/200 golden cross.
http://stockcharts.com/h-sc/ui?s=ZN&p=D&yr=0&mn=3&dy=0&i=p54898621835&a=654084241&r=1556119125671&r=1556119244676

Thanks. Any work you do will be appreciated. The IBOX sheet needs to be updated for the new taxes and whatever else changed the picture over the last 3 years.
It is unfortunate you have been banned, I wish you would have kept your posts on topic. You were a very important asset to the board.
As you know, I can not post there, absolutely no bias.
You have a way to contact me but choose not to that way (other board).
So I will do it here, in short $30 is a negative but $35 is positive. I really need to spend some time and update that sheet.
Assumptions of 175,000,000 million shares outstanding
At $30

At $35

Good morning Gents!
It’s a beautiful day.
Keep the faith. I wrote an email to JB after his last letter.
I explained that I felt called to invest and still accumulate shares from time to time
This all makes little sense, but my view is a long one, and it’s something I can’t explain.
If you consider all that has been done to that company, it’s a miracle itself that it’s still operating.
The list is long, some self-inflicted wounds of course, but what a story of how to destroy a stock.
I just wanted to say that I’m thankful to be on the other side of the last 2 years, and glad to share the journey with others.
Blessings to all.
Jackleg
I would like to ask you a question but have no way to do so here, and I sure as heck am not giving the hub a dime. You know where you can PM me.
What a day, wish I knew what was going on. Odd things that I will not post here but 'traffic' changed DRAMATICALLY>
Short Term Pinch charting~~~ Up-date
This chart only works as 2d 10min
Source & text
http://investorshub.advfn.com/Short-Term-Pinch-(STP)-32033/
  UPDATE: Abbreviated PPO/FullSTO Short Term Pinch or “STP” Chart Explanation May 27th 2017
  You will Find that I made My Chart Very Simple to Follow as you are looking at a Moving Picture.
  With the Abbreviated Chart there are Only 3 Main things to watch,
  The THREE PPO/FullSTO Setups Just Below the Volume and the Candles, The ADX5 with +DI and -DI,
  And the CCI20. That’s it. Follow those and you will Always be Right, Always.

 NOTE A1: When I Say “STP” I am Referring to a “Short Term Pinch”
 NOTE A2: When I SAY CONNECT I am talking about the "Main Blue Line" of the Middle PPO/FullSTO as it Connects to Either the Top PPO/FullSTO or Bottom PPO/FullSTO doing, Very Simple)
  1.Watch the Middle PPO Blue Line and see where it goes. .
  A. If it Coonects to the Bottom PPO the Stock will go Up
  B. If it Connects to the Top PPO the Stock will go Down.
  C.This is what makes Stocks Change Direction.

  2.BUYING: Once you see the Blue PPO Line Connect at the Bottom, Look at the CCI20 and ADX5
  A. Usually the ADX5 +DI will Cross through the -DI first as a Confirmation.
  B. Then Watch and see what the CCI20 does and if it shoots straight up and past the +100 Line The Stock WILL GO UP.
  C. If the CCI20 starts to go up and then rolls over to the right, it’s not ready and you have to wait for it to Complete as it is always best to wait for it to go up through the +100 Line, Could take Second, Minutes, or Hours. (Volume Matters)
  D. Once all this Happens you will see how the Middle and Top PPO’s have Pinched Together and then come apart and keep getting Wider and Wider and at the same time the Stop keeps going Up. Very Simple, This is what these Indicators show, Stock Price Movement.

  3.The Potent Short Term Pinch or “STP”
 When you see Every Line from the Middle PPO/FullSTO go down to the very bottom and Connect, look at the ADX5 just below it.
  If the ADX5 has shot up and gets Really High and almost touches the Point where all 4 of the PPO/FullSTO lines are connected at the Bottom
  this is called a “Short Term Pinch” or “STP”. Once again, Check the CCI20 for Conformation of Completion.These are Very Powerful and the Stock almost always shoots up considerably. This is very Important as it usually from 5 Minutes to a Half Hour for a (STP) develop and Complete and will give everyone time to get money ready to take a position once the (STP) Completes

 Note: If no StockCharts account
  (1) For live chart open link above the chart in a new tab.
  (2) Click on the suppressed image to "explode it".
  (3) Use browser refresh to keep it alive and repeat step 2 explosion.
 http://stockcharts.com/c-sc/sc?s=ZN&p=10&yr=0&mn=0&dy=2&i=p61286934807&a=527889566&r=1496692598960


  The EZ way to Understand My Abbreviated Short Term Pinch Known as (Big Sams ASTP Chart),

  The Top PPO/FullSTO is the Buying indicator
  The Bottom PPO/FullSTO Is the Sell Indicator.

  The Top and Bottom PPO/FullSTO are Identical

  The Middle PPO/FullSTO Indicator is the Opposite of the Top and Bottom PPO/FullSTO Indicators and is the Key to how it works as it will go to the Top or the Bottom.

  The Heavy Blue Line for the PPO is the Main Indicator Line and when it Hits the FullSTO just ahead of the Other Indicator Lines it sets in motion when buying or selling will occur and gives you a Very Clear Picture of what is Going to Happen,
  If Middle Pinches at the Top, The Price Will Go Up
  If the Middle Pinches at the Bottom the Price Will Drop.
  When all the Lines Come together it looks like an Arrow as they all come to a Point.
  When this Arrow Point Starts to Come Apart it Signals when Buying or Selling will start pending on which PPO/FullSTO Indicators came together (Top is Buying, Bottom is Selling, Really EZ to understand and follow) There is a Chart Below showing SLV in a Full Blown Short Term pinch and also Shows how the Loines Come togther and then Apart. Very Easy to Follow.

  THE "Short Term Pinch" or "STP"
  When you see the ADX5 Spike up and at the same time all 4 lines from the Bottom PPO/FullSTO drop down to the bottom and they Sort of Come Together and then Come Apart, this is called a "Short Term Pinch" or (STP) (The ADX will usually Go up, get close, and then curve back down and right as this happens the 4 PPO/FullSTO Lines Start to Turn up (Called, lifting it’s toes up)
  When this happens the Stock will shoot up and run. (Remember, These are Short Term plays and why they are called a “Short Term Pinch”)
 Make sure you confirm it with the CCI20 as there are Fake outs.
  Need the CCI20 to go straight up and usually past 100 and hold above it to Confirm it.
  Many times it will lay flat over to the right and you have to wait.
  Watch and learn. Once you get the hang of it you will be able to buy before the CCI20 Completes but I don’t want anyone losing money and this is a type of Fail Safe.
  I also check my ADX +DI and -DI Indicators and when the ADX +Indicator crosses up Through the ADX -DI it is a Very Positive Sign. If it crosses Down It’s Negative.
  If you See the ADX14 +DI Crosses up through the ADX14 -DI its a really Good Sign, If the ADX14 +DI Crosses down through the ADX14 -DI I will usually Sell Some Shares
  But you need to look at the whole Picture and the more you watch the better you will get at this and the more Money you will make, Believe me, It becomes Very EZ once you realize what it is you are seeing. I had an AHA Moment when I figured it out.
Please, I need the website address that you moderate. You can post it here on this board.
My Windows 7 hard drive crashed 3 months ago. Could not recover my favorites or chart notes. That is why I have been dark so long. 
Three and four dimensional market structures explained.
~~~ This is mind blowing stuff and if you read it you may find yourself facing a new paradigm. I discovered Gann and my knees turned to water after I opened Pandora's Box.
I like to think my money charts are three dimensional but my mind has a problem tangling with platonic solids getting into the forth dimension...I am working on it though.
"Without understanding that the market is 3-D, twisting like a plant governed by the phyllotactic laws of dual number series and harmonic composition and decomposition, all measurements taken on a 2-D chart become misleading.
http://www.sacredscience.com/baumring/biography.htm
Master link that I found the above bio.
http://www.sacredscience.com/baumring/interview.htm
More on Four-Dimensional Stock Market Structures and Cycles and Market Science
http://www.cycle-trader.com/
This is the E-book link ( Chapter 19) where I found all the data & above links.The research presented here attempts to explain all the above to the layman in terms that I hope we can all understand.
http://divinecosmos.com/index.php/contact-us/privacy-policy/75-the-shift-of-the-ages-chapter-19-geometric-time-and-the-wilcock-constant
UFO charts~~~ I am charting another ETF. Keeping an eye on this one.
http://stockcharts.com/c-sc/sc?chart=UFO,uu%5Bw,a%5Ddhclyiay%5Bdb%5D%5BpB50!b2!b5!d20,2%5D%5Bvc5!c20%5D%5Biut!ub5!ua5,15,10!uv8!lk9!ll5!lc15!lf14!up5,5%5D%5Bj20444984,y%5D&r=3555

http://stockcharts.com/h-sc/ui?s=UFO&p=D&yr=1&mn=2&dy=0&id=p91160645273&listNum=23&a=653772968

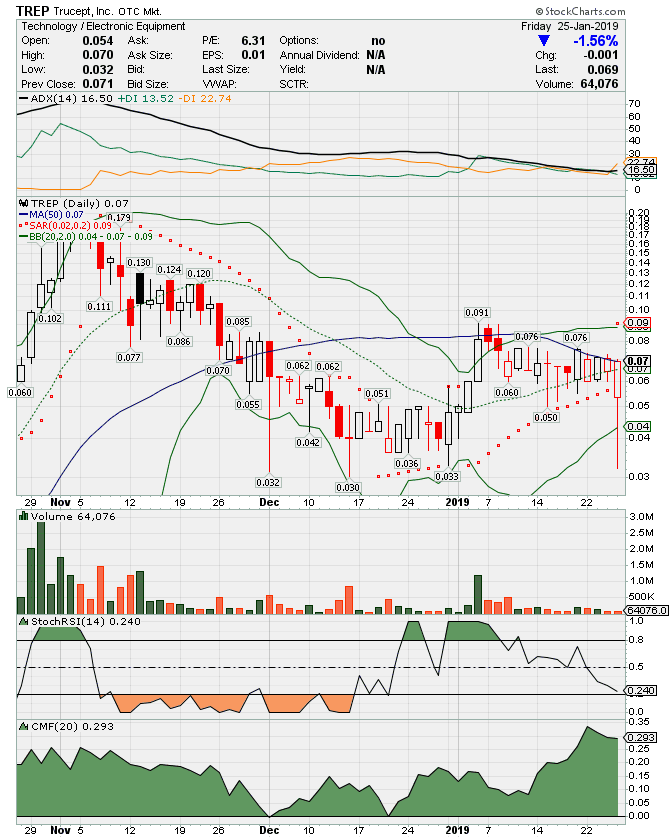
LFAP trigger: Day 2. Assume day 1 was the breakdown candle.
http://stockcharts.com/c-sc/sc?chart=LFAP,uu%5Bw,a%5Ddhclyiay%5Bdb%5D%5BpB50!b2!b5!d20,2%5D%5Bvc5!c20%5D%5Biut!ub5!ua5,15,10!uv8!lk9!ll5!lc15!lf14!up5,5%5D%5Bj20444984,y%5D&r=3555

Trigger chart
#1. AROON- 8 You watch as the AROON DOWN crosses the 75 down and the AROON UP comes up from zero. Most important. (\0/)
#2. WILLIAMS%R- 9 You watch the line cross the 50.
#3. CMF- 15 You will usually only see growth when the CMF is in the negative.
#4. ADX/DMI-5 You watch as the D+ line either crosses the D-, or crosses above the 20.
#5. MACD histogram- 5,15,10 You watch the negative bars register -50% smaller then the bar before it, or -50% smaller then the largest in the grouping.
#6. Full Stoch- 5,3 You watch the fast line cross the slow line while the AROON DOWN(8) crosses the 87.50. Crossing the 20 would be best, when the Williams agrees.
#7. Bollinger Band 20,2 You watch for the Magic Box to occur when the negative close touches above the lower bolly and the next day’s close to it is positive growth in a white candle.
#8. RSI 5 you watch as the indicator crosses above the 50 for a quick pop.
#9. MA(2) Watch the 2 day MA cross above the 5 day MA. That’s helpful.
#10. MA(2) To sell it just watch the 2 day MA kiss the bottom center of the candle body.
THE MAGIC BOX
A gift from The Seasonality Stock Reports Board
The reason that I named this setup the Magic Box was so that you could relate to it and remember it faster. Without relationship to something, it is nothing to us. It must be something memorable to you before you can set it into your subconscious mind and see it always.
(A) The Magic Box is a pure two-day pattern. Basically the "close" of a red candle printing on or near lower Bollinger Band with the next day printing an "open white candle."
(A1) On day one the Aroon Down is setting at 100 on the indicator and price is near the lower Bollinger Band. The Candlestick is dark-shadowed.
(A2) On day two, to form the Magic Box, the Aroon Down must drop to 87.50, and price to form a white candle, to complete the box. No other indicator is watched until this occurs for this setup, just the Bollinger Band and the Aroon Down.
If you see a Magic Box develop, that being, on the first day the Aroon Down going from 100.00 while the close is either on or just above the lower Bollinger Band and the second day the Aroon Down is now 87.50, you have a Magic Box.
(B) The buy opportunity occurs when the confirmation of two things happens: on day three or few days later the Aroon Down goes to 75.00 and the Williams%R comes above the -50%. That is the buy. The Williams must come through the -50%. It may take more than three days but you must wait for the confirmation of the William%R. I have seen again and again, the Aroon Down come down from 100.00 to zero without the Williams ever crossing the -50%, those are the ones you pass on. There will be no growth when this happens. At most there is consolidation or a small drop. During this process the Aroon Up can rise slowly but without the Williams you have nothing.
There are other Magic Boxes that develop in a stock's life cycle, too, and they, too, can give great growth. These are the supported median, the floating, and the rising Magic Boxes. The buy-in criteria, though, will remain the same for all of them. The Aroon Down comes to the 75.00 and the Williams crosses the -50%. June 7th, 8th, and 9th accomplish this in the 2007 HGR chart, though the William%R took until June 13th to confirm. You must wait.
Trading: It is highly recommended that you paper trade the system to familiarize yourself with it thoroughly. As with anything in life nothing is guaranteed, so, always use appropriate stop loss according to your risk tolerance.
Kenneth J. Goodrich
http://investorshub.advfn.com/SEASONALITY-STOCK-REPORTS-1616/
Example
https://investorshub.advfn.com/boards/replies.aspx?msg=40130527
Indicator study
Multicollinearity a common TA mistake
Multicollinearity is a statistical term for a problem that is common in technical analysis. That is, when one unknowingly uses the same type of information more than once. Analysts need to be careful and not utilize technical indicators that reveal the same type of information.
http://stockcharts.com/school/doku.php?id=chart_school:overview:multicollinearity
 Category        Indicators
 ================================================================
 Momentum     Rate of Change (ROC)      Stochastics (%K, %D)
                                        Relative Strength Index (RSI)
                                        Commodity Channel Index (CCI)
                                        Williams %R (Wm%R)
                                        StochRSI
                                        TRIX
                                        Ultimate Oscillator
                                        Aroon
 ------------------------------------------------------------------
 Trend        Moving Averages           Moving Average Convergence Divergence (MACD)
                                        Average True Range (ATR)
                                        Wilder's DMI (ADX)
                                        Price Oscillator (PPO)
 ------------------------------------------------------------------
 Volume      Accumulation
             Distribution              Chaikin Money Flow (CMF)
                                       Volume Rate of Change
                                       Volume Oscillator (PVO)
                                       Demand Index
                                       On Balance Volume (OBV)
                                       Money Flow Index (MFI)
ADX Value    Trend Strength
 0-25         Absent or Weak Trend
 25-50        Strong Trend
 50-75        Very Strong Trend
 75-100       Extremely Strong Trend
ADX Value    Trend Strength
 0-25         Absent or Weak Trend
 25-50        Strong Trend
 50-75        Very Strong Trend
 75-100       Extremely Strong Trend


Compound chart
#1. AROON- 8 You watch as the AROON DOWN crosses the 75 down and the AROON UP comes up from zero. Most important. (\0/)
#2.WILLIAMS%R- 9 You watch the line cross the 50.
#3.CMF- 15 You will usually only see growth when the CMF is in the negative.
#4.ADX/DMI-5 You watch as the D+ line either crosses the D-, or crosses above the 20.
#5.MACD histogram- 5,15,10 You watch the negative bars register -50% smaller then the bar before it, or -50% smaller then the largest in the grouping.
#6.Full Stoch- 5,3 You watch the fast line cross the slow line while the AROON DOWN(8) crosses the 87.50. Crossing the 20 would be best, when the Williams agrees.
#7.Bollinger Band 20,2 You watch for the Magic Box to occur when the negative close touches above the lower bolly and the next day’s close to it is positive growth in a white candle.
#8.RSI 5 you watch as the indicator crosses above the 50 for a quick pop.
#9.MA(2) Watch the 2 day MA cross above the 5 day MA. That’s helpful.
#10.MA(2)To sell it just watch the 2 day MA kiss the bottom center of the red candle body.
THE MAGIC BOX
(A) The Magic Box is a pure two-day pattern. Basically the "close" of a red candle printing on or near lower Bollinger Band with the next day printing an "open white candle."
A gift from The Seasonality Stock Reports Board
The reason that I named this setup the Magic Box was so that you could relate to it and remember it faster. Without relationship to something, it is nothing to us. It must be something memorable to you before you can set it into your subconscious mind and see it always.
(A1) On day one the Aroon Down is setting at 100 on the indicator and price is near the lower Bollinger Band. The Candlestick is dark-shadowed.
(A2) On day two, to form the Magic Box, the Aroon Down must drop to 87.50, and price to form a white candle, to complete the box. No other indicator is watched until this occurs for this setup, just the Bollinger Band and the Aroon Down.
If you see a Magic Box develop, that being, on the first day the Aroon Down going from 100.00 while the close is either on or just above the lower Bollinger Band and the second day the Aroon Down is now 87.50, you have a Magic Box.
(B) The buy opportunity occurs when the confirmation of two things happens: on day three or few days later the Aroon Down goes to 75.00 and the Williams%R comes above the -50%. That is the buy. The Williams must come through the -50%. It may take more than three days but you must wait for the confirmation of the William%R. I have seen again and again, the Aroon Down come down from 100.00 to zero without the Williams ever crossing the -50%, those are the ones you pass on. There will be no growth when this happens. At most there is consolidation or a small drop. During this process the Aroon Up can rise slowly but without the Williams you have nothing.
There are other Magic Boxes that develop in a stock's life cycle, too, and they, too, can give great growth. These are the supported median, the floating, and the rising Magic Boxes. The buy-in criteria, though, will remain the same for all of them. The Aroon Down comes to the 75.00 and the Williams crosses the -50%. June 7th, 8th, and 9th accomplish this in the 2007 HGR chart, though the William%R took until June 13th to confirm. You must wait.
Trading: It is highly recommended that you paper trade the system to familiarize yourself with it thoroughly. As with anything in life nothing is guaranteed, so, always use appropriate stop loss according to your risk tolerance.
Kenneth J. Goodrich
http://investorshub.advfn.com/SEASONALITY-STOCK-REPORTS-1616/
Example
http://investorshub.advfn.com/boards/read_msg.aspx?message_id=37119243
Sell trigger
https://investorshub.advfn.com/boards/replies.aspx?msg=40130527
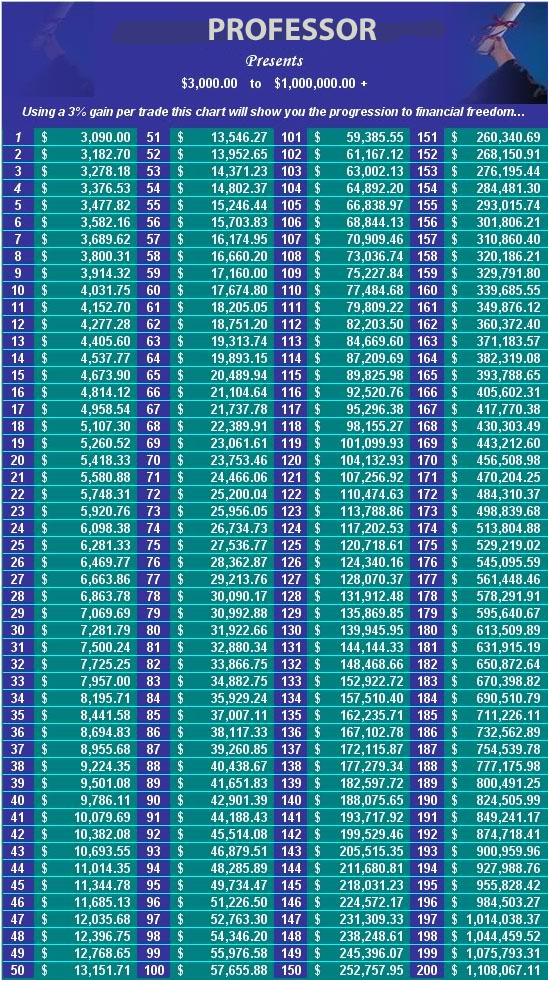
Compounding
The main focus here is to compound our gains. Too many people enter the stock market with the intent of trying to hit a home run. Swinging for the fences also gives you a high strike out ratio. It is important to compound your gains and go for the singles and doubles and you will find that you eventually hit triples and home runs as well. The chart below shows how you can turn only 3k into 1 million dollars in 200 steps. So join me in moving up the steps of our compounding gains chart. Compound those gains!
https://investorshub.advfn.com/boards/read_msg.aspx?message_id=125078854

Chipmakers moved higher in premarket trading on Wednesday, with Intel (NASDAQ:INTC) leading the sector after announcing a significant advancement in its next-generation manufacturing technology. The gains helped reverse some of the weakness seen across semiconductor stocks during Tuesday’s session, lifting sentiment across the broader industry. Intel Leads Sector Higher Intel shares rose roughly 4% before […]


| Volume | |
| Day Range: | |
| Bid Price | |
| Ask Price | |
| Last Trade Time: |


.png)


