 News
News  Market Data
  Discover
Support: 888-992-3836
Copyright © 2023 InvestorsHub Inc.


Register for free to join our community of investors and share your ideas. You will also get access to streaming quotes, interactive charts, trades, portfolio, live options flow and more tools.
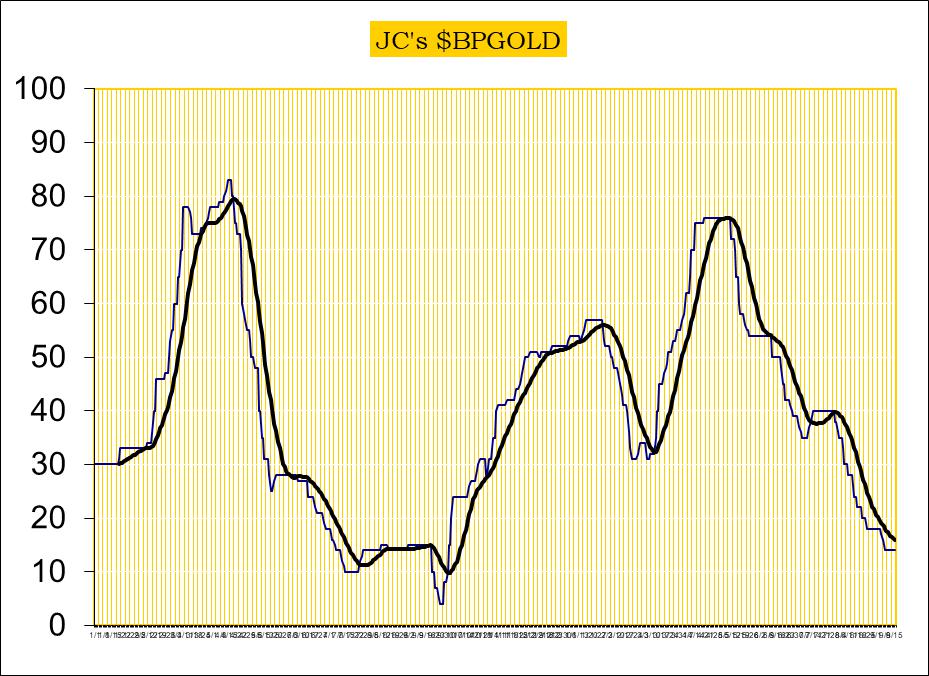
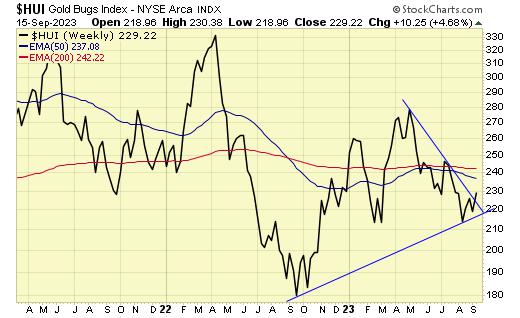
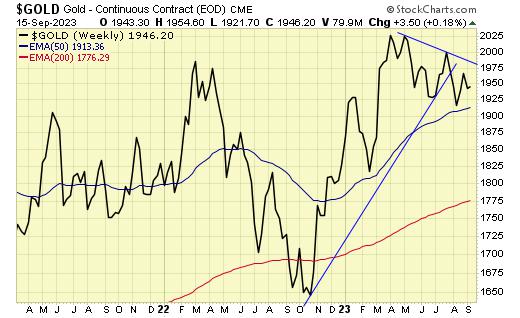
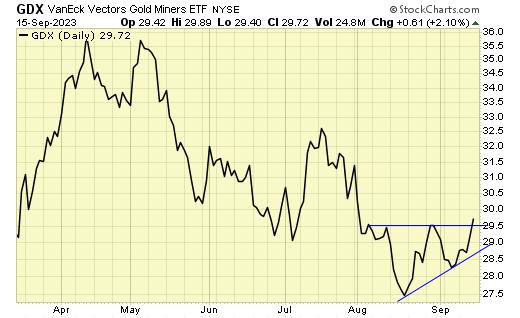
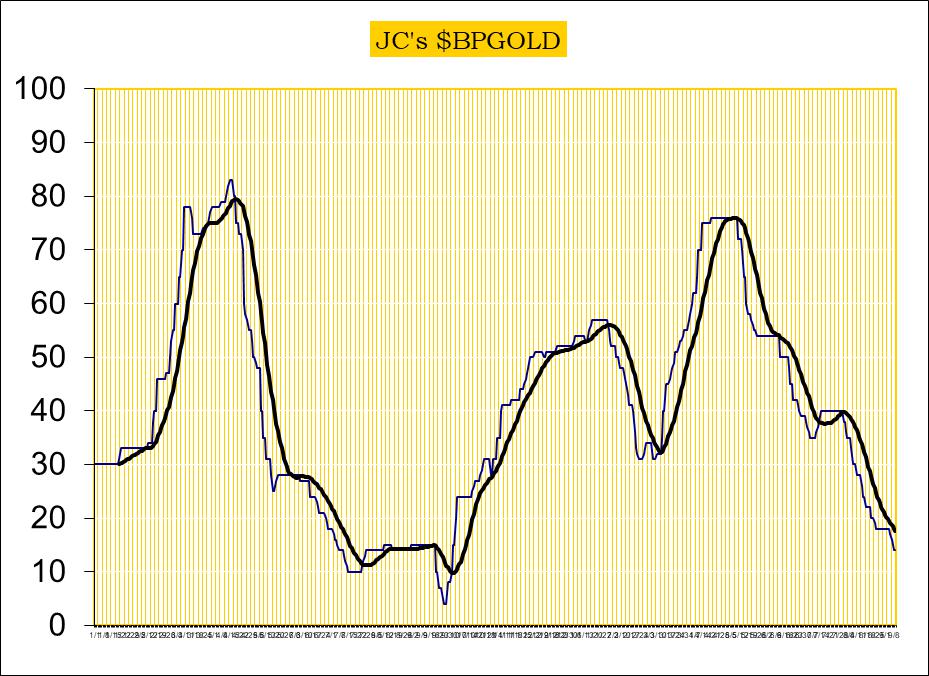
Jack Chan: Gold Price Exclusive Update
By: Jack Chan | October 7, 2023

Our proprietary cycle indicator is DOWN.
To public readers of our updates, our cycle indicator is one of the most effective timing tool for traders and investors. It is not perfect, because periodically the market can be more volatile and can result in short term whipsaws. But overall, the cycle indicator provides us with a clear direction how we should be speculating.
Investors
Accumulate positions during an up cycle and hold for the long term.
Traders
Enter the market at cycle bottoms and exit at cycle tops for short term profits.

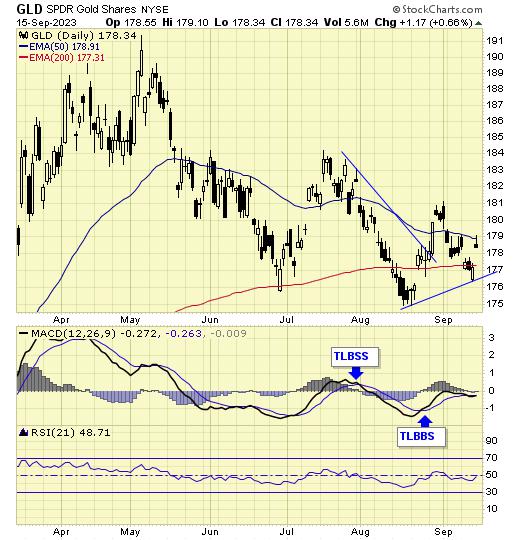
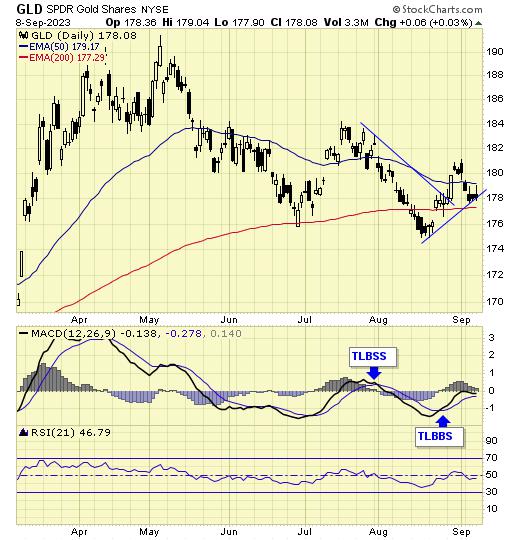
GLD is on short term sell signal.

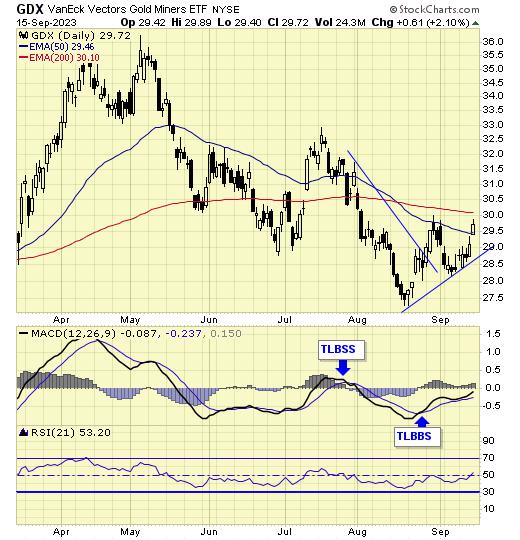
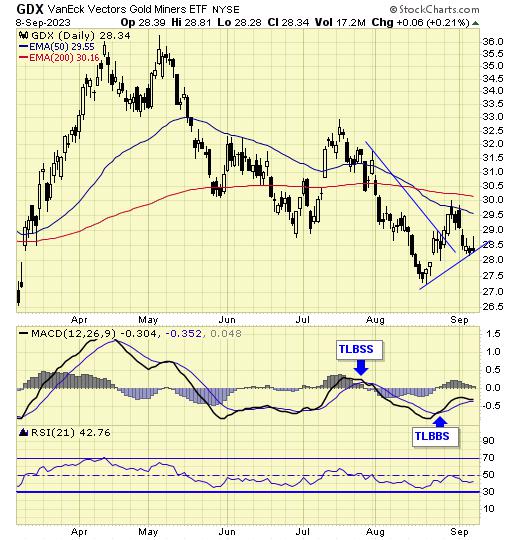
GDX is on short term sell signal.

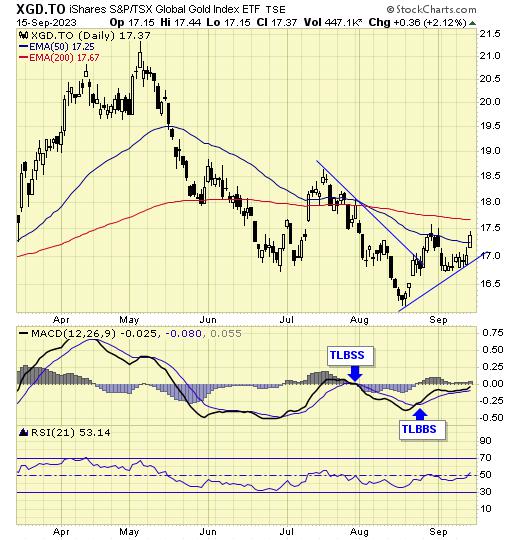
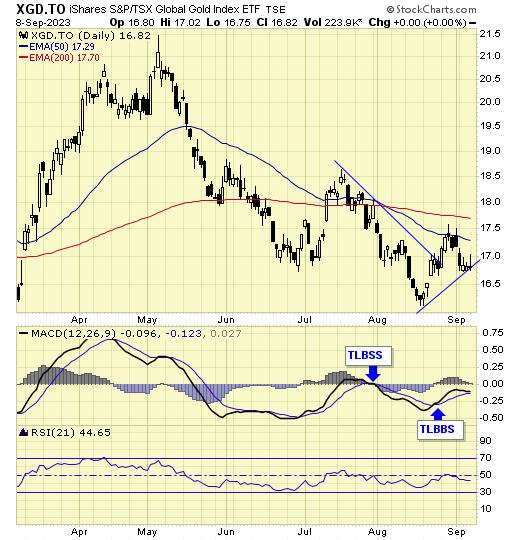
XGD.to is on short term sell signal.

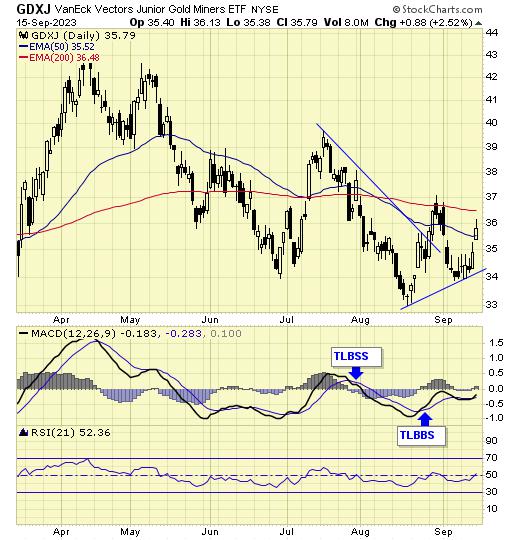
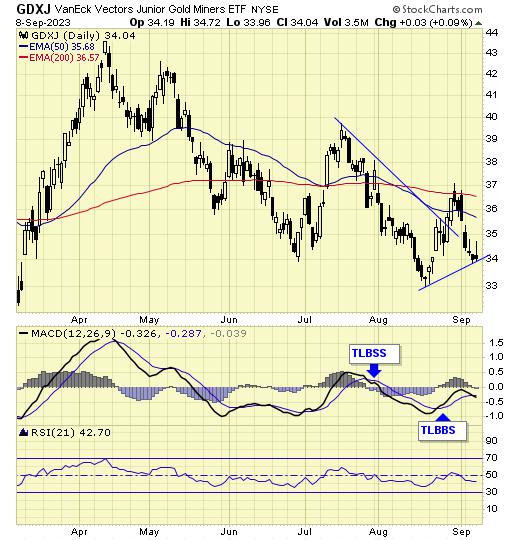
GDXJ is on short term sell signal.
Analysis

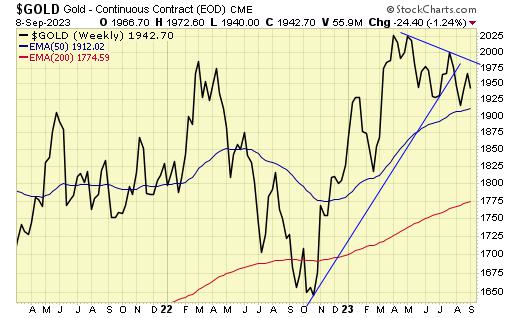
Expect lower gold prices overall.

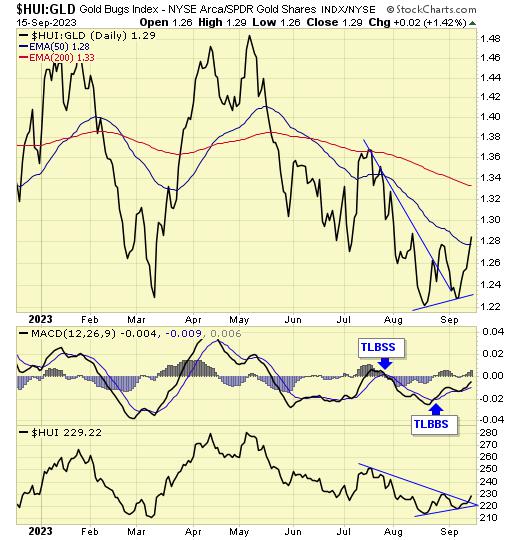
Our ratio is on a sell signal.

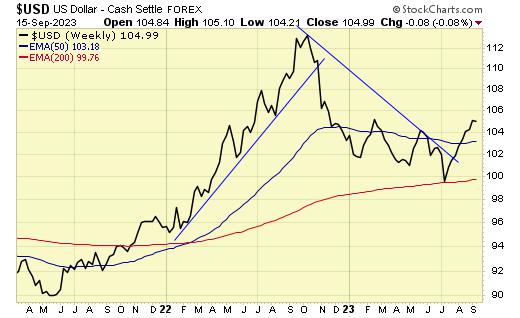
Trend is UP for USD.

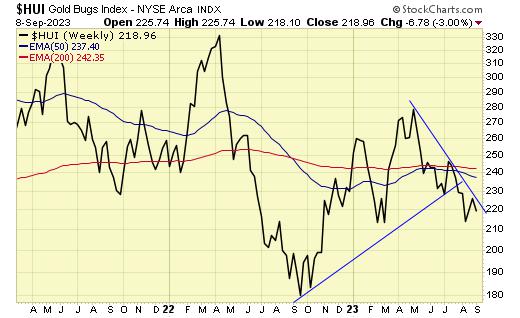
Trend is DOWN for gold stocks.

Trend is DOWN for gold.

Gold stocks broke down last week.

In recent years, gold stocks have a tendency to bottom in the summer/fall time frame.
Summary
Gold sector cycle is down.
Trend is up for USD, and down for gold and gold stocks.
$$$ We shall wait for the next cycle bottom.
Read Full Story »»»
 DiscoverGold
Gold CoT: Peek Into Future Through Futures, How Hedge Funds Are Positioned
By: Hedgopia | October 7, 2023
• Following futures positions of non-commercials are as of October 3, 2023.
Gold: Currently net long 91.2k, down 24.6k.

Non-commercials are reducing their net longs in gold futures as fast as they can, with holdings at a 47-week low.
The metal broke down last week, slicing through $1,920s, which held off gold bears for three months. This week, the yellow metal ticked $1,824 intraday Friday but only to end the session/week at $1,845/ounce. This is a must-hold level for gold bugs, and they will probably succeed in doing that – at least for now.
Bulls’ mettle of course will be tested at $1,920s. The 50- and 200-day respectively are at $1,935 and $1,937, with a death cross occurring on Friday.
Read Full Story »»»
DiscoverGold
NY Gold Futures »» Weekly Summary Analysis
By: Marty Armstrong | October 7, 2023
NY Gold Futures closed today at 18452 and is trading up about 1.04% for the year from last year's settlement of 18262. Up to this moment in time, this market has been declining for 5 months and if the market continues to remain beneath the previous month's low of 18623 on a closing basis, then it will remain weak for now. This price action here in October is suggesting that this has been a bear market trend on the monthly level. As we stand right now, this market has made a new low breaking under the previous month's low dropping to 18235 intraday and remains trading beneath that level.
ECONOMIC CONFIDENCE MODEL CORRELATION
Here in NY Gold Futures, we do find that this particular market has correlated with our Economic Confidence Model in the past. The Last turning point on the ECM cycle low to line up with this market was 2022 and 2015. The Last turning point on the ECM cycle high to line up with this market was 2020 and 2011 and 1996.
MARKET OVERVIEW
NEAR-TERM OUTLOOK
The historical perspective in the NY Gold Futures included a rally from 1999 moving into a major high for 2020, from which the market has been in a bearish trend since then moving into the low in 2022 forming a reactionary trend of 2 years bottoming at 16183. Nevertheless, we have not elected any Yearly Bearish Reversal to date from the turning point of 2020, which tends to warn that the 2020 high could still be challenged until we elect a Yearly Bearish Reversal. Notwithstanding, 2022 was, in fact, an outside reversal to the downside closing lower than the previous year. Nevertheless, we have elected all four intermediate Yearly Bullish Reversals to date from the turning point of 2022 from this 2022 reaction low.
Curiously, the market has been only consolidating since that 2022 low and has been unable to exceed the high of that year while holding the low. The last Yearly Reversal to be elected was a Bullish at the close of 2022.
This market remains in a positive position on the weekly to yearly levels of our indicating models. Nevertheless, it closed last year on the weak side down from 2021. Pay attention to the Monthly level for any serious change in long-term trend ahead.
Looking at the indicating ranges on the Daily level in the NY Gold Futures, this market remains moderately bearish position at this time with the overhead resistance beginning at 18493 and support forming below at 18309. The market is trading closer to the resistance level at this time.
On the weekly level, the last important high was established the week of July 31st at 20109, which was up 5 weeks from the low made back during the week of June 26th. Afterwards, the market bounced for 12 weeks reaching a high during the week of September 18th at 19331. Since that high, we have been generally trading down for the past 2 weeks, which has been a significant move of 7.384% in a reactionary type decline.
When we look deeply into the underlying tone of this immediate market, we see it is cautiously starting to weaken since the previous high at 2986 made 1167 weeks.
Looking at this from a broader perspective, this last rally into the week of September 18th reaching 19689 failed to exceed the previous high of 19802 made back during the week of August 28th. That rally amounted to only three typical reaction weeks. Right now, the market is below momentum on our weekly models casting a bearish cloud over the price action.
INTERMEDIATE-TERM OUTLOOK
YEARLY MOMENTUM MODEL INDICATOR
Our Momentum Models are declining at this time with the previous high made 2020 while the last low formed on 2022. However, this market has rallied in price with the last cyclical high formed on 2020 and thus we have a divergence warning that this market is starting to run out of strength on the upside.
After closing above last year's low of 16733 when it was an outside reversal to the downside yet it did close lower. This immediate year, the market did open higher, thus far, but this market has rallied exceeding last year's high. and remains below last year's high of 20788. This market is still above the normal trading yearly envelope where the top remains at 17906. The last Breakout Mode indicator took place in during 2003.
This market is trading well beneath that high of May which was 20854 by more than 10 percent. Critical support still underlies this market at 18107 and a break of that level on a monthly closing basis would warn of a further decline ahead becomes possible. Nevertheless, at this time, the market is still weak trading beneath last month's low.
DiscoverGold Oh brother, this is not new data. I already know this stuff, complete anther morons, or arrogance, is finally seeing it????? https://www.foxbusiness.com/economy/new-data-reveals-crash-not-since-great-depression-could-hit-2024
Watching spot trading closely. It’s getting signaled that price will stay at low 1800s until told otherwise. I don’t know who sends the signals, maybe central banks, but they are there and always accurate.
Central banks buying gold like it’s 1999. U will someday wake up and it will be going up by hundreds.
GDX #Miners - Into my Red-Box. Nearing my final target...
By: Sahara | October 5, 2023
• $GDX #Miners - Into my Red-Box.
Nearing my final target...

Read Full Story »»»
DiscoverGold
Gold CoT: Peek Into Future Through Futures, How Hedge Funds Are Positioned
By: Hedgopia | October 1, 2023
• Following futures positions of non-commercials are as of September 26, 2023.
Gold: Currently net long 115.8k, down 19.3k.

Gold broke down. After holding the line at $1,920s for three months, the metal dropped in all five sessions this week to slice through that support, ending the week down 4.1 percent to $1,866/ounce. It is now under both the 50- and 200-day (respectively at $1,947 and $1,936).
Earlier in May this year, gold headed lower as soon as $2,085 was ticked on the 4th. In the past, $2,089 was tagged in August 2020 – an all-time high – and $2,079 in March 2022. This was an important failure, and this week’s breakdown is a testament to that.
Now that the bears have succeeded in pushing the yellow metal under $1,920s, they are probably eyeing $1,840s, which for gold bugs is a must-hold.
Read Full Story »»»
DiscoverGold
the continuing climb in yields, the jacking up of rates, the threat of at least 1 more rate high has yields climbing, which is bad for gold as it looks like america is getting its house in order. https://mcusercontent.com/b268a38a165b03979d95268dd/files/98e93bf1-4b06-6b0c-1d10-942c0098c220/Chartbook_In_Gold_We_Trust_Report_2023.pdf
Jack Chan: Gold Price Exclusive Update
By: Jack Chan | September 30, 2023

Our proprietary cycle indicator is DOWN.
To public readers of our updates, our cycle indicator is one of the most effective timing tool for traders and investors. It is not perfect, because periodically the market can be more volatile and can result in short term whipsaws. But overall, the cycle indicator provides us with a clear direction how we should be speculating.
Investors
Accumulate positions during an up cycle and hold for the long term.
Traders
Enter the market at cycle bottoms and exit at cycle tops for short term profits.

GLD is on short term sell signal.

GDX is on short term sell signal.

XGD.to is on short term sell signal.

GDXJ is on short term sell signal.
Analysis

Expect lower gold prices overall.

Our ratio is on a sell signal.

Trend is UP for USD.

Trend is DOWN for gold stocks.

Trend is DOWN for gold.

Gold stocks broke down this week.

In recent years, gold stocks have a tendency to bottom in the summer/fall time frame.
Summary
Gold sector cycle is down.
Trend is up for USD, and down for gold and gold stocks.
$$$ We shall wait for the next cycle bottom.
Read Full Story »»»
DiscoverGold
Rally Time For Stocks & Gold?
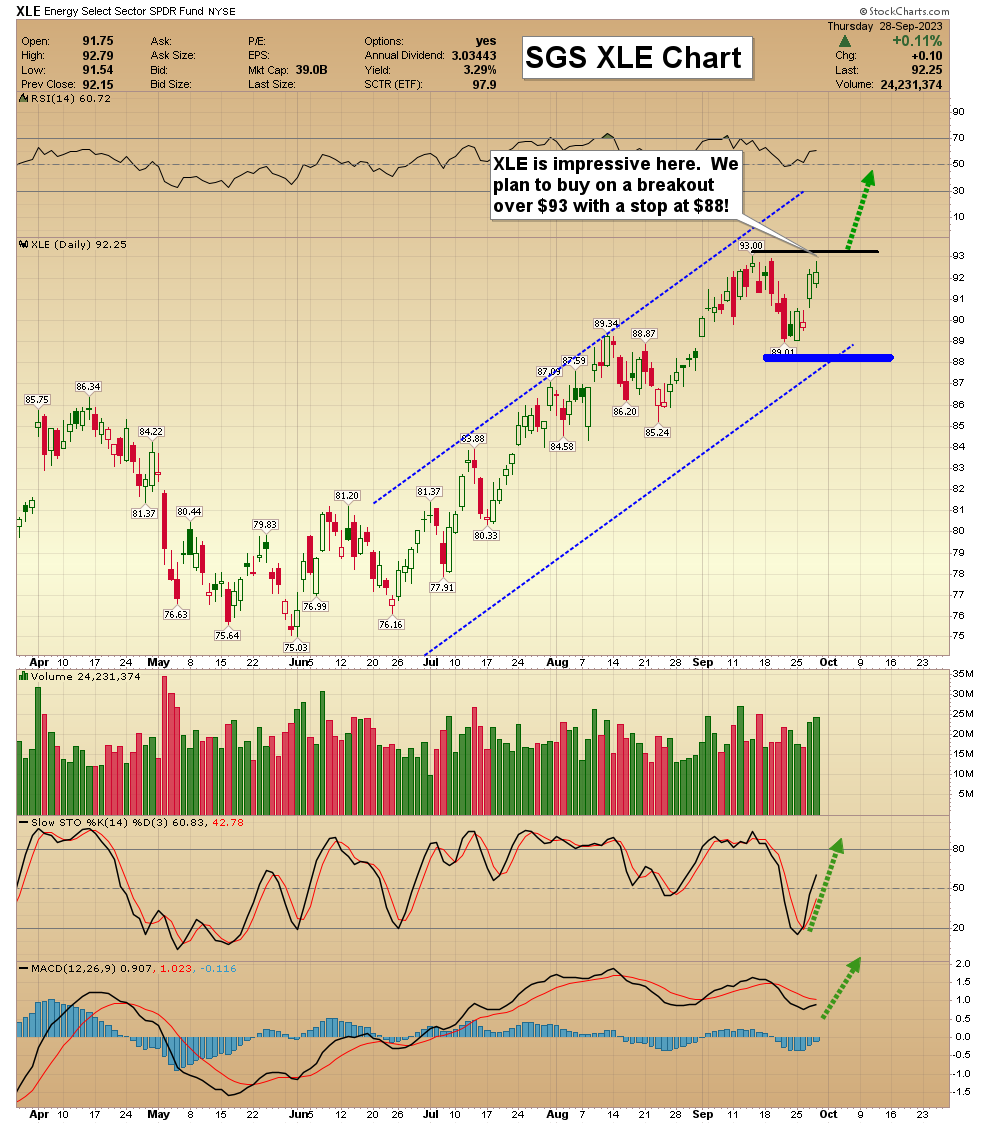
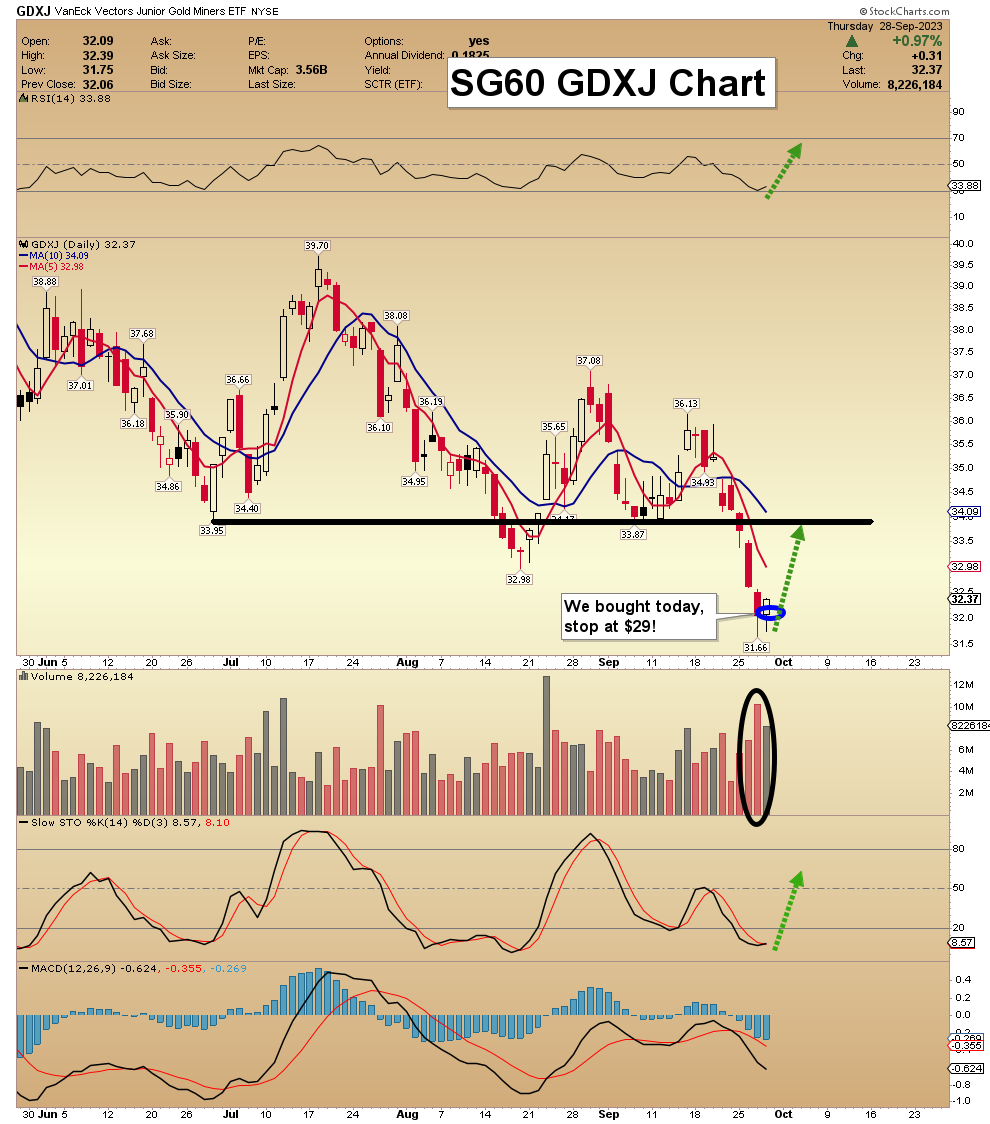
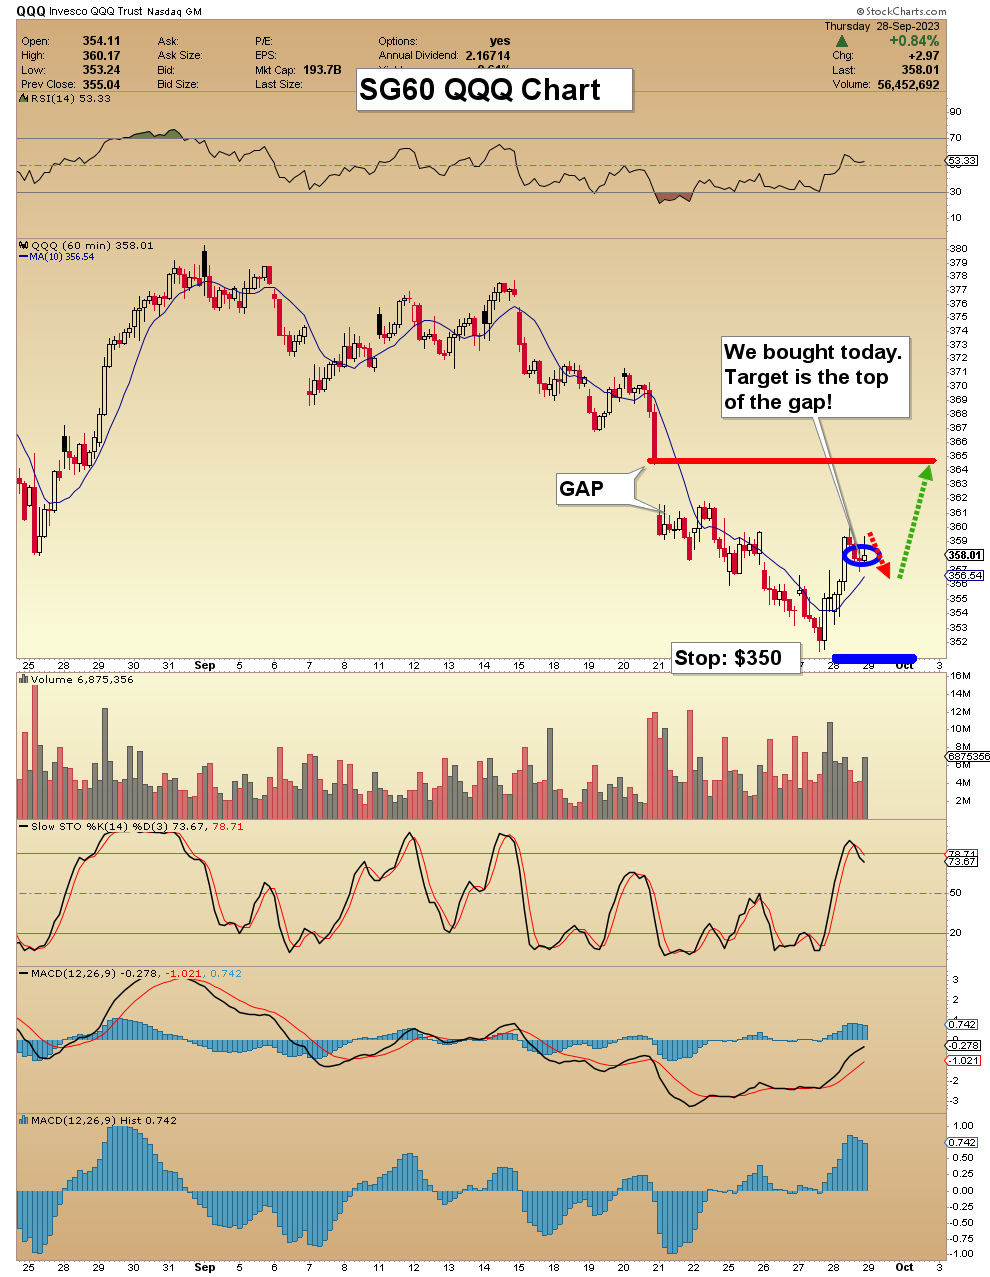
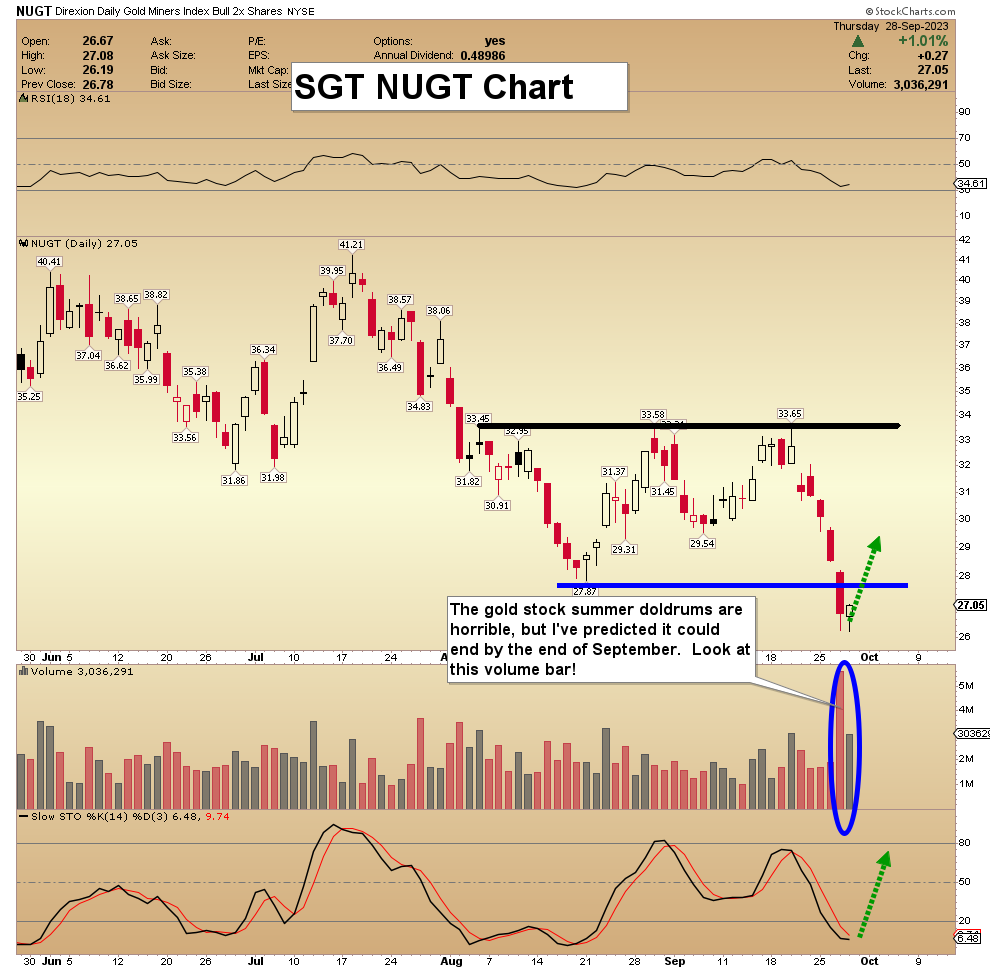
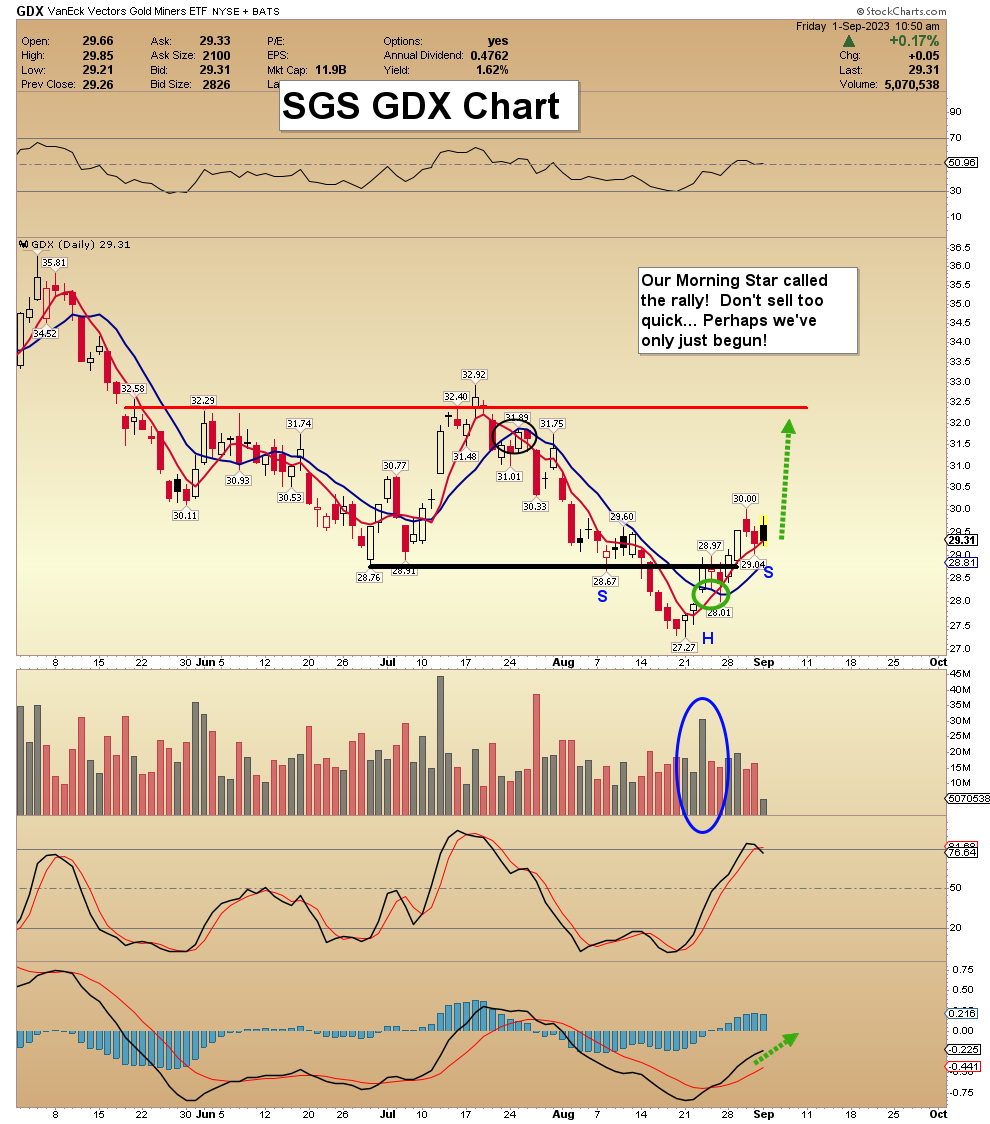
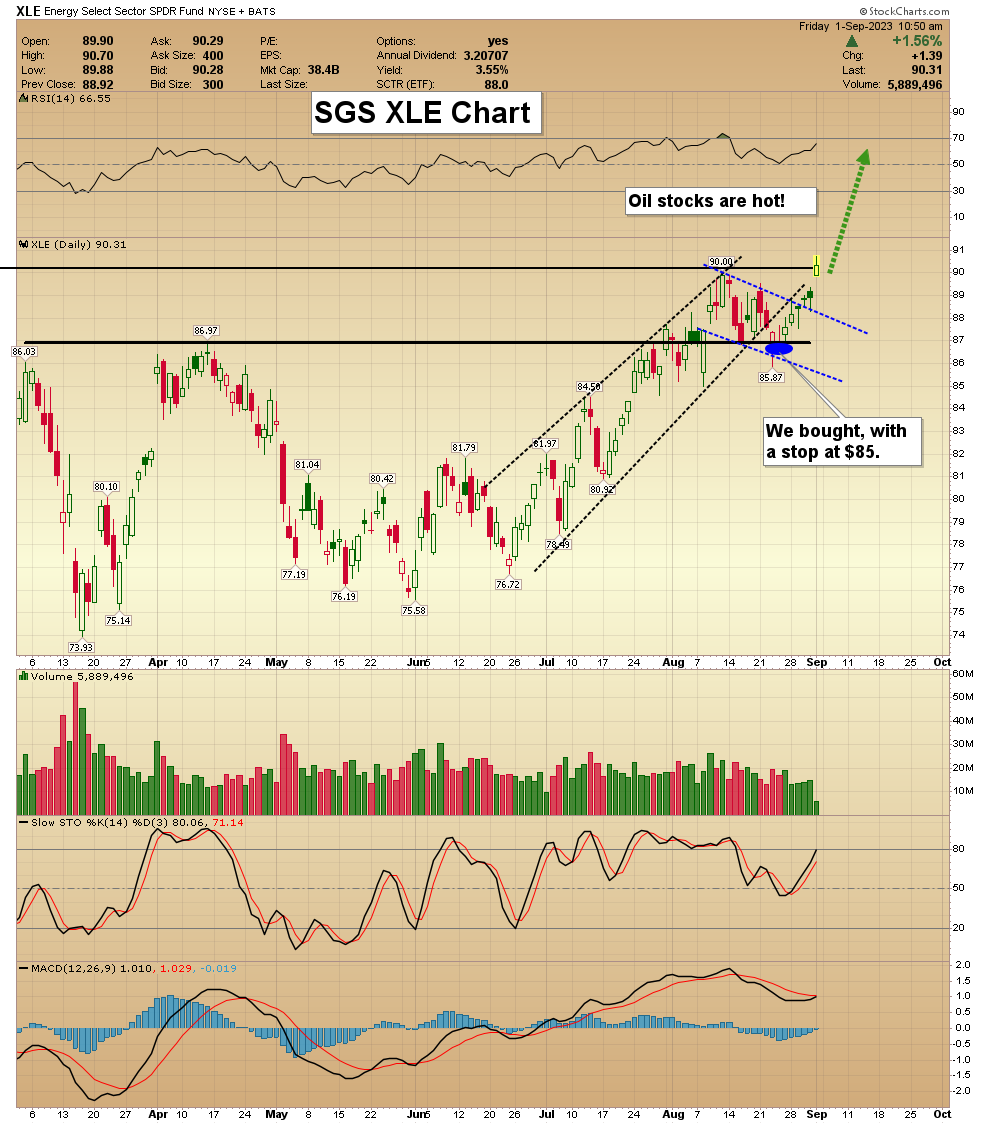
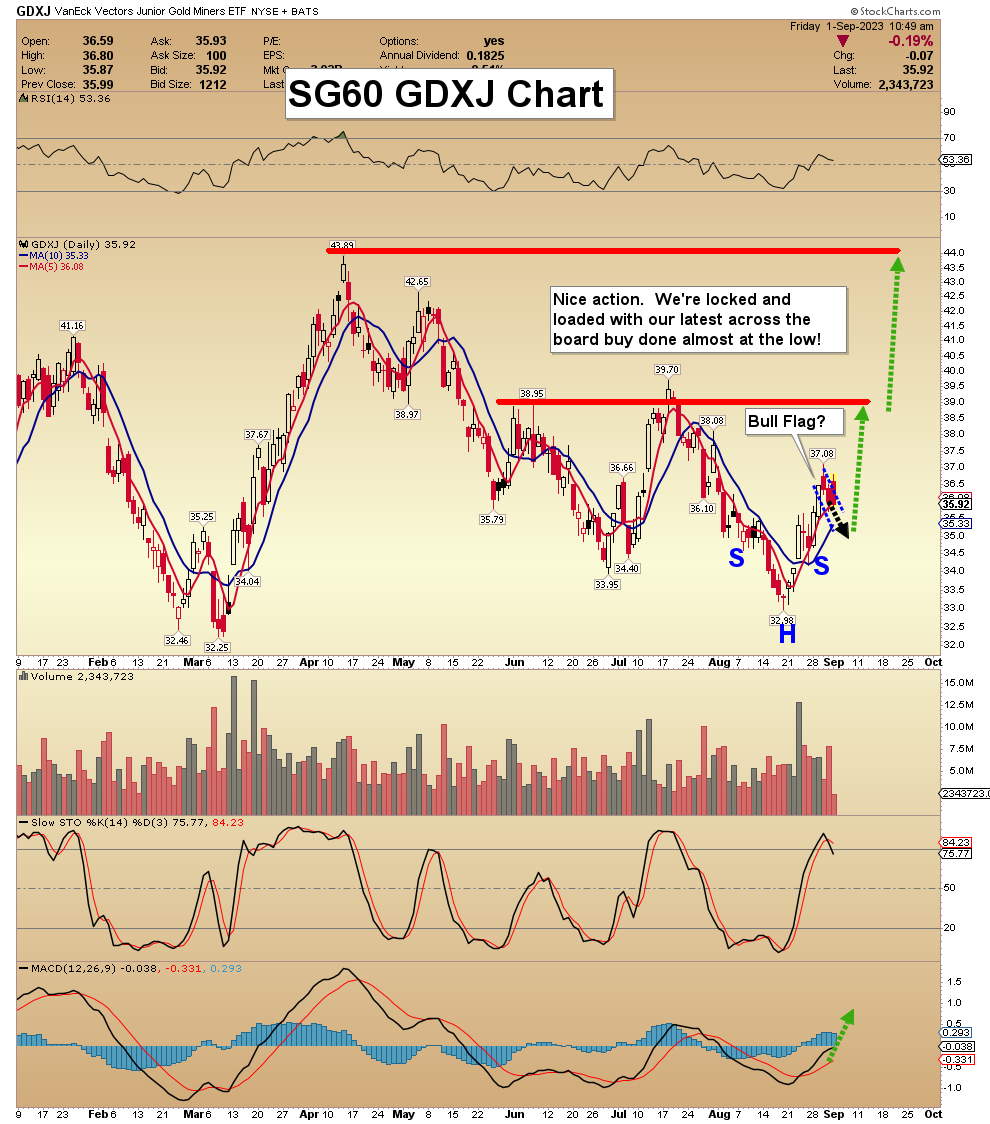
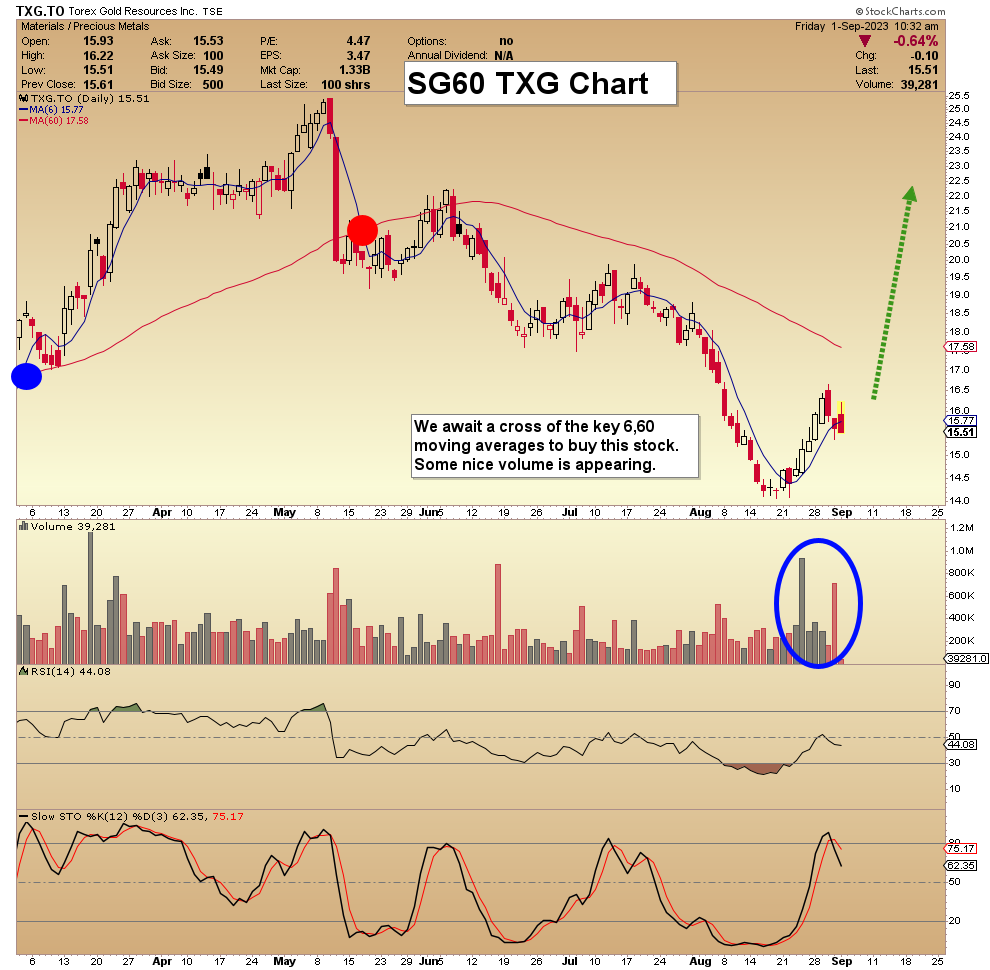
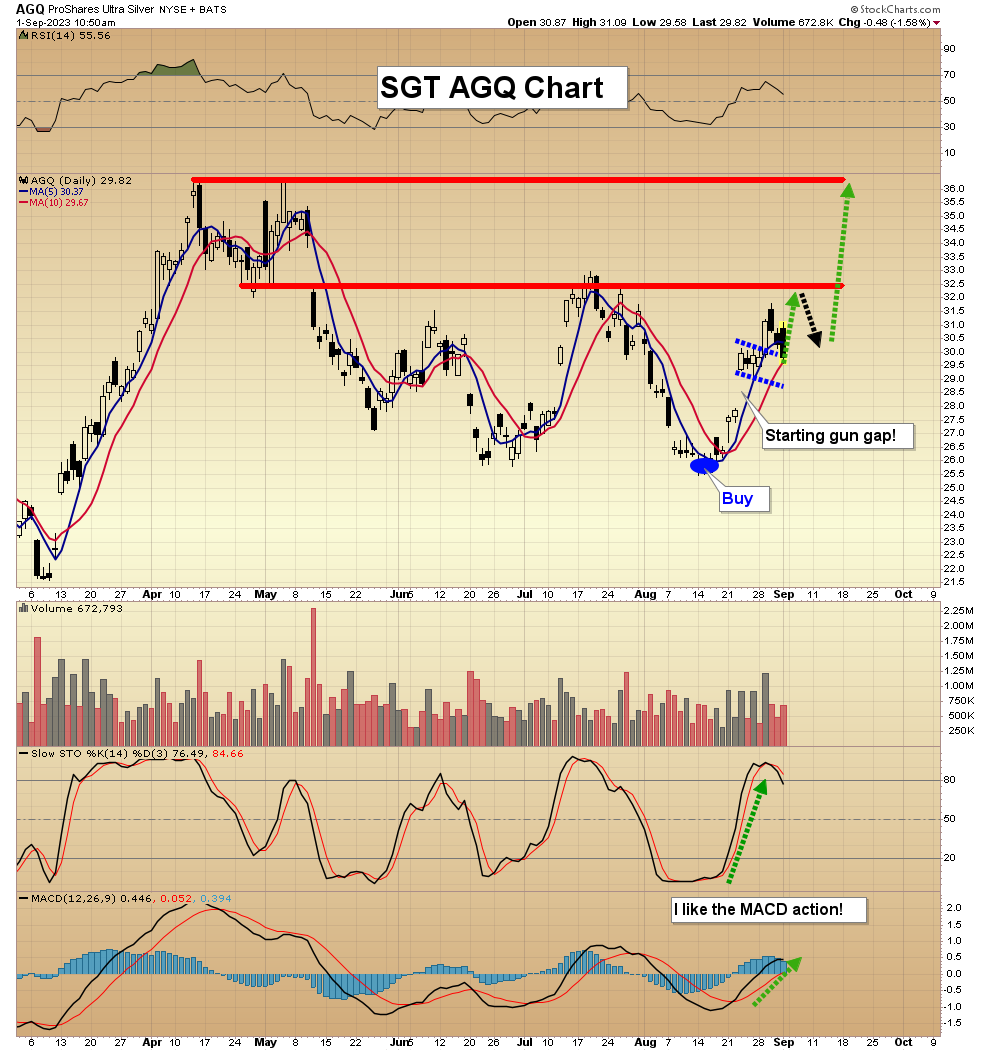
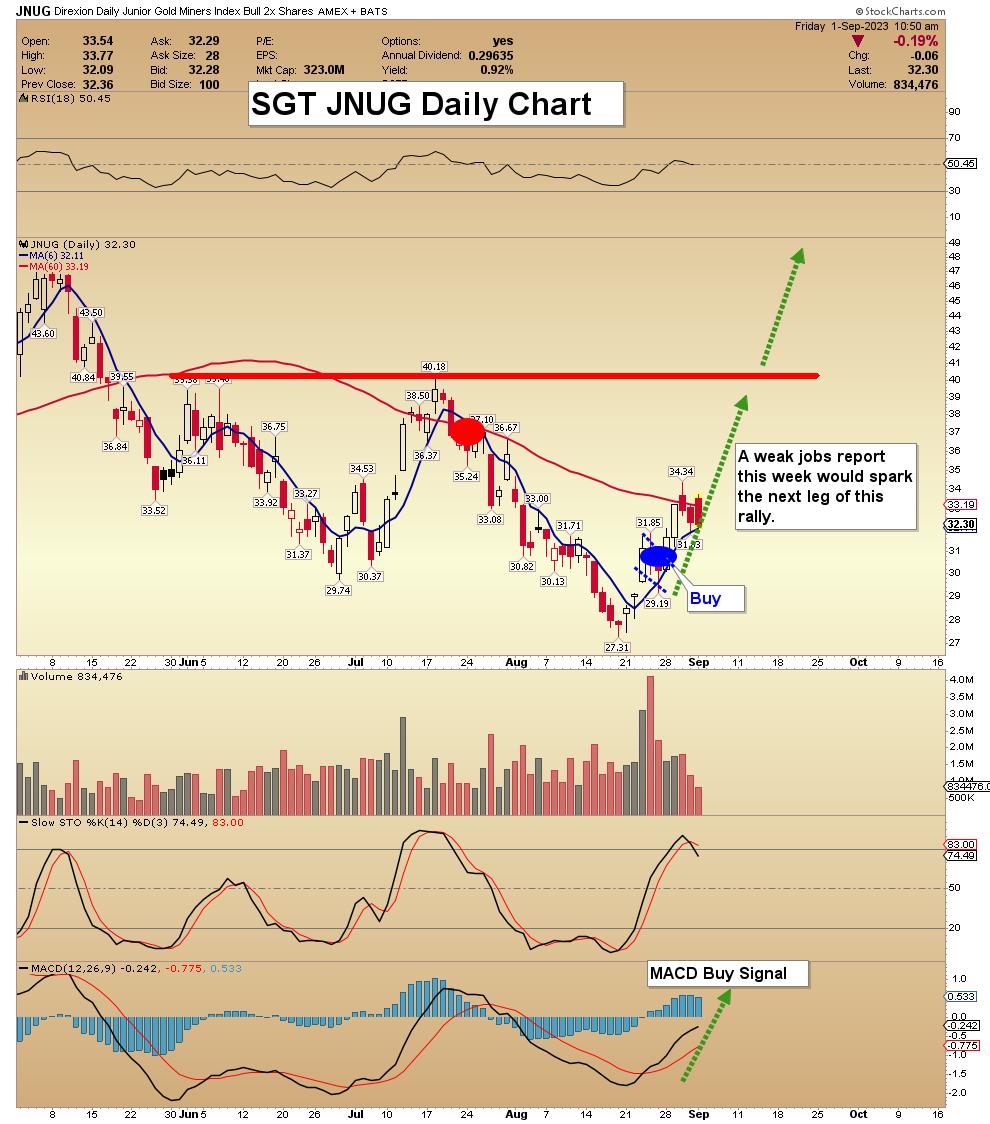
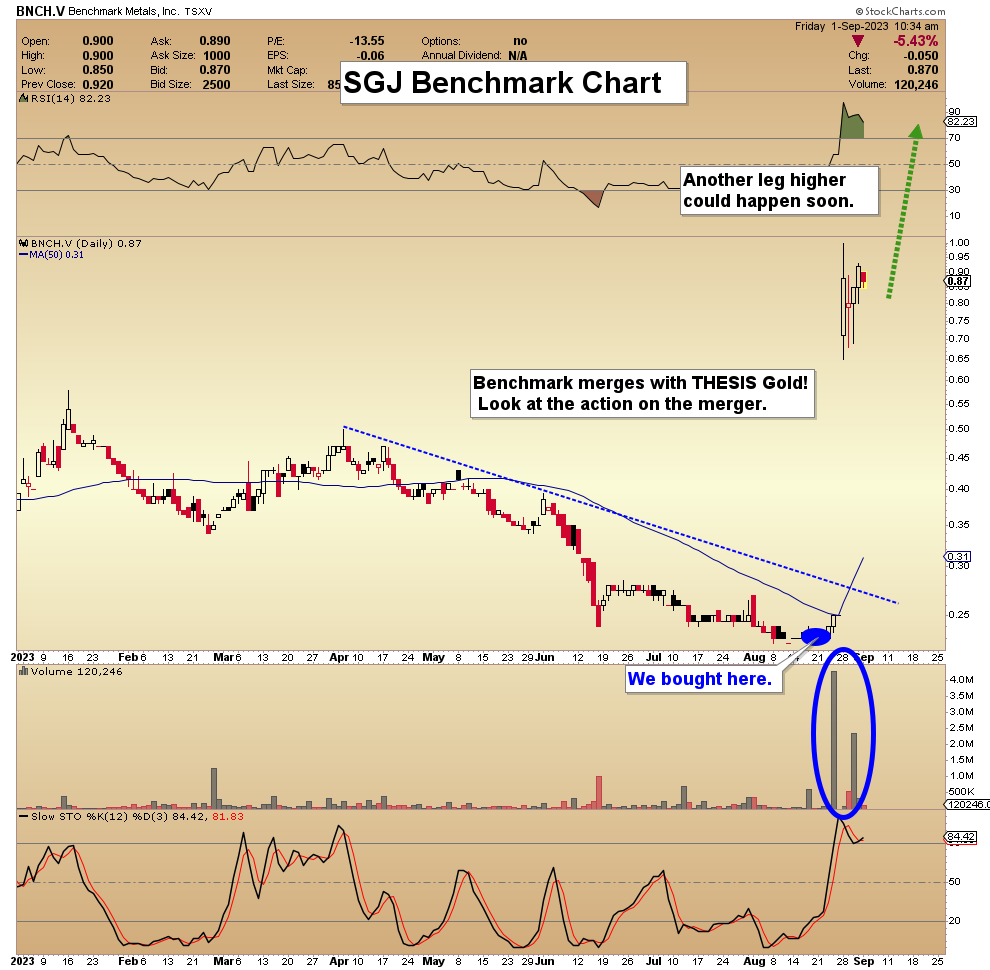
By: Morris Hubbartt | September 29, 2023
Here are today's videos and charts. The videos are viewable on mobile phones as well as computers. Double-click to enlarge the charts.
SGS Key Charts, Signals, & Video Analysis
Super Force Signals (SFS) is being rebranded as Super Gold Signals (SGS at https://supergoldsignals.com), to reflect the growing global importance of gold.

At my SGS flagship newsletter, our focus is doing big picture trades on our winning core positions in gold, silver, commodities, and some Dow stocks too! At $229 a year the value is outstanding, and I have a special offer this week of just $199 for a full 14 months! Shoot me an email or click this link if you want the offer. Thanks!
SG60 Key Charts, Signals, & Video Analysis
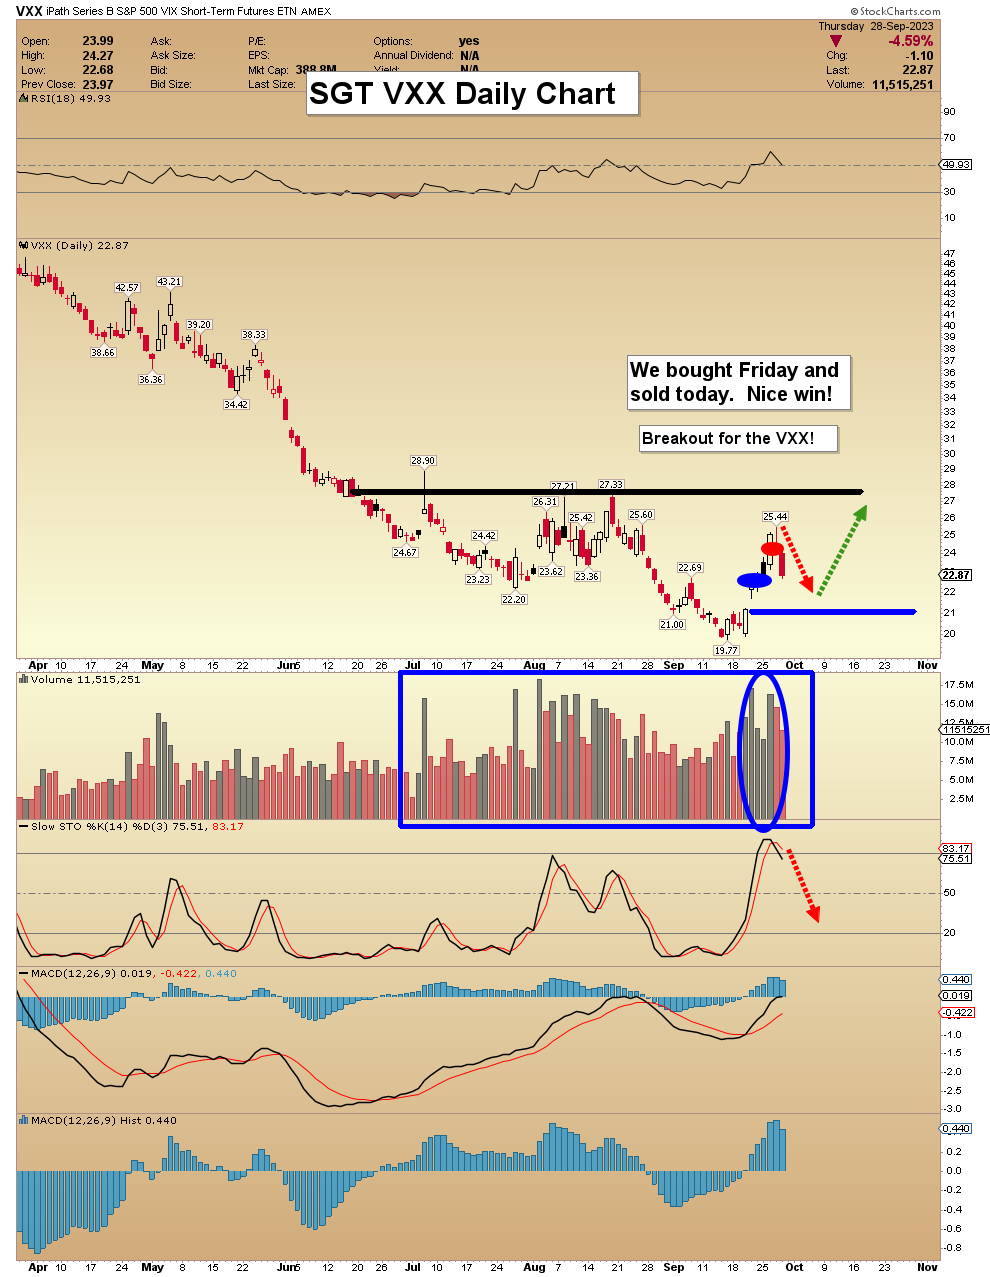
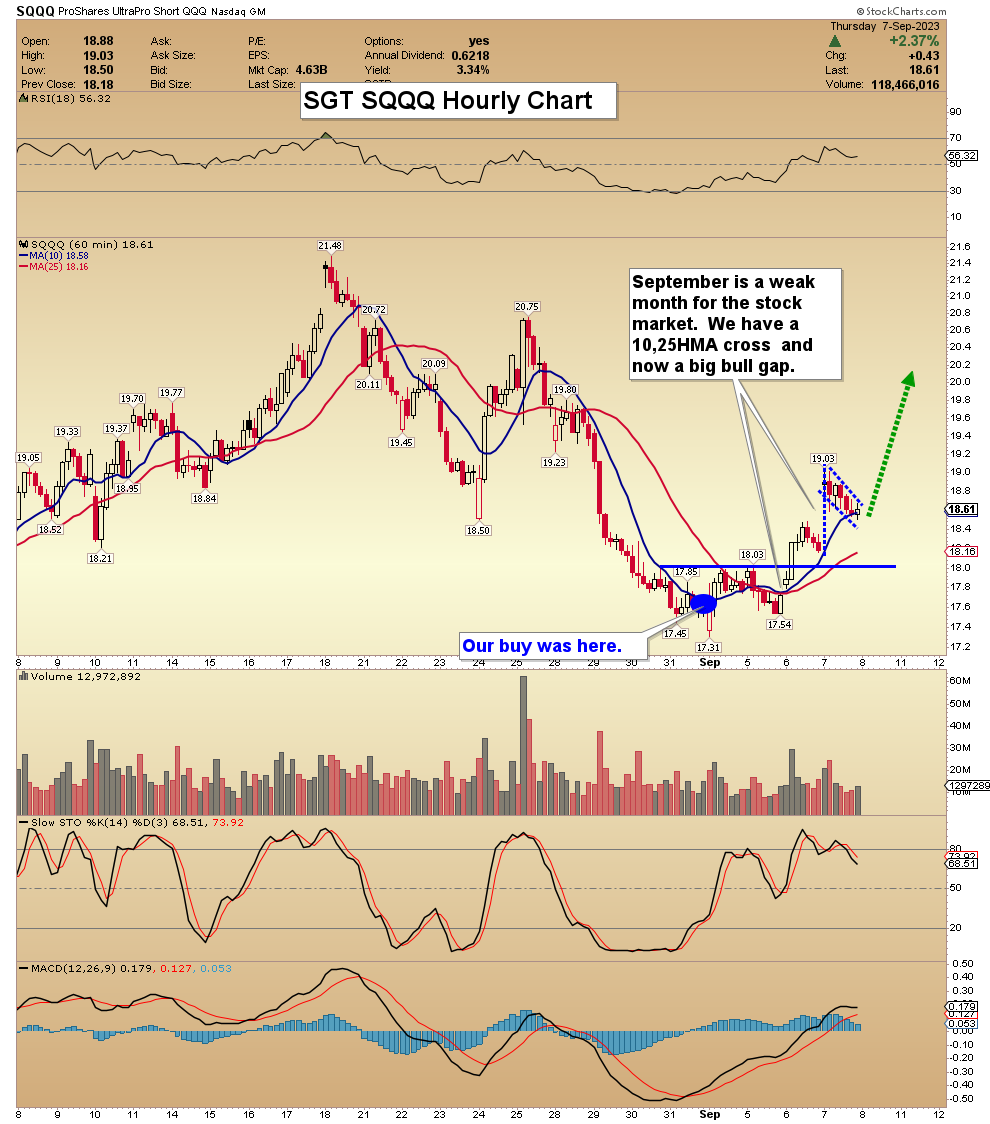
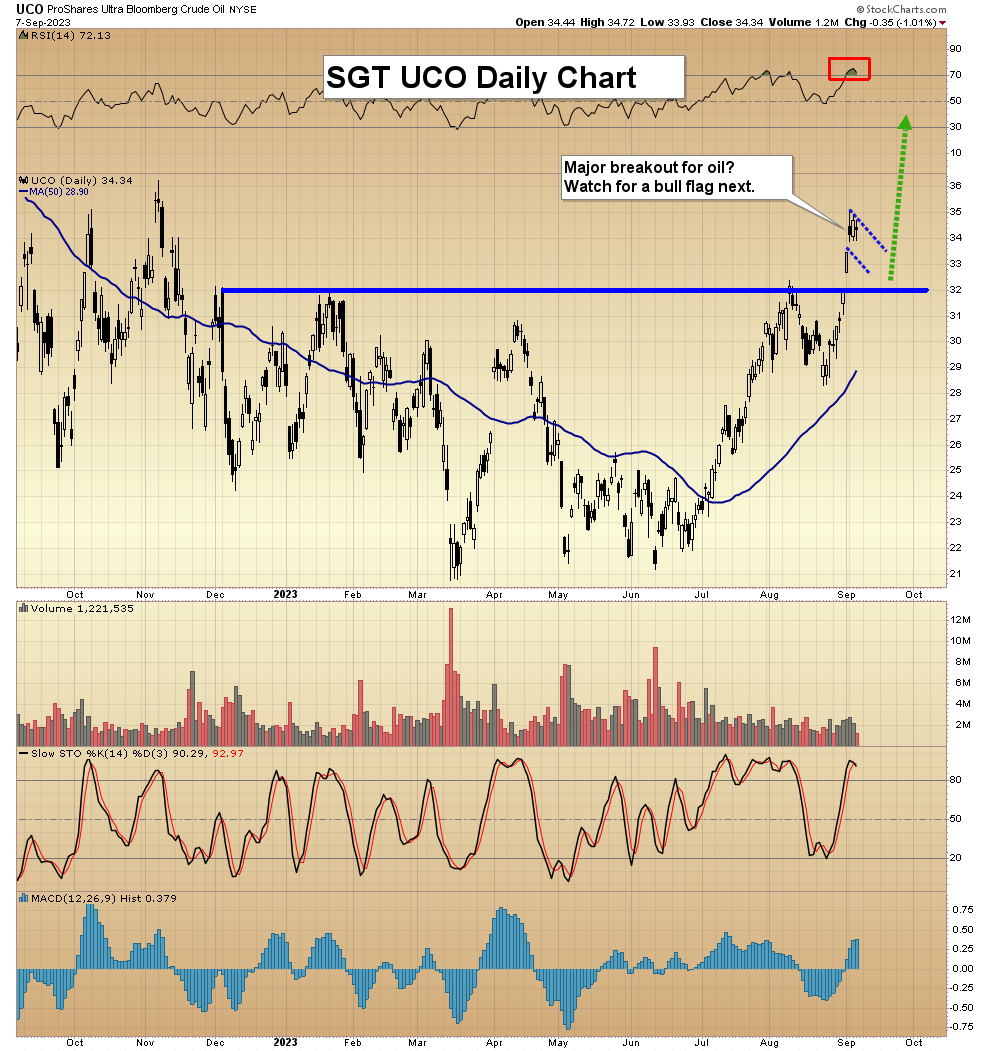
SGT Key Charts, Signals, & Video Analysis
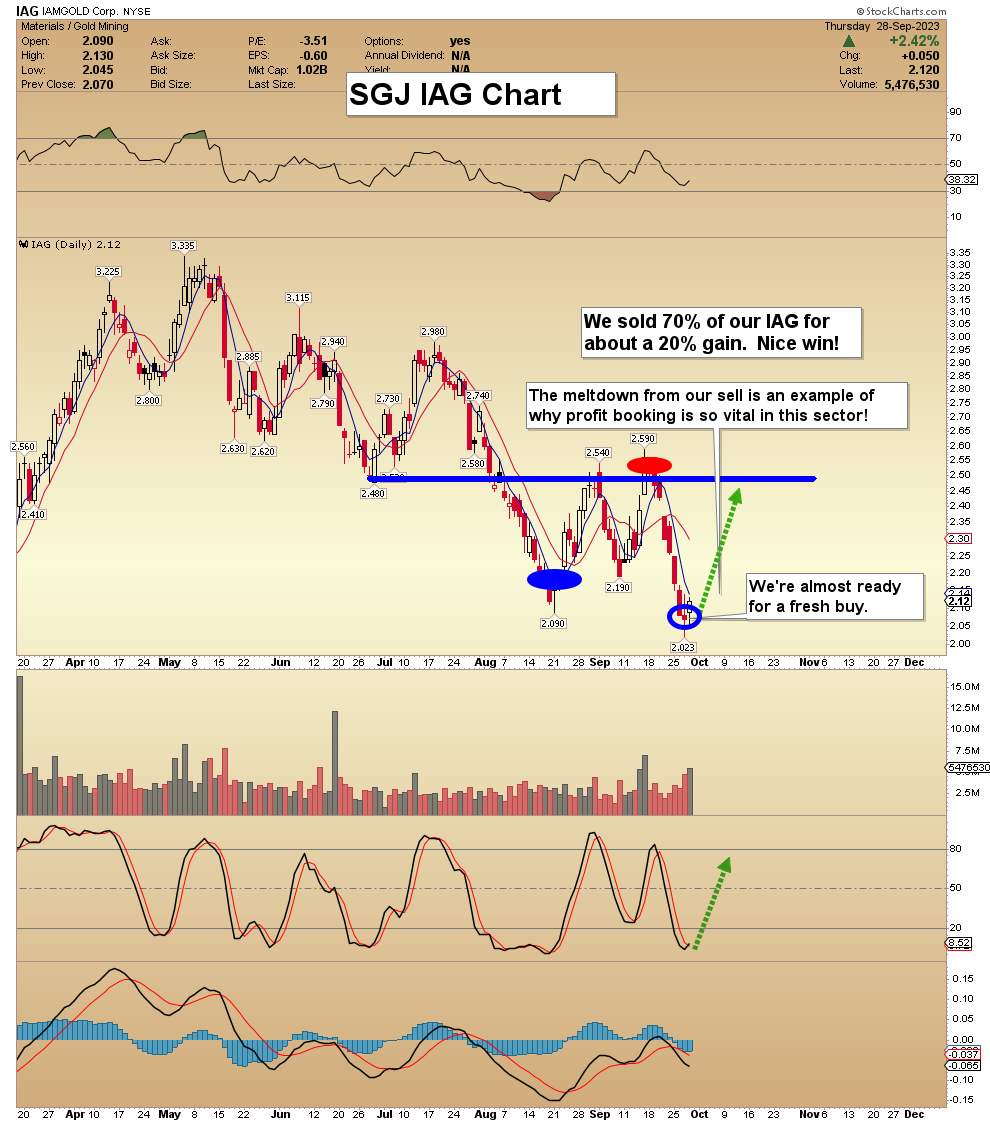
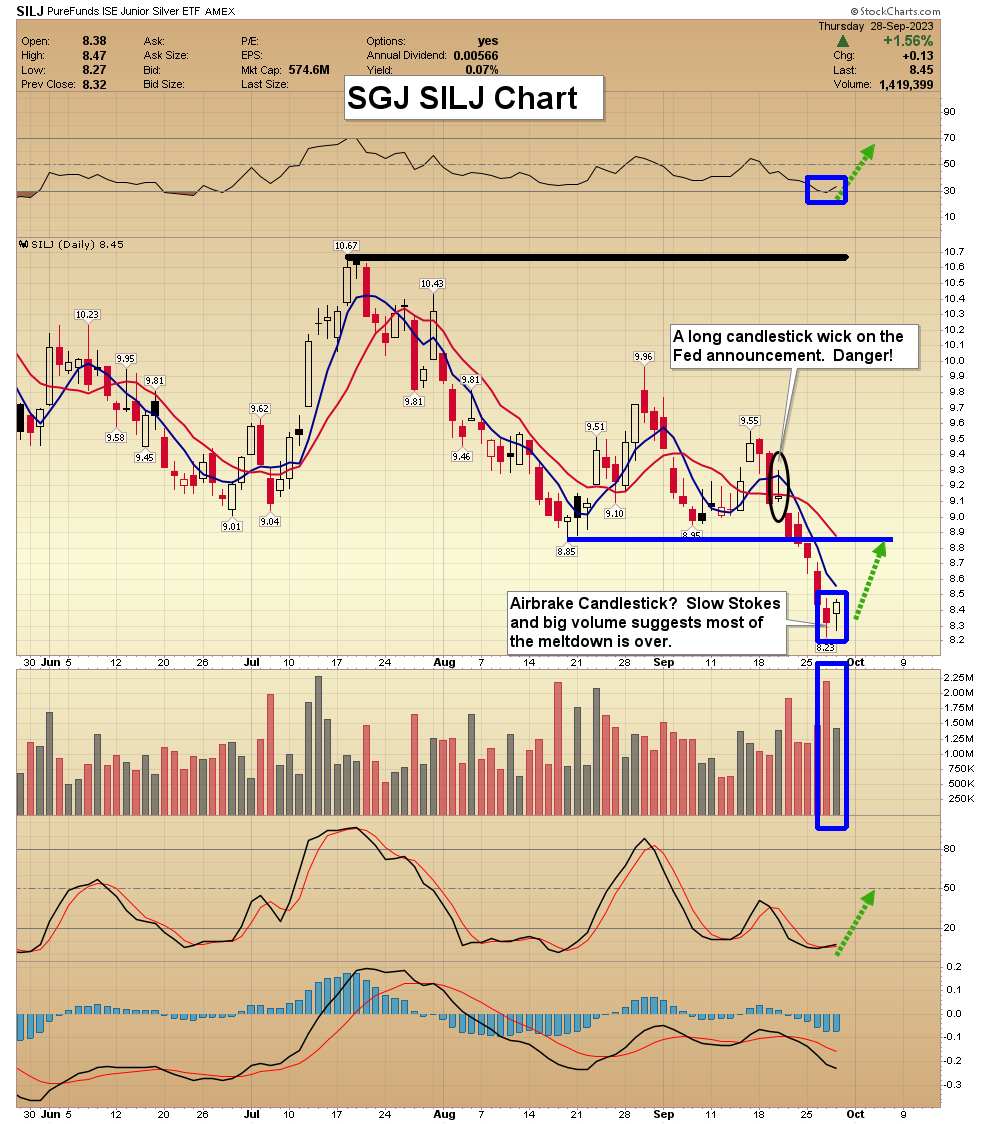
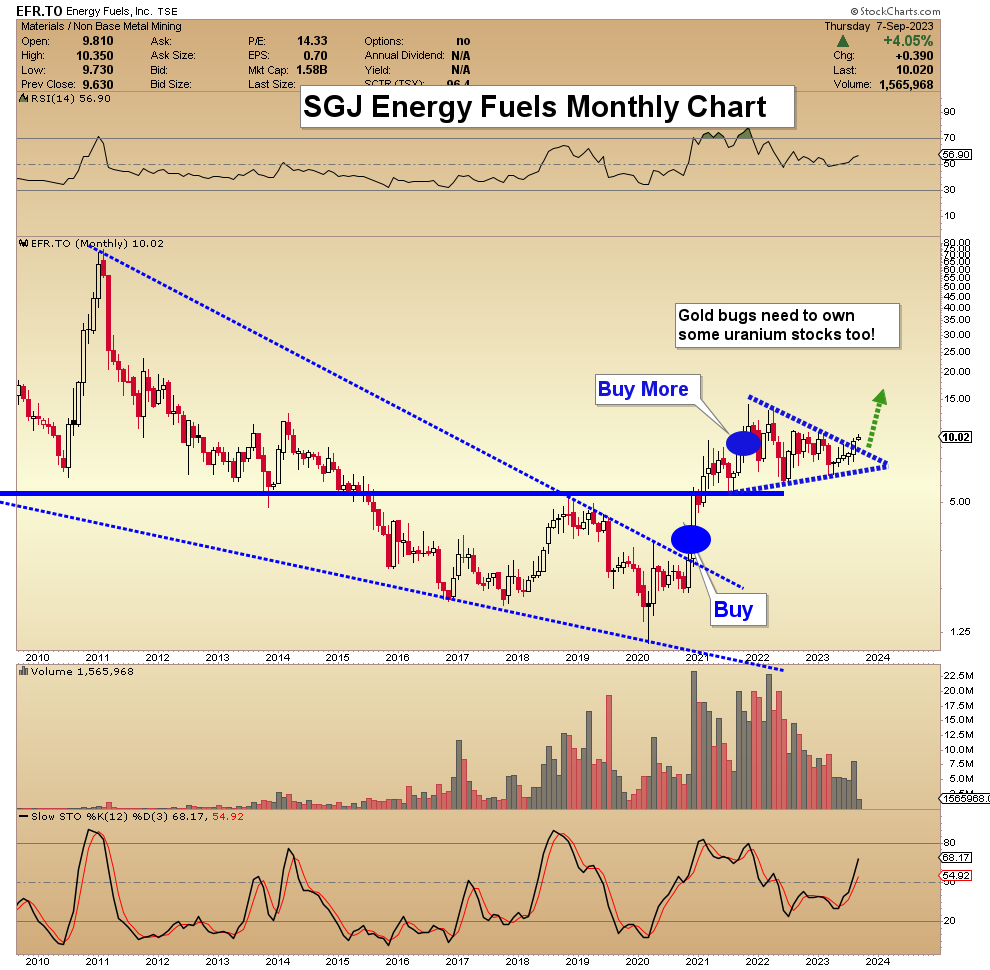
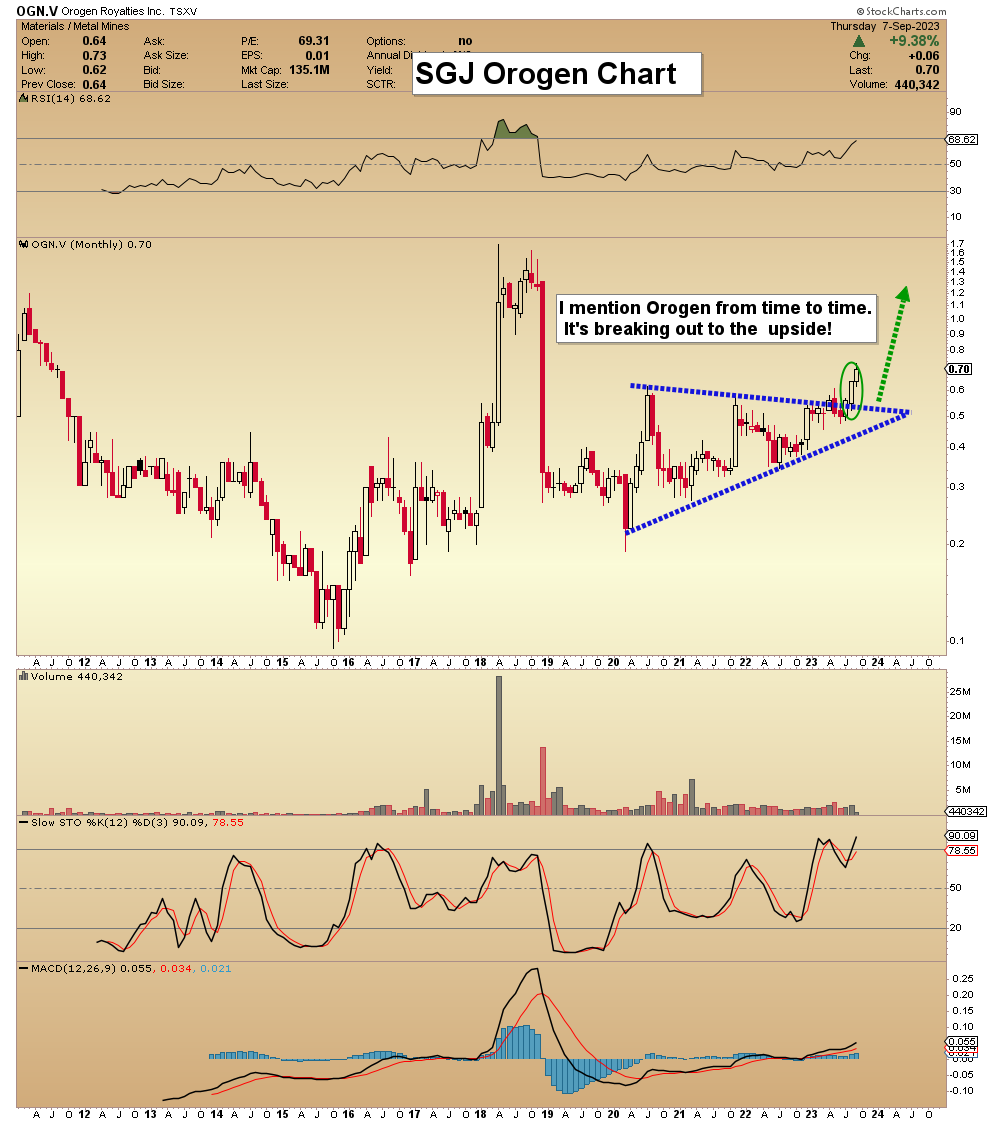
SGJ Key Charts, Signals, & Video Analysis
Read Full Story »»»
DiscoverGold
GDX’s Chronic Undervaluation
By: Adam Hamilton | September 29, 2023
The major gold stocks dominating their sector’s flagship GDX ETF have suffered chronic undervaluation over this past year. Traders simply haven’t been interested, starving gold stocks of the capital inflows necessary to normalize their prices with prevailing gold levels. But a momentous psychological catalyst is nearing that will force a violent mean reversion and overshoot in gold stocks, new nominal record highs in gold.
Financial markets are forever cyclical, perpetually oscillating between opposing extremes. Conditions constantly shift between bulls and bears, uplegs and corrections, overboughtness and oversoldness, herd greed and fear, and overvaluation and undervaluation. The longer any cyclical pendulum lingers at one end of its arc, the greater the odds a mean-reversion swing back is imminent. That’s the case in gold stocks.
Because gold-mining earnings amplify gold price trends, gold stocks are effectively leveraged plays on gold. So their price levels relative to gold’s are a great valuation proxy, revealing cycles when charted over time. The most-popular gold-stock benchmark today remains the GDX VanEck Gold Miners ETF. Dividing its price by that of the mighty GLD SPDR Gold Shares gold ETF illuminates gold-stock valuations.
Mid-week GDX and GLD were slammed to $26.91 and $174.10, yielding a GDX/GLD Ratio of 0.155x. That’s on the lower side of recent years’ range, which hit an extreme 0.133x at its nadir during March 2020’s brutal pandemic-lockdown stock panic. Then the violent mean reversion and overshoot out of that was quick to catapult the GGR to a high of 0.241x in late July 2020. That gives some context for today’s valuations.
The major gold stocks are running about one-fifth up into their latest secular trading range relative to gold. While certainly not stock-panic-grade, these undervaluations have been chronic festering for this past year. The midpoint of that GGR range is 0.187x. From July 2022 to September 2023, GDX only traded above that level compared to GLD on 5 trading days out of 312! Gold stocks have been really out of favor.
From 2020 to 2022, this GDX/GLD Ratio averaged 0.195x through some major cyclical waves going both ways. Yet year-to-date in 2023, GDX’s closing prices have merely reached 0.171x GLD’s on average. So there’s no doubt gold-stock prices have lagged well behind gold’s recently. But this cyclical ebb can’t and won’t last, as the endless market waves soon force gold-stock prices to catch up with then surpass gold’s.
This chart superimposes the GGR and its key technicals over the raw GDX during the last several years or so. Gold-stock prices have really underperformed relative to gold in this span, carving the downtrend rendered here. But the cyclical pendulum has already started swinging back the other way, enjoying a mounting uptrend since the GGR plunged to deep secular lows in late September 2022. This ought to continue.

GDX’s major gold stocks have been losing ground relative to the metal they mine for years, as seen in this GGR downtrend. Gold-stock valuations have drifted lower deeper into undervalued territory as this sector’s popularity waned. It wasn’t just declining resistance and support lines defining this downtrend, but GGR’s 200-day moving average. These key technical lines distill out daily volatility to reveal trends.
This gold-stock valuation proxy’s 200dma peaked in early 2021, then relentlessly ground lower on balance into early 2023. But the cyclical tides subtly started shifting in March, when that 200dma slump bottomed. Then the GGR’s 200dma reversed decisively higher for the first time in years! That is a major technical reversal heralding a cyclical trend change. Gold-stock prices have finally started outperforming gold’s again.
And this mounting wave lifting gold-stock valuations relative to gold is likely to continue. After regaining ground for an entire year now, this GGR uptrend is well-established. Once that happens, these valuation mean reversions tend to run to completion. And that’s not merely a return to average, but usually a proportional overshoot challenging opposing extremes. And the one birthing this reversal was extraordinary
The major gold stocks were slaughtered in mid-2022, with GDX plummeting 46.5% in 5.3 months on radically-unprecedented events! With inflation raging out of control, the Federal Reserve executed its most-extreme rate-hike cycle ever. Starting from zero, in just 6.2 months the Fed catapulted its federal-funds rate an incredible 300 basis points higher! Resulting soaring yields launched the US dollar stratospheric...
* * *
Read Full Story »»»
DiscoverGold
NY Gold Futures »» Weekly Summary Analysis
By: Marty Armstrong | September 30, 2023
NY Gold Futures closed today at 18661 and is trading up about 2.18% for the year from last year's settlement of 18262. This price action here in October is suggesting that this has been a bear market trend on the monthly level.
ECONOMIC CONFIDENCE MODEL CORRELATION
Here in NY Gold Futures, we do find that this particular market has correlated with our Economic Confidence Model in the past. The Last turning point on the ECM cycle low to line up with this market was 2022 and 2015. The Last turning point on the ECM cycle high to line up with this market was 2020 and 2011 and 1996.
MARKET OVERVIEW
NEAR-TERM OUTLOOK
The historical perspective in the NY Gold Futures included a rally from 1999 moving into a major high for 2020, from which the market has been in a bearish trend since then moving into the low in 2022 forming a reactionary trend of 2 years bottoming at 16183. On the other hand, we have not elected any Yearly Bearish Reversal to date from the turning point of 2020, which tends to warn that the 2020 high could still be challenged until we elect a Yearly Bearish Reversal. Notwithstanding, 2022 was, in fact, an outside reversal to the downside closing lower than the previous year. On the other hand, we have elected all four intermediate Yearly Bullish Reversals to date from the turning point of 2022 from this 2022 reaction low.
Curiously, the market has been only consolidating since that 2022 low and has been unable to exceed the high of that year while holding the low. The last Yearly Reversal to be elected was a Bullish at the close of 2022.
This market remains in a positive position on the weekly to yearly levels of our indicating models. Nevertheless, it closed last year on the weak side down from 2021. Pay attention to the Monthly level for any serious change in long-term trend ahead.
Focusing on our perspective using the indicating ranges on the Daily level in the NY Gold Futures, this market remains in a bearish position at this time with the overhead resistance beginning at 19172.
On the weekly level, the last important high was established the week of July 31st at 20109, which was up 5 weeks from the low made back during the week of June 26th. Afterwards, the market bounced for 12 weeks reaching a high during the week of September 18th at 19331. Since that high, we have been generally trading down for the past week, which has been a significant move of 5.414% in a reactionary type decline.
When we look deeply into the underlying tone of this immediate market, we see it is currently still in a semi neutral posture despite declining from the previous high at 19689 made 1 week ago.
Looking at this from a broader perspective, this last rally into the week of September 18th reaching 19689 failed to exceed the previous high of 19802 made back during the week of August 28th. That rally amounted to only three typical reaction weeks. Right now, the market is below momentum on our weekly models casting a bearish cloud over the price action.
INTERMEDIATE-TERM OUTLOOK
YEARLY MOMENTUM MODEL INDICATOR
Our Momentum Models are declining at this time with the previous high made 2020 while the last low formed on 2022. However, this market has rallied in price with the last cyclical high formed on 2020 and thus we have a divergence warning that this market is starting to run out of strength on the upside.
After closing above last year's low of 16733 when it was an outside reversal to the downside yet it did close lower. This immediate year, the market did open higher, thus far, but this market has rallied exceeding last year's high. and remains below last year's high of 20788. This market is still above the normal trading yearly envelope where the top remains at 17906. The last Breakout Mode indicator took place in during 2003.
This market is trading well beneath that high of May which was 20854 by more than 10 percent. Critical support still underlies this market at 18107 and a break of that level on a monthly closing basis would warn of a further decline ahead becomes possible. Nevertheless, at this time, the market is still weak.
DiscoverGold GDX #Miners - At the 62/Fib Is that close enough for my Red-Box Target?...
By: Sahara | September 28, 2023
• $GDX #Miners - At the 62/Fib
Is that close enough for my Red-Box Target?...

Read Full Story »»»
DiscoverGold
The Ord Oracle: GDX Update
By: Tim Ord | September 27, 2023
SPX Monitoring Purposes: Short SPX on 9/1/23 at 4515.77; cover short 9/5/23 at 4496.83 = gain .43%.
Gain since 12/20/22: 15.93%.
Monitoring Purposes GOLD: Long GDX on 10/9/20 at 40.78.

We updated this chart from last Thursday, which is the Bullish percent index for the Gold Miners index/GDX ratio. Last Thursday's chart took this ratio back to mid-2016; the above chart goes back to 2009. The top window is the 28-period RSI, and the next window down is the Bullish Percent index for the Gold Minders index/GDX ratio. A bottom is in for GDX when the RSI of this ratio trades below 30 and than closes above 30. The blue and red lines on the chart above are previous signals. There were 18 signals generated with two failures (noted with red lines), which works out to a 89% success rate. We could see a "back and forth" period, but the chart above has a 89% success rate.
Tim Ord,
Editor
Read Full Story »»»
DiscoverGold
I think Gold and the miners gonna go considerably lower. The market is taking Jay Powell seriously. Volker killed gold with higher for longer rates a long time ago. Jay sees himself as volker. As long as the market can take the higher rates, he will keep it up, to jam inflation down to around his targets. This means bringing gold much lower. Unless the market breaks. That may be next spring. A long time from now. gold will be much lower.
GDX #Miners - There ae a few Pot'l Spprt Levels (Dotted Black Lines)
By: Sahara | September 27, 2023
• $GDX #Miners - There ae a few Pot'l Spprt Levels (Dotted Black Lines).
Otherwise the 62/Fib and my Lwr Red 'Pennant' Target Box come into focus...

Read Full Story »»»
DiscoverGold
Agnico Eagle Mines (AEM) Stock Could Soon Move Lower
By: Schaeffer's Investment Research | September 25, 2023
• AEM has just come within one standard deviation of two historically bearish trendlines
• The stock's technical setup as well as surrounding sentiment paint a bearish picture
Agnico Eagle Mines Ltd (NYSE:AEM) has been chopping higher since its recent mid-August five-month lows. However, the stock has just run into two historically bearish trendlines that could cut its comeback short.
According to Schaeffer's Senior Quantitative Analyst Rocky White, AEM came within one standard deviation of its 100-day moving average six times in the past three years, after which the stock was lower one month later 83% of time, averaging a 4.1% loss. Walt Disney stock's 100-day trendline has seen seven similar signals, and was lower after the ensuing month 71% of the time to average a 2.7% drop.
An unwinding of optimism amongst options traders and analysts cut create headwinds as well. Of the 14 analysts in coverage, 13 carry a "buy" or better rating, while AEM's 50-day call/put volume ratio at the International Securities Exchange (ISE), Cboe Options Exchange (CBOE), and NASDAQ OMX PHLX (PHLX) ranks in the 93rd percentile of its annual range.
When speculating on AEM, now looks like a good time to weigh in with puts. The security's Schaeffer's Volatility Index (SVI) of 29% ranks in the low 10th percentile of its annual range, meaning options traders are pricing in low volatility expectations at the moment.
Read Full Story »»»
DiscoverGold
GDX #Miners - Failed to clear the Confluence of Uppr-Band 'Cup' Line & Dotted Green 50/DMA equivalent that I mentioned prior
By: Sahara | September 25, 2023
• $GDX #Miners - Failed to clear the Confluence of Uppr-Band 'Cup' Line & Dotted Green 50/DMA equivalent that I mentioned prior. And has now slipped the Bear 'Pennant' (Red-Band) which favours the Red Arrowed Targets, unless it holds the Fractal 'Broadening' Target...

Read Full Story »»»
DiscoverGold
No blast off to more early signals saying 1925 is loading zone.
Jack Chan: Gold Price Exclusive Update
By: Jack Chan | September 23, 2023

Our proprietary cycle indicator is DOWN.
To public readers of our updates, our cycle indicator is one of the most effective timing tool for traders and investors. It is not perfect, because periodically the market can be more volatile and can result in short term whipsaws. But overall, the cycle indicator provides us with a clear direction how we should be speculating.
Investors
Accumulate positions during an up cycle and hold for the long term.
Traders
Enter the market at cycle bottoms and exit at cycle tops for short term profits.

GLD is on short term buy signal.

GDX is on short term buy signal.

XGD.to is on short term buy signal.

GDXJ is on short term buy signal.
Analysis

Current data is unclear.

Our ratio is on a buy signal.

Trend is UP for USD.

Trend is UP for gold stocks.

Trend is DOWN for gold.

GDX has broken resistance and now testing support.
Summary
Gold sector cycle is down.
Trend is up for USD, up for gold stocks and down for gold.
COT data is not helpful at this point.
$$$ We are partially invested and waiting for the next cycle bottom.
Read Full Story »»»
DiscoverGold
Gold, Miners Weather Fed
By: Adam Hamilton | September 22, 2023
Fed hawkishness has been the rankling thorn in gold’s side for 18 months now. Since the Fed started this monster rate-hike cycle, every material gold and gold-stock selloff has been driven by the threat of more rate hikes. Those boost the US dollar, triggering gold-futures selling. But the Fed’s hawkish spell over traders is waning. Gold and the miners weathered this week’s latest hawkish FOMC meeting pretty well.
The Federal Open Market Committee catapulted its federal-funds rate up an extreme 525 basis points off zero in just 16.3 months into late July! That blasted the FFR to a lofty 22.4-year secular high of 5.38%. And this scorching rate-hike cycle was even more violent internally, with over 4/5ths of it happening in just 9.0 months into mid-December! The Fed has never before hiked so big and fast from such low levels.
The resulting higher US yields ignited a parabolic moonshot in the US dollar. In just 6.0 months into last September, the benchmark US Dollar Index skyrocketed 16.7%! The leveraged gold-futures speculators who dominate gold’s short-term price action closely watch the dollar’s fortunes for their trading cues, and do the opposite. So gold plummeted 20.9% in 6.6 months on heavy and relentless gold-futures dumping!
The mean-reversion rebounds out of those extreme anomalies were fierce, with gold fully recovering in a powerful 26.3% upleg over the subsequent 7.2 months into early May. Since then gold has drifted lower in a stubborn pullback fueled by dollar bear-market rallies. My essay last week analyzed this whole Fed-dollar-gold dynamic in depth if you need to get up to speed. The latest FOMC meeting this week builds on that.
After eleven rate hikes since mid-March 2022 including four 75bp behemoths, the FOMC wasn’t expected to hike again Wednesday with futures-implied odds near zero. The FOMC statement itself released after that meeting was virtually unchanged from the prior one in late July. Traders were far more interested in top Fed officials’ federal-funds-rate projections, which are published quarterly after every-other FOMC meeting.
This latest Summary of Economic Projections proved very interesting and somewhat contradictory. In just one quarter since their last forecasts, these elite Fed guys more than doubled their 2023 US GDP-growth outlook to 2.1%. With the economy strong, their expected unemployment rate this year retreated from 4.1% to 3.8%. They even saw core PCE inflation excluding energy and food moderating from 3.9% to 3.7%!
With continuing disinflation forecast despite a stronger US economy, you’d think top Fed officials would soften their uber-hawkish stance. They could project fewer additional rate hikes, or not holding the FFR as high for as long. But they did neither, with the 2023-year-end FFR forecast staying at the prior dot plot’s 5.63%. The FOMC views the FFR as a 25-basis-point target range, so dots are the midpoint average.
That implied one more 25bp hike later this year, at either the early-November or mid-December FOMC meetings. Traders had long expected that, since the mid-June dot plot also showed a 5.63% FFR exiting 2023. Traders weren’t looking for more-hawkish dots, as the USDX slumped 0.4% that day leading into that latest SEP. Gold really outperformed, with nice 0.8% intraday gains to $1,947 before that FOMC decision.
But despite no rate hike and no change to year-end-2023 projected FFR levels, Fed officials still managed to pull a hawkish rabbit out of their hats. Their year-end-2024 FFR forecast surged 50bp from 4.63% in mid-June to 5.13% this week! So the previous 100bp of rate cuts implied next year were slashed in half to 50bp. I didn’t expect that to change at all, though consensus was for trimming one of those cuts to 75bp.
As far as dot-plot surprises go, that was fairly mild. Top Fed officials’ FFR projections have long been notorious for proving wrong, as the Fed chair himself often emphasizes in his post-FOMC-meeting press conferences. So depending on the tenor of major economic data like jobs, GDP, and inflation during the coming few months, the next dot plot in mid-December will likely change again. Projections are always in flux.
There are many examples of dots being far from subsequent reality. A recent one is the mid-March-2022 SEP accompanying the Fed’s maiden rate-hike of this cycle. Then top Fed officials expected to see the FFR leave 2022 and 2023 at 1.88% and 2.88%. Yet merely nine months later the federal-funds rate was actually running far higher at 4.38% leaving last year, and is again just 25bp away from 5.63% exiting 2023!
So the currency and gold-futures speculators who closely watch the dots should know better than to put too much stock in them. They’ll look different next quarter and continue to greatly diverge from the actual FFR trajectory like usual. Yet starting with Wednesday’s SEP, sizable US-dollar buying erupted fueling gold-futures selling. The USDX reversed sharply, staging a 0.7% intraday surge into a new rally closing high.
So gold dropped from $1,947 leading into the FOMC to a flat close of $1,931. That still wasn’t bad, much better than other gold plunges after other FOMC hawkish surprises in the past 18 months or so. Gold weathered Fed officials implying higher-for-longer with half the previously-projected rate cuts in 2024 well. And gold-stock traders didn’t freak out, with the leading GDX gold-stock ETF climbing 1.1% to $29.71 that day.
The USDX’s post-dots reversal extended its relentless gains since mid-July to 5.7%, which is gigantic for a major world currency! Yet gold continued to overcome the dollar as it only slumped 1.5% in that same span. Gold shows relative strength when falling less than the dollar surges during its material rallies. Often post-FOMC price trends aren’t apparent until the following day, after foreign traders have a chance to react.
Both gold and GDX were weaker Thursday morning as I penned this essay, dragged down by stock markets falling on higher-for-longer fears. But again those latest dots shouldn’t be taken too seriously. All it will take for top Fed officials to pencil in more rate cuts in 2024 is weaker-than-expected jobs reports or cooler-than-expected inflation ones. We should see some before mid-December, pushing the dots back lower.
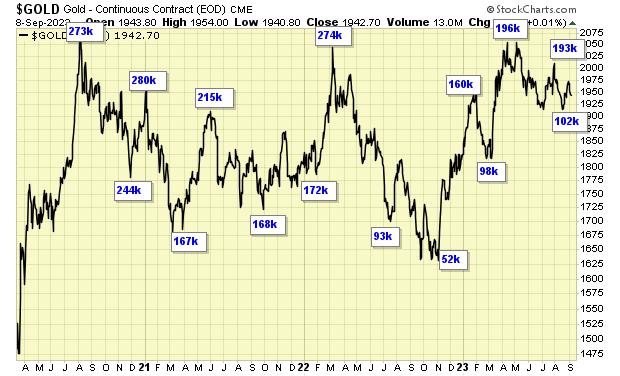
No matter what the Fed did this week, gold wasn’t likely to plunge because speculators’ gold-futures positioning remained quite bearish. This chart is updated from my gold-shorting-spike-bullish analysis as September dawned. Total spec longs remained relatively-low while total spec shorts stayed relatively-high leading into this latest FOMC meeting, leaving way more room for gold-boosting buying than selling.
The weekly Commitments of Traders reports current to Tuesday closes aren’t released until late Friday afternoons. So the latest data before this essay was published was current to Tuesday the 12th, a week before the FOMC. Then total spec longs and shorts were running 282.4k and 137.6k contracts, leaving massive room to buy back futures. Those bearish collective bets were bullish for gold on mean-reversion buying.
The first month of the USDX’s recent big surge into mid-August shook loose huge gold-futures shorting. That left total spec shorts at their highest levels since early November 2022, early in this large 26.3% gold upleg’s life. Excessive shorts guarantee proportional near-future buying to cover and close those risky leveraged downside bets on gold. Spec shorts averaged 94.1k contracts from late March to early August.
To mean revert back down to those levels would require 43.5k contracts of short covering, the equivalent of 135.4 metric tons of gold. Had top Fed officials not changed their 2024 federal-funds-rate outlook this week, big gold-futures short covering likely would have ignited. That quickly becomes self-feeding, as the resulting surging gold prices pressure more shorts into buying offsetting contracts to close out their bets.
But since spec longs well outnumber spec shorts, they are proportionally more important for driving short-term gold trends. Over the past 52 CoT weeks, longs have run 2.4x shorts on average. Spec longs have a well-defined secular trading range, with lower support near last September’s 247.5k contracts that birthed this strong gold upleg. Upper resistance in recent years has run near 413.0k, implying buying exhaustion...
Read Full Story »»»
DiscoverGold
Gold CoT: Peek Into Future Through Futures, How Hedge Funds Are Positioned
By: Hedgopia | September 23, 2023
• Following futures positions of non-commercials are as of September 19, 2023.
Gold: Currently net long 135.2k, up 11.3k.

Gold bugs continued to defend the 200-day, with Thursday’s low of $1,933 kissing the average ($1,934). On Wednesday, the metal rallied as high as $1,969 – past the 50-day at $1,954 – but the average was lost in the very next session. It closed out the week at $1,946/ounce.
In essence, gold is stuck between these averages, with a downward bias toward must-save $1,920s.
Bulls had a tremendous opportunity in May this year to stage a major breakout, but gold headed lower as soon as $2,085 was ticked on the 4th. In the past, $2,089 was tagged in August 2020 – an all-time high – and $2,079 in March 2022. Concurrently, gold bears have been unable to convincingly reclaim $1,920s.
Read Full Story »»»
DiscoverGold
NY Gold Futures »» Weekly Summary Analysis
By: Marty Armstrong | September 23, 2023
NY Gold Futures closed today at 19456 and is trading up about 6.53% for the year from last year's settlement of 18262. Immediately, this market has been rising for 2 months going into September reflecting that this has been only still, a bullish reactionary trend.
Up to now, we still have only a 2 month reaction rally from the low established during June. We must exceed the 3 month mark in order to imply that a trend is developing.
ECONOMIC CONFIDENCE MODEL CORRELATION
Here in NY Gold Futures, we do find that this particular market has correlated with our Economic Confidence Model in the past. The Last turning point on the ECM cycle low to line up with this market was 2022 and 2015. The Last turning point on the ECM cycle high to line up with this market was 2020 and 2011 and 1996.
MARKET OVERVIEW
NEAR-TERM OUTLOOK
The historical perspective in the NY Gold Futures included a rally from 1999 moving into a major high for 2020, from which the market has been in a bearish trend since then moving into the low in 2022 forming a reactionary trend of 2 years bottoming at 16183. Distinctly, we have not elected any Yearly Bearish Reversal to date from the turning point of 2020, which tends to warn that the 2020 high could still be challenged until we elect a Yearly Bearish Reversal. Notwithstanding, 2022 was, in fact, an outside reversal to the downside closing lower than the previous year. Distinctly, we have elected all four intermediate Yearly Bullish Reversals to date from the turning point of 2022 from this 2022 reaction low.
Curiously, the market has been only consolidating since that 2022 low and has been unable to exceed the high of that year while holding the low. The last Yearly Reversal to be elected was a Bullish at the close of 2022.
This market remains in a positive position on the weekly to yearly levels of our indicating models. Nevertheless, it closed last year on the weak side down from 2021. Pay attention to the Monthly level for any serious change in long-term trend ahead.
The perspective using the indicating ranges on the Daily level in the NY Gold Futures, this market remains moderately bearish position at this time with the overhead resistance beginning at 19506 and support forming below at 19335. The market is trading closer to the resistance level at this time.
On the weekly level, the last important high was established the week of July 31st at 20109, which was up 5 weeks from the low made back during the week of June 26th. Afterwards, the market bounced for 9 weeks reaching a high during the week of August 28th at 19401. Since that high, we have been generally trading down for the past 3 weeks, which has been a reasonable move of 2.378% in a reactionary type decline. Nonetheless, the market still has not penetrated that previous low of 19006 as it has fallen back reaching only 2660 which still remains -86.0% above the former low.
When we look deeply into the underlying tone of this immediate market, we see it is currently still in a semi neutral posture despite declining from the previous high at 19802 made 3 weeks ago. Still, this market is within our trading envelope which spans between 18839 and 20197.
Looking at this from a broader perspective, this last rally into the week of August 28th reaching 19802 failed to exceed the previous high of 20109 made back during the week of July 31st. That rally amounted to only four weeks. Right now, the market is neutral on our weekly Momentum Models warning we have overhead resistance forming and support in the general vacinity of 19401. Additional support is to be found at 19142.
INTERMEDIATE-TERM OUTLOOK
YEARLY MOMENTUM MODEL INDICATOR
Our Momentum Models are declining at this time with the previous high made 2020 while the last low formed on 2022. However, this market has rallied in price with the last cyclical high formed on 2020 and thus we have a divergence warning that this market is starting to run out of strength on the upside.
After closing above last year's low of 16733 when it was an outside reversal to the downside yet it did close lower. This immediate year, the market did open higher, thus far, but this market has rallied exceeding last year's high. and remains below last year's high of 20788. This market is still above the normal trading yearly envelope where the top remains at 17906. The last Breakout Mode indicator took place in during 2003.
Critical support still underlies this market at 18708 and a break of that level on a monthly closing basis would warn that a sustainable decline ahead becomes possible. Immediately, the market is trading within last month's trading range in a neutral position.
DiscoverGold gold is looking so good, best in years. very exciting times.

FYI i left several indicators off, aint no body but my business, so sorry. wont respond to the lame, grasshoppers, or market illiterate.
GDX #Miners -Tho the Lime/MA's need to be taken it has Broken Out on the indices Ratio but not on the Gold Ratio
By: Sahara | September 22, 2023
• $GDX #Miners -Tho the Lime/MA's need to be taken it has Broken Out on the indices Ratio but not on the Gold Ratio.
Just as GDX is at the Bear 'Pennant' B/Down Line. See if the Daily Blue 20/MA can do its thing here...

Read Full Story »»»
DiscoverGold
Jack Chan: Gold Price Exclusive Update
By: Jack Chan | September 16, 2023
Our proprietary cycle indicator is DOWN.
To public readers of our updates, our cycle indicator is one of the most effective timing tool for traders and investors. It is not perfect, because periodically the market can be more volatile and can result in short term whipsaws. But overall, the cycle indicator provides us with a clear direction how we should be speculating.
Investors
Accumulate positions during an up cycle and hold for the long term.
Traders
Enter the market at cycle bottoms and exit at cycle tops for short term profits.
GLD is on short term buy signal.
GDX is on short term buy signal.
XGD.to is on short term buy signal.
GDXJ is on short term buy signal.
Analysis
Current data is unclear.
Our ratio is on a buy signal.
Trend is UP for USD.
Trend is UP for gold stocks.
Trend is DOWN for gold.
GDX has broken resistance.
Summary
Gold sector cycle is down.
Trend is up for USD, up for gold stocks and down for gold.
COT data is not helpful at this point.
$$$ We are partially invested and waiting for the next cycle bottom.
Read Full Story »»»
DiscoverGold
NY Gold Futures »» Weekly Summary Analysis
By: Marty Armstrong | September 16, 2023
NY Gold Futures closed today at 19462 and is trading up about 6.57% for the year from last year's settlement of 18262. Up to now, this market has been rising for 2 months going into September reflecting that this has been only still, a bullish reactionary trend.
Up to now, we still have only a 2 month reaction rally from the low established during June. We must exceed the 3 month mark in order to imply that a trend is developing.
ECONOMIC CONFIDENCE MODEL CORRELATION
Here in NY Gold Futures, we do find that this particular market has correlated with our Economic Confidence Model in the past. The Last turning point on the ECM cycle low to line up with this market was 2022 and 2015. The Last turning point on the ECM cycle high to line up with this market was 2020 and 2011 and 1996.
MARKET OVERVIEW
NEAR-TERM OUTLOOK
The historical perspective in the NY Gold Futures included a rally from 1999 moving into a major high for 2020, from which the market has been in a bearish trend since then moving into the low in 2022 forming a reactionary trend of 2 years bottoming at 16183. Nonetheless, we have not elected any Yearly Bearish Reversal to date from the turning point of 2020, which tends to warn that the 2020 high could still be challenged until we elect a Yearly Bearish Reversal. Notwithstanding, 2022 was, in fact, an outside reversal to the downside closing lower than the previous year. Nonetheless, we have elected all four intermediate Yearly Bullish Reversals to date from the turning point of 2022 from this 2022 reaction low.
Curiously, the market has been only consolidating since that 2022 low and has been unable to exceed the high of that year while holding the low. The last Yearly Reversal to be elected was a Bullish at the close of 2022.
This market remains in a positive position on the weekly to yearly levels of our indicating models. Nevertheless, it closed last year on the weak side down from 2021. Pay attention to the Monthly level for any serious change in long-term trend ahead.
Focusing on our perspective using the indicating ranges on the Daily level in the NY Gold Futures, this market remains neutral with resistance standing at 19475 and support forming below at 19444. The market is trading closer to the resistance level at this time. An opening above this level in the next session will imply that a bounce is unfolding.
On the weekly level, the last important low was established the week of June 26th at 19006, which was down 8 weeks from the high made back during the week of May 1st. We have seen the market drop sharply for the past week penetrating the previous week's low and yet it recovered to close above the previous week's close of 19427. We are still trading neutral on the Weekly Momentum Indicators and this is a warning that initial support has been breached. This strongly implies we should pay close attention now to the Weekly Bearish Reversals. If we begin to elect Weekly Bearish Reversals, then we are dealing with a more sustainable near-term correction. When we look deeply into the underlying tone of this immediate market, we see it is currently still in a semi neutral posture despite declining from the previous high at 19802 made 2 weeks ago. Still, this market is within our trading envelope which spans between 18827 and 20185.
INTERMEDIATE-TERM OUTLOOK
YEARLY MOMENTUM MODEL INDICATOR
Our Momentum Models are declining at this time with the previous high made 2020 while the last low formed on 2022. However, this market has rallied in price with the last cyclical high formed on 2020 and thus we have a divergence warning that this market is starting to run out of strength on the upside.
After closing above last year's low of 16733 when it was an outside reversal to the downside yet it did close lower. This immediate year, the market did open higher, thus far, but this market has rallied exceeding last year's high. and remains below last year's high of 20788. This market is still above the normal trading yearly envelope where the top remains at 17906. The last Breakout Mode indicator took place in during 2003.
Critical support still underlies this market at 18708 and a break of that level on a monthly closing basis would warn that a sustainable decline ahead becomes possible. Immediately, the market is trading within last month's trading range in a neutral position.
DiscoverGold Gold CoT: Peek Into Future Through Futures, How Hedge Funds Are Positioned
By: Hedgopia | September 16, 2023
• Following futures positions of non-commercials are as of September 5, 2023.
Gold: Currently net long 123.9k, down 14.1k.

Gold bugs were not in a mood to lose the 200-day, which at $1,929 also coincides with crucial horizontal support at $1,920s. Thursday, the metal lost the average intraday tagging $1,922 but finished above by close. When it was all said and done, it closed the week up 0.2 percent to $1,946.
Gold remains rangebound. Bulls had a tremendous opportunity in May this year to stage a major breakout, but gold headed lower as soon as $2,085 was ticked on the 4th. In the past, $2,089 was tagged in August 2020 – an all-time high – and $2,079 in March 2022. Concurrently, gold bears have been unable to convincingly reclaim $1,920s.
The daily has room to rally. The 50-day is at $1,954, a takeout of which raises the odds the yellow metal rallies toward $1,980s, and subsequently toward $2,000.
Read Full Story »»»
DiscoverGold
GDX #Miners - Continuing up from that 'Wedge' B/Test as hoped for
By: Sahara | September 15, 2023
• $GDX #Miners - Continuing up from that 'Wedge' B/Test as hoped for.
Now needs to clear the Confluence of Uppr-Band 'Cup' Line & Dotted Green 50/DMA equivalent...

Read Full Story »»»
DiscoverGold
The Ord Oracle: GDX Update
By: Tim Ord | September 12, 2023
SPX Monitoring Purposes: Short SPX on 9/1/23 at 4515.77; cover short 9/5/23 at 4496.83 = gain .43%.
Gain since 12/20/22: 15.93%.
Monitoring Purposes GOLD: Long GDX on 10/9/20 at 40.78.

The bottom window is the 18-day average of the Up Down Volume percent, and the next window higher is the 18-day average of the Advance/Decline percent (both for GDX). This chart looks at the shorter timeframe, where signals can last as little as a week to as long as several months. The chart on last Thursday's report for GDX looked at the big picture, where signals last years. Currently, both indicators closed above -10 and on a buy signal, and as long both indicators remain above -10, the buy signal will continue. We also have these indicators on a 50-day average, which looks at the intermediate-term where signals can last several months. These indicator trigger buy signals when both close above "0"; currently, both are coming in near -2 range and may kick in a buy signal in the coming days.
Tim Ord,
Editor
Read Full Story »»»
DiscoverGold
Gold Mining Stock Newmont Corporation (NEM) Looks Dull for September
By: Schaeffer's Investment Research | September 11, 2023
• There's a lot of optimism that could unwind and weigh on Newmont Mining stock
• NEM is already down more than 17% in 2023
Gold was at the mercy of the greenback's strength and Treasury yields last week, culminating in a 1.2% loss for the yellow metal. Mining stock Newmont Corporation (NYSE:NEM) has been struggling, too, down 17.5% so far in 2023. It could be a long road back for NEM, especially amid a historically bearish month.

According to data from Schaeffer's Senior Quantitative Analyst Rocky White, Newmont stock is among the worst stocks on the S&P 500 Index (SPX) to own this month, looking back 10 years. Per White's Data, NEM averages a loss of 5% in September in the last decade, and finished the month lower eight times. Keep an eye on the equity's 30-day moving average as well, which capped off a bounce off 2023 lows in late August and could continue acting as pressure in September.
The brokerage bunch leans bullish, suggesting there is ample room for price-target cuts and/or downgrades moving forward. Of the 16 analysts in coverage, 10 sport a "buy" or better rating. Plus, the 12-month consensus price target of $54.25 is a 39.7% premium to current levels.
At the International Securities Exchange (ISE), Cboe Options Exchange (CBOE), and NASDAQ OMX PHLX (PHLX), the stock sports a 50-day call/put volume ratio of 4.61, which ranks higher than all but 4% of readings from the past 12 months. Should this optimism begin to unwind, NEM could sink even lower.
Now looks like the ideal time to speculate on NEM's next moves with premiums, which are affordably priced. This is per the equity's Schaeffer's Volatility Index (SVI) of 27% that ranks higher than just 15% of readings from the last 12 months, implying low volatility expectations.
Read Full Story »»»
DiscoverGold
$GDX $GDXJ $SIL $SILJ #Miners - Shows the Spprt-Bands that if lost could be quite disastrous
By: Sahara | September 11, 2023
• $GDX $GDXJ $SIL $SILJ #Miners - Shows the Spprt-Bands that if lost could be quite disastrous.


Read Full Story »»»
DiscoverGold
GDX #Miners - Looking for a turn form that B/Test. Otherwise it will hunt for a new low...
By: Sahara | September 11, 2023
• $GDX #Miners - Looking for a turn form that B/Test.
Otherwise it will hunt for a new low...

Read Full Story »»»
DiscoverGold
Gold CoT: Peek Into Future Through Futures, How Hedge Funds Are Positioned
By: Hedgopia | September 9, 2023
• Following futures positions of non-commercials are as of September 5, 2023.
Gold: Currently net long 138k, up 14.7k.

Gold remains rangebound.
Gold bugs had a tremendous opportunity in May this year to stage a major breakout, but the metal headed lower as soon as $2,085 was ticked on the 4th. In the past, $2,089 was tagged in August 2020 – an all-time high – and $2,079 in March 2022.
Concurrently, the bears have been unable to convincingly reclaim $1,920s.
This week, the 50-day ($1,952) was lost on Wednesday, and Friday’s attempts to recapture the average was denied. Odds favor a test of the 200-day at $1,925 in the sessions ahead. Gold closed out the week at $1,943/ounce.
Read Full Story »»»
DiscoverGold
NY Gold Futures »» Weekly Summary Analysis
By: Marty Armstrong | September 9, 2023
NY Gold Futures closed today at 19427 and is trading up about 6.37% for the year from last year's settlement of 18262. Up to now, this market has been rising for 2 months going into September reflecting that this has been only still, a bullish reactionary trend.
Up to now, we still have only a 2 month reaction rally from the low established during June. We must exceed the 3 month mark in order to imply that a trend is developing.
ECONOMIC CONFIDENCE MODEL CORRELATION
Here in NY Gold Futures, we do find that this particular market has correlated with our Economic Confidence Model in the past. The Last turning point on the ECM cycle low to line up with this market was 2022 and 2015. The Last turning point on the ECM cycle high to line up with this market was 2020 and 2011 and 1996.
MARKET OVERVIEW
NEAR-TERM OUTLOOK
The historical perspective in the NY Gold Futures included a rally from 1999 moving into a major high for 2020, from which the market has been in a bearish trend since then moving into the low in 2022 forming a reactionary trend of 2 years bottoming at 16183. Even so, we have not elected any Yearly Bearish Reversal to date from the turning point of 2020, which tends to warn that the 2020 high could still be challenged until we elect a Yearly Bearish Reversal. Notwithstanding, 2022 was, in fact, an outside reversal to the downside closing lower than the previous year. Even so, we have elected all four intermediate Yearly Bullish Reversals to date from the turning point of 2022 from this 2022 reaction low.
Curiously, the market has been only consolidating since that 2022 low and has been unable to exceed the high of that year while holding the low. The last Yearly Reversal to be elected was a Bullish at the close of 2022.
This market remains in a positive position on the weekly to yearly levels of our indicating models. Nevertheless, it closed last year on the weak side down from 2021. Pay attention to the Monthly level for any serious change in long-term trend ahead.
From a perspective using the indicating ranges on the Daily level in the NY Gold Futures, this market remains moderately bearish position at this time with the overhead resistance beginning at 19506 and support forming below at 19332. The market is trading closer to the resistance level at this time.
On the weekly level, the last important high was established the week of July 31st at 20109, which was up 5 weeks from the low made back during the week of June 26th. We have been generally trading down for the past week, which has been a very dramatic move of 2.030% in a stark panic type decline.
Looking at this from a broader perspective, this last rally into the week of August 28th reaching 19802 failed to exceed the previous high of 20109 made back during the week of July 31st. That rally amounted to only one week. Right now, the market is neutral on our weekly Momentum Models warning we have overhead resistance forming and support in the general vacinity of 19142. Resistance is to be found starting at 19545.
INTERMEDIATE-TERM OUTLOOK
YEARLY MOMENTUM MODEL INDICATOR
Our Momentum Models are declining at this time with the previous high made 2020 while the last low formed on 2022. However, this market has rallied in price with the last cyclical high formed on 2020 and thus we have a divergence warning that this market is starting to run out of strength on the upside.
After closing above last year's low of 16733.
Critical support still underlies this market at 18708 and a break of that level on a monthly closing basis would warn that a sustainable decline ahead becomes possible. Immediately, the market is trading within last month's trading range in a neutral position.
DiscoverGold Jack Chan: Gold Price Exclusive Update
By: Jack Chan | September 9, 2023
Our proprietary cycle indicator is DOWN.
To public readers of our updates, our cycle indicator is one of the most effective timing tool for traders and investors. It is not perfect, because periodically the market can be more volatile and can result in short term whipsaws. But overall, the cycle indicator provides us with a clear direction how we should be speculating.
Investors
Accumulate positions during an up cycle and hold for the long term.
Traders
Enter the market at cycle bottoms and exit at cycle tops for short term profits.
GLD is on short term buy signal.
GDX is on short term buy signal.
XGD.to is on short term buy signal.
GDXJ is on short term buy signal.
Analysis
Current data is unclear.

Our ratio is on a buy signal.

Trend is UP for USD.
Trend is DOWN for gold stocks.
Trend is DOWN for gold.
Big picture remains bullish.
Summary
Gold sector cycle is down.
Trend is up for USD and down for gold and gold stocks.
COT data is not helpful at this point.
$$$ We are partially invested and waiting for the next cycle bottom.
Read Full Story »»»
DiscoverGold
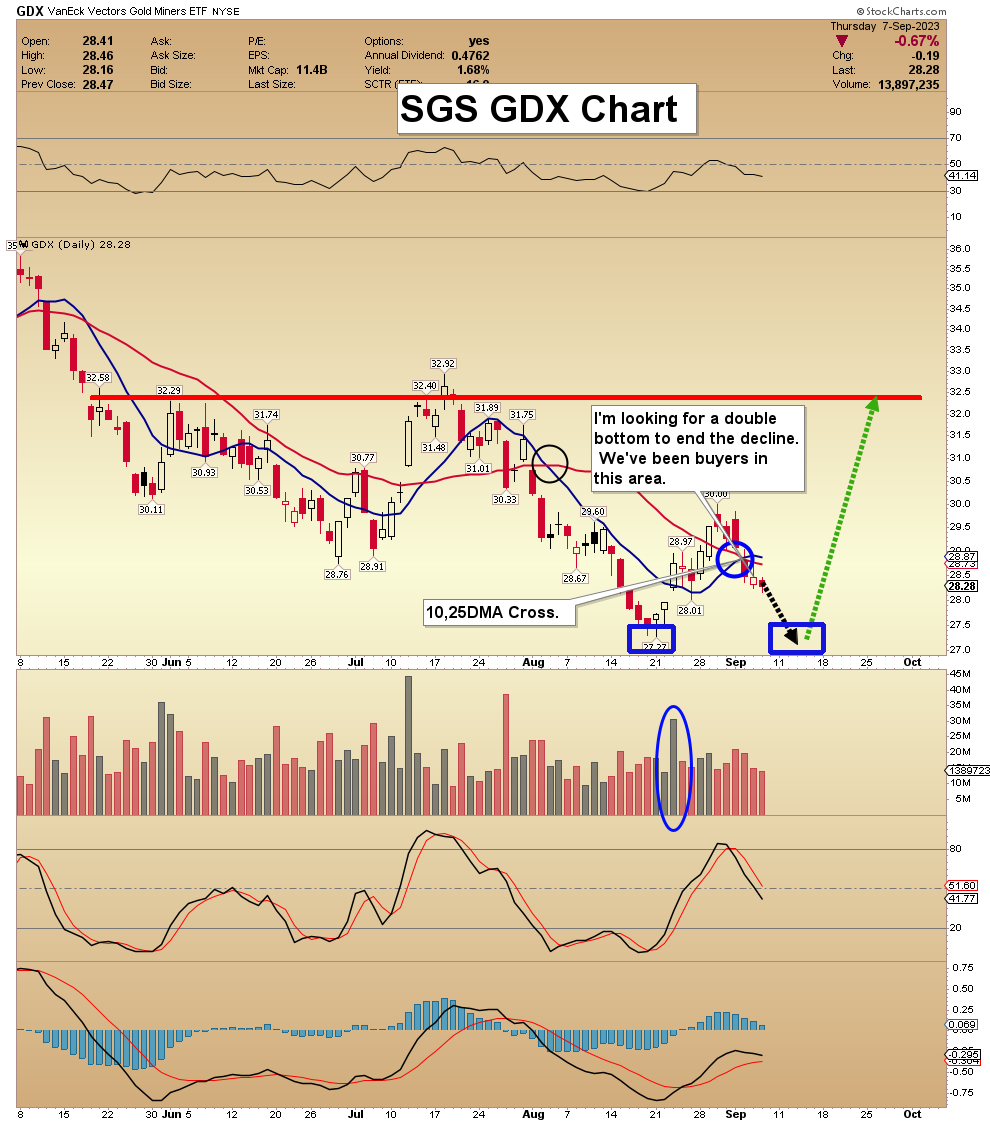
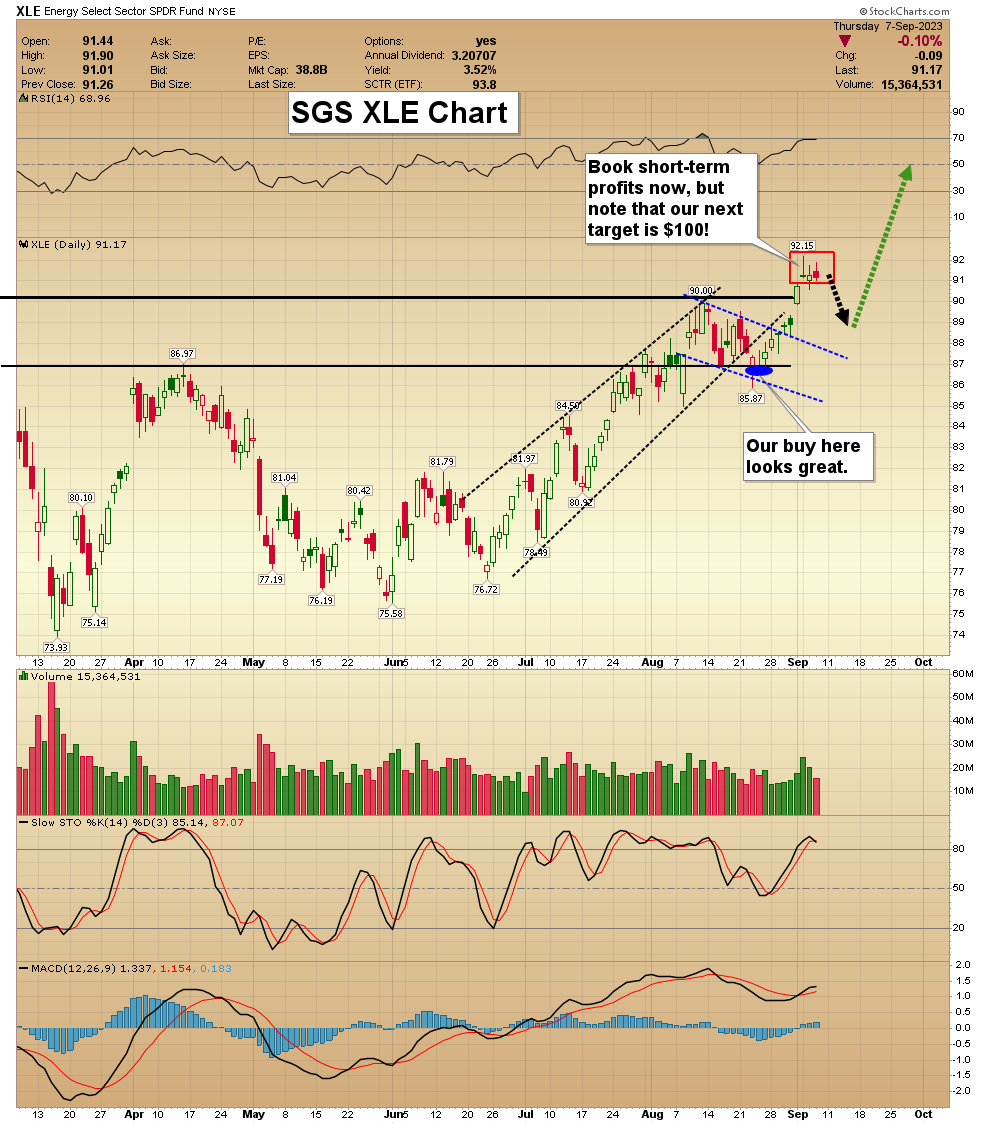
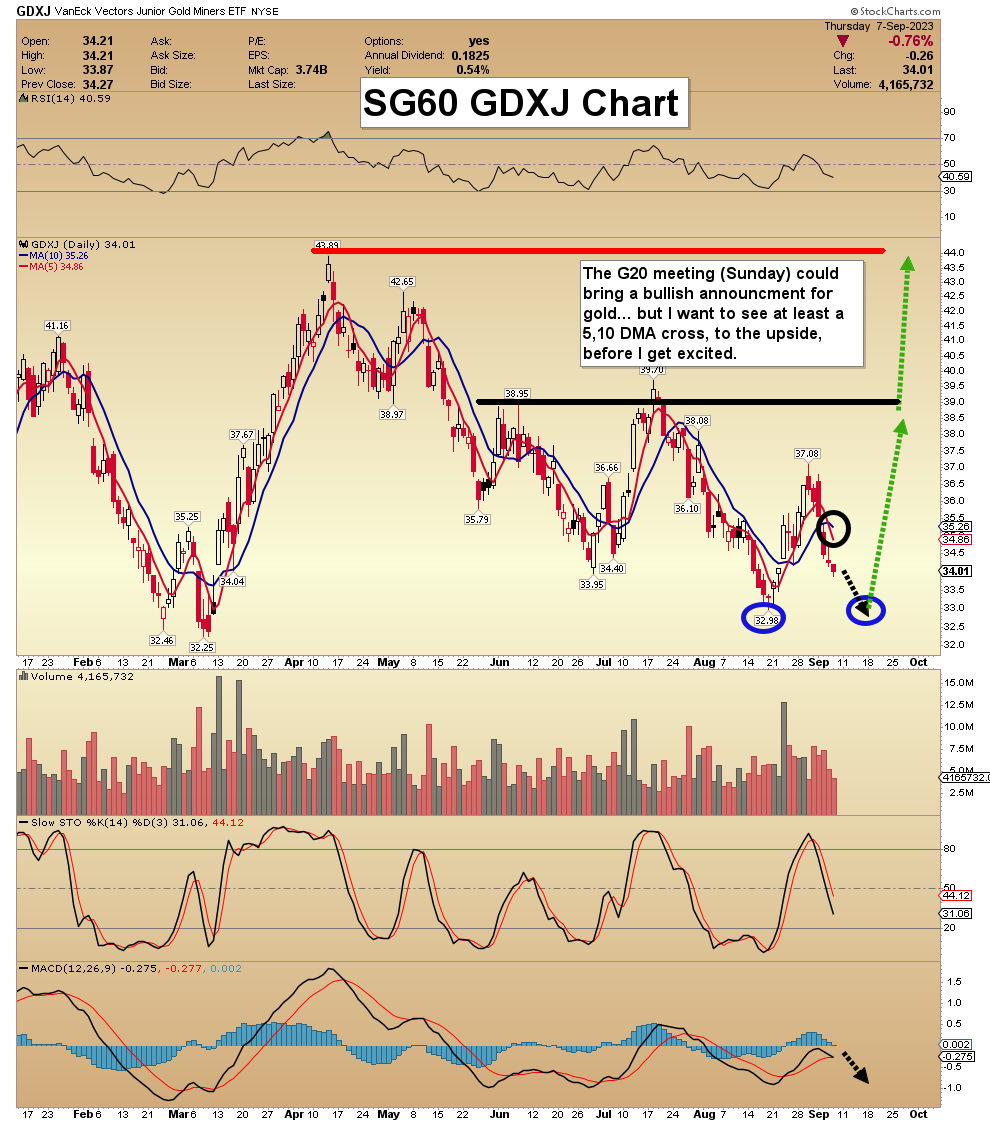
A Double Bottom For The Miners?
By: Morris Hubbartt | September 8, 2023
Here are today's videos and charts. The videos are viewable on mobile phones as well as computers. Double-click to enlarge the charts.
SGS Key Charts, Signals, & Video Analysis
Super Force Signals (SFS) is being rebranded as Super Gold Signals (SGS at https://supergoldsignals.com), to reflect the growing global importance of gold.
SG60 Key Charts, Signals, & Video Analysis
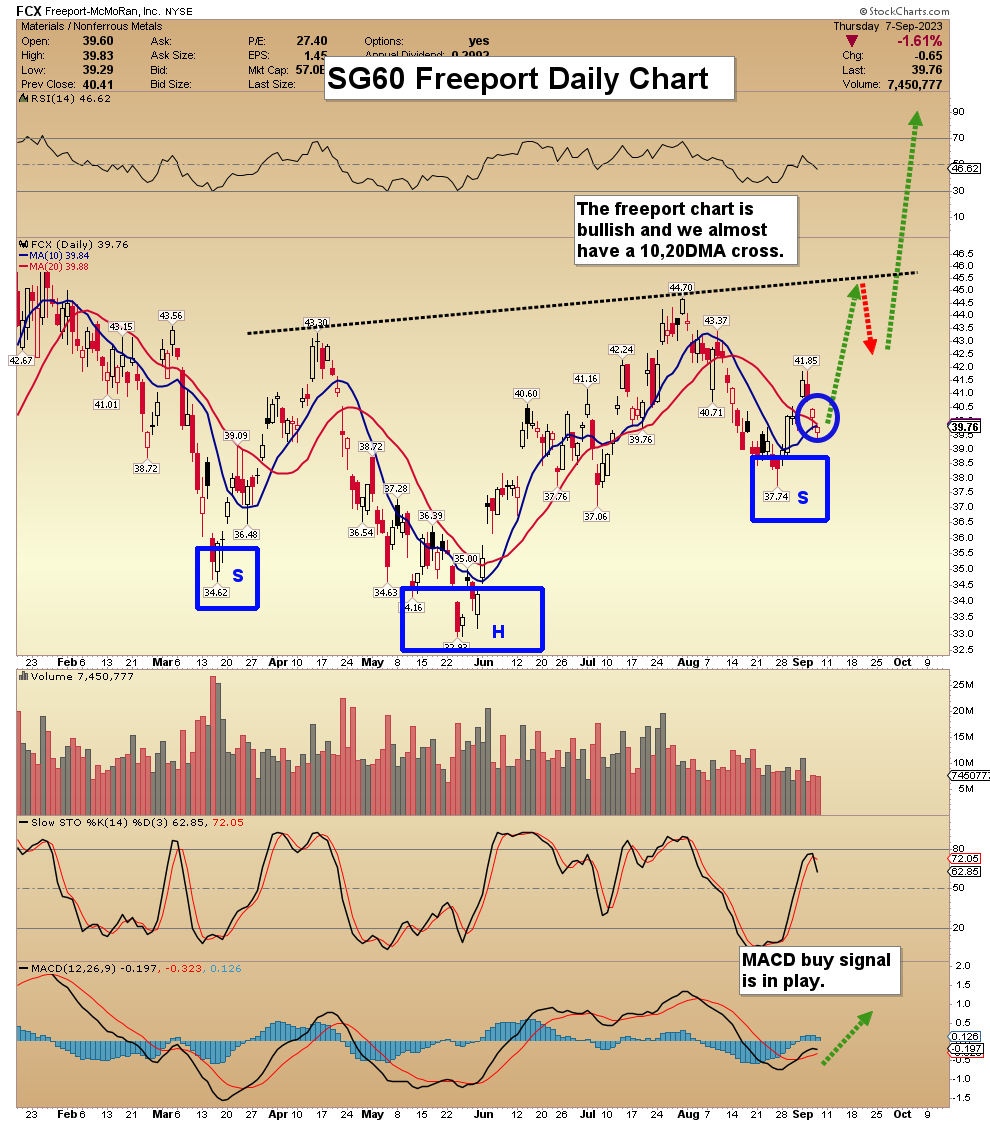
My SG60 service is ideal for investors who like a nice mix of stoploss trades and core positions. We’re on a nice roll right now in the oil market, but our big focus is of course gold and silver! The SG60 subscription is just $229 per year, and I have a special offer this week, of $199 for 14 months. If you want the offer, please click this link or send me an email. Thank-you!
SGT Key Charts, Signals, & Video Analysis
SGJ Key Charts, Signals, & Video Analysis
Read Full Story »»»
DiscoverGold
Gold Stocks Still in Game
By: Adam Hamilton | September 8, 2023
The gold miners’ stocks just entered the autumn market busy season on the wrong foot, selling off as traders returned from summer’s last long weekend. That has fortified the bearish sentiment this sector suffered in recent months. With football on the mind, gold stocks’ back-and-forth action reminds me of plenty of big games. While a key drive to new upleg highs was fumbled, gold stocks are still in the game.
For many Americans, autumn is synonymous with football season which has been a major focus for my household lately. Our seventh-grade son is thriving in a tough competitive football league, getting lots of tackles as a defensive end. His team plays every Saturday evening, and the games have been really intense and exciting. Practices run two hours three days a week, down from six days in the preseason!
Sports commitments are nothing new for my family, both our kids have competed in high-level competitive basketball for years including championship games. But the passion surrounding football is something else, bringing back lots of memories for me playing in high school. We live outside of Denver as well, and the excitement over the Broncos this season with a new experienced winning head coach is just electric!
I also went to college at the University of Colorado Boulder back in the mid-1990s when the Buffaloes were great. They haven’t been for a long time, but that may be changing with Deion Sanders at the helm. This past Saturday’s incredible upset victory Coach Prime and his quarterback son engineered against TCU was epic! The Buffs’ potential this season looks awesome, and people here are proudly flying CU’s colors.
Gold stocks are kind of like a stumbling home team for contrarians. They’ve greatly multiplied our capital with many past victories, but they’ve been sucking wind this past summer. The dominant GDX gold-stock ETF rallied 63.9% higher in 6.5 months into mid-April, a powerful upleg. But following such a strong offensive drive, the gold miners switched to defense. They needed a healthy pullback to rebalance sentiment.
That ran 18.9% over the next 2.8 months into early July, which eradicated the excessive herd greed seen at that upleg interim high. The gold stocks were ready to take the ball again, blasting up 12.3% in less than a couple weeks into mid-July! The momentum behind that drive was strong, with GDX achieving a major technical breakout above its 50-day moving average that all but guaranteed it was heading much higher.
In football, turnovers are some of the most thrilling or crushing events. A fumble or interception at the right or wrong time can really change a game’s momentum. I played as a defensive tackle, and was blessed with some key fumble recoveries. My son the defensive end is really gunning for interceptions on short passes, which he prizes more than sacking quarterbacks. Possession changes really alter psychology.
Gold stocks are ultimately leveraged plays on the metal they mine, as its price trends greatly impact their profitability. Gold surged into mid-July as well, then consolidated high near $1,975 even as the Fed hiked rates for the eleventh time in this monster cycle. But after closing at $1,974 that day with GDX still near $31.75, a freak turnover happened the next morning. The football was stripped right out of gold’s hands!
On July 27th, the initial read on US Q2 GDP proved a shocking upside surprise. Expected to come in at 1.8% annualized growth, the US government claimed the actual was +2.4%! Unlike monthly US jobs, the GDP reports usually don’t deviate much from expectations. So that extraordinary beat was Fed-hawkish, implying the US economy may be overheating so the Fed will have to hold interest rates higher for longer.
That GDP-surprise forced fumble slammed gold 1.5% lower, crushing sentiment so violently that GDX plunged an ugly 4.1%! That unlikely turnover when gold and its miners’ stocks were early in a strong drive to new upleg highs really altered psychology. Nascent bullishness and confidence for more upside quickly reversed into widespread bearishness and resignation. That felt kind of big-turnover football-like too.
That one outlying GDP report led traders in currencies, gold futures, and the stock markets to interpret the subsequent weeks’ economic data more-Fed-hawkishly. Remarkably mostly in the first half of August, gold suffered an exceedingly-unusual stretch where 13 of 14 trading days clocked in at losses! The gold stocks just wilted on that, fueling serious selling which prematurely truncated this sector’s next surge higher.
When a football team’s drive is killed by a fumble or interception, sometimes the players start giving up mentally. Like traders, they extrapolate that misfortune extending into the immediate future. Their hopes for victory quickly collapse to surrender to losing. One of the most-important jobs for coaches during games is to keep up players’ spirits after setbacks. Putting that broken play into perspective is a big part of that.
After GDX’s 50dma breakout in mid-July technically confirmed this sector’s powerful upleg had resumed, I sure wasn’t expecting it to quickly fail. It was like a defensive lineman stripping the football from a running back, stopping cold a good drive. But despite that and the selling since that was ignited by the resulting bearish psychology, gold stocks are still in the game. They are behind like CU against TCU, but not out.
This first chart looks at gold stocks’ summer price action during all modern gold-bull years. Each of these is individually indexed to the older HUI gold-stock index’s final May close leading into market summers. I explained the methodology behind this seasonal chart in much more depth in my early-June essay on gold’s summer doldrums. Gold and therefore gold stocks tend to drift sideways on balance during summers.
The miners usually meander in a summer range running 10% either way from May’s close, and that’s exactly what happened recently. Despite that suspect Q2 GDP beat stripping away gold’s football, the gold stocks still mostly stayed in their normal center-mass-drift summer trend. At best in mid-July before that key turnover, GDX was up a solid 5.6% summer-to-date. And it exited August down 5.4% on the summer.
That’s not great, well behind where gold stocks should be with their seasonal autumn rally that amplifies gold’s own gathering steam in August. On average during these modern gold-bull years of 2001 to 2012 and 2016 to 2022, the major gold stocks of both the HUI and GDX left August climbing 3.9% across the whole summer. This week that underperformance widened, leaving gold stocks about 13.5% behind their mean.
That’s considerable, but not worth totally capitulating on this sector for. Like football, gold stocks move fast. This volatile sector can easily soar 15%+ in just a week or two when gold decisively bounces. In merely a couple drives, gold stocks could blast back up above their autumn-rally seasonal-average gains this time of year. That’s just a touchdown or two behind where the gold stocks would’ve been without that fumble.
Ever since our son was old enough to throw balls, he has loved sports. So he has played football and basketball for the majority of his young life. While I haven’t coached his teams, I’ve volunteered in other roles to stay close to the action. With kids there’s nothing more devastating for morale mid-game than a pick six, when a defender intercepts your quarterback’s pass then runs it straight back for a touchdown!
* * *
Read Full Story »»»
DiscoverGold
Gold CoT: Peek Into Future Through Futures, How Hedge Funds Are Positioned
By: Hedgopia | September 3, 2023
• Following futures positions of non-commercials are as of August 29, 2023.
Gold: Currently net long 123.3k, up 21.3k.

After two weeks of intraweek drops to $1,914, gold rallied 1.6 percent this week to $1,967/ounce. In essence, support at $1,920s was defended. And, after five weeks of reducing their net longs in gold futures, non-commercials added this week.
Despite this week’s action, gold bugs remain on the defensive. They had a tremendous opportunity in May to break out, but the yellow metal headed lower after ticking $2,085 on the 4th. In the past, $2,089 was tagged in August 2020 – an all-time high – and $2,079 in March 2022.
Read Full Story »»»
DiscoverGold
gold should be at 33k right now, back in 1980 the Dow/gold ratio was Zero. the environment is much worse now, much higher debt to GDP, gold actually go to 50k. soon people, soon.
NY Gold Futures »» Weekly Summary Analysis
By: Marty Armstrong | September 2, 2023
NY Gold Futures closed today at 19671 and is trading up about 7.71% for the year from last year's settlement of 18262. Immediately, this market has been rising for 2 months going into September reflecting that this has been only still, a bullish reactionary trend.
Up to now, we still have only a 2 month reaction rally from the low established during June. We must exceed the 3 month mark in order to imply that a trend is developing.
ECONOMIC CONFIDENCE MODEL CORRELATION
Here in NY Gold Futures, we do find that this particular market has correlated with our Economic Confidence Model in the past. The Last turning point on the ECM cycle low to line up with this market was 2022 and 2015. The Last turning point on the ECM cycle high to line up with this market was 2020 and 2011 and 1996.
MARKET OVERVIEW
NEAR-TERM OUTLOOK
The historical perspective in the NY Gold Futures included a rally from 1999 moving into a major high for 2020, from which the market has been in a bearish trend since then moving into the low in 2022 forming a reactionary trend of 2 years bottoming at 16183. Distinctly, we have not elected any Yearly Bearish Reversal to date from the turning point of 2020, which tends to warn that the 2020 high could still be challenged until we elect a Yearly Bearish Reversal. Notwithstanding, 2022 was, in fact, an outside reversal to the downside closing lower than the previous year. Distinctly, we have elected all four intermediate Yearly Bullish Reversals to date from the turning point of 2022 from this 2022 reaction low.
Curiously, the market has been only consolidating since that 2022 low and has been unable to exceed the high of that year while holding the low. The last Yearly Reversal to be elected was a Bullish at the close of 2022.
This market remains in a positive position on the weekly to yearly levels of our indicating models. Nevertheless, it closed last year on the weak side down from 2021. Pay attention to the Monthly level for any serious change in long-term trend ahead.
The perspective using the indicating ranges on the Daily level in the NY Gold Futures, this market remains moderately bullish currently with underlying support beginning at 19665 and overhead resistance forming above at 19826. The market is trading closer to the support level at this time. An opening above this level in the next session will imply a decline is unfolding.
On the weekly level, the last important low was established the week of June 26th at 19006, which was down 8 weeks from the high made back during the week of May 1st. We have been generally trading up for the past week from the low of the week of August 21st, which has been a move of .0341%.
INTERMEDIATE-TERM OUTLOOK
YEARLY MOMENTUM MODEL INDICATOR
Our Momentum Models are declining at this time with the previous high made 2020 while the last low formed on 2022. However, this market has rallied in price with the last cyclical high formed on 2020 and thus we have a divergence warning that this market is starting to run out of strength on the upside.
After closing above last year's low of 16733.
Critical support still underlies this market at 18708 and a break of that level on a monthly closing basis would warn that a sustainable decline ahead becomes possible. Immediately, the market is trading within last month's trading range in a neutral position.
DiscoverGold US Jobs Report: Gold Stocks Look Good
By: Morris Hubbartt | September 1, 2023
Here are today's videos and charts. The videos are viewable on mobile phones as well as computers. Double-click to enlarge the charts.
SGS Key Charts, Signals, & Video Analysis
Super Force Signals (SFS) is being rebranded as Super Gold Signals (SGS at https://supergoldsignals.com), to reflect the growing global importance of gold.
SG60 Key Charts, Signals, & Video Analysis
SGT Key Charts, Signals, & Video Analysis
Will the gold stocks and silver put in the powerful follow through I want to see? That would turn the morning star formations candlesticks into serous launchpads. At my Super Gold Trader newsletter traders make plays on leveraged ETFs like JNUG, AGQ, and also some individual stocks. Stoplosses on every trade keep drawdowns in check. At $499/year, subs love the action, and I have a half price $249/14months special offer this week! If you want the offer, please send me an email or click this link and I’ll make it happen. Thanks!
SGJ Key Charts, Signals, & Video Analysis

Read Full Story »»»
DiscoverGold
Gold Could Explode Higher as Traders Built Massive Short Position: 6 Stocks to Buy Now for the Short-Squeeze
By: 24/7 Wall St. | August 31, 2023
Agnico Eagle Mines
This is one of Wall Street’s most preferred North American gold producers. Agnico Eagle Mines Ltd. (NYSE: AEM) is a senior Canadian gold-mining company that has produced precious metals since 1957. It has declared a cash dividend every year since 1983.
Its eight mines are located in Canada, Finland and Mexico, with exploration and development activities in each of these regions, as well as in the United States and Sweden. The company and its shareholders have full exposure to gold prices due to its long-standing policy of no forward gold sales. The stock backed up as gold has sold off March highs and with continued, albeit lower inflation you can bet many savvy portfolio managers are ready to add back top companies like this.
Shareholders receive a 3.26% dividend. The BofA Securities price target for Agnico Eagle Mines stock is $65. The consensus is higher at $66.39, but shares ended Wednesday trading at $49.14 apiece.
Barrick Gold
This is another top company in the sector, and its stock still offers a very solid entry point. Barrick Gold Corp. (NYSE: GOLD) and Randgold Resources completed their merger on January 1, 2019. This created the world’s largest gold company in terms of production, reserves and market capitalization.
Barrick holds a 50% interest in the Veladero mine located in the San Juan Province of Argentina; 50% interest in the KCGM, a gold mine located in Australia; 95% interest in Porgera, a gold mine located in Papua New Guinea; 50% interest in the Zaldavar, a copper mine located in Chile; and 50% interest in the Jabal Sayid, a copper mine located in Saudi Arabia.
The company also owns gold mines and exploration properties in Africa and gold projects located in South and North America, and it has a strategic cooperation agreement with Shandong Gold Group.
Investors receive a 2.75% dividend. BofA Securities has a $22 price target, and Barrick Gold stock has a consensus target of $23.16. Wednesday’s closing share price was $16.35.
B2Gold
This is a small-cap gold stock for investors who are more aggressive and looking for sector exposure. B2Gold Corp. (NYSE: BTG) is a global, growth-oriented mid-tier gold producer whose primary assets include gold mines located in Nicaragua (La Libertad and El Limon), the Philippines (Masbate), Namibia (Otjikoto) and Mali (Fekola).
During the third quarter, the company recorded consolidated gold production of 295,723 ounces, up 19% year over year on solid performance across three of its operating mines. B2Gold increased throughput at the Fekola mill and completed the significant waste stripping campaigns at both Fekola and Otjikoto mines. The Fekola and Otjikoto mines achieved record quarterly gold production in the third quarter of 2021.
B2Gold stock comes with a 5.18% dividend. BofA Securities has set its price target at $4.80. The consensus target is $4.83, and Wednesday’s close was at $3.10.
Franco-Nevada
This off-the-radar play offers numerous ways for investors to make money. Franco-Nevada Corp. (NYSE: FNV) operates as a gold-focused royalty and streaming company in North America, Latin America and elsewhere. The company manages its portfolio with a focus on precious metals, such as gold, silver and platinum group metals, and it also engages in the sale of crude oil, natural gas and natural gas liquids.
While the company is one of the leading gold-focused royalty and streaming companies with the largest and most diversified portfolio of cash-flow producing assets, its business model provides investors with gold price and exploration optionality while limiting exposure to cost inflation. Those are traits that some of the others do not offer.
The dividend yield is just 0.96%. The $170 BofA Securities target compares with a consensus target of $158.80 and the $144.26 close for Franco-Nevada stock on Wednesday.
Newmont
This is one of the largest mining companies and a solid buy for investors who are more conservative. Newmont Corp. (NYSE: NEM) is engaged in the production of gold.
Its North America segment consists primarily of Carlin, Phoenix, Twin Creeks and Long Canyon in Nevada and Cripple Creek and Victor in Colorado. The South America segment consists primarily of Yanacocha in Peru and Merian in Suriname. The Australia segment consists primarily of Boddington, Tanami and Kalgoorlie in Australia. The Africa segment consists primarily of Ahafo and Akyem in Ghana.
Newmont stock investors receive a 4.10% dividend. The BofA Securities price objective of $55 is less than the $76.95 consensus target, but shares closed on Wednesday at $39.76.
Wheaton Precious Metals
This precious metals royalty stock makes good sense for more conservative investors looking for exposure to the sector. Wheaton Precious Metals Corp. (NYSE: WPM) is a Canadian precious metals streaming company with approximately 60% of its revenues from the sale of silver and 40% from gold.
Under the terms of long-term contracts, the company purchases silver and gold from a variety of mines, including Goldcorp’s Penasquito mine in Mexico, Vale’s Salobo mine in Brazil, the Lundin Mining Zinkgruvan mine in Sweden, and Glencore’s Antamina and Yauliyacu mines in Peru, and then sells the silver and gold into the open market.
Shareholders receive a 1.37% dividend. Wheaton Precious Metals stock has a $53 price target at BofA Securities. The consensus target is $55.97. The stock closed on Wednesday at $43.78.
The SPDR Gold Trust (NYSE: GLD) exchange-traded fund is perhaps one of the best pure plays on gold for investors. The trust that is the sponsor of the fund holds physical gold bullion as well as some cash. Each share represents one-tenth of an ounce of the price of gold. Note though that the fund does not pay a dividend.
Proper asset allocation should always include at least a single-digit percentage holding of precious metals like gold and silver. Not only do they hedge inflation, but they can really help if the market does go into correction or bear market mode, as they tend to trade inverse to markets.
Read Full Story »»»
DiscoverGold
The Ord Oracle: GDX Update
By: Tim Ord | August 30, 2023
• The bottom; GDX 18 day average of the Advance/Decline %; next higher window the GDX 18 day average of the Up down volume %. When both above -10 (light blue) rally in $GDX in progress. As long as both remain above -10 the rally in GDX should continue. Another signal triggered.

Read Full Story »»»
DiscoverGold
GDX #Miners - Following the Script
By: Sahara | August 30, 2023
• $GDX #Miners - Following the Script.
Now tackling the Dotted Dark-Green Daily 50/MA Equivalent...

Read Full Story »»»
DiscoverGold
Who is ready for the Gold Rush??? Supercycle is close imo
GDX #Miners - En-Route...
By: Sahara | August 29, 2023
$GDX #Miners - En-Route... pic.twitter.com/DOysB3Azyy
— Sahara (@SaharasCharts) August 29, 2023
DiscoverGold
|
Followers
|
148
|
Posters
|
|
|
Posts (Today)
|
0
|
Posts (Total)
|
5664
|
|
Created
|
06/29/08
|
Type
|
Free
|
| Moderators DiscoverGold trunkmonk | |||

http://www.vaneck.com/index.cfm?cat=3192&tkr=GDX&LN=3-02
The Gold Miners ETF seeks to replicate as closely as possible, before fees and expenses, the price and yield performance of the NYSE Arca Gold Miners Index. The Index provides exposure to publicly traded companies worldwide involved primarily in the mining for gold, representing a diversified blend of small-, mid- and large-capitalization stocks. As such, the Fund is subject to the risks of investing in this sector.
| ||||||||||||||||||||||||||||||||||||||||||||||||||||||||||||||||||||||||||||||||||||||||||||||||||||||
| DAILY |
| WEEKLY |
| Volume | |
| Day Range: | |
| Bid Price | |
| Ask Price | |
| Last Trade Time: |


