 News
News  Market Data
  Discover

Support: 888-992-3836
Copyright © 2023 InvestorsHub Inc.


Register for free to join our community of investors and share your ideas. You will also get access to streaming quotes, interactive charts, trades, portfolio, live options flow and more tools.
I have been buying Globex GLBXF for a while, started in .90s and more in 1.00-1.05 area. Have been awaiting PQEFF tender to complete to put more it in. Well GLBXF did not wait around it is now $1.29. Fortunately have a lot, but wanted more.
They are a used mine/claim wheeler dealer. 100s of mining properties and dozens of royalties yet at a dirt cheap valuation.
Like GoldSpot they can not lose, either make money just selling claims, or if a customer hits a rich deposit Globex then gets a lot more cash and GLBX gets a royalty on it too. Big royalties, usually 3% Gross Metal not more normal 1% NSR, so no matter what type of metal it is they get paid. They started with practically nothing. Jack Stoch has run it from beginning.
Now for the first time GLBXF has a bundle of cash. $24 million last looked, and even after 30% gain the mkt cap is only $70 million. No debt and they tout how they have avoided dilution for many years. He wants to go big now that has cash.
EV/EBITDA of 2.9 and PE under 5, but check this out. UncleStock says CROIC is 627% and ROCE is 2,940% maybe the highest combo of any stock in the world. It is a fantastic business model. It has taken decades to build it up to this point where the payback comes. In video below Jack explains Globex.
Was keeping quiet to get money to buy more but being it is taking off with new highs now, decided to share it. One more thing, they do so many deals and have so many properties being drilled, that they are a constant source of real news.
The Ord Oracle: GDX Update
By: Markets & Mayhem | April 6, 2022
SPX Monitoring Purposes: Long SPX on 3/25/22 at 4543.06.
Monitoring Purposes GOLD: Long GDX on 10/9/20 at 40.78.
Long-Term SPX Monitor Purposes: Neutral.
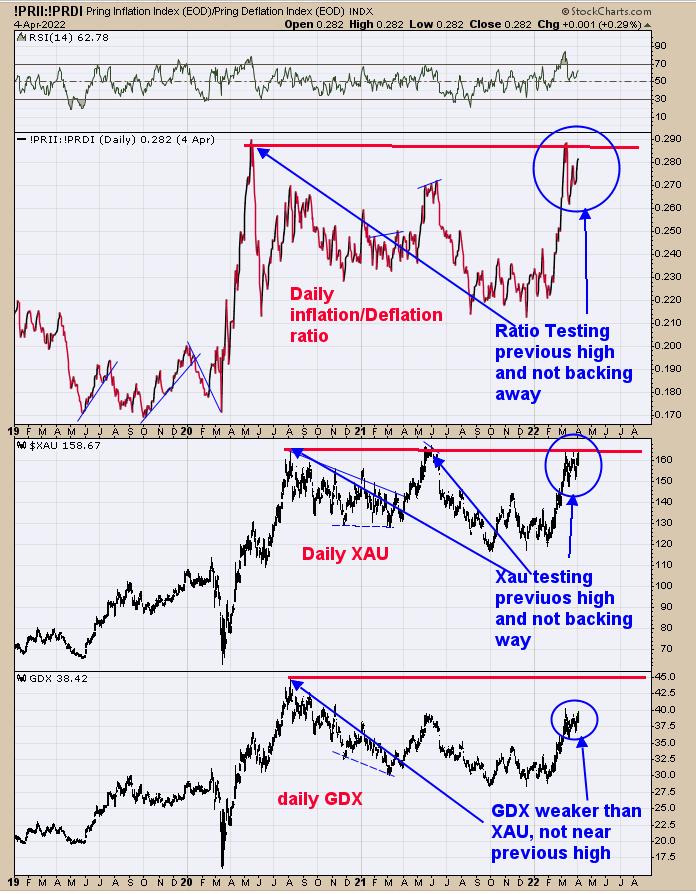
The second window down from the top is the Inflation/Deflation ratio. When this ratio is rising, it's a bullish sign for gold and gold stocks; when declining, it is a bearish sign. Right now, this ratio is testing May 2020 and not backing away from that high, suggesting this ratio is "eating through" supply and, once supply is exhausted, should move higher, taking gold and gold stocks with it. The next window down is the XAU (which is home to more of the high-tier major gold stock) and it, too, is at its previous high and not backing away, building "Cause" (energy) to push through resistance. Notice that GDX is not at its previous high (which is home to lesser-tier stocks), showing that the higher-tier stocks are leading the way higher. This happens early in the bull phase of the rally. When the lesser-tier stocks are leading the way (meaning speculation), its getting late in the bull phase. The sideways consolidation in GDX and XAU has been going on for nearly a month; time is about up for the consolidation to end and the Impulse wave to start. A clue that the impulse wave has started will be when the ratio breaks to new highs.
Tim Ord,
Editor
Read Full Story »»»
 DiscoverGold
Gold Price Forecast: Pullback Ahead – How Low?
By: Christopher Aaron | April 6, 2022
Gold may be set for a further pullback before a resumption of the bull market is ready. Traders should position for short-term weakness, yet investors should use the dip as a final buying opportunity before higher prices.
Our most significant clue that a pullback may be due for bullion itself comes from the gold mining complex. Below we show the GDX senior gold miners fund from 2020 to present:
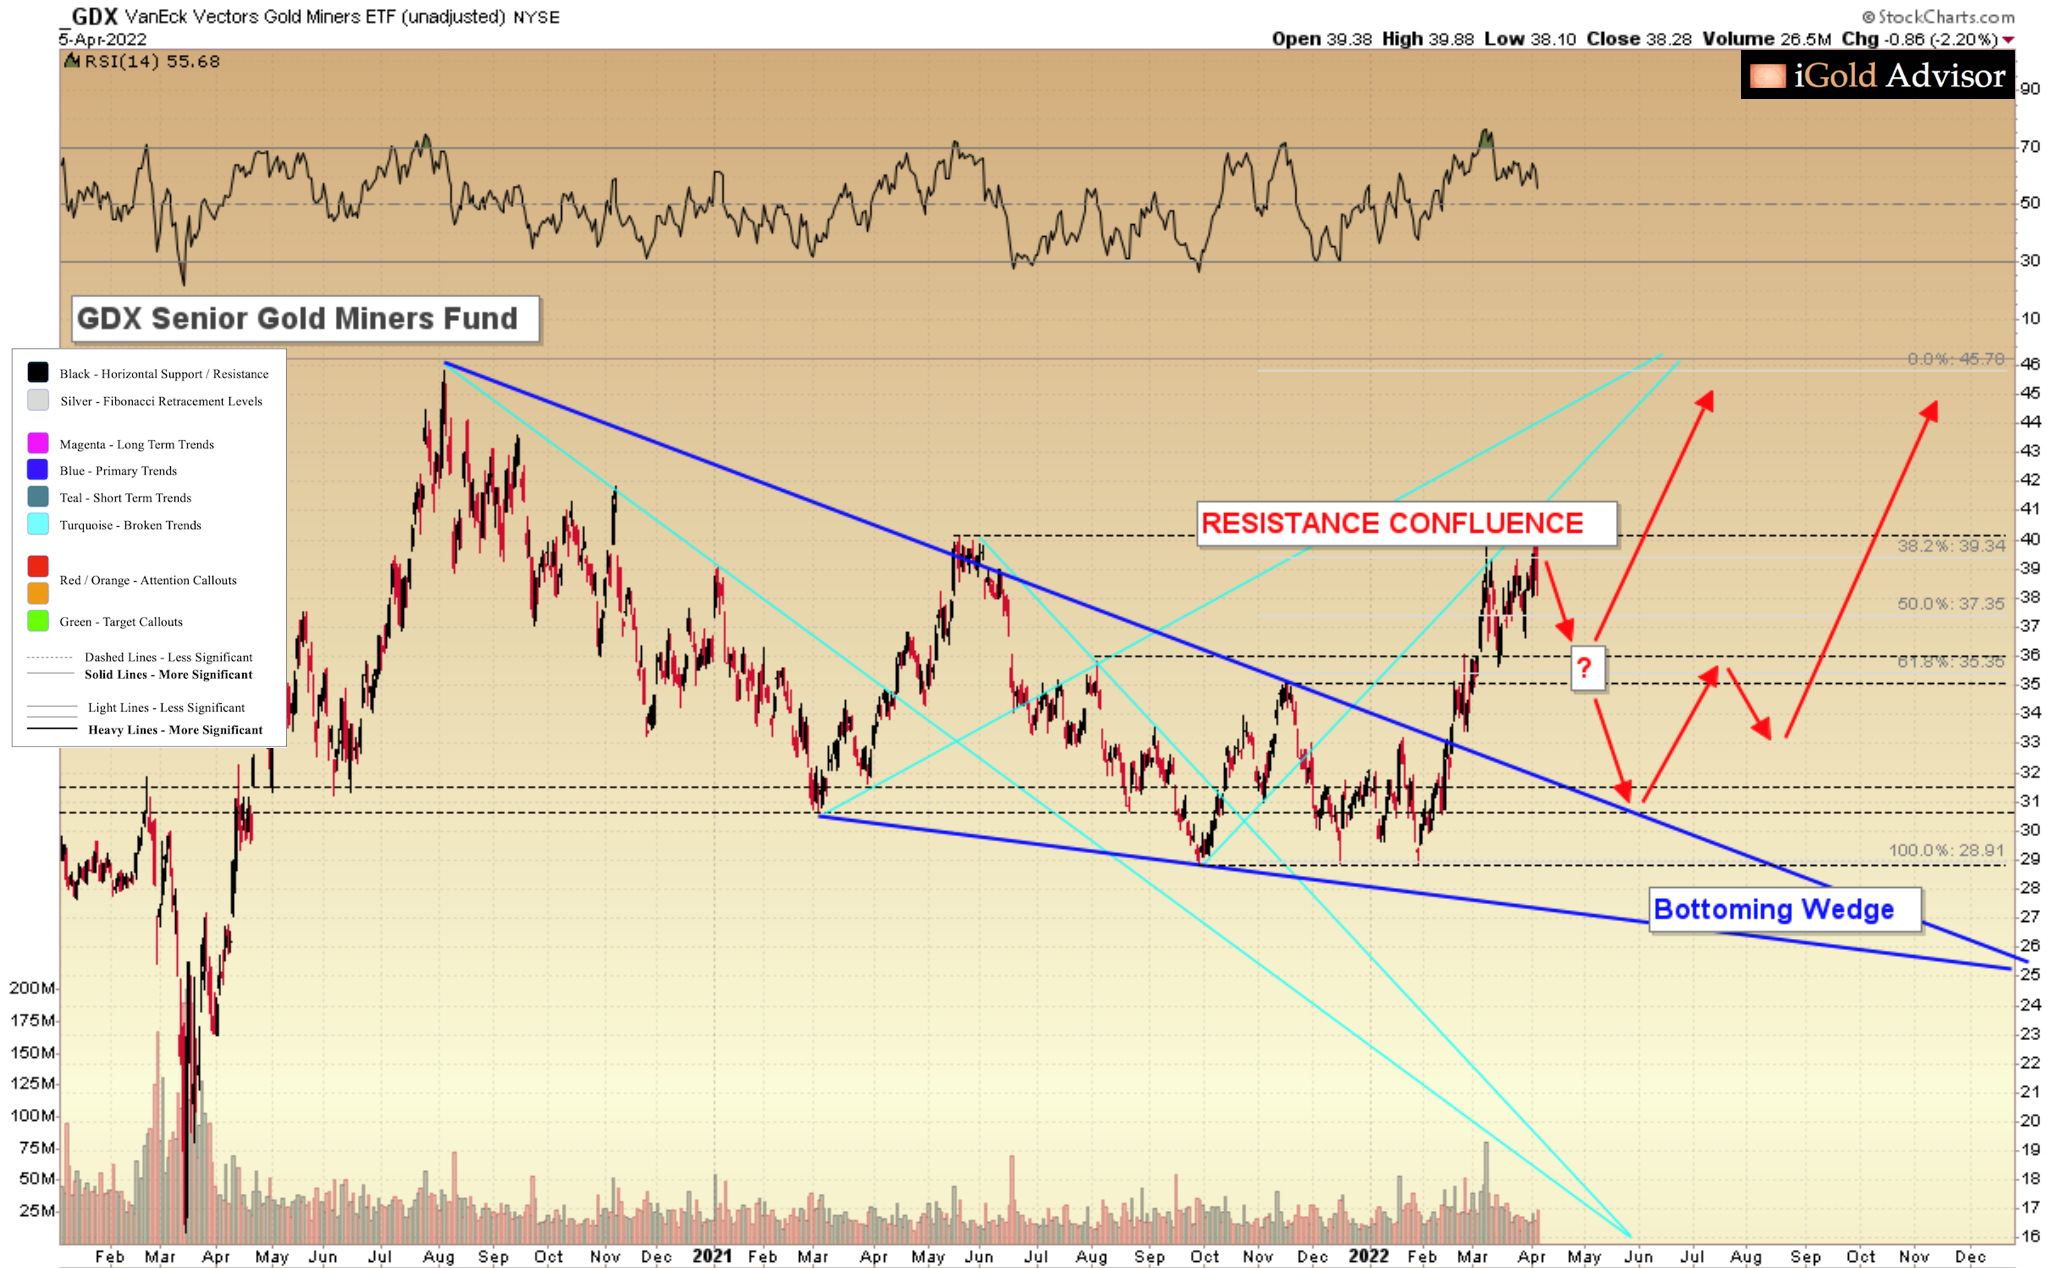
Note that the gold miners are facing a significant resistance confluence in the 40.0 region. Three separately derived but equally important resistance levels converge in this region. They are:
1. The 2021 peak for the gold miners at 40.0, achieved last May (black dashed line).
2. Broken trend support à turned resistance from the September 2021 bottom at 41.0 (turquoise line).
3. The 38.2% Fibonacci level of the entire 2020 – 2022 decline, which comes in at 39.3 (light silver line).
When three separate resistance levels all converge within 1.7 points on the chart, that zone becomes significant overhead resistance.
We thus expect that in the case of the gold mining complex, the GDX will retreat over the near-term.
How Low for the GDX?
The first moderate support level for the GDX comes in at the 35.0 level, representing broken swing peaks back from August and November 2021. Those peaks are shown above by the light black dashed lines.
It is likely that the GDX will thus retreat at least 12%, from near 40.0 down to 35.0 over the coming weeks.
However, the 35.0 level is an initial support level only.
Stronger support for the GDX exists down at 32.0, representing the former resistance of the bottoming wedge pattern that was broken higher in February (upper blue line).
Should the GDX decline all the way to 32.0, it would represent a 20% decline for the large-cap gold miners.
We will evaluate these support levels as they begin to be tested. For now, we should expect the GDX to decline toward anywhere from 35.0 to 32.0 over the coming weeks, or a 12% to 20% correction.
How Low for Gold?
The gold miners are not going to decline in a vacuum. Gold will likely be taken down further with them.
From $1,925 per ounce in the spot market as this is going to press, how low could gold fall before we see strong support emerge?
Below is the primary gold chart from 2018 through present:
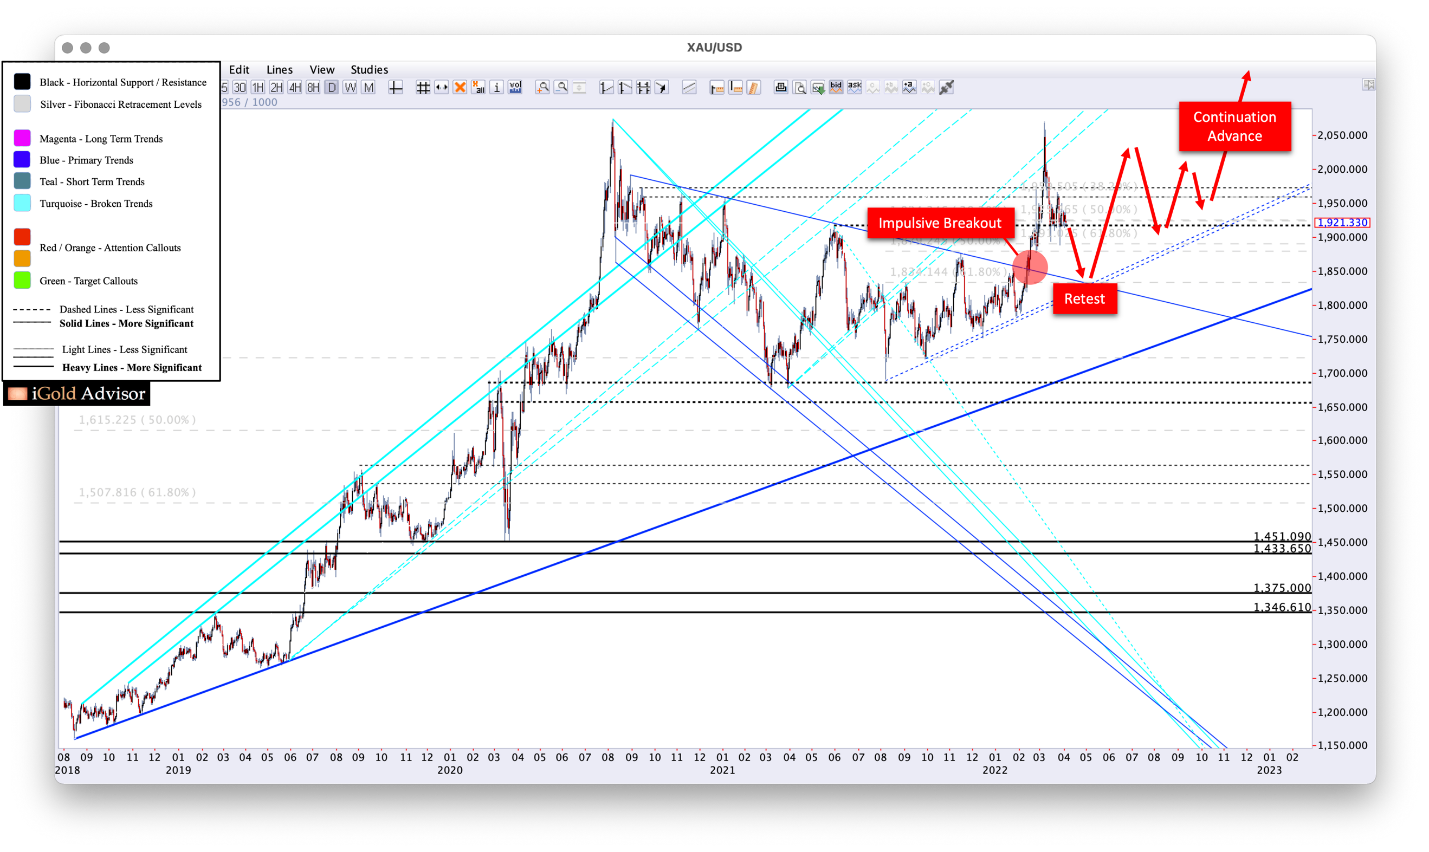
• Note the impulsive breakout from the 18-month consolidation which occurred in early February 2022 (red callout), as Russia invaded Ukraine.
• As noted in our 2018 article “What Affects the Price of Gold?” (approx. 2/3 down the article - link: https://news.gold-eagle.com/article/what-affects-price-gold/957), geopolitical-based price spikes, such as what occurred after September 11, 2001, are nearly always reversed in the months following the advance. Yet as long as the key support level holds, this two-steps-forward à almost two-steps-backward process can indeed be part of a larger trend change higher.
• In the case of gold now, the key declining breakout level was $1,850 back in early February (blue line, red callout). Since this was a slowly declining trend of resistance, a retest in the future could occur at a slightly lower level than the actual breakout point.
• Thus, if the broken 18-month consolidation were to be retested within the next several weeks, such a retest would occur as low as $1,830 - $1,840.
• After the retest, gold should then find support via emerging second-chance buyers. It should consolidate then for several months, before a continuation advance becomes the highest probability based on a subsequent fundamental trigger.
Takeaway on Gold
The GDX gold miners fund is facing clear resistance in the 40 region, which is expected to hold down the price for the time being. Any decline should be in the 12% - 20% range.
Gold should decline with the GDX. Gold’s next strong support is in the $1,830 - $1,840 range. While this would represent a complete reversal of the Russia / Ukraine premium over the last two months, as long as the support level holds, this entire process may be seen as the beginning of a new trend higher in development, similar to the price action in gold which occurred after September 11, 2001.
Those highly exposed to leveraged forms of gold may wish to initiate some defensive sales.
Yet long-term precious metals investors may have a final lucrative buying opportunity coming over the next 1 – 2 months.
Read Full Story »»»
DiscoverGold
$TM GCM Mining Toroparu Project
64 views
Apr 4, 2022
https://www.youtube.com/watch?v=fk_no3UgXPk
U.S. Mint sees strongest gold bullion demand in 23 years, sells 426k ounces in Q1
By: Neils Christensen | April 4, 2022
Rising inflation and safe-haven demand resulted in extraordinary demand for physical gold in March, capping off the best start to the year in more than two decades.
In its latest sales data, the U.S. mint reported that it sold 155,500 ounces of various denominations of its American Eagle Gold bullion coins, up 73% from last month. The U.S. Mint saw its best March performance since 1999.
March ended a solid quarter for bullion demand was. The U.S. mint sold 426,500 ounces of gold between January and March, up 3.5% from the first quarter of 2021. Similar to its monthly says, this was the mint's best quarter in 23 years.
According to analysts, two factors are driving demand for physical precious metals: inflation and Russia's war with Ukraine. Analysts are focusing a lot of attention on Europe's economy as the region faces rising consumer prices and the growing threat that Russia could weaponize its energy commodities as it faces growing sanctions against Western nations.
"People increasingly realize that high inflation is not temporary but has come to stay – and most likely get even worse, especially in Europe," said Thorsten Polleit, chief economist at Degussa, in an email statement to Kitco News. "The war in Ukraine represents a huge risk for the eurozone. For instance, if the inflow of oil and gas and coal from Russia into Europe comes to a shrieking halt, a very severe recession with mass unemployment and the collapse of various industries would be most likely."
Ole Hansen, head of commodity strategy at Saxo Bank, said that inflation had become a real threat for consumers, so it's not surprising to see investors protect their wealth and purchasing power. He added that equity volatility is prompting some investors to diversify into physical assets.
"Physical as well as investment demand remains solid for the simple reason investors (retail and professional) see inflation everywhere. While in 2021, it was something we talked about, it has now become a reality, with everyone around the world feeling the impact of surging prices on everything. With that in mind, and given the wobbly start to 2022 for equities, I see a clear link to increased demand," he said in a comment to Kitco.
Silver demand, while seeing a solid start to the year, is down compared to last year's unprecedented start. The data from the U.S. Mint shows more than 7.5 million ounces of silver were sold in the first quarter of last year, down 37% from the first quarter of 2021.
Looking at monthly sales, the U.S. Mint sold 1.08 million ounces, down 73% from last year.
Richard Weaver, president of the Accredited Precious Metals Dealers and the Professional Numismatists Guild, said that silver demand could be a lot higher, but demand is being impacted by a lack of supply.
"Bullion orders remain strong even with the lack of silver material available," he said. "Demand should remain steady for the balance of 2022, but Physical Metals could be the wildcard as we are seeing higher premiums and longer delivery times."
Bart Kitner, president of Kitco Metals Inc, also said that along with market volatility and safe-haven demand, investors were being tactical, buying gold and silver as it made a new all-time intraday high.
"The increase in sales is typical of how the demand for coins and small bars responds to high price volatility in the market," he said.
Kitner added that it's not surprising to see solid demand for silver in an environment with surging geopolitical uncertainty.
"If [the U.S. Mint] could produce more, they would," he said.
Read Full Story »»»
DiscoverGold
COT - Commitments of Traders in Metals Futures Market Reports
By: Software North | April 1, 2022
Gold

Silver

Read Full Story »»»
DiscoverGold
$GDX hasn't participated in gold's correction since the March high
By: CyclesFan | April 3, 2022
• $GDX hasn't participated in gold's correction since the March high. This week's candle is a hanging man which is potentially bearish but I don't trust candle patterns. If it breaks above the March high next week it will go higher into the 3rd week of April for its next major top.

Read Full Story »»»
DiscoverGold
Gold Miners have been breaking a 26 year downtrend and should be something on everyone's radar as the gains can be dramatic going forward
By: Francis Bussier | April 2, 2022
• Gold Miners have been breaking a 26 year downtrend and should be something on everyone's radar as the gains can be dramatic going forward. Newmont has cycles going back 100 years suggesting a Low in 2022 and a High in 2027.

Read Full Story »»»
DiscoverGold
Small Degree Bullish Set Up In Metals
By: Avi Gilburt | April 1, 2022
In both silver and GDX, we seem to be developing another break out set up.
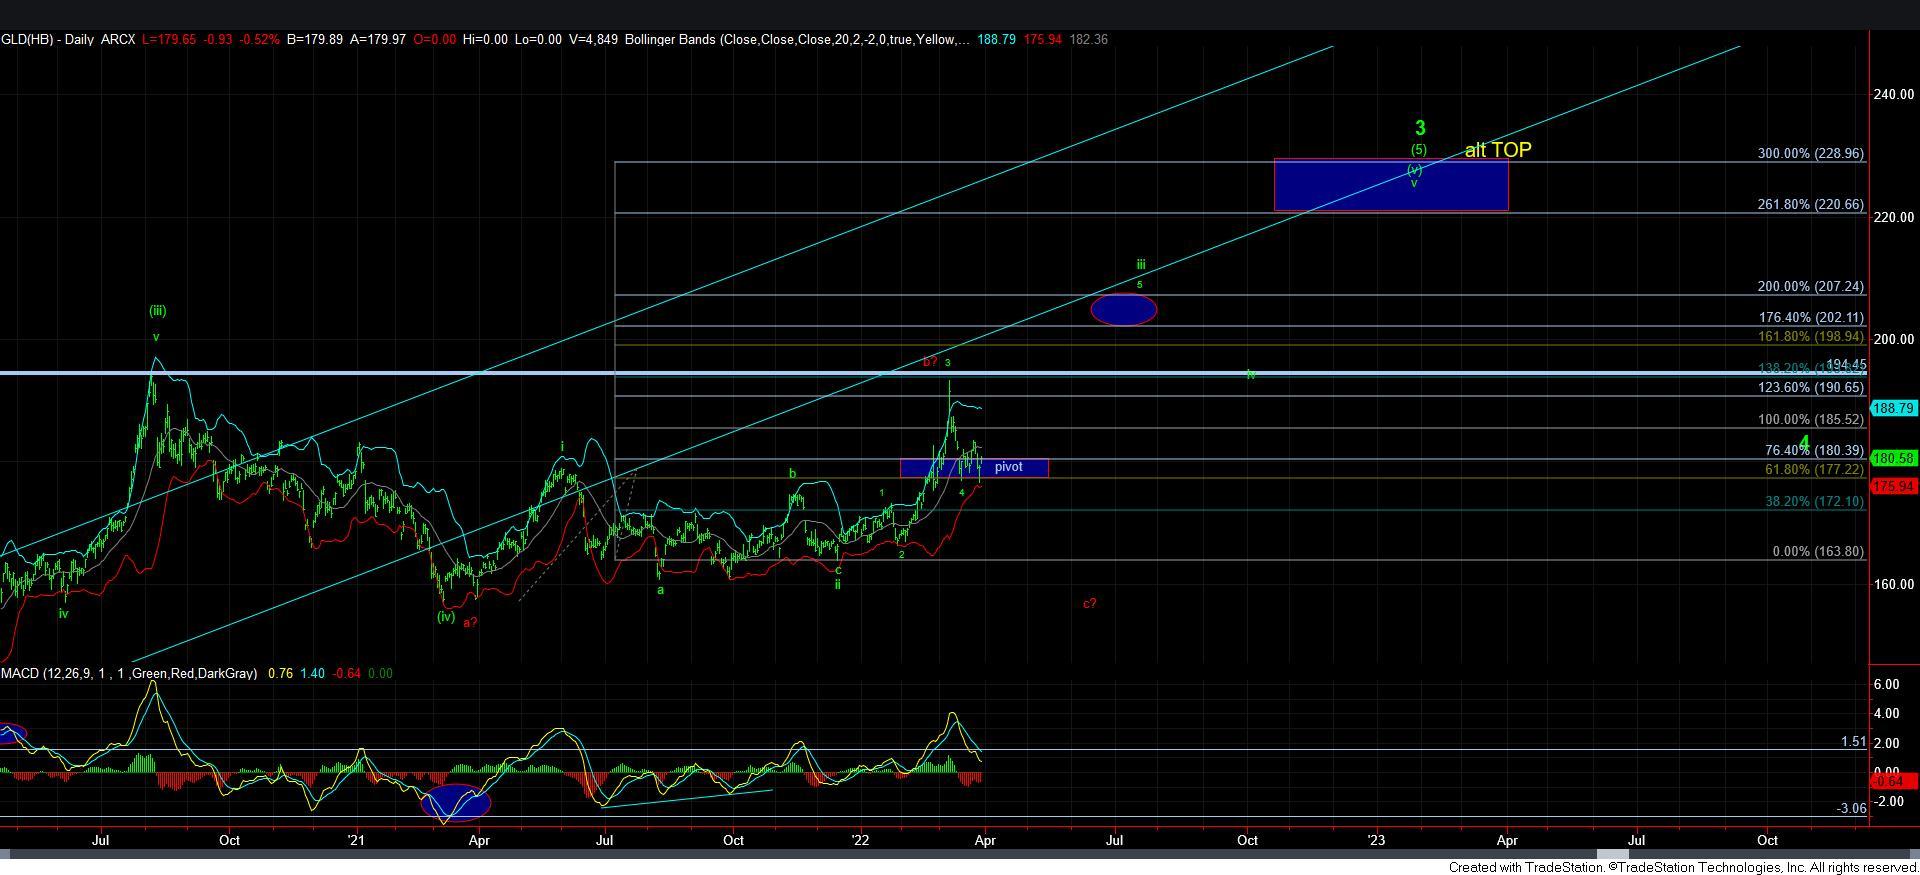
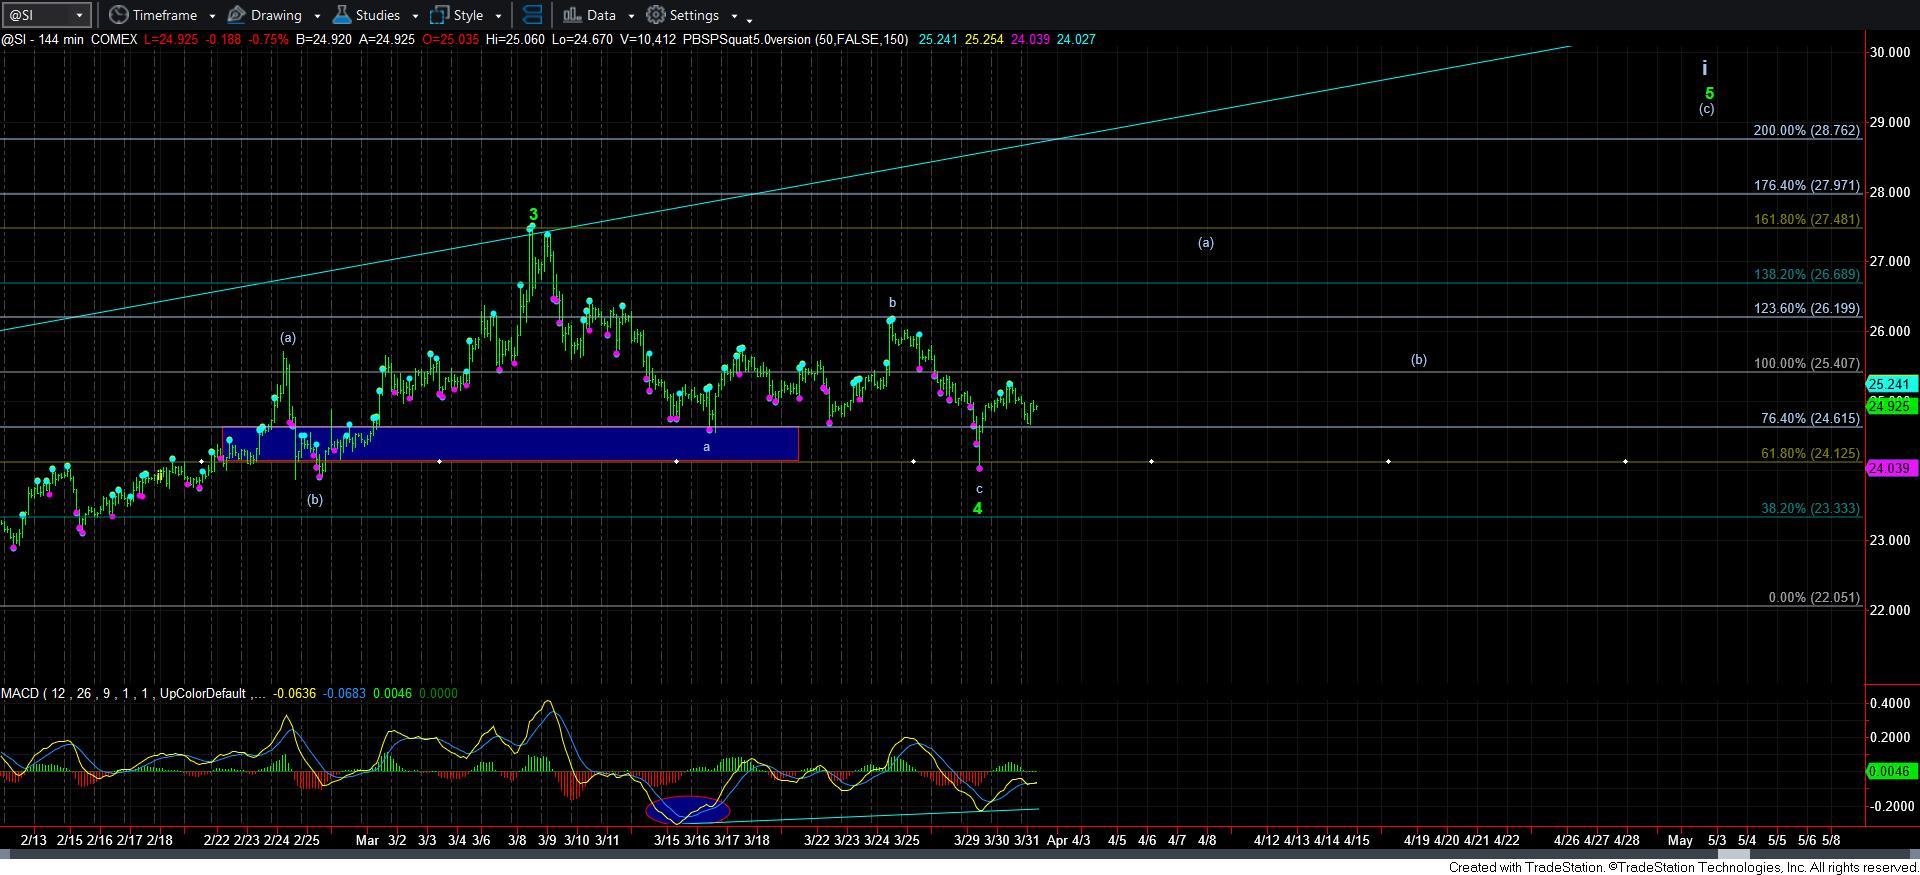
As you can see from the silver chart, we created a lower low for what I am counting as the c-wave of 4, but still on further positive divergences. And, if we break back over yesterday’s high, I think that will likely propel us higher for the (a) wave of wave v of i.
As far as GDX is concerned, we have a potential i-ii in place now, with another (i)(ii) potentially developing. If we can see a bit more of a pullback in wave [ii], and then rally over the high of wave (i), then that could be a long entry for those who want to trade this a bit more aggressively. Otherwise, a break out over the pivot could trigger a long entry, with a stop set just below the pivot. The target for GDX would be a minimum of 44, but with a more ideal target in the 47 region if we get that break out.
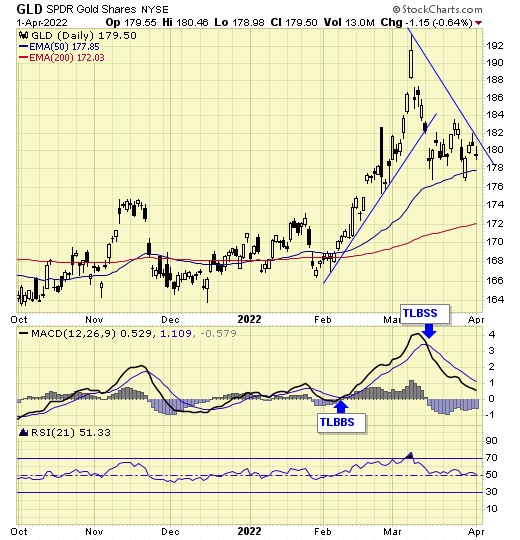
GLD is still a bit of an issue to me. I can’t say I am getting a confident bullish structure from this chart right now. So, at this point in time, it is not something I can trade confidently, but it is also not something I am going to short either. I want to see a bit more evidence of how it develops over the coming days before I can make any determinations.
In summary, the chart that has the cleanest bullish structure is GDX, but do remember that it is based upon an initial leading diagonal for wave i. For this reason, I still want to see the break out through the pivot to be a bit more confident in its immediately potential for a run to 44+.
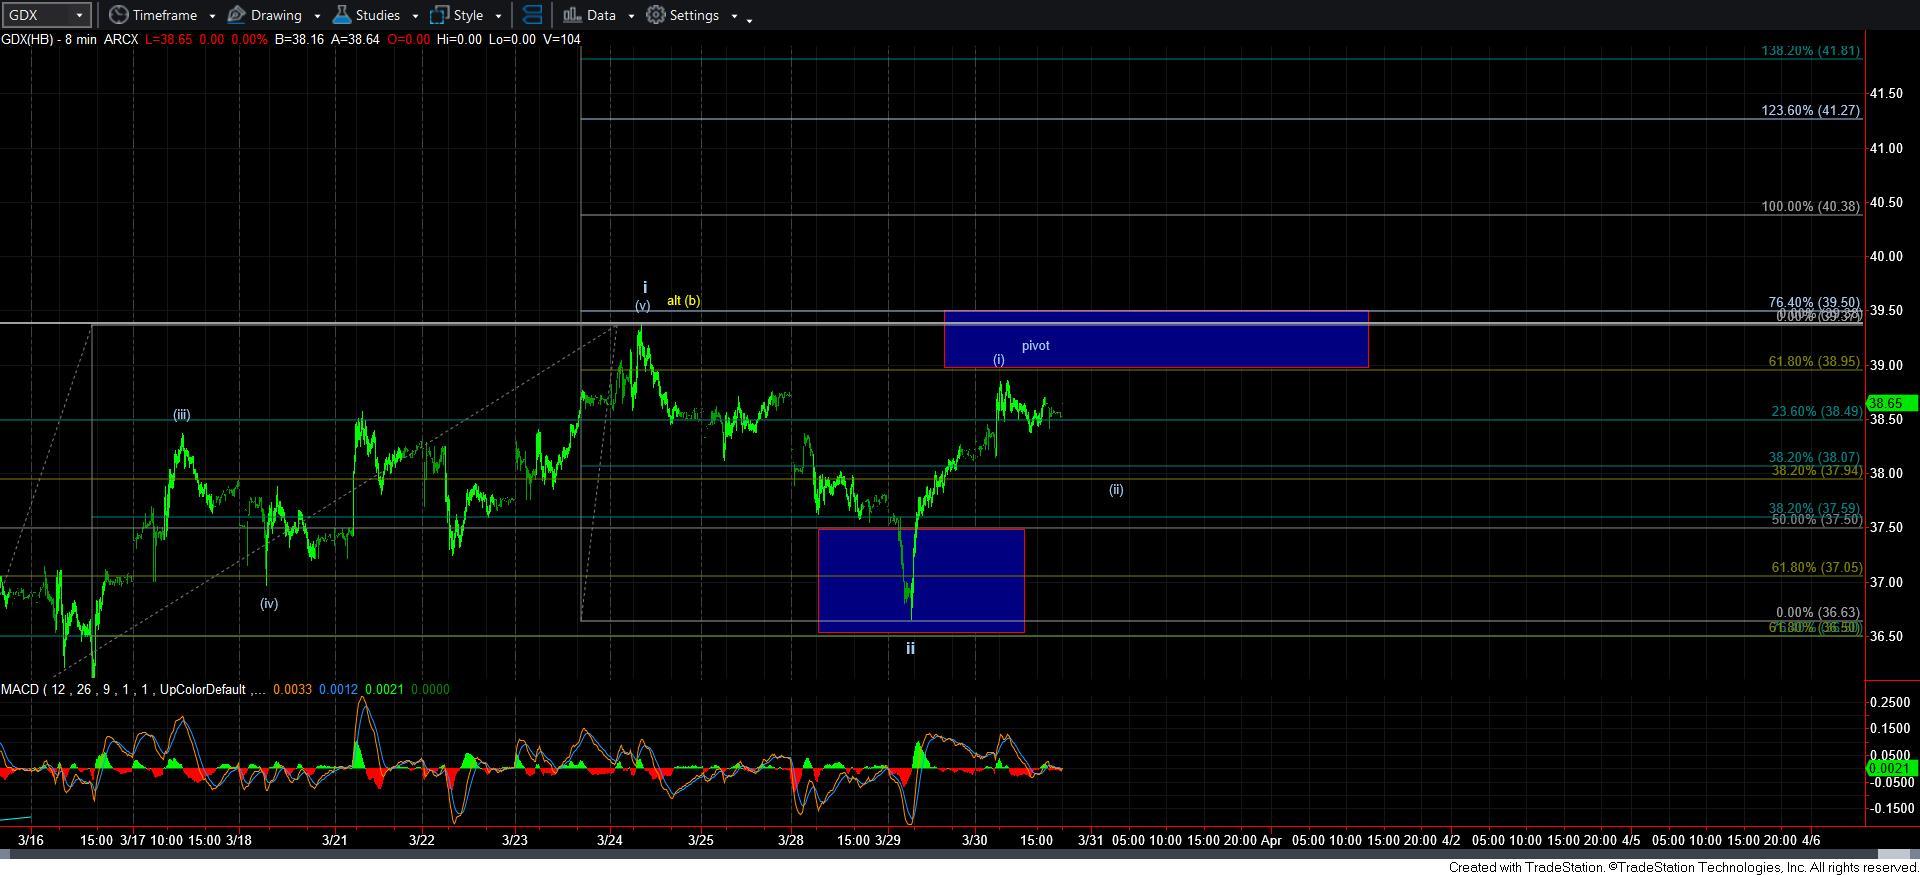
GDX8min
GLDdaily
silver144min
Read Full Story »»»
DiscoverGold
NY Gold Futures »» Weekly Summary Analysis
By: Marty Armstrong | April 2, 2022
NY Gold Futures closed today at 192370 and is trading up about 5.20% for the year from last year's settlement of 182860. Caution is now required for this market is starting to suggest it may rally further on a monthly level. At the moment, this market has been rising for 7 months going into April suggesting that this has been a bull market trend on the monthly time level.
ECONOMIC CONFIDENCE MODEL CORRELATION
Here in NY Gold Futures, we do find that this particular market has correlated with our Economic Confidence Model in the past. The Last turning point on the ECM cycle low to line up with this market was 2015. The Last turning point on the ECM cycle high to line up with this market was 2020 and 2011 and 1996.
MARKET OVERVIEW
NEAR-TERM OUTLOOK
The historical perspective in the NY Gold Futures included a rally from 2015 moving into a major high for 2020, the market has been consolidating since the major high with the last significant reaction low established back in 2015. The market is still holding above last year's low. The last Yearly Reversal to be elected was a Bullish at the close of 2020.
This market remains in a positive position on the weekly to yearly levels of our indicating models.
From a perspective using the indicating ranges on the Daily level in the NY Gold Futures, this market remains moderately bearish position at this time with the overhead resistance beginning at 193440 and support forming below at 190810. The market is trading closer to the resistance level at this time.
On the weekly level, the last important high was established the week of March 7th at 207880, which was up 30 weeks from the low made back during the week of August 9th. We have seen the market drop sharply for the past week penetrating the previous week's low and it closed lower. We are trading below the Weekly Momentum Indicators warning that the decline is very significant and we need to pay attention to the timing and reversals.
INTERMEDIATE-TERM OUTLOOK
YEARLY MOMENTUM MODEL INDICATOR
Our Momentum Models are declining at this time with the previous high made 2020 while the last low formed on 2021. However, this market has rallied in price with the last cyclical high formed on 2020 and thus we have a divergence warning that this market is starting to run out of strength on the upside.
Interestingly, the NY Gold Futures has been in a bullish phase for the past 12 months since the low established back in March 2021.
Critical support still underlies this market at 175200 and a break of that level on a monthly closing basis would warn that a sustainable decline ahead becomes possible. Immediately, the market is trading within last month's trading range in a neutral position.
DiscoverGold
Jack Chan: Gold Price Exclusive Update
By: Jack Chan |March 31, 2022

Our proprietary cycle indicator is UP.
To public readers of our updates, our cycle indicator is one of the most effective timing tool for traders and investors. It is not perfect, because periodically the market can be more volatile and can result in short term whipsaws. But overall, the cycle indicator provides us with a clear direction how we should be speculating.
Investors
During a major buy signal, investors can accumulate positions by cost averaging at cycle bottoms, ideally when prices are at or near the daily 200ema.
During a major sell signal, investors should be hedged or in cash.
Traders
Simply cost average in at cycle bottoms when prices are at or near the daily 200ema; and cost average out at cycle tops when prices are above the daily 50ema.
Gold sector is on a new long term BUY signal, suggesting that the correction since 2020 has been completed.
GLD is on short term sell signal.
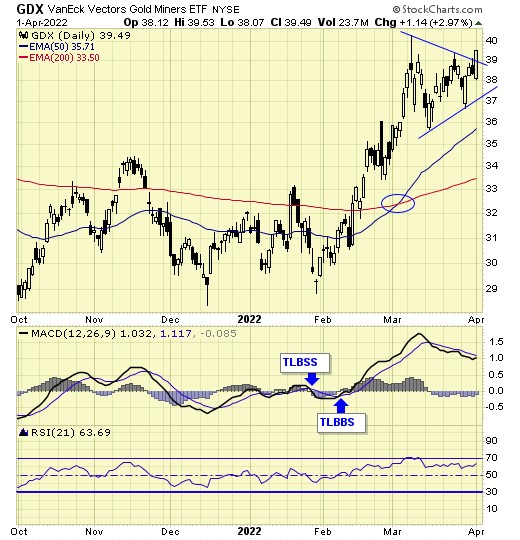
GDX is on short term buy signal.
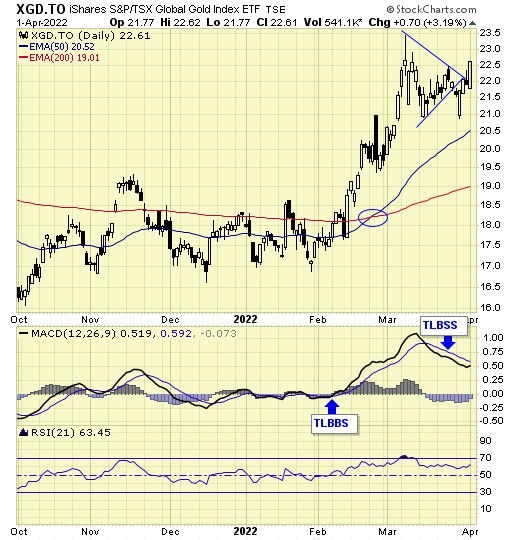
XGD.to is on short term sell signal.
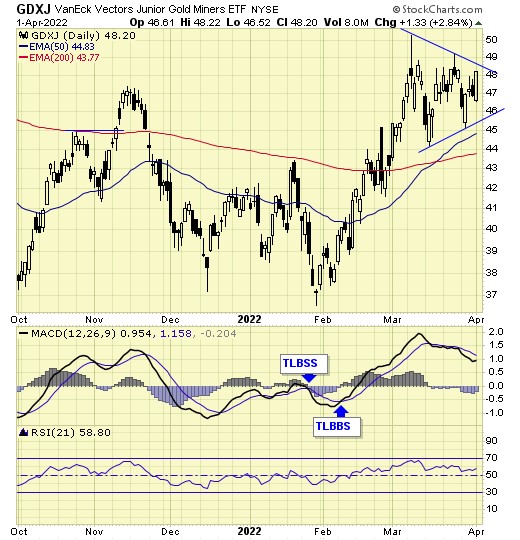
GDXJ is on short term buy signal.
Analysis
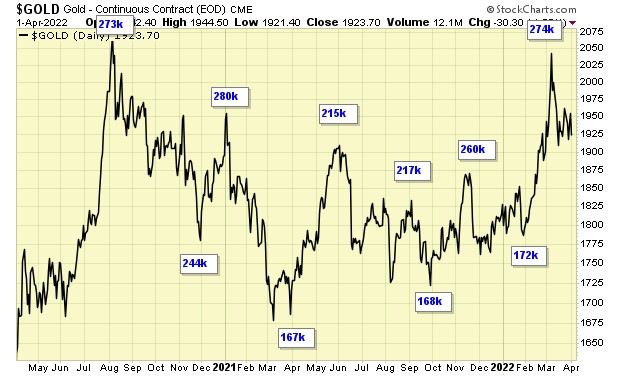
Speculation pulling back from level of previous top.
Our ratio is on buy signal.
Trend is up for the dollar.

Trend is up for gold stocks.

Trend for gold is up.
And the multi year “cup with handle” is in progress.

Another consolidation, another breakout.
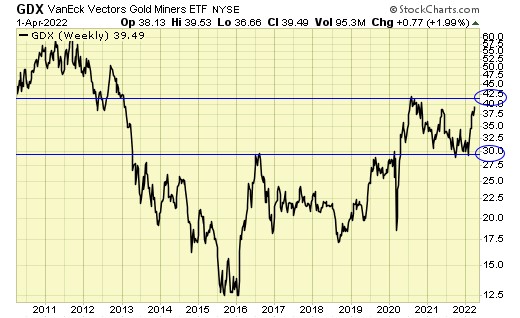
Next resistance at $42.
Summary
Long term – on BUY signal.
Short term – on mixed signals.
Gold sector cycle is UP.
$$$ We are holding long term positions.
Read Full Story »»»
DiscoverGold
Heavy activity on $GDX calls today as price closes strongly at major resistance
By: Fortune | April 1, 2022
• $GDX
Heavy activity on calls today as price closes strongly at major resistance. Floor trader took interest in the 41c 4/29/22 ($0.70)

Read Full Story »»»
DiscoverGold
$GDX Monthly falling wedge breakout
By: Theta Warrior |March 31, 2022
• $GDX Monthly falling wedge breakout.

Read Full Story »»»
DiscoverGold
The Ord Oracle: GDX Update
By: Tim Ord | March 30, 2022
SPX Monitoring Purposes: Long SPX on 3/25/22 at 4543.06.
Monitoring Purposes GOLD: Long GDX on 10/9/20 at 40.78.
Long-Term SPX Monitor Purposes: Neutral.

We have shown this chart is the past. On a previous report, we were expecting GDX to move sideways and, so far, that appears to be playing out. There still maybe a week or two of sideways action before another impulse wave starts, which is expected to go higher. The bottom two windows are the Advance/Decline percent and Up Down Volume percent, with an 18-day average for the GDX. As long both indicators stay above 0, the uptrend is considered intact. GDX has only retraced 38.2% of the rally that started form the January low, suggesting this sideways consolidation is at the halfway point of the move up; that would give a target near the 47.00 range.
Tim Ord,
Editor
Read Full Story »»»
DiscoverGold
Gold Stocks Set To Massively Outperform Gold
By: Jordan Roy-Byrne | March 30, 2022
Gold mining stocks as a whole have underperformed Gold since 2007. The VanEck Gold Miners ETF (NYSE:GDX) to Gold ratio from its 2007 peak to its 2015 bottom declined 80%.
The Gold price peak in 2008 was about where it bottomed at the end of 2015. That’s over seven years of a flat market coupled with steady increases in costs.
Too many people associate the Gold price level with where the miners should be trading. It’s important to note that the performance of gold stocks relative to Gold depends on company margins, which can be squeezed on both sides outside of a bull market.
Take the last 18 months, for example. The Gold price declined, and mining costs increased. A double whammy is why miners fell more than the Gold price.
Since mining costs rarely plunge, the best time for margin expansion is when Gold makes its sharpest moves to the upside. This usually occurs following a major bottom (or crash) or major breakout.
We plot the MVIS to Gold ratio at certain points in the chart below. The MVIS is the parent index of VanEck Junior Gold Miners ETF (NYSE:GDXJ) and has a history back to the start of 2004.
The MVIS to Gold ratio increased the most during the cyclical bull market that began from the crash low during the global financial crisis in November 2008.
The most significant breakout for Gold in recent decades was in September 2005. The MVIS to Gold ratio doubled from the May 2005 low to the November 2007 peak.
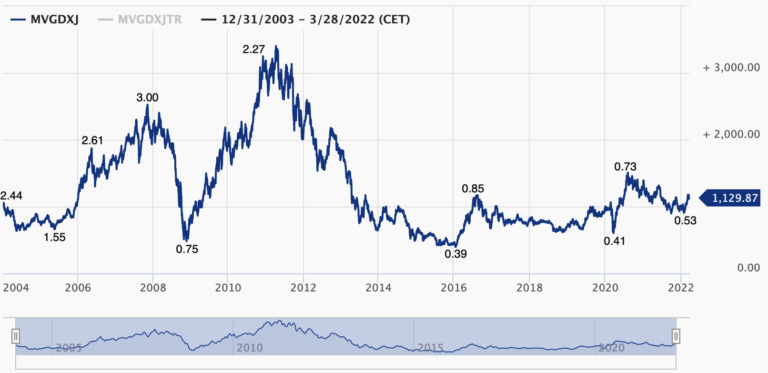
MVISGDXJ-Chart
As we’ve written about for months, Gold is in position for one of the three most significant breakouts in its history. A break above $2,100 triggers a measured upside target of $3,000 and a log target of $4,000.
The potential for an explosive move to the upside in Gold means there is potential for an upward explosion in margins and, therefore, major outperformance against Gold.
The technical setup aligns with our opinion.
The GDX to Gold and GDXJ to Gold ratios show explosive upside potential if they can break out from decade-long bases.
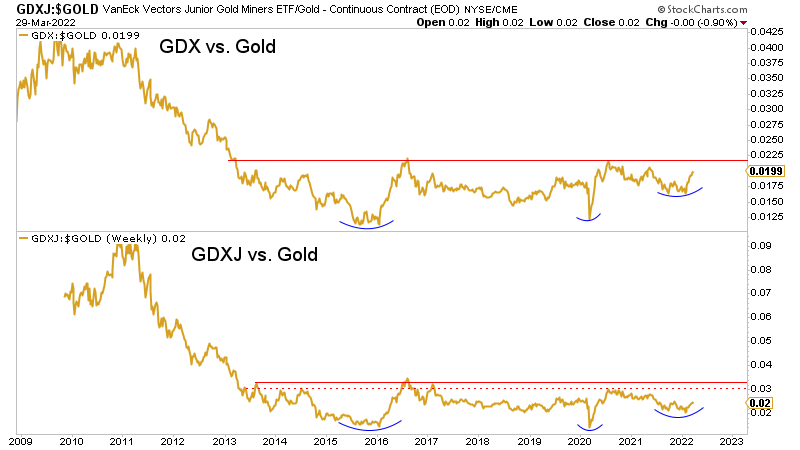
GDX vs Gold:GDXJ vs Gold Weekly Chart
The miners could be sending early signals of their future outperformance, judging from recent market action.
Gold and Silver tested their 50-day moving averages today, while GDX, GDXJ, HUI, and the ETFMG Prime Junior Silver Miners ETF (NYSE:SILJ) were not particularly close to testing their 50-day moving averages.
During a correction, relative strength in the stocks is rare and usually very bullish.
The sector correction and consolidation should continue this spring, but the miners are sending early signals about what will come later in the year.
Read Full Story »»»
DiscoverGold
Gold Stocks: Miners Teeter On The Edge Of Breakdown
By: Sunshine Profits | March 29, 2022
I dedicated most of the technical part of my earlier analysis to mining stocks, arguing that their breakout above the declining resistance line was unlikely to last, and we didn’t have to wait long for the market to agree with that. The precious metals sector declined yesterday, and junior miners were the ones that plummeted the most. So much for miners’ short-term strength relative to gold.
As a brief reminder, here’s what I wrote:
The junior mining stocks closed the week above the declining medium-term support line, which might be viewed as something bullish. Let’s take a closer look.
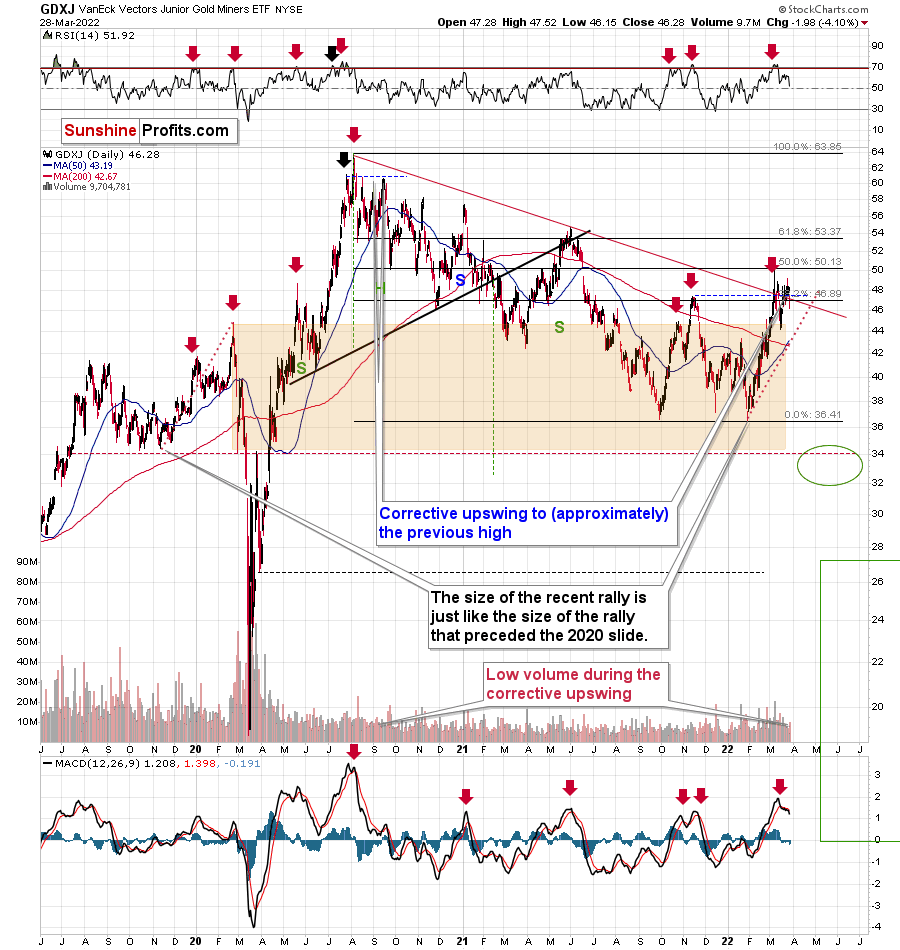
GDXJ Daily Chart
The GDXJ ETF closed the week above the declining red line and below the 38.2% Fibonacci retracement level. However, should one view this as really bullish?
Not really, as long as one remembers that not everything is about the price. The volume is also an important indicator as it shows, among other things, how much the market participants are really convinced that a given move is likely to take place. If the price moved higher on significant volume (but not excessively huge, as that could mean that the rally burnt itself out), it would mean that bulls won after a fierce fight.
Friday’s volume, however, was small. In fact, it was the lowest volume in the GDXJ ETF that we have seen this year. The second-lowest volume was recorded on Jan. 4, which was right before GDXJ’s decline.
So, should the breakout above the declining resistance be trusted? No, at least not yet.
This is especially the case given that the sell signal from the MACD indicator remains intact. These signals were highly effective at detecting major short-term tops. The fact that we just saw one indicates that the outlook for mining stocks is bearish.
The tiny-volume rally was immediately followed by a decline in volume that was not yet huge, but bigger than what we saw during the preceding rally.
Shouldn’t the volume be higher now? Not really. After the first crack in a dam (the breakdown), the water can leak at a small or moderate pace at first (a decline in average volume), but we all know what happens next. The water flow gains strength as the dam is destroyed. In the world of technical analysis, this could be viewed as a situation in which prices decline in a much more decisive way, with stronger volume, and more sharply so. Just like the dam is not going to stop the water, the previous support will no longer prevent declines, once the breakdown is confirmed.
The breakdown of junior miners hasn’t been confirmed yet. However, given the fact that it materialized while gold didn’t decline as much, and that it reversed before the end of the session (thus miners are weak relative to gold again), it seems that the breakdown will be confirmed shortly.
While the above analogy describes the move below the declining red resistance line visible on the previous chart, the below 4-hour chart features a breakdown below the rising short-term support line, and it also applies to it.
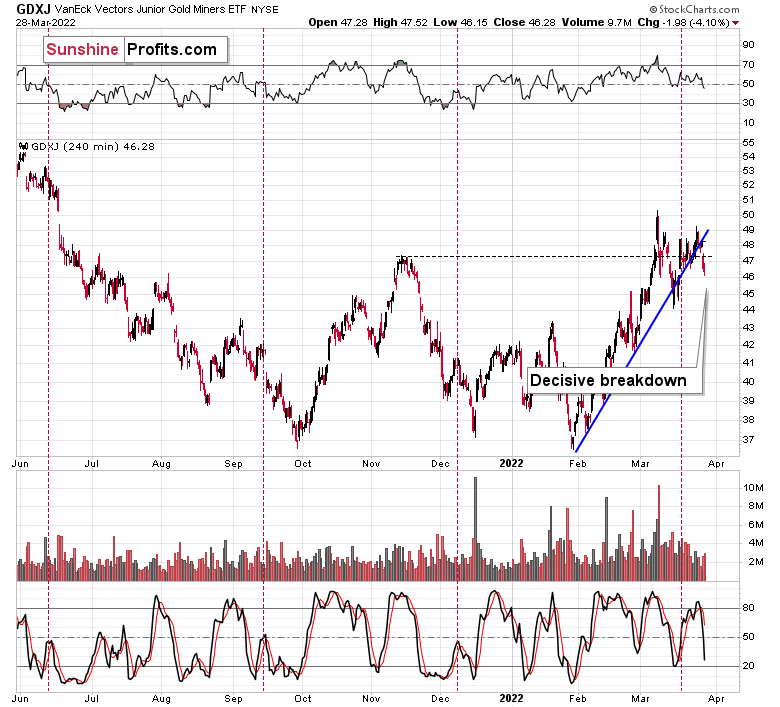
GDXJ 240-Min Chart
Yes, we did see this kind of breakdown in mid-March, and GDXJ rallied shortly thereafter. However, now the move is more decisive.
Back then, the closing price was very close to the support line, and now it’s clearly below that. Therefore, the breakdown is much more visible and, thus, reliable. Again, it’s not confirmed, but it’s likely to be so shortly.
Also, let’s check the scope of the miner’s underperformance. While the GDXJ was down by over 4% yesterday, gold…
Gold Daily Chart
Gold was down by less than 1%. Miners are clearly underperforming the yellow metal here, which is common for the initial days of declines after short- and medium-term tops.
One might say that perhaps the decline in the junior miners was caused by a decline in the general stock market, but…
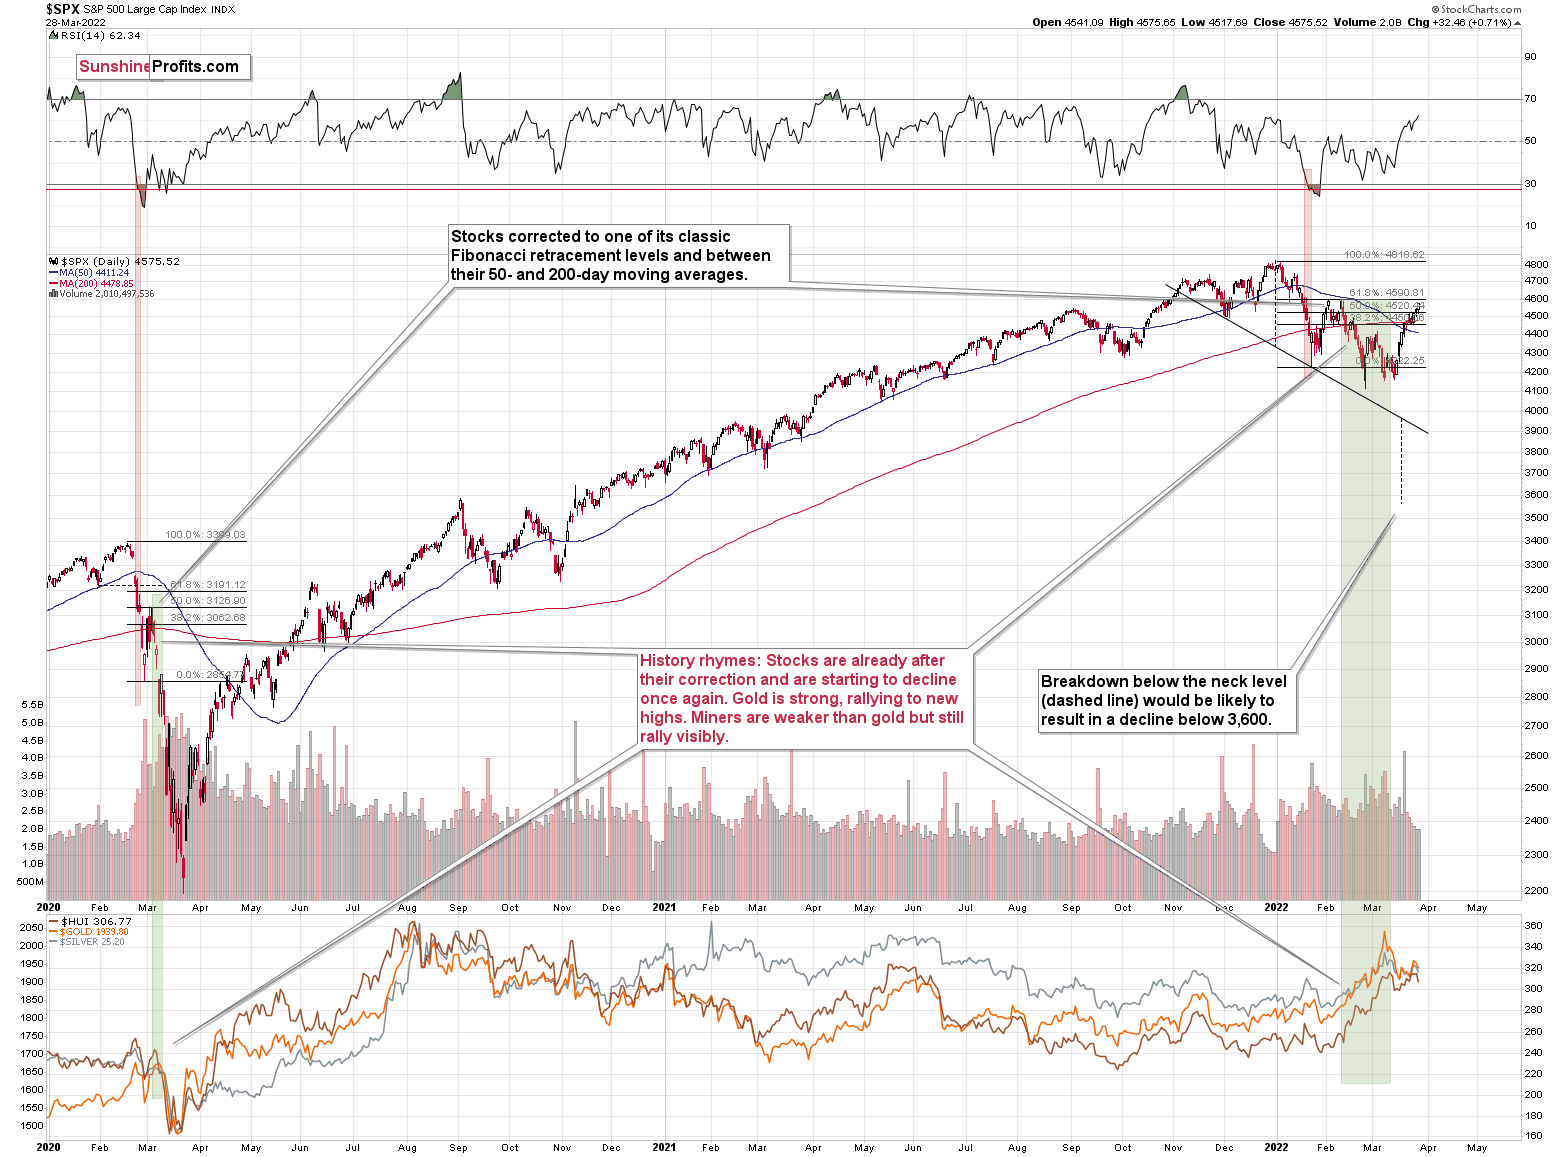
SPX Daily Chart
The general stock market didn’t decline yesterday. So, it wasn’t it. The most likely explanation of what we just saw is that miners are simply indicating that it’s about time to start the next (probably big) move lower.
Besides, the market had it coming, given the analogy to what happened in late-2012. I previously described it in the following way:
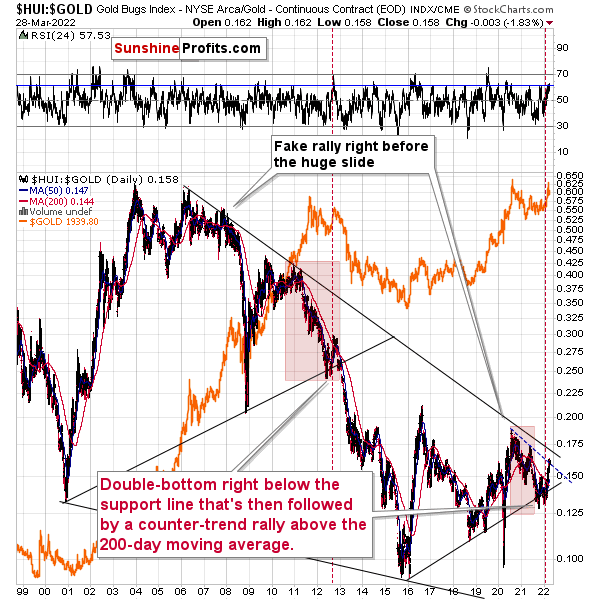
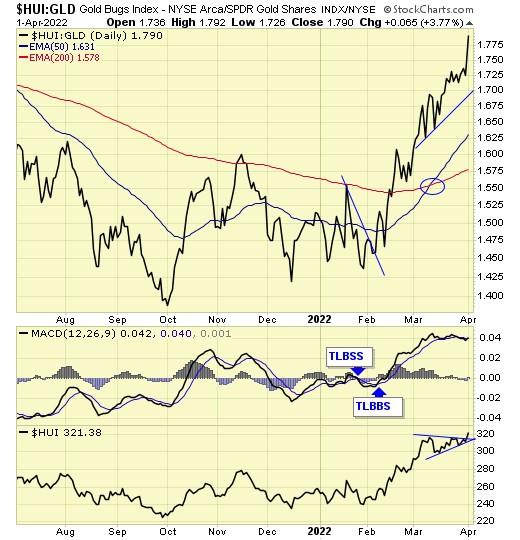
HUI:GOLD Daily Chart
Gold stocks (GDX (NYSE:GDX), GDXJ, and HUI Index) have recently been quite strong relative to gold. OK, but is this necessarily bullish? It could be, until one considers the fact that we saw the same thing at the 2012 top! This changes everything, and it does so, because the links between now and that top are almost everywhere: in gold, in silver, in gold stocks, and even in their ratios.
It is the gold stocks to gold ratio that I would like to start with today. That’s the flagship proxy for the relationship between these two markets.
As it turns out, the gold stocks to gold ratio is behaving almost identically as at the 2012 top in the precious metals sector.
In both cases, the ratio moved below the rising medium-term support line, then formed a double-bottom below the line, and invalidated the breakdown, which resulted in a counter-trend rally. The rally ended shortly after the ratio moved above its 200-day moving average (marked in red). That’s what happened recently. What happened next in 2012? The decline not only continued – it accelerated!
Consequently, the recent action in the ratio is not really bullish. In other words, the fact that gold stocks were recently (in the short run only) strong relative to gold doesn’t make the medium-term outlook for the precious metals sector bullish. However, it remains bearish.
Interestingly, the ratio itself moved to its declining resistance line, indicating that the corrective upswing might already be over or almost over. We get the same indication from the RSI indicator. It’s not above 70, but in the case of most local tops, the RSI didn’t have to move above 70. It just moved to more or less the same levels – I marked it with a horizontal blue line.
While yesterday’s weakness in miners didn’t trigger a huge decline in the HUI to gold ratio yet, the emphasis here is on "yet." This means that more weakness is likely to follow. That’s very bearish for the mining stocks, especially junior miners that are likely to be affected to the greatest degree when the general stock market declines. The latter is likely too, in my view.
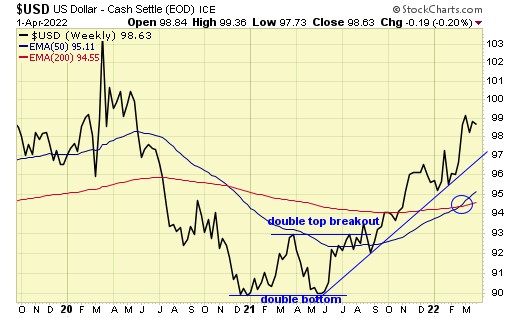
Not much changed in the USD Index yesterday, but that means that its bullish implications remain intact along with the bearish consequences for the precious metals sector, and so do my earlier comments:
Let’s keep in mind that, based on the clearly confirmed breakout in the USD Index and a visible breather in it, the U.S. currency is likely to rally in the following days / weeks. This means that the precious metals sector is likely to get a bearish push shortly.
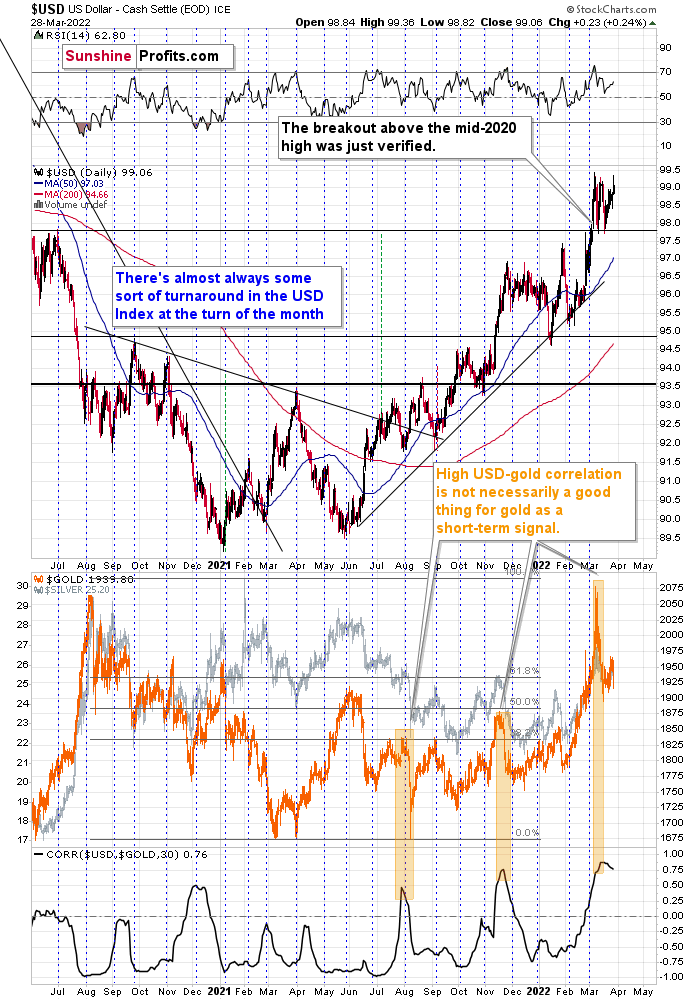
USD Daily Chart
As the war-based premiums in gold and the USD appear to be waning, a high-interest-rate-driven rally in the USD is likely to trigger declines in gold. The correlation between these two assets has started to decline. When that happened during the last two cases (marked with orange), gold plummeted profoundly shortly thereafter.
All in all, technicals favor a decline in the precious metals sector sooner rather than later.
Read Full Story »»»
DiscoverGold
Gold Forecast: Gold Wins Oscar For Wasting Chances To Rally
By: P. Radomski | March 28, 2022
Neither the pandemic and inflation, nor war. Nothing seemed to be able to motivate gold to surge, although there were opportunities. When’s the next chance?
Friday’s session was rather uneventful, so today’s analysis is going to be fairly brief. However, there is one part of the precious metals sector that’s definitely worth discussing.
The junior mining stocks closed the week above the declining medium-term support line, which might be viewed as something bullish. Let’s take a closer look.

The GDXJ ETF closed the week above the declining red line and below the 38.2% Fibonacci retracement level. However, should one view this as really bullish?
Not really, as long as one remembers that not everything is about the price. The volume is also an important indicator as it shows, among other things, how much the market participants are really convinced that a given move is likely to take place. If the price moved higher on significant volume (but not excessively huge, as that could mean that the rally burnt itself out), it would mean that bulls won after a fierce fight.
Friday’s volume, however, was small. In fact, it was the lowest volume in the GDXJ ETF that we have seen this year. The second-lowest volume was recorded on Jan. 4, which was right before GDXJ’s decline.
So, should the breakout above the declining resistance be trusted? No, at least not yet.
This is especially the case given that the sell signal from the MACD indicator remains intact. These signals were highly effective at detecting major short-term tops. The fact that we just saw one indicates that the outlook for mining stocks is bearish.
Besides, while the GDXJ ETF moved above its medium-term resistance line, it also moved below its rising short-term support line, as we can see on the below 4-hour chart.

The ETF closed practically right at the line at the end of the week, but the initial breakdown indicates that a major slide could happen any day – or hour – now.
Based on the above, the small breakout above the declining red resistance line (visible on GDXJ’s daily chart) is likely to be invalidated, and much lower GDXJ prices are likely to follow.
Let’s keep in mind that, based on the clearly confirmed breakout in the USD Index and a visible breather in it, the U.S. currency is likely to rally in the following days / weeks. This means that the precious metals sector is likely to get a bearish push shortly.

As the war-based premiums on gold and the USD appear to be waning, a high-interest-rate-driven rally in the USD is likely to trigger declines in gold. The correlation between these two assets started to decline. When that happened during the last two cases (marked with orange), gold declined profoundly shortly thereafter.
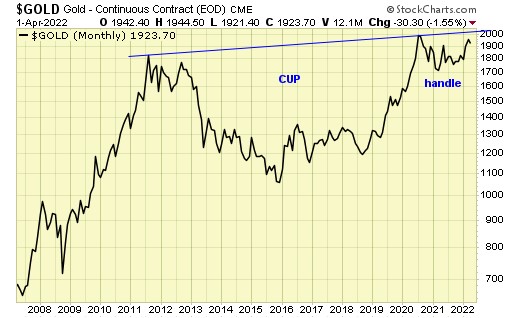
However, isn’t gold forming a cup-and-handle pattern that could make it soar?
Let’s take a look at the gold market from a broader point of view to find out.

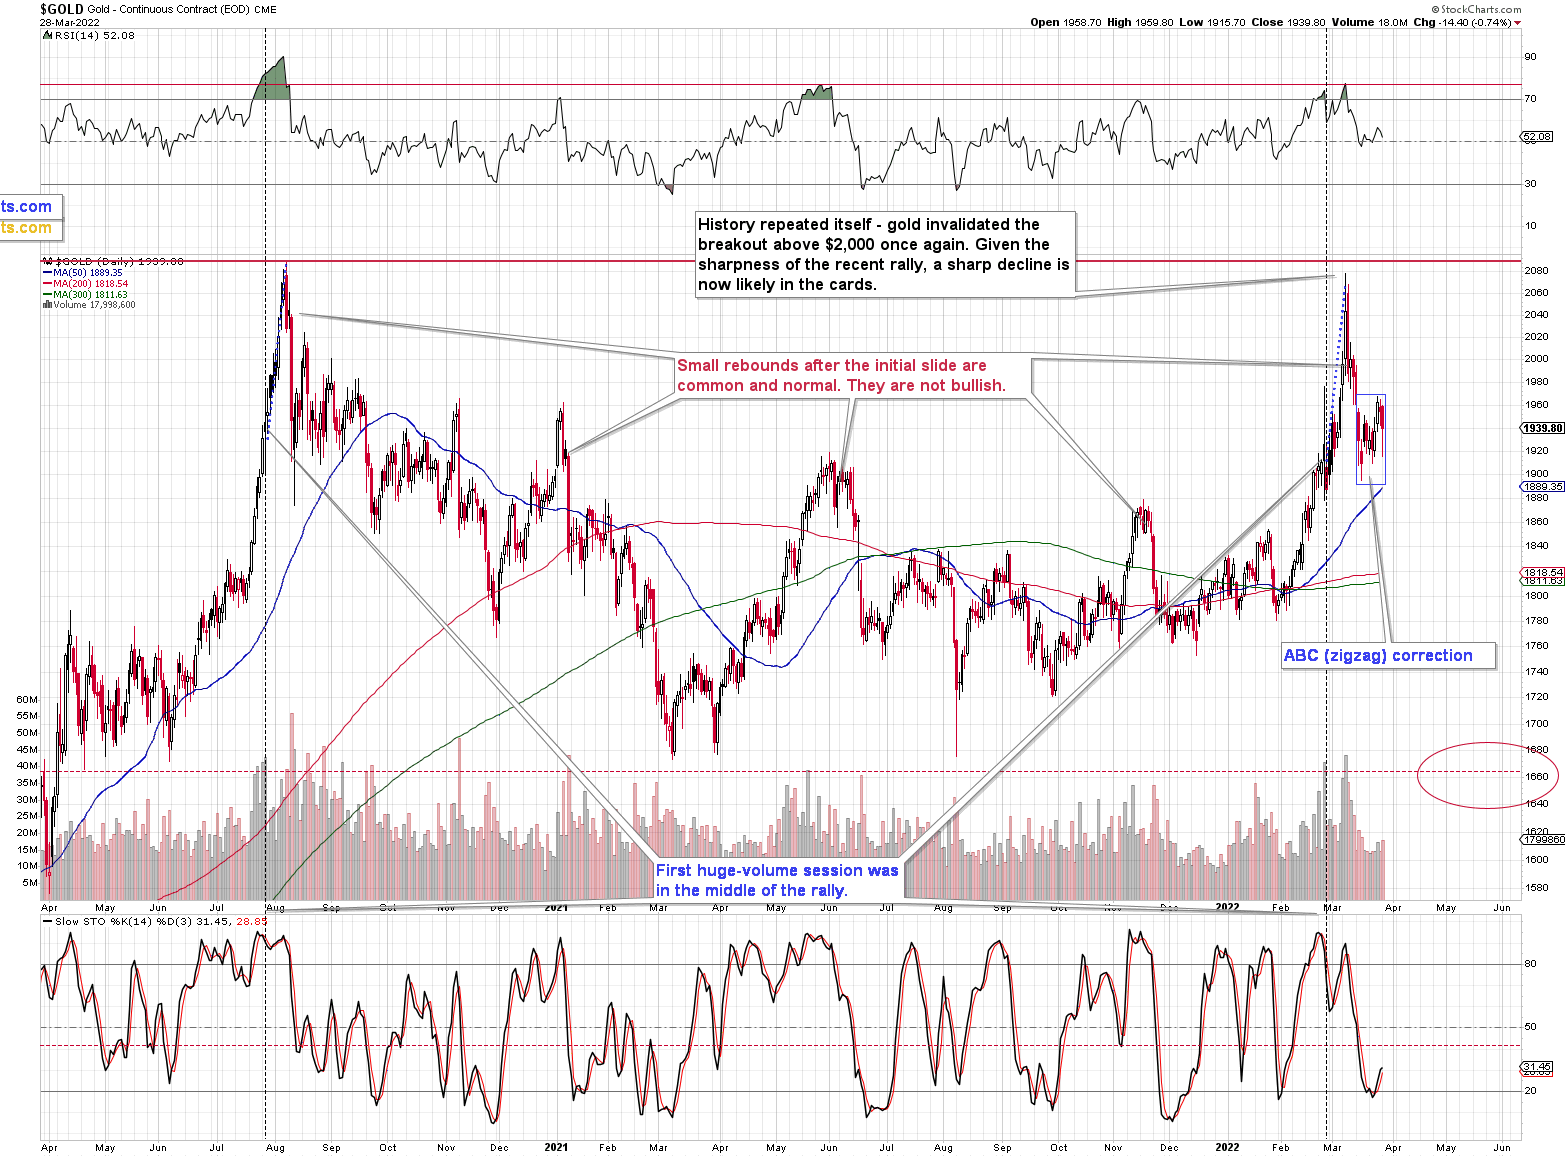
Well, it might be, but we won’t know until we see a confirmed breakout above the top of the pattern – the previous 2020 and 2022 highs.
What we saw recently was an indication that it’s unlikely to happen anytime soon, without gold’s major decline taking place first. What indication? One might ask. The answer is that despite raging inflation (and still low interest rates), a pandemic, and war in Europe that at some point looked like something that could turn into a nuclear war, gold still failed to rally above its 2020 high. In fact, at the moment of writing these words, gold is trading at about $1,935, which is just slightly above its 2011 high. Yes, you read that right: despite all these factors that should have made gold exceed the old highs a long time ago, it didn’t manage to do so.
That’s just gold. You know what silver and gold stocks did, right? They didn’t even rally close to their 2020 high, which itself was not even close to their 2011 highs. In fact, they both managed to only correct half of their declines that started in 2011.
So, no. I don’t think we’ll see the completion of the cup-and-handle formation in gold before we see a profound decline, and the way gold, silver, and mining stocks reacted (they almost didn’t) to the recent developments confirms it. On the technical front, please keep in mind that before a formation is completed, its implications are nonexistent – it’s all just potential. If you bought a lottery ticket, you could potentially be a multi-millionaire. However, until you actually win, it doesn’t happen (unless you are one right now, of course). It is the same with patterns, until they are completed, they have no implications.
Besides, the “it’s a huge cup-and-handle pattern” argument is an old one. We heard it multiple times in 2012 when gold, silver, and mining stocks were topping, and before we saw a major slide in them. The patterns are just like what we saw back then, with the tiny exception that this time gold peaked close to the original top. However, it’s a normal, geopolitically-driven thing. Without it, the patterns might have been almost 100% identical. The implications are very bearish for the following weeks/months, especially that self-similarity to late 2012 is present also in silver and gold stocks.
Of course, if the Russians use tactical nuclear weapons, gold prices might again react in the near term. If it escalates into a full-blown nuclear war, then:
1. We’ll have many other problems to worry about than the near-term price of gold. The more common problems would be securing access to clean water and electricity (bitcoin payments without electricity, anyone? Or maybe electronic currency is useful except times at when you really need it).
2. The gold that we have in the insurance part of our capital (all Gold & Silver Trading Alerts feature details for three parts of the portfolio: trading, investment, and insurance) would likely soar, more than making up for any financial losses one might incur on many fronts due to the nuclear war.
I’m writing about the above as I received a question that I’d like to quote below:
“There are rumors that Russia may begin to use tactical nuclear weapons in the very near future (2-4 weeks). How do you see this affecting gold prices if this eventuates?”
The important detail here is visible at the beginning of the question: “There are rumors.” If the rumors are already present, then it means that gold has already reacted to it and it’s already after a rally based on that. The market buys on rumor and sells on fact. Consequently, it’s even possible that if nuclear weapons are used on a small scale and without an analogous reaction from other nuclear powers, then gold’s price could actually decline as markets could view it as a “relief” from the scenario in which a full-blown nuclear war starts.
Again, please make sure you remember this rule: the market moves on rumor and then moves back on fact. If you see that the rumors are prevalent, you’ll know that the price has most likely already reacted to it.
All in all, technicals favor a decline in the precious metals sector sooner rather than later.
Summary
As after the outbreak of the pandemic and in the face of constantly rampant inflation, also in the context of the war in Ukraine gold did not manage to rise above its previous peaks. It did not react vigorously even to the rumors about Russia's possible plans to use nuclear weapons. Thus, it seems the yellow metal is beginning to stop benefiting from war-driven upheaval. The changes can also be noticed in the USDX, and they mean one thing for gold.
Despite the ongoing Russian invasion of Ukraine, and despite gold being the traditional safe haven in times of turmoil, the overall outlook for the precious metals sector remains bearish for the next few months, and the medium-term outlook for the yellow metal remains pessimistic.
Read Full Story »»»
DiscoverGold
The Many Faces Of Gold
By: Rambus | March 28, 2022
Before we look at the Gold charts tonight there are a couple of things I would like to explain to our new members. Long term members have heard what I’m going to explain many times in the past when we start a new impulse move. It sounds pretty basic but very important to understand.
First, you have to know what type of trader you are. There are three timeframes you need to be aware of. If you are a short term trader then you need to focus on the short term minute and daily charts for your buy and sell signals. For me personally I’m an intermediate term trader that looks for the big impulse moves between a consolidation pattern or a reversal pattern, that is why I focus more on the longer term weekly and monthly charts. If one is a long term trader then you don’t care about anything else but the big picture and longer term charts. The most important thing for a long term investor is to know with a high degree of confidence if the stock you are investing in is in a bull or bear market.
The other point I would like to make if one is an intermediate term trader is to know as soon as possible when an impulse move begins and ends. Once you have identified an important intermediate term impulse move has begun there is only one thing you need to do which is psychologically hard for most traders. What that simple and psychologically hard thing to do is, NOTHING.
What happens to most traders during an impulse move is first, they don’t understand what an impulse move actually is and try to trade the small consolidation patterns that help buildout the impulse move. If one is a short term trader that is a different story as we are talking an intermediate term move. Yes, they may capture some small profits from time to time but what happens most of the time is that they will get left behind always looking for a way to get their positions back as the stock runs higher.
There is an old Wall Street adage that I completely disagree with. It says, you can’t go broke taking a profit. That is partly true if you take a profit on every trade you make but every trade you take won’t be profitable. In a strong impulse move you can take a small profit but then you have to get back in at some point which I can tell you from first-hand experience is a very hard thing to do when the trend is very strong. What usually happens is that you will pay up to get your shares back and lose the difference between where you sold and where you got back in at, rinse and repeat.
The time to trade is during the formation of a consolidation pattern and try to catch the reversal points that make up the internal structure of say, a triangle. An impulse move is an entirely different game altogether.
Everyone has to figure out what type of trader they are and to understand how the market moves. Knowing that can help you make more money than you lose. It sounds simple enough but hard to do in real time.
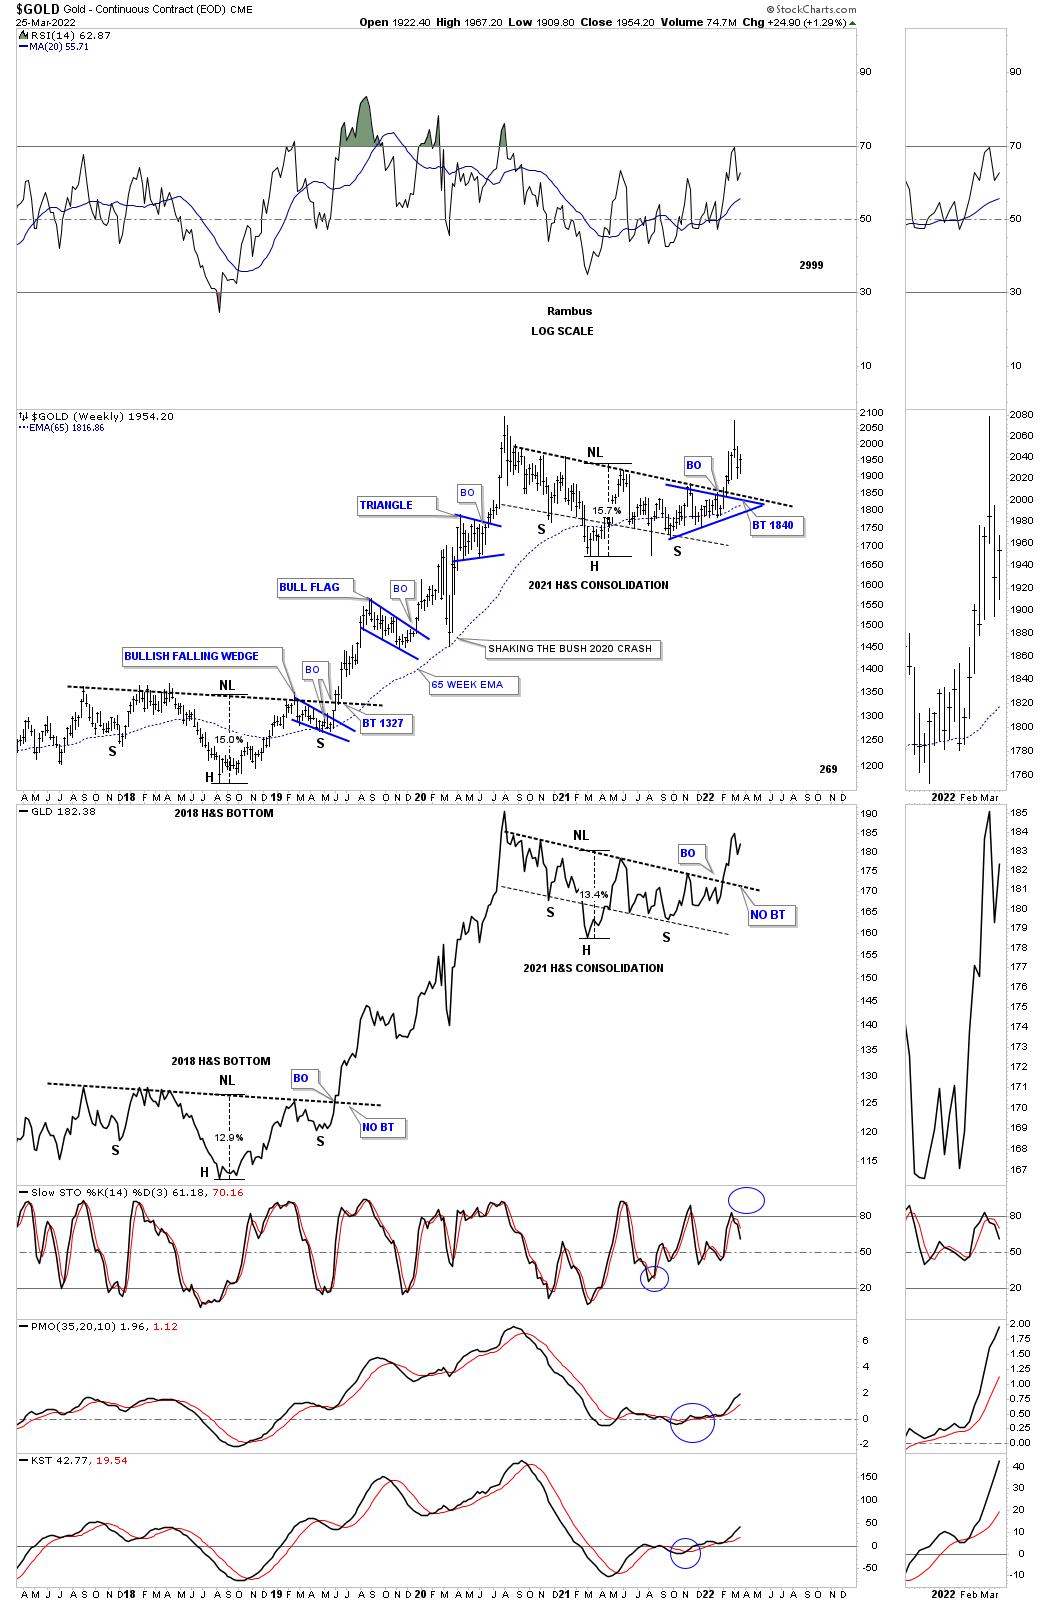
Tonight I would like to show you the many different faces of Gold from the intermediate to the longer term timeframes. We already know that big consolidation patterns are usually made up with small patterns especially in regards to H&S patterns. This first chart is a combo chart for Gold with the top chart being a bar chart and the bottom one being a line chart.
The two dominate chart patterns are the 2018 H&S bottom and the 2021 H&S consolidation pattern. Both of the patterns are almost identical in price and time as shown by the percentage move from the head to the neckline. Time wise the current H&S consolidation pattern broke out above its neckline several weeks earlier than the 2018 H&S bottom. As you can see the 2018 H&S bottom had just a one week backtest before the impulse move really took off in earnest. The current H&S consolidation pattern hasn’t experienced a backtest yet which is still possible. The main takeaway is that the impulse move has already begun regardless if we get a backtest or not.
Lets focus on the impulse move between the two H&S patterns that lasted almost two years. Looking at the nearly two year impulse move looks pretty easy in hindsight but I can assure you it is an entirely different game in real life. Put yourself in at any point from the lower H&S bottom to the 2020 high where the impulse move ended. How would you have reacted during those small consolation patterns especially the 2020 pandemic crash low?
What we do know from a Chartology perspective is that first, there was a pretty big H&S bottom which strongly suggested a big move to follow. The first minor impulse move formed the blue bull flag which confirmed the bigger impulse move was underway. The 2020 crash is not typical in a strong impulse move but Gold did find support on the 65 week ema which led to the next small impulse move up. After a couple of months of sideways chopping action formed the last consolation pattern in the big impulse move which was the blue triangle. Normally during a big impulse move you will generally see anywhere from two to four smaller consolidation patterns form.
This next chart shows all the consolidation patterns that formed the bull market from the 2000 low to the 2011 high. Again, put yourself anywhere in that ten year bull market rally and how would you have reacted at any point in that bull market? This chart clearly shows you the best time to have been in Gold was during the impulse move between each consolidation pattern. If one is an investor then all you needed to know is that gold was in a bull market and to sit tight during the consolidation phases which could last up to a year. An investor would have done very well if they had spotted the top in September of 2011 and gotten out during the rectangle consolation pattern to the downside.

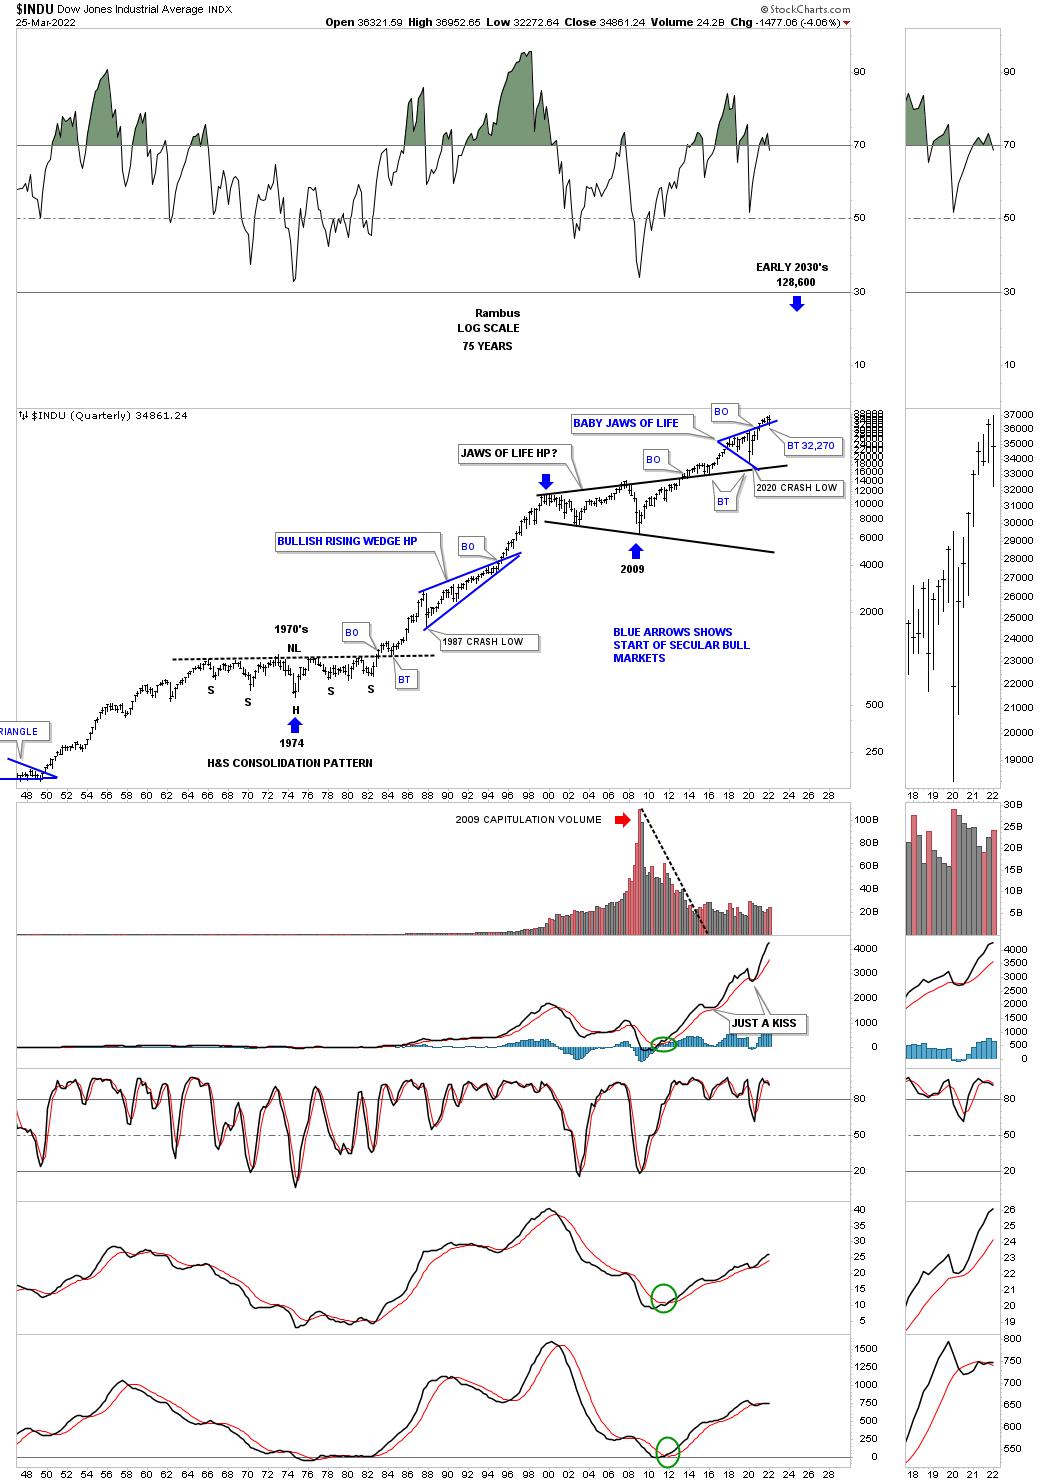
I have shown you many charts for the US stock markets which show the secular bull markets from 1974 to the 2000 top and the current secular bull market that began at the 2009 crash low. The beginning of the 1974 secular bull market lasted nearly 25 years with the current secular bull market currently at 13 years and counting.
Below is Gold’s secular bull market that began in 2000 and is now 22 years old. Time wise if we added the first leg of the bull market that took eleven years to complete and added eleven years to the 2016 low, head portion of the H&S consolidation pattern, that could put the time component out to the 2026 area using the H&S as a halfway pattern.
There is no way to know 100% for sure when the time component will be completed but for now it is a good guide we can use. There will be other things we will be following that will help us in signaling the end of the secular bull market but at this point we should have at least four more years at a minimum ahead of us.

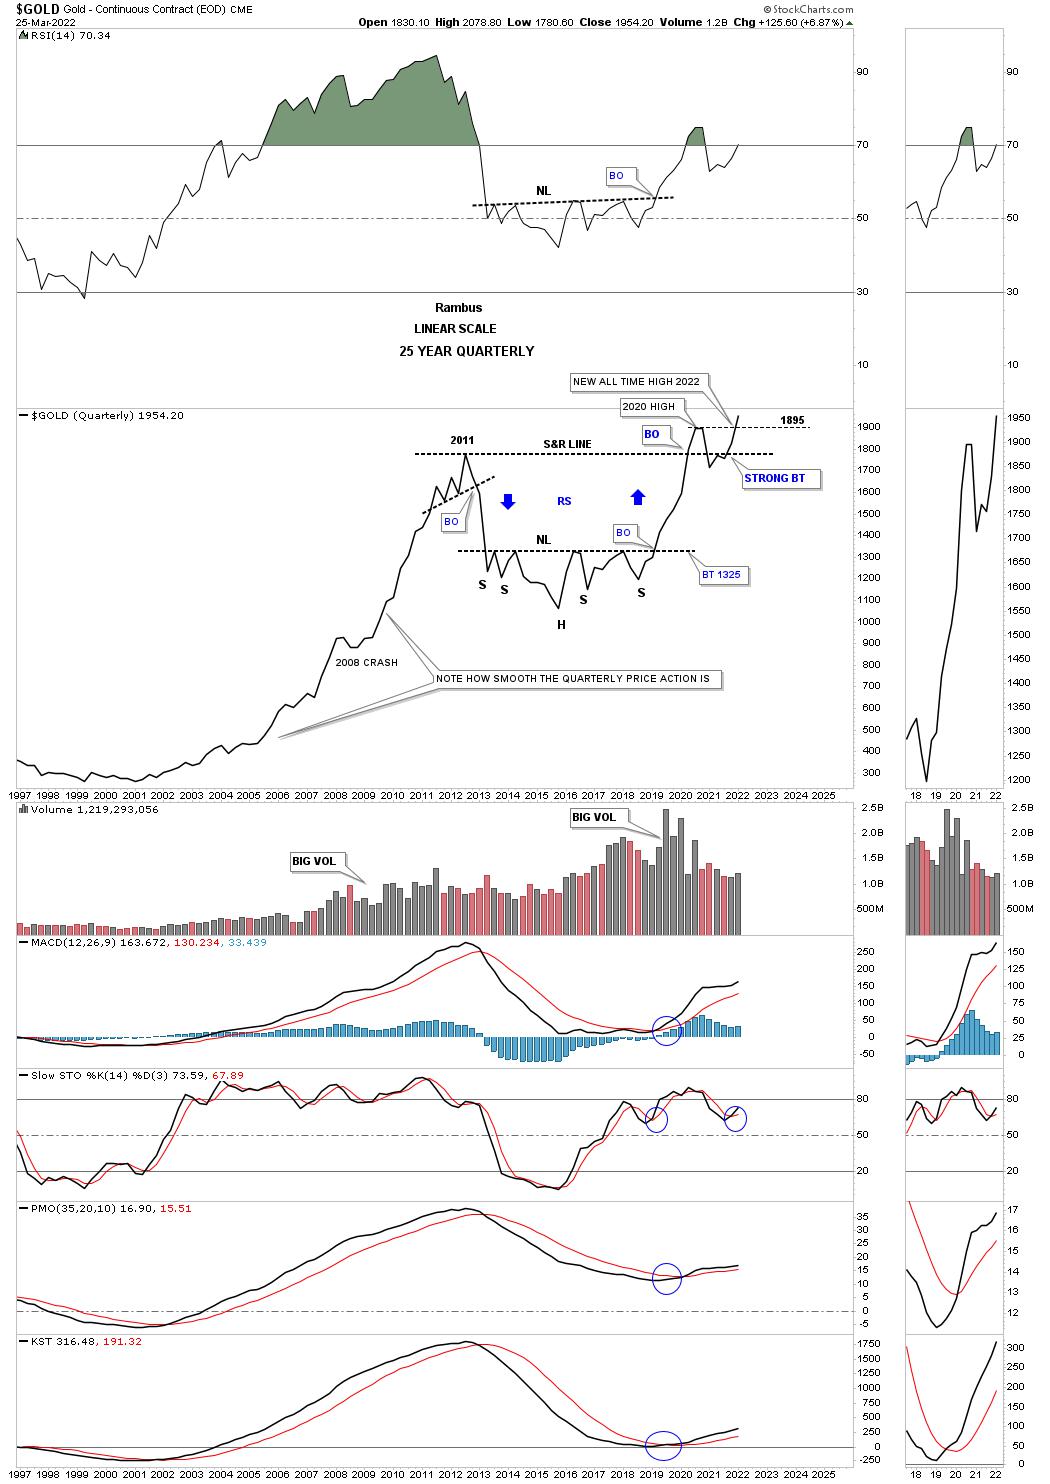
The first quarter of 2022 will end in just four more days of trading for the month of March. Gold is currently trading at the highest level since the 2020 high with the 2011 high holding support, previous resistance turning into support once tested from above. You can see something similar during the breakout of the support and resistance line in 2007, resistance turning into support when broken to the upside.
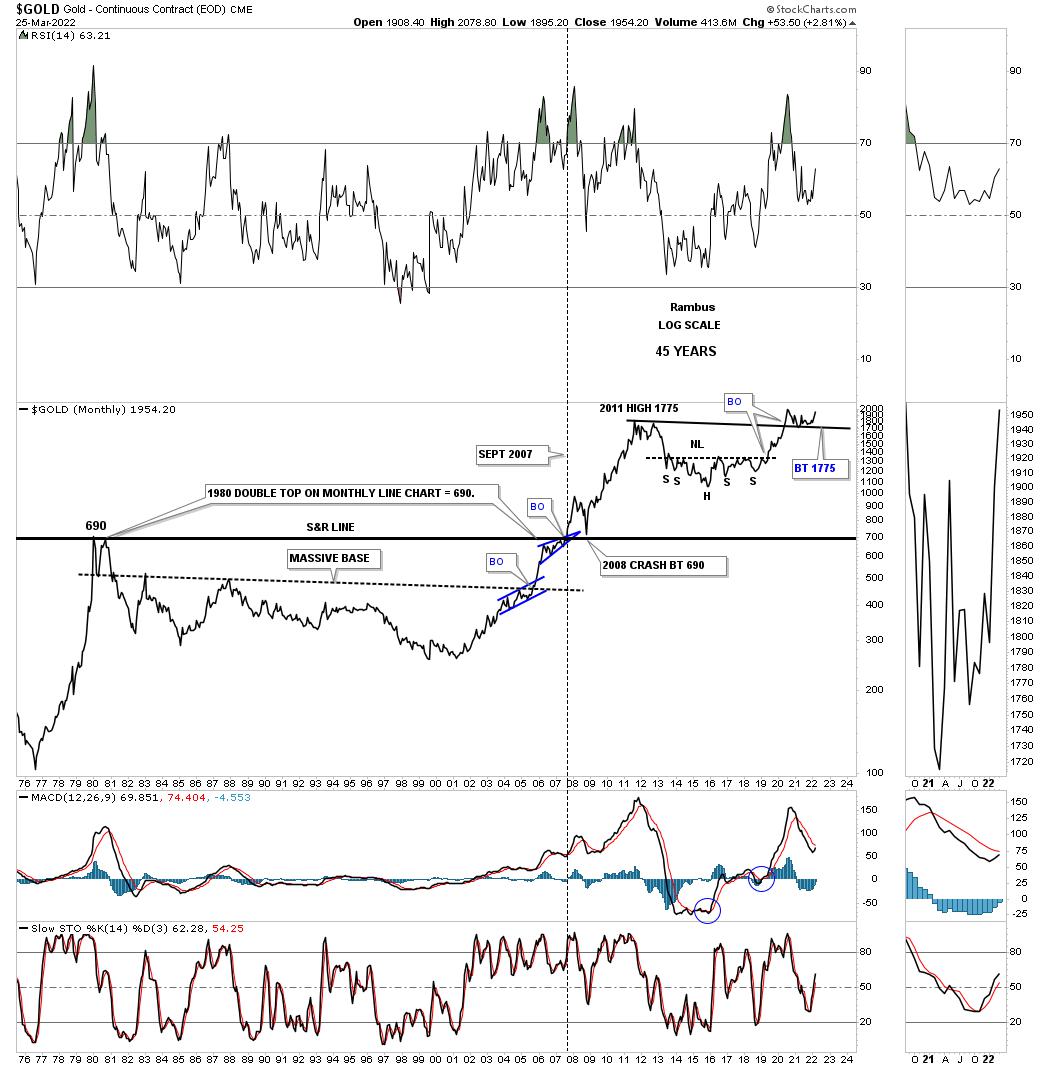
This face for Gold shows its massive H&S consolidation pattern which I’m viewing as a halfway pattern in the secular bull market that began at the 2000 low. You can measure the distance between the head and the neckline to get a minimum price objective for Gold which again is a minimum.

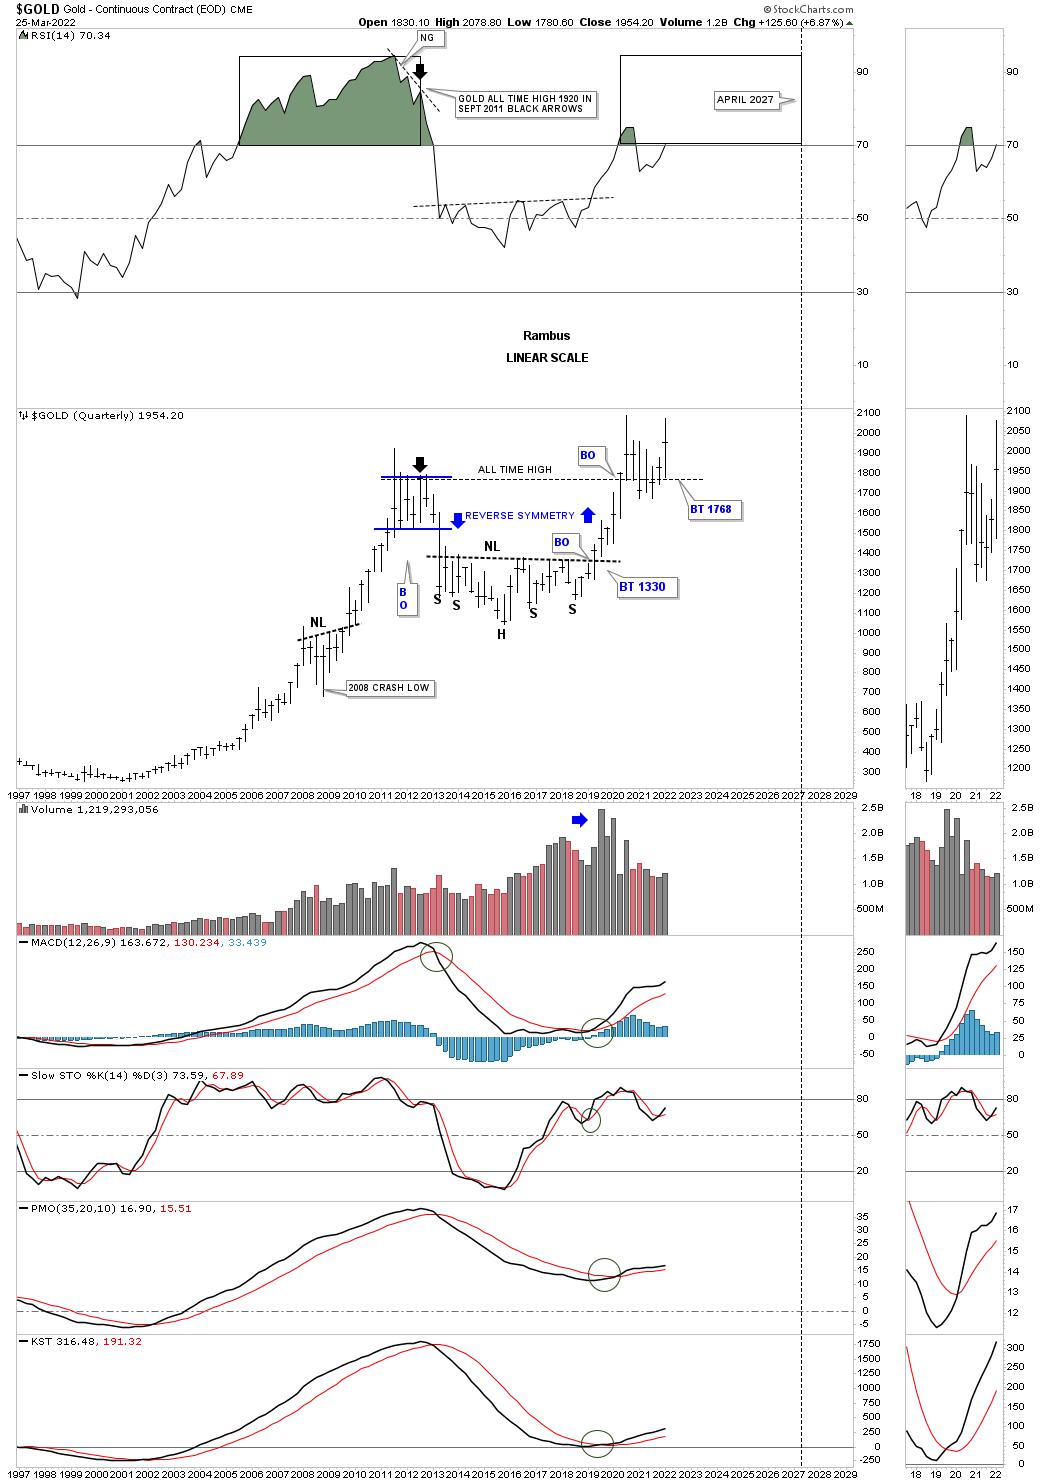
This next chart is a long term quarterly bar chart which is beginning to look very bullish. By that I mean look at the current quarterly bar and how the price action has held support on the backtest to the 2011 high. From my perspective all the work has been done with the backtesting process and now it is time for the real impulse move to take hold which by the end of the next quarter I expect to see the next quarterly bar much higher than the first quarterly bar for 2022. We won’t know for sure until the 2nd quarter is finished but the setup looks extremely bullish especially if we see a new all-time high being made in the next three months.
This next chart for Gold is the quarterly fractal chart we’ve been following for over a year or so which compares the 2000 trading range to the current 2020 trading range. Previously I mentioned that the month of March of 2022 we should see Gold trading at the top of the trading range which has happened. Now count the number of quarterly bars in the 2011 trading range and the 2020 trading range which is seven. The eighth quarterly bar made during the 2011 trading range broke through the bottom rail which confirmed the bear market. On April first of this year Gold will be starting to form its eighth quarterly bar which I believe will show a breakout to the upside inversely to the 2011 fractal.
What this chart also reveals to us is how similar the 2000 double bottom base and the 2016 H&S base are in both time and price as shown by the black rectangles. After the breakout from the double bottom base in 2000 the first consolidation pattern to have formed was the bullish rising wedge. If you count the number of quarterly bars in that bullish rising wedge you will count seven which is the same number as our current trading range. So if the blue bullish rising wedge was the first consolation pattern in the 2000 bull market is our current trading range the first consolidation pattern in the 2016 second leg up of the secular bull market?

Below is a quarterly line chart which really puts things in perspective for me. Again, in just four more days of trading Gold will begin its next quarterly bar of trading. On a quarterly closing price Gold is trading at a new all-time high. Remember a line chart will often show you a breakout before a bar chart does.
Another important aspect of this quarterly line chart is that it shows you how smooth the price action was during the bull market years from 2000 to 2011. The only real hook lower was the 2008 crash low and when the 2011 top was completed. Other than that Gold made a new higher high except for a few minor blips by the end of each quarter. Note the price action starting at the right shoulder low and how smooth it looks except for the backtest to the 2011 high.
If the Chartology plays out as expected the 2nd quarter of 2022 should be something to behold for the PM complex and for those that can ride the bull and not get bucked off. We could very well be in for the ride of a lifetime. All the best…Rambus
Read Full Story »»»
DiscoverGold
Gold Forecast: Cycles Point To April Bottom
By: Jim Curry | March 27, 2022
Recap of Last week
Last week's trading saw gold forming its low for the week in Tuesday's session, here doing so with the tag of the 1909.80 figure (April, 2022 contract). From there, a decent push higher was seen into later in the week, with the metal running up to a Thursday peak of 1967.20 - before backing off the same into Friday's session.
Gold's Short-Term Cycles
For the near-term action, the most recent strength for gold has come from our smallest-tracked wave, the 10-day component:
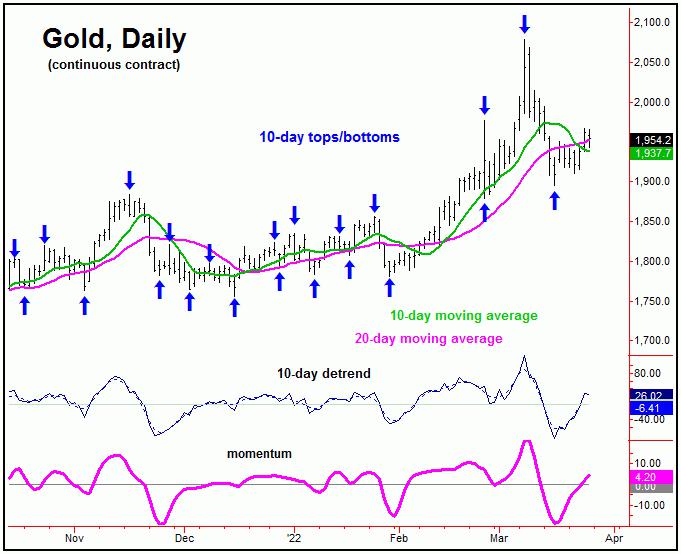
From last weekend: "for the very short-term, it looks like our 10-day cycle may have bottomed on Wednesday, which would be confirmed by any reversal above the 1952.00 figure (April, 2022 contract). If seen, the path would favor additional strength through the same, with the 10-day moving average acting as the normal minimum magnet to the upward phase of this component - a move which is now favored to end up as a countertrend affair."
As mentioned last weekend, the upward phase of the 10-day cycle was already suggested to be in force, and was later confirmed. In terms of price, our minimum expected magnet called for a rally back to the 10-day moving average for gold, which has easily been met. In terms of time, this 10-day wave is now some 6-7 trading days along, and thus is moving back into topping range.
Having said the above, there is a larger 20-day wave which is also influencing price action, with that particular cycle shown on our next chart:
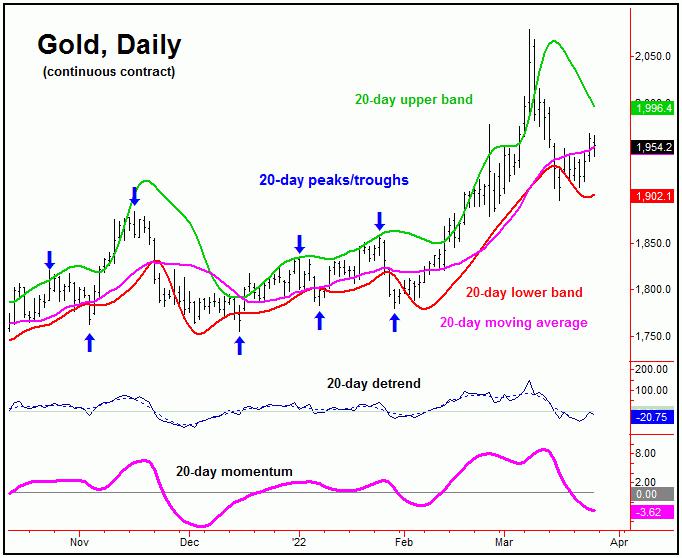
The fact that the 10-day cycle is bullishly right-translated means that the upward phase of this 20-day wave is also in force. With that, the next short-term peak should come from the combination of 10 and 20-day cycles, due to materialize in the coming days.
In terms of price, there is key resistance to the short-term upward phase at or into the 1986-2008 region for gold, which is the 50-61% retracement zone of the move down from the 2078 swing top to the 1895 swing low. This same range is also near our upper 20-day cycle band (i.e., 1996 and declining), and - if tested in the days ahead - would be an ideal area to watch for the next countertrend peak to form.
Gold's 72-Day Cycle
From the comments made in past articles, the last peak of significance was due to materialize, coming from the larger 72-day cycle, shown again below:
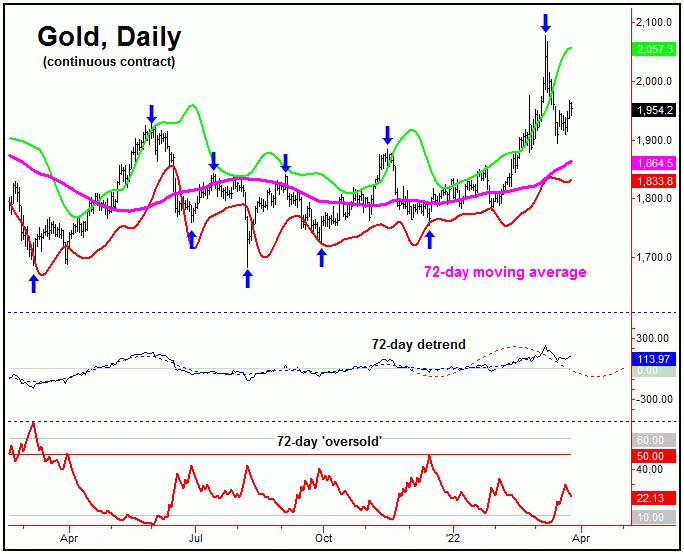
With the action seen in recent weeks, the downward phase of this 72-day wave has been confirmed to be in force, and with that is seen as pushing lower into the mid-April timeframe, plus or minus.
With the above then said and noted, a countertrend rally with the 10 and 20-day waves - if seen as expected in the days ahead - should give way to a lower lows for the larger 72-day cycle downward phase into mid-April, plus or minus. From there, we will need to be on the lookout for key indications of the next 72-day trough forming, as what follows should be another sizeable rally into the Summer months.
In terms of patterns, the downward phase of our 72-day cycle is favored to end up as a countertrend affair - against the mid-December, 2021 trough of 1755.30. If correct, the odds will favor a push back above the 2078.80 swing high on the next 72-day cycle upward phase into this Summer.
Going further with the above, lower lows for the swing into April, if seen as expected, would have us on the lookout for technical indications of the next 72-day trough forming. For one of those indications, I would like to see gold spiking down for a daily close below our lower 72-day cycle band, and - on the same day - a spike above our 72-day 'oversold' reference line.
From the comments made in recent articles, the aforementioned technical pattern with our 72-day band and 'oversold' indicator is one normally seen closer to 72-day troughs, just as the inverse of this pattern (and mentioned at that time) formed just a few days prior to the 2078.80 swing top.
For the mid-term picture, higher highs into the Summer months - if seen as expected - should set up a more important peak for the metal. From there, another sharp decline phase will be expected to play out into later this year, before turning back to strength into the Spring of 2023. More on all as we continue to move forward.
Read Full Story »»»
DiscoverGold
picture showing a gold BTC, well if BTC was actually backed by gold they would both be heading north on their way to 6 figures, at least BTC would for sure. they just dont get it, they just keep doing cheesy marketing and trying to attract retail to keep it propped up. by the time they figure it out the fed coin will be out, backed by gold, and BTC will just be a side show. too bad for both
XME Metals & Mining ETF Reaches Target Zone ... What's Next?
By: MPTrader | March 27, 2022
After a series of 13 chart posts dating from January 10 introducing MPTrader members to the bullish intermediate-term technical set-up in the industrial metals sector, Mike Paulenoff issued a warning signal to MPTrader members this past Thursday about XME (SPDR Metals and Mining ETF).
With XME trading at 61.85, up from 45.48 on January 10, and having satisfied his optimal upside target zone, Mike wrote:
"My pattern and momentum work argue strongly that XME is approaching a near-term peak in my target zone of 63 to 65, which is the next zone from where my work indicates the price structure will be vulnerable to profit-taking, and a downside pivot reversal that initiates a correction that will point to 52 to 54 prior to a resumption of longer-term uptrend strength."
As it turned out, XME went on to climb to a bull phase peak of 63.70 on Friday prior to closing at 63.33, a full 39% above Mike's January 10th introduction of his technical set-up work to MPTrader members.
What's next for XME given so many cross-currents are swirling around the financial markets?
Read Full Story »»»
DiscoverGold
$GDX miners holding in better than $GLD, worth noting as they sometimes lead the move higher
By: Options Mike | March 27, 2022
• $GDX miners holding in better than $GLD, worth noting as they sometimes lead the move higher. Nice hold of the 8D Friday.

Read Full Story »»»
DiscoverGold
Jack Chan: Gold Price Exclusive Update
By: Jack Chan | March 26, 2022

Our proprietary cycle indicator is UP.
To public readers of our updates, our cycle indicator is one of the most effective timing tool for traders and investors. It is not perfect, because periodically the market can be more volatile and can result in short term whipsaws. But overall, the cycle indicator provides us with a clear direction how we should be speculating.
Investors
During a major buy signal, investors can accumulate positions by cost averaging at cycle bottoms, ideally when prices are at or near the daily 200ema.
During a major sell signal, investors should be hedged or in cash.
Traders
Simply cost average in at cycle bottoms when prices are at or near the daily 200ema; and cost average out at cycle tops when prices are above the daily 50ema.

Gold sector is on long term SELL signal, but prices have found support at the 200ema.
A new buy signal here will confirm a new up leg for the bull market.

GLD is on short term sell signal.

GDX is on short term buy signal.

XGD.to is on short term buy signal.

GDXJ is on short term buy signal.
Analysis

Speculation pulling back from level of previous top.

Our ratio is on buy signal.

Trend is up for the dollar.

Trend is up for gold stocks.

Trend for gold is up.

And the multi year “cup with handle” is in progress.

A closer look at the handle and it is in progress of a cup with handle itself.

A consolidation is in progress.
Summary
Long term – on SELL signal.
Short term – on buy signals.
Gold sector cycle is UP.
$$$ We are holding long term positions.
Read Full Story »»»
DiscoverGold
COT - Commitments of Traders in Metals Futures Market Reports
By: Software North | March 25, 2022
Gold
Silver
Read Full Story »»»
DiscoverGold
Gold Mid-Tiers' Q4'21 Fundamentals
By: Adam Hamilton | March 25, 2022
The mid-tier and junior gold miners in their sector’s sweet spot for upside potential have powered higher in recent months. Amplifying gold’s young upleg, they have already surged to major breakouts. And the smaller gold miners’ gains are likely to grow much larger. Their recently-reported Q4’21 earnings season revealed ongoing strong fundamentals. Those along with inflation-driven higher gold prices will fuel big buying.
With Q1’22 already winding down, looking at the prior quarter’s operational and financial reports seems dated. But because most companies run on calendar years, the Q4 reporting deadlines are extended. In the US companies don’t have to report full-year 10-K results until 60 days after quarter-ends, compared to 40 days for 10-Q quarterlies. In Canada, the epicenter of the gold-mining universe, year-ends extend to 90 days!
So late March is about the earliest that enough mid-tier and junior gold miners have reported their full Q4 results to analyze them. Right after each quarterly earnings season, I dig into the latest reports from the top-25 component companies of the excellent GDXJ VanEck Junior Gold Miners ETF. With $5.1b in net assets midweek, this is the second-largest gold-stock ETF after its big-brother GDX major-gold-miners one.
Gold-stock tiers are defined by their production rates. Small juniors mine less than 300k ounces of gold annually, medium mid-tiers have outputs running from 300k to 1,000k, large majors yield over 1,000k, and huge super-majors operate at vast scales exceeding 2,000k. The mid-tiers offer a unique mix of sizable diversified production, good output-growth potential, and smaller market capitalizations ideal for outsized gains.
Mid-tiers are much-less-risky than juniors, and amplify gold’s uplegs much more than majors. Despite its name, GDXJ is overwhelmingly a mid-tier gold miners ETF. While it started out as a true junior one, that market alone proved too small to absorb the big capital inflows GDXJ attracted. I analyzed that evolution in depth in previous essays in this deep-research thread, which has been running for 23 quarters in a row now.
Speculator and investor interest in these smaller gold miners is mounting after GDXJ’s big 30.8% surge between late January to early March. But that only amplified gold’s parallel upleg in that span by 2.1x, which is weak for these high-potential stocks. Mid-tiers and juniors need herd sentiment to shift to bullish on gold, which only happens after it has rallied high enough for long enough. That key inflection point is nearing.
Much to its managers’ credit, GDXJ continues to improve. Unlike GDX, GDXJ isn’t saddled with the huge dead-weight super-majors unable to grow their production. GDXJ is far-better-diversified too, with its top-25 holdings only accounting for 61.4% of its total weightings mid-week compared to 88.5% in GDX. While handpicked fundamentally-superior individual stocks will easily best any ETF, GDXJ is the cream of the crop.
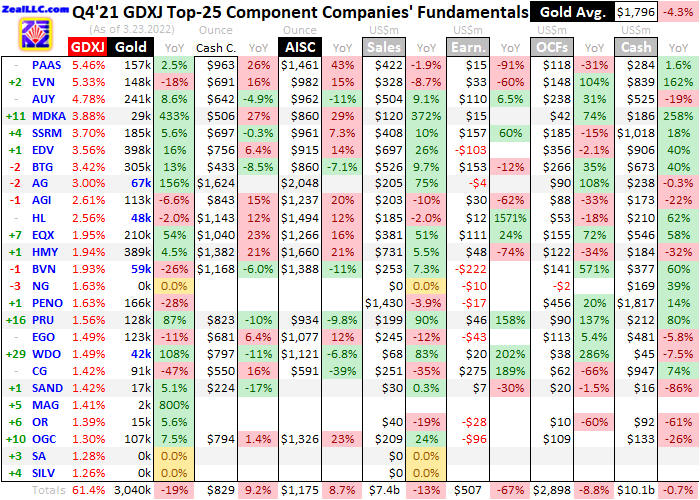
This table summarizes the operational and financial highlights from the GDXJ top 25 in Q4’21. These gold miners’ stock symbols aren’t all US listings, and are preceded by their rankings changes within GDXJ over this past year. The shuffling in their ETF weightings reflects shifting market caps, which reveal both outperformers and underperformers since Q4’20. Those symbols are followed by their current GDXJ weightings.
Next comes these gold miners’ Q4’21 production in ounces, along with their year-over-year changes from the comparable Q4’20. Output is the lifeblood of this industry, with investors generally prizing production growth above everything else. After are the costs of wresting that gold from the bowels of the earth in per-ounce terms, both cash costs and all-in sustaining costs. The latter help illuminate miners’ profitability.
That’s followed by a bunch of hard accounting data reported to securities regulators, quarterly revenues, earnings, operating cash flows, and resulting cash treasuries. Blank data fields mean companies hadn’t reported that particular data as of the middle of this week. The annual changes aren’t included if they would be misleading, like comparing negative numbers or data shifting from positive to negative or vice versa.
The elite mid-tier and junior gold miners filling GDXJ’s upper ranks generally reported good results last quarter, despite lower average gold prices. Fundamentally these smaller gold miners well-outperformed the major-dominated GDX stocks in Q4’21, a bullish omen. The entire gold-stock sector is set up for far-greater gains as gold powers higher on this raging inflation unleashed by the Fed’s epic money printing.
Like most exchange-traded funds, GDXJ is essentially market-capitalization-weighted. That’s the most-logical way to construct ETFs, reflecting relative capital amounts traders have deployed in component stocks. But shifting market caps continually alter ETF-component weightings and rankings, mixing up the bottom end of the GDXJ-top-25 stocks. This past year’s striking changes really affected data comparability.
Since Q4’20, two explorers have charged up into these rarefied ranks. Seabridge Gold has an incredible monster gold deposit, but may never build a mine after long decades of milking investors to pay corporate salaries. SilverCrest Metals also has no production, but is successfully making the rare transition from explorer to producer. It is constructing a nice new silver-and-gold mine scheduled to come online in Q2’22.
Traders bidding up these explorers’ market caps knocked out actual gold miners IAMGOLD and Fortuna Silver Mines from the GDXJ-top-25 ranks since Q4’20. Another mid-tier gold miner, the British Centamin, was displaced by the ascent of the tiny gold streamer Osisko Gold Royalties. These big composition changes in the GDXJ top 25 leave its aggregate Q4’21 data much-less-comparable to Q4’20’s totals than usual.
After decades of intensely studying and actively trading gold stocks, I’ve never understood the obsession with royalty and streamer companies. Their stocks are radically-overvalued, with high market caps way out of line with their meager underlying gold outputs, revenues, and earnings. Fundamentally nearly all the royalty and streamer plays are wildly-overpriced, way inferior to actual gold miners generating big profits.
In addition to these market-cap-driven component changes, GDXJ’s managers also made a big and very-welcome one. For years one of this “Junior Gold Miners” ETF’s largest components was Gold Fields, a South African super-major miner. In Q4’21 alone it produced a staggering 631k ounces of gold! A year ago in Q4’20 it mined 593k. Such a colossal gold miner belongs in GDX alone, it never should’ve been in GDXJ.
Gold Fields was finally booted out of GDXJ over this past year. But its massive production, sales, profits, operating cash flows, and cash hoard greatly boosted Q4’20’s GDXJ-top-25 totals. So it really needs to be excluded from that comparable quarter to get a clearer fundamental picture of how mid-tier and junior gold miners are faring. Thus adjusted Q4’20 means without Gold Fields, IAMGOLD, Fortuna Silver, and Centamin.
Last quarter these GDXJ-top-25 gold miners collectively produced 3,040k ounces of gold, which plunged 18.6% year-over-year. But that was heavily skewed by those four companies being included in Q4’20 but not Q4’21. Excluding them, these elite mid-tier and junior gold miners actually grew their total output an impressive 5.6% YoY! That crushed the GDX majors’ 6.2%-YoY shrinkage to 8,352k ounces of Q4’21 production.
Yet GDXJ and GDX actually have large overlap in their holdings. These GDXJ-top-25 stocks were mostly clustered between the 13th-to-35th-largest rankings in GDX. GDXJ effectively lops off the dozen biggest GDX stocks dominated by super-majors, then greatly expands the weightings of the rest. These GDXJ-top-25 stocks accounting for 61.4% of this ETF also currently comprise 18.6% of GDX’s total weightings.
I just analyzed the GDX-top-25 stocks’ Q4’21 resultsin last week’s essay if you want to compare their holdings or performances. Fully 12 of these GDXJ-top-25 stocks are also GDX-top-25 ones! I’ve long argued GDX and GDXJ holdings should be mutually-exclusive, leaving more-distinctive gold-stock ETFs that would better serve traders. But the gold-stock universe is likely too small to make that work for GDXJ.
Whether mid-tiers or true juniors producing less than 75k ounces per quarter, fully 3/5ths of the GDXJ top 25 reported higher production in Q4’21. The handful of actual junior primary gold miners have production highlighted in blue. With more exposure to smaller mid-tier and junior gold miners, GDXJ’s usefulness for traders continues to improve. It has way more upside potential during gold uplegs than major-dominated GDX.
Unlike the majors simply too big to grow fast regardless of how well they are managed, the mid-tier and junior gold miners are coming from much-smaller bases. These sweet-spot-for-upside-potential mid-tiers usually have a few mines or less, so expansions and new mine builds really boost their outputs. And the mid-tiers also have way-smaller market caps, making their stock prices far-more-responsive to capital inflows.
When mid-tiers’ lower production and market caps are combined with leveraged profits growth from higher gold prices, their upside potential during big gold uplegs trounces that of the majors. So the mid-tiers are easily the best gold stocks to own as this secular gold bull continues marching higher over coming years. Their future gold-production growth will far exceed the majors’, and their earnings aren’t done soaring.
Long-term gold-stock price levels ultimately depend on miners’ profitability, which is directly driven by the difference between prevailing gold prices and gold-mining costs. In per-ounce terms these are generally inversely proportional to gold production. That’s because gold mines’ operating costs are largely fixed during planning stages. Their designed throughputs limit the amounts of gold-bearing ore they can process.
That doesn’t change quarter to quarter, and requires about the same levels of infrastructure, equipment, and employees. The only real variable is the ore grades run through the fixed-capacity mills. Richer ores yield more gold ounces to spread the big fixed costs of mining across, lowering unit costs which boosts profitability. With adjusted production surging, the GDXJ top 25 should’ve reported lower unit costs in Q4’21.
Cash costs are the classic measure of gold-mining costs, including all cash expenses necessary to mine each ounce of gold. But they are misleading as a true cost measure, excluding the big capital needed to explore for gold deposits and build mines. So cash costs are best viewed as survivability acid-test levels for the mid-tier gold miners. They illuminate the minimum gold prices necessary to keep the mines running.
These elite mid-tiers’ and juniors’ average cash costs actually surged 9.2% YoY to $829 per ounce last quarter. While worse than expected, that is still better than the GDX top 25’s crazy 21.8% catapulting to an even-higher $853! Most of the GDXJ-top-25 gold miners were operating at much-lower cash costs than that $829 average implies. That was skewed way higher by extreme outlying costs from a couple stocks.
For years the major silver miners have been increasingly diversifying into gold, as it simply has far-better mining economics. Last year First Majestic Silver acquired its first pure gold mine to add to its stable of silver ones, but that has been plagued with super-high costs. Harmony Gold Mining’s old and very-deep South African mines are ever-more-expensive to run. Excluding these, GDXJ-top-25 cash costs averaged $750.
All-in sustaining costs are far superior than cash costs, and were introduced by the World Gold Council in June 2013. They add on to cash costs everything else that is necessary to maintain and replenish gold-mining operations at current output tempos. AISCs give a much-better understanding of what it really costs to run gold mines as ongoing concerns, and reveal mid-tier gold miners’ true operating profitability.
The GDXJ-top-25’s AISCs also surged a similar 8.7% YoY in Q4’21 to $1,175 per ounce, the highest on record! Again the smaller gold miners outperformed the bigger ones, with GDX-top-25 AISCs coming in up a hotter 14.5% YoY to a slightly-higher $1,188. Also again the GDXJ-top-25 AISCs look better if those super-high-cost operations of First Majestic and Harmony are excluded, averaging a much-milder $1,090.
But mining costs naturally creep higher during secular gold bulls, where rising prices make less-economic gold deposits mineable. Q4’21 was the 15th consecutive quarter where GDXJ-top-25 AISCs climbed on a year-over-year basis! The preceding four quarters saw them surge 11.5%, 11.2%, 12.8%, and 14.9% YoY, so Q4’21’s 8.7% jump was actually a moderation. Even $1,175 remains far below prevailing gold prices.
Those averaged $1,796 last quarter, slumping 4.3% YoY. The difference between quarterly gold prices and gold-mining AISCs offers a great proxy for mid-tier and junior profitability. That implies these GDXJ-top-25 gold miners earned $622 per ounce in Q4’21. Although that did fall 21.9% YoY, it was still better than the GDX-top-25 majors’ $608 that dropped 27.5% YoY. And unit earnings still remain high absolutely.
Q4’21’s $622-per-ounce sector mining profits are the seventh-highest on record after the preceding six quarters’. Those averaged $741, a stark contrast to the mere $413 average in the dozen quarters before those. Despite higher costs and lower gold prices, the mid-tier and junior gold miners continue to earn money hand-over-fist. And their earnings are poised to surge back higher in this current almost-done Q1’22.
Gold’s $1,873 average price so far this quarter is 4.2% better than Q4’21’s. It is already the third-highest ever witnessed, and should still be able to usurp Q4’20’s $1,876 to take second! And mid-tier AISCs are expected to flatten from here. Fully 17 of these GDXJ-top-25 miners gave full-year-2022 AISC guidance that averaged $1,165 per ounce. Q1’22’s $1,873 average gold less $1,165 AISCs would yield fat $708 profits!
Gold stocks amplify material gold upside so effectively because their earnings greatly leverage higher prevailing gold prices. If the GDXJ-top-25 gold miners pull in $708 per ounce this quarter, that would rank as their fourth-highest quarterly unit earnings ever. The last time this metric came in over $700 was back in Q4’20, when mid-tier and junior gold stocks and GDXJ itself were trading way up at much-higher prices.
Gold itself will almost certainly power way higher too. The reason even lowballed headline-CPI inflation is soaring 7.9% YoY is extreme Fed money printing. In just 24.6 months since March 2020’s pandemic-lockdown stock panic, the Fed ballooned its balance sheet by an absurd 115.3% or $4,796b! Effectively more than doubling the US money supply conjured up far more dollars to compete for and bid up price levels.
During the last similar inflation super-spikesin the 1970s, gold prices nearly tripled during the first then more than quadrupled in the second! The gold miners’ stocks shot stratospheric on that, generating life-changing wealth for contrarians deployed in them. Gold has always been the ultimate inflation hedge, as its supply growth is hard-limited by geology unlike fiat-money supplies. Gold-stock earnings amplify gold gains.
On the hard-accounting front, the GDXJ-top-25 gold miners’ total revenues fell 13.0% YoY to $7,435b. But when adjusted for those four producers included in Q4’20 but now replaced with non-mining explorers and royalty companies, overall sales actually grew 6.6% YoY. That’s again much better than the 5.7%-YoY revenues decline reported by the GDX top 25. The mid-tiers and juniors are fundamentally-superior.
Yet in Q4’21 their bottom-line accounting earnings under Generally Accepted Accounting Principles or other countries’ equivalents looked ugly. They plummeted 67.2% YoY to $507m, or 59.2% against that adjusted Q4’20 total! But this was heavily distorted by unusual items, one-off things flushed through income statements like mine impairments and impairment reversals. I always look for any larger ones.
Last quarter saw plenty of big unusual items, which netted out to offsetting another $446m of net income! That slashes the YoY decline in GDXJ-top-25 operating profits to 38.4% absolutely or 23.3% adjusted for those four companies. Q1’22 earnings should look much better, as managements often dump things like mine-impairment charges into Q4 results. Those are forgotten by the time year-end bonuses are calculated.
With weaker accounting profits, mid-tier and junior gold-stock valuations in classic trailing-twelve-month price-to-earnings-ratio terms shot up to 62.5x. That was an anomaly mostly driven by two outliers with extreme P/Es though, another explorer transforming into a miner MAG Silver and Hecla Mining. Without their 100x+ P/Es, the rest of the GDXJ top 25 averaged just 27.7x. Gold miners are generally undervalued.
With way-fewer estimates distorting operating cash flows than earnings, the former often provide a clearer picture of how gold miners’ businesses are actually doing. The $2,898b total OCFs reported by these elite mid-tier and junior gold stocks fell 8.8% YoY absolutely, but climbed 11.3% when Q4’20 is adjusted. Those fed fat cash treasuries totaling $10.1b, tying a record high for the GDXJ top 25 despite composition changes.
That slumped 0.7% YoY absolutely, but soared 27.7% when those four companies are removed from the comparable Q4’20. The mid-tier and junior gold miners will use those big cash hoards to grow their future production. They will continue expanding existing mines to boost their outputs, developing new mines, and buying other mines and sometimes entire companies. Such projects are underway at many of the GDXJ top 25.
The smaller gold miners are also prime acquisition targets for the majors, since those perpetually struggle to offset ongoing depletion from their large-scale operations. Building occasional new mines isn’t enough either, so most of majors’ growth comes from buying out entire mid-tier and junior gold companies. Those offers usually come at nice premiums, offering more upside for contrarians deploying capital in these stocks.
If you regularly enjoy my essays, please support our hard work! For decades we’ve published popular weeklyand monthlynewsletters focused on contrarian speculation and investment. These essays wouldn’t exist without that revenue. Our newsletters draw on my vast experience, knowledge, wisdom, and ongoing research to explain what’s going on in the markets, why, and how to trade them with specific stocks.
That holistic integrated contrarian approach has proven very successful. All 1,280 newsletter stock trades realized since 2001 averaged outstanding +20.7% annualized gains! Today our trading books are full of great fundamentally-superior mid-tier and junior gold and silver miners to ride their uplegs. These stocks have surged with gold breaking out, but still have massive room to run. Subscribe todayand get smarter and richer!
The bottom line is the mid-tier and junior gold miners in the sweet spot for stock-price upside potential just reported another strong quarter. Their adjusted production growth surged, far outperforming the majors’ drop. And these smaller gold miners still earned fat profits, despite rising mining costs and lower average gold prices. Those earnings will soar back higher in this current quarter on better gold levels and stabilizing costs.
The mid-tier and junior gold stocks still have lots of catch-up rallying left to do, both to reflect their superior fundamentals and this mounting gold upleg. That is destined to grow far larger too, as gold prices nearly tripled and more than quadrupled during the last similar inflation super-spikes in the 1970s. That naturally launched gold miners’ earnings and stock prices stratospheric, generating fortunes for contrarian traders.
Read Full Story »»»
DiscoverGold
$TM Thanks; U will never see another primary wave up, which gold and
silver are about to do, in our life times.
Gold now will look like a base tent, looking down from the top of the
grande Tetons.
HYPERINFLATION ALERT: Expect A Surge To $2,200 Near Term As Soaring Inflation Cripples Economies
March 23, 2022
https://kingworldnews.com/hyperinflation-alert-expect-a-surge-to-2200-near-term-as-soaring-inflation-cripples-economies/
$This Is Great For Gold, Plus Look At 3 Things Hitting All-Time Record Highs!
March 21, 2022
https://kingworldnews.com/this-is-great-for-gold-plus-look-at-3-things-hitting-all-time-record-highs/
$Great Panther Reports Fiscal Year 2021 Financial Results and Reiterates Positive Outlook for 2022
Production of 105,006 gold equivalent ounces with $185.7 million in revenues; 2022 outlook includes return to steady-state production and underground mine portal development in H2
(All dollar amounts expressed in US dollars unless otherwise noted)
TSX: GPR | NYSE American: GPL
https://www.greatpanther.com/news-media/news/great-panther-reports-fiscal-year-2021-financial-results-and-reiterates-positive-outlook-for-2022
$TM Thanks; Great Panther Announces Coricancha Mine Complex Exploration Results
March 01 2022 - 05:02PM
PR Newswire (US)
Results from the 2021 drill program extend mineralization and
indicate good continuity at high grades, confirming the importance of
the recently discovered Escondida vein.
https://www.greatpanther.com/news-media/news/great-panther-announces-coricancha-mine-complex-exploration-results
This news release constitutes a "designated news release" for the
purposes of the Company's prospectus supplement dated October 15, 2021,
to its short form base shelf prospectus dated September 10, 2021.
TSX: GPR | NYSE American: GPL
VANCOUVER, BC, March 1, 2022 /PRNewswire/ -
Great Panther Mining Limited (TSX: GPR) (NYSE-A: GPL) ("Great
Panther" or the "Company"), a growth-oriented precious metals producer
focused on the Americas, reports drill results from
the Coricancha Mine Complex ("Coricancha"), located in
the central Andes of Peru, approximately 90 kilometres
east of Lima. A total of 22 holes were completed over approximately
5,219 metres.
Exploration Highlights:
https://ih.advfn.com/stock-market/AMEX/great-panther-mining-GPL/stock-news/87428352/great-panther-announces-coricancha-mine-complex-ex
https://www.greatpanther.com
$In GOD We Trust - Real Money - AU Safety 6000yrs  )
)
https://www.kitconet.com/images/quotes_7a.gif?1493417496003


http://www.kitconet.com/images/live/au0001wb.gif
https://www.kitco.com/images/live/silver.gif?0.8344882022363285
Gold & Silver is the only REAL Legal Tender -
by The Founding Fathers for your -
Rights, Liberty and Freedom -
http://www.biblebelievers.org.au/monie.htm
https://www.usdebtclock.org/
God Bless
$HYPERINFLATION ALERT: Expect A Surge To $2,200 Near Term As Soaring Inflation Cripples Economies
March 23, 2022
https://kingworldnews.com/hyperinflation-alert-expect-a-surge-to-2200-near-term-as-soaring-inflation-cripples-economies/
$Gold Is The Only Truly Safe Holding, Plus This Will Be Extremely Bullish For Silver
March 16, 2022
https://kingworldnews.com/gold-is-the-only-truly-safe-holding-plus-this-will-be-extremely-bullish-for-silver/
$GCM Mining Provides Production Update; Declares April 15, 2022 Monthly Dividend; Announces 2021 Fourth Quarter and Year End Results Webcast
March 15, 2022
https://www.gcm-mining.com/news-and-investors/press-releases/press-releases-details/2022/GCMMining-Provides-Production-Update-Declares-April-15-2022-Monthly-Dividend-Announces-2021-Fourth-Quarter-and-Year-End-Results-Webcast/default.aspx
TORONTO, March 15, 2022 (GLOBE NEWSWIRE) --
GCM Mining Corp. (“GCM Mining” or the “Company”) (TSX: GCM, OTCQX: TPRFF) announced today that its Segovia Operations produced 17,184 ounces of gold in February 2022, up from 15,360 ounces of gold in February last year. This brings the total gold production for the first two months of 2022 to 33,658 ounces, up from 30,415 ounces in the first two months last year. Segovia’s trailing 12-months’ total gold production at the end of February 2022 was 209,632 ounces, up about 1.6% over last year.
GCM Mining processed a total of 48,512 tonnes in February 2022 at its Maria Dama plant at Segovia, representing a daily processing rate of 1,733 tonnes per day (“tpd”), compared with 42,345 tonnes and 1,512 tpd in February 2021. Segovia’s head grades averaged 12.2 g/t in February 2022 compared with 12.5 g/t in February last year. For the first two months of 2022, a total of 90,527 tonnes were processed at Segovia at an average head grade of 12.8 g/t compared with a total of 83,771 tonnes at an average head grade of 12.6 g/t in the first two months last year.
The Company continued to operate the new 200 tpd polymetallic plant at Segovia in test mode in February, processing an average of approximately 98 tpd of tailings resulting in the production of approximately 110 tonnes of zinc concentrate and approximately 86 tonnes of lead concentrate which have been stockpiled and are awaiting shipment once contractual agreements are finalized for the sale of the concentrates. Payable production from the concentrates in February 2022 is estimated to total approximately 91,000 pounds of zinc, 100,000 pounds of lead, 8,000 ounces of silver and less than 50 ounces of gold. Actual payable quantities are subject to change and will be finalized once the concentrates are shipped.
Monthly Dividend Declaration
GCM Mining announced today that its Board of Directors has declared the next monthly dividend of CA$0.015 per common share will be paid on April 15, 2022 to shareholders of record as of the close of business on March 31, 2022.
2021 Fourth Quarter and Year End Results Webcast
GCM Mining announced today that it will release its fourth quarter and annual results for 2021 after market close on Thursday, March 31, 2022 and will host a conference call and webcast on Friday, April 1, 2022 at 9:00 a.m. Eastern Time to discuss the results.
Webcast and call-in details are as follows:
Live Event link: https://edge.media-server.com/mmc/p/rizkrutc
Canada/ International Toll: 1 (647) 484-8332 PIN: 21424747#
Canada Toll Free: 1 (866) 455-3403 PIN: 21424747#
United States Toll: 1 (404) 400-0571 PIN: 21424747#
United States Toll Free: 1 (866) 374-5140 PIN: 21424747#
Colombia Toll: +57 601 485-0348 PIN: 21424747#
Conference ID: EV00133198
A replay of the webcast will be available at www.gcm-mining.com from Friday, April 1, 2022 until Friday, April 29, 2022.
About GCM Mining Corp.
GCM Mining is a mid-tier gold producer with a proven track record of mine building and operating in Latin America. In Colombia, the Company is the leading high-grade underground gold and silver producer with several mines in operation at Segovia Operations. Segovia produced 206,000 ounces of gold in 2021. In Guyana, the Company is advancing its fully funded Toroparu Project, one of the largest undeveloped gold/copper projects in the Americas, which is expected to commence production of more than 200,000 ounces of gold annually in 2024. GCM Mining pays a monthly dividend to its shareholders and has equity interests in Aris Gold Corporation (44%; TSX: ARIS; Colombia – Marmato), Denarius Metals Corp. (27%; TSX-V: DSLV; Spain – Lomero-Poyatos and Colombia – Guia Antigua, Zancudo) and Western Atlas Resources Inc. (26%; TSX-V: WA: Nunavut – Meadowbank).
Additional information on GCM Mining can be found on its website at www.gcm-mining.com and by reviewing its profile on SEDAR at www.sedar.com.
Cautionary Statement on Forward-Looking Information:
This news release contains "forward-looking information"----differ materially from those anticipated in such statements. Accordingly, the reader is cautioned not to place undue reliance on forward-looking statements.
For Further Information, Contact:
Mike Davies
Chief Financial Officer
(416) 360-4653
investorrelations@gcm-mining.com
https://www.gcm-mining.com/news-and-investors/press-releases/press-releases-details/2022/GCMMining-Provides-Production-Update-Declares-April-15-2022-Monthly-Dividend-Announces-2021-Fourth-Quarter-and-Year-End-Results-Webcast/default.aspx
Source: GCM Mining Corp.
View All News
$Sanctions against Russia threaten London gold and silver markets, Maguire says
9:16a ET Saturday, March 12, 2022
Dear Friend of GATA and Gold:
Russia, like China, has much more official gold than it has reported and
the two nations are considering using the "nuclear option" against the
petrodollar, London gold trader Andrew Maguire claims in his weekly
interview with Shane Morand for Kinesis Money.
That is, Maguire says, Russia would demand gold as payment for its oil
exports.
Further, Maguire says, the Bank of Russia's increasing acquisition of
domestically produced gold will reduce supply on the international
market, just as economic sanctions against Russia will reduce supply of
Russian silver to the London market.
The interruption of Russian silver supply to London, Maguire says, is
already imperiling silver delivery commitments and silver derivatives,
raising the threat of defaults.
Maguire's interview with Morand is 37 minutes long and can be viewed at
YouTube here:
https://www.youtube.com/watch?v=JJ0XM8fufOQ
CHRIS POWELL, Secretary/Treasurer
Gold Anti-Trust Action Committee Inc.
CPowell@GATA.org
$They’re Lying, Inflation Is Out Of Control And It’s Bullish For Gold & Silver
February 10, 2022
https://kingworldnews.com/theyre-lying-inflation-is-out-of-control-and-its-bullish-for-gold-silver/
$Expert Says GOLD Could Hit $100,000 Soon!! (Here's How)
78,050 views Mar 8, 2022
https://www.youtube.com/watch?v=35x8N7Va8zg
) ) S&P Metals & Mining $XME Call flow coming in to the 04/14 $63 & $64 CALLS
By: Money Flow Mel | March 23, 2022
• $XME Call flow coming in to the 04/14 $63 & $64 CALLS
Metals & Mining ETS: $AA $MP $CLF $X $NUE $CENX $NEM $FCX

Read Full Story »»»
DiscoverGold
$TM This Is Great For Gold, Plus Look At 3 Things Hitting All-Time Record Highs!
March 21, 2022
https://kingworldnews.com/this-is-great-for-gold-plus-look-at-3-things-hitting-all-time-record-highs/
$Great Panther Reports Fiscal Year 2021 Financial Results and Reiterates Positive Outlook for 2022
Production of 105,006 gold equivalent ounces with $185.7 million in revenues; 2022 outlook includes return to steady-state production and underground mine portal development in H2
(All dollar amounts expressed in US dollars unless otherwise noted)
$TSX: GPR | NYSE American: GPL
https://www.greatpanther.com/news-media/news/great-panther-reports-fiscal-year-2021-financial-results-and-reiterates-positive-outlook-for-2022
$TM Thanks; Great Panther Announces Coricancha Mine Complex Exploration Results
March 01 2022 - 05:02PM
PR Newswire (US)
Results from the 2021 drill program extend mineralization and
indicate good continuity at high grades, confirming the importance of
the recently discovered Escondida vein.
https://www.greatpanther.com/news-media/news/great-panther-announces-coricancha-mine-complex-exploration-results
This news release constitutes a "designated news release" for the
purposes of the Company's prospectus supplement dated October 15, 2021,
to its short form base shelf prospectus dated September 10, 2021.
TSX: GPR | NYSE American: GPL
VANCOUVER, BC, March 1, 2022 /PRNewswire/ -
Great Panther Mining Limited (TSX: GPR) (NYSE-A: GPL) ("Great
Panther" or the "Company"), a growth-oriented precious metals producer
focused on the Americas, reports drill results from
the Coricancha Mine Complex ("Coricancha"), located in
the central Andes of Peru, approximately 90 kilometres
east of Lima. A total of 22 holes were completed over approximately
5,219 metres.
Exploration Highlights:
https://ih.advfn.com/stock-market/AMEX/great-panther-mining-GPL/stock-news/87428352/great-panther-announces-coricancha-mine-complex-ex
https://www.greatpanther.com
$In GOD We Trust - Real Money - AU Safety 6000yrs )
https://www.kitconet.com/images/quotes_7a.gif?1493417496003
http://www.kitconet.com/images/live/au0001wb.gif
https://www.kitco.com/images/live/silver.gif?0.8344882022363285
Gold & Silver is the only REAL Legal Tender -
by The Founding Fathers for your -
Rights, Liberty and Freedom -
http://www.biblebelievers.org.au/monie.htm
https://www.usdebtclock.org/
God Bless
Gold Stocks Showing Relative Strength
By: Jordan Roy-Byrne | March 22, 2022
After nearly reaching an all-time high, Gold is correcting and consolidating. It needs some time to digest the recent surge before attempting to break to a new all-time high.
Since Gold is correcting and declined more than $150/oz, we can assume the miners, juniors, and silver stocks are lagging as they typically do.
Wrong!
The gold stocks (and silver stocks) are outperforming Gold during this correction.
There is quite a lot of evidence.
First, Gold filled its gap from March 1, when it declined below $1908. The VanEck Gold Miners ETF (NYSE:GDX), VanEck Junior Gold Miners ETF (NYSE:GDXJ), and the ETFMG Prime Junior Silver Miners ETF (NYSE:SILJ) did not fill their respective gaps from March 1.
Second, take a look at the individual daily candles over the past eight days. Gold has six days with black candles (which can signal distribution), while the miners only have two.
Finally, Gold has retraced 62% of the surge from the January low. The miners only retraced 38%.
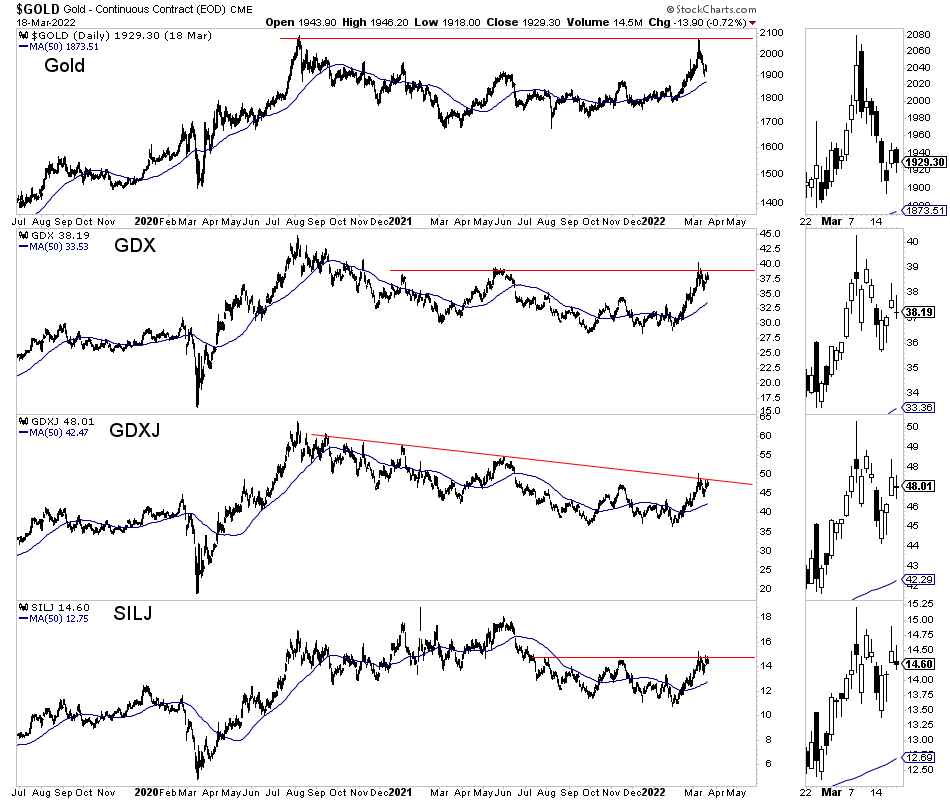
Gold:GDX:GDXJ:SILJ Daily Chart
As I explained last week, Gold is in a very bullish setup with the potential to explode higher after the current correction.
Given that potential, one should not be surprised to see relative strength in the miners. They are sniffing out what is to come over the months ahead.
If you have followed my work, you understand that I prefer to be conservative, reasonable, and contrarian against many that promote Gold and Silver with fanaticism.
Now is not the time for any of that.
A super bullish setup is in place, and this market could go vertical after this correction.
Read Full Story »»»
DiscoverGold
3 Gold Stocks: A Solid Bet Against World Volatility
By: Schaeffer's Investment Research | March 22, 2022
• Why Buy Gold Stocks?
You've heard it before: Gold is known for volatility and its uncanny ability to rise during negative cycles. In fact, its unpredictable nature causes some investors to head for the hills (and not the "there's gold in them thar hills" variety).
However, with the Russian invasion and the seemingly impossible task of "calming down" inflation, it's possible that gold stocks might offer a great option for investors, particularly if rampant uncertainty continues to stick around for the long term.
Think you might be interested in purchasing gold stocks? Read on for our top picks, then learn more about other inflation-proof stocks worth the price.
WHY BUY GOLD STOCKS?
Buying gold stocks = antiquated? As a symbol of monetary payment, it may seem like such an antiquated relic that it seems as if you're putting your money in a time warp. For every investor you find that pooh-poohs gold's value, you'll also find investors who look for alternative solutions beyond our current prevailing form of currency, paper money.
Naturally, holding gold in its physical form doesn't necessarily appeal. Storing gold at home carries a large risk and storing it can add up in cost over time. Beyond gold bullion and coins (which obviously offers less of a storage problem than gold bars), you can invest in a few different options, including gold exchange-traded funds (ETFs) and mutual funds, gold futures and options and gold mining options.
• Gold ETFs and mutual funds: You can turn to gold exchange-traded funds (ETFs) through any brokerage or IRA. You'll pay less for these passive funds due to historically low expense ratios compared to mutual funds. However, you may want to opt for actively managed mutual funds due to their diversification, ease of ownership and low initial minimum investment.
• Gold futures and options: Holding gold futures means that you buy or sell gold on a particular date in the future using futures contracts. You can also search for low margin requirements and low commissions. Options, on the other hand, give you an option to buy the futures contract within a certain time frame at a preset price. Note that futures may give you a cheaper way to buy or sell gold over options.
• Gold mining companies: You can also directly invest in gold mining companies through a brokerage or IRA. It's a good opportunity for investors who have a lot of time to dedicate toward researching the pros and cons of various gold mining companies.
3 GOLD STOCKS WORTH EXPLORING
We'll focus on gold mining companies in this piece in lieu of gold ETFs and mutual funds, futures and options. Let's check out several gold mining stocks you may want to consider.
Barrick Gold Corporation (NYSE: GOLD)
Barrick Gold Corporation, a sector-leading gold and copper producer, lists on the New York Stock Exchange under the symbol GOLD and on the Toronto Stock Exchange under the symbol ABX. Barrick recently merged with Randgold Resources and combined all gold mines in Nevada with Newmont Corporation in a joint venture called Nevada Gold Mines. The company operates the Cortez, Carlin and Turquoise Ridge in Nevada, Loulo-Gounkoto in Mali, Kibali in the Democratic Republic of the Congo and Pueblo Viejo in the Dominican Republic. The company operates gold and copper mines and projects in 13 countries in North and South America, Africa, Papua New Guinea and Saudi Arabia.
Barrick's year-end profit sheet showed net cash at $130 million after the record cash distribution of $1.4 billion to shareholders. Its Q4 dividend increased 11% to 10 cents per share. In addition, Nevada Gold Mines achieved its highest quarterly production since its formation and shored up a strong Q4 for Lumwana with Jabal Sayid at the top end of the production guidance range.
The company showed an operating cash flow of $1.4 billion and free cash flow of $0.7 billion for Q4 and net cash of $130 million after a record $1.4 billion distribution to shareholders in 2021. The company also had 2021 net earnings of $1.14 per share and adjusted net earnings of $1.16 per share.
Gold Fields Ltd. (NYSE: GFI)
Gold Fields Ltd., headquartered in Johannesburg, South Africa, is a gold mining company that produces gold and operates mines. Its operating mines are located in Australia, Ghana, Peru and South Africa.
Basic earnings for 2021 increased by 9% year-over-year to $789 million or $0.89 per share and headline earnings for 2021 increased 22% year-over-year to $890 million or $1 per share.
Normalized earnings for the year were 6% higher at $929 million or $1.05 per share
Adjusted free cash flow from the operations for the year was $913 million compared to the $868 million generated in 2020. The company also saw a decrease of $100 million of net debt, ending the year at $969 million, with a net debt to adjusted EBITDA ratio of 0.40x. Net debt was $1,069 million in 2020 with a net debt to adjusted EBITDA ratio of 0.56x at the end of 2020.
Wheaton Precious Metals Corporation (NYSE: WPM)
Wheaton Precious Metals Corporation, headquartered in Vancouver, British Columbia, Canada, is a mining company that sells precious metals in Canada and internationally. The company sells gold, silver, palladium and cobalt deposits and has agreements for 23 operating mining assets and 10 development stage projects.
The company saw nearly $200 million in operating cash flow during Q4 2021 and a record $845 million during the whole year in 2021. It also saw $278 million in revenue during Q4 and a record $1.2 billion during 2021, with $132 million in adjusted net earnings and a record $592 million during 2021.
The company produced 752,958 gold equivalent ounces and also announced a new precious metal purchase agreement on Artemis Gold Inc.’s Blackwater Gold Project and announced gold and platinum production on Generation Mining Limited’s Marathon Project. The company also declared a quarterly dividend of $0.15 per common share.
READY TO BUY GOLD MINING STOCKS?
Even if it seems to you that buying gold mining stocks may seem like going backward. The fact is, they're commodities. You're not going to get the benefit of dividend-paying stocks with gold stocks, and historically, dividend-paying stocks offer a great hedge against inflation.
However, it's worth noting that historically, gold has also offered a hedge against inflation. It's worth some major consideration.
Read Full Story »»»
DiscoverGold
A reversal in optimism suggests the metals and mining industry group continues higher
By: SentimenTrader | March 22, 2022
• The optimism index reversed from a pessimistic level relative to its recent range, triggering a buy signal for the metals and mining industry with a 75% win rate.
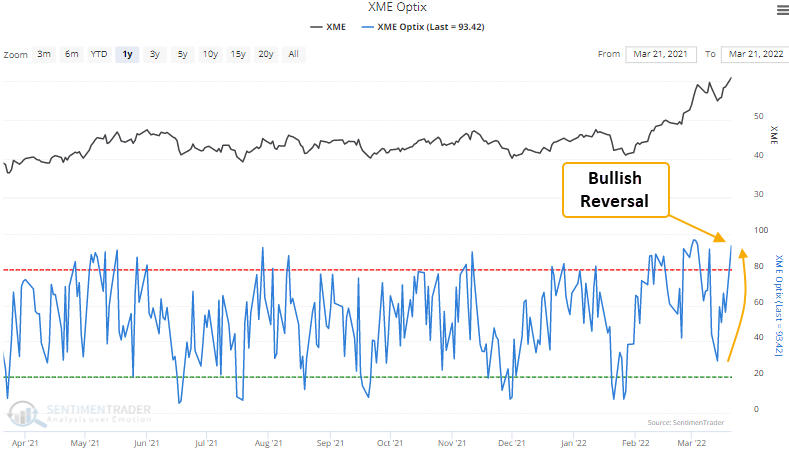
Read Full Story »»»
DiscoverGold
Gold's 3rd historical expansion phase starting now.
When you're lucky enough to have the inclining 7 & 14 year moving averages coiled tight below you!
Gold's 3rd historical expansion phase starting now.
— Patrick Karim (@badcharts1) March 20, 2022
When you're lucky enough to have the inclining 7 & 14 year moving averages coiled tight below you!#xauusd #xagusd #inflation pic.twitter.com/sqx6X14iRJ
$Gold Is The Only Truly Safe Holding, Plus This Will Be Extremely Bullish For Silver
March 16, 2022
https://kingworldnews.com/gold-is-the-only-truly-safe-holding-plus-this-will-be-extremely-bullish-for-silver/
$GCM Mining Provides Production Update; Declares April 15, 2022 Monthly Dividend; Announces 2021 Fourth Quarter and Year End Results Webcast
March 15, 2022
https://www.gcm-mining.com/news-and-investors/press-releases/press-releases-details/2022/GCMMining-Provides-Production-Update-Declares-April-15-2022-Monthly-Dividend-Announces-2021-Fourth-Quarter-and-Year-End-Results-Webcast/default.aspx
TORONTO, March 15, 2022 (GLOBE NEWSWIRE) --
GCM Mining Corp. (“GCM Mining” or the “Company”) (TSX: GCM, OTCQX: TPRFF) announced today that its Segovia Operations produced 17,184 ounces of gold in February 2022, up from 15,360 ounces of gold in February last year. This brings the total gold production for the first two months of 2022 to 33,658 ounces, up from 30,415 ounces in the first two months last year. Segovia’s trailing 12-months’ total gold production at the end of February 2022 was 209,632 ounces, up about 1.6% over last year.
GCM Mining processed a total of 48,512 tonnes in February 2022 at its Maria Dama plant at Segovia, representing a daily processing rate of 1,733 tonnes per day (“tpd”), compared with 42,345 tonnes and 1,512 tpd in February 2021. Segovia’s head grades averaged 12.2 g/t in February 2022 compared with 12.5 g/t in February last year. For the first two months of 2022, a total of 90,527 tonnes were processed at Segovia at an average head grade of 12.8 g/t compared with a total of 83,771 tonnes at an average head grade of 12.6 g/t in the first two months last year.
The Company continued to operate the new 200 tpd polymetallic plant at Segovia in test mode in February, processing an average of approximately 98 tpd of tailings resulting in the production of approximately 110 tonnes of zinc concentrate and approximately 86 tonnes of lead concentrate which have been stockpiled and are awaiting shipment once contractual agreements are finalized for the sale of the concentrates. Payable production from the concentrates in February 2022 is estimated to total approximately 91,000 pounds of zinc, 100,000 pounds of lead, 8,000 ounces of silver and less than 50 ounces of gold. Actual payable quantities are subject to change and will be finalized once the concentrates are shipped.
Monthly Dividend Declaration
GCM Mining announced today that its Board of Directors has declared the next monthly dividend of CA$0.015 per common share will be paid on April 15, 2022 to shareholders of record as of the close of business on March 31, 2022.
2021 Fourth Quarter and Year End Results Webcast
GCM Mining announced today that it will release its fourth quarter and annual results for 2021 after market close on Thursday, March 31, 2022 and will host a conference call and webcast on Friday, April 1, 2022 at 9:00 a.m. Eastern Time to discuss the results.
Webcast and call-in details are as follows:
Live Event link: https://edge.media-server.com/mmc/p/rizkrutc
Canada/ International Toll: 1 (647) 484-8332 PIN: 21424747#
Canada Toll Free: 1 (866) 455-3403 PIN: 21424747#
United States Toll: 1 (404) 400-0571 PIN: 21424747#
United States Toll Free: 1 (866) 374-5140 PIN: 21424747#
Colombia Toll: +57 601 485-0348 PIN: 21424747#
Conference ID: EV00133198
A replay of the webcast will be available at www.gcm-mining.com from Friday, April 1, 2022 until Friday, April 29, 2022.
About GCM Mining Corp.
GCM Mining is a mid-tier gold producer with a proven track record of mine building and operating in Latin America. In Colombia, the Company is the leading high-grade underground gold and silver producer with several mines in operation at Segovia Operations. Segovia produced 206,000 ounces of gold in 2021. In Guyana, the Company is advancing its fully funded Toroparu Project, one of the largest undeveloped gold/copper projects in the Americas, which is expected to commence production of more than 200,000 ounces of gold annually in 2024. GCM Mining pays a monthly dividend to its shareholders and has equity interests in Aris Gold Corporation (44%; TSX: ARIS; Colombia – Marmato), Denarius Metals Corp. (27%; TSX-V: DSLV; Spain – Lomero-Poyatos and Colombia – Guia Antigua, Zancudo) and Western Atlas Resources Inc. (26%; TSX-V: WA: Nunavut – Meadowbank).
Additional information on GCM Mining can be found on its website at www.gcm-mining.com and by reviewing its profile on SEDAR at www.sedar.com.
Cautionary Statement on Forward-Looking Information:
This news release contains "forward-looking information"----differ materially from those anticipated in such statements. Accordingly, the reader is cautioned not to place undue reliance on forward-looking statements.
For Further Information, Contact:
Mike Davies
Chief Financial Officer
(416) 360-4653
investorrelations@gcm-mining.com
https://www.gcm-mining.com/news-and-investors/press-releases/press-releases-details/2022/GCMMining-Provides-Production-Update-Declares-April-15-2022-Monthly-Dividend-Announces-2021-Fourth-Quarter-and-Year-End-Results-Webcast/default.aspx
Source: GCM Mining Corp.
View All News
$Sanctions against Russia threaten London gold and silver markets, Maguire says
9:16a ET Saturday, March 12, 2022
Dear Friend of GATA and Gold:
Russia, like China, has much more official gold than it has reported and
the two nations are considering using the "nuclear option" against the
petrodollar, London gold trader Andrew Maguire claims in his weekly
interview with Shane Morand for Kinesis Money.
That is, Maguire says, Russia would demand gold as payment for its oil
exports.
Further, Maguire says, the Bank of Russia's increasing acquisition of
domestically produced gold will reduce supply on the international
market, just as economic sanctions against Russia will reduce supply of
Russian silver to the London market.
The interruption of Russian silver supply to London, Maguire says, is
already imperiling silver delivery commitments and silver derivatives,
raising the threat of defaults.
Maguire's interview with Morand is 37 minutes long and can be viewed at
YouTube here:
https://www.youtube.com/watch?v=JJ0XM8fufOQ
CHRIS POWELL, Secretary/Treasurer
Gold Anti-Trust Action Committee Inc.
CPowell@GATA.org
$They’re Lying, Inflation Is Out Of Control And It’s Bullish For Gold & Silver
February 10, 2022
https://kingworldnews.com/theyre-lying-inflation-is-out-of-control-and-its-bullish-for-gold-silver/
$Expert Says GOLD Could Hit $100,000 Soon!! (Here's How)
78,050 views Mar 8, 2022
https://www.youtube.com/watch?v=35x8N7Va8zg
) ) Elliott Wave analysis: GDX Ready For A Rally?
By: Avi Gilburt | March 17, 2022
• Following the Elliott Wave analysis:
It would seem we have attained our targets for this pullback, and we may now have an initial indication that we are ready to rally again.
As I outlined in silver, we have now dropped down to our support box for wave 4, in an a-b-c corrective fashion. Moreover, we also got the 5th wave of the c-wave with the positive divergence I like to see on the 144-minute silver chart. And, once we get back over 25.25, I think we will be starting our wave 5 in the leading diagonal I have been tracking for silver. But, keep in mind, wave 5 will take shape as an (a)(b)(c) structure, since all waves within a diagonal take shape with 3-wave structures. So, I am not expecting an impulsive move up off these lows to be evident.
However, in GDX, we have also reached a point of (a)=(c), along with appropriate divergences. We also now have a potential (i)(ii) structure off those lows which would point us up towards the 39.50 region to complete wave i of 5 of (iii), which should ultimately take us north of 45. I would actually prefer to see it take us to the 47-50 region over the coming months.
As far as GLD is concerned, we came down to the bottom of our pivot for wave 4, and we seem to have a reasonable micro 5 wave rally begun off that low.
Overall, I am expecting today’s low to hold, and that we can see bigger signals over the coming week of the next major rally taking hold.
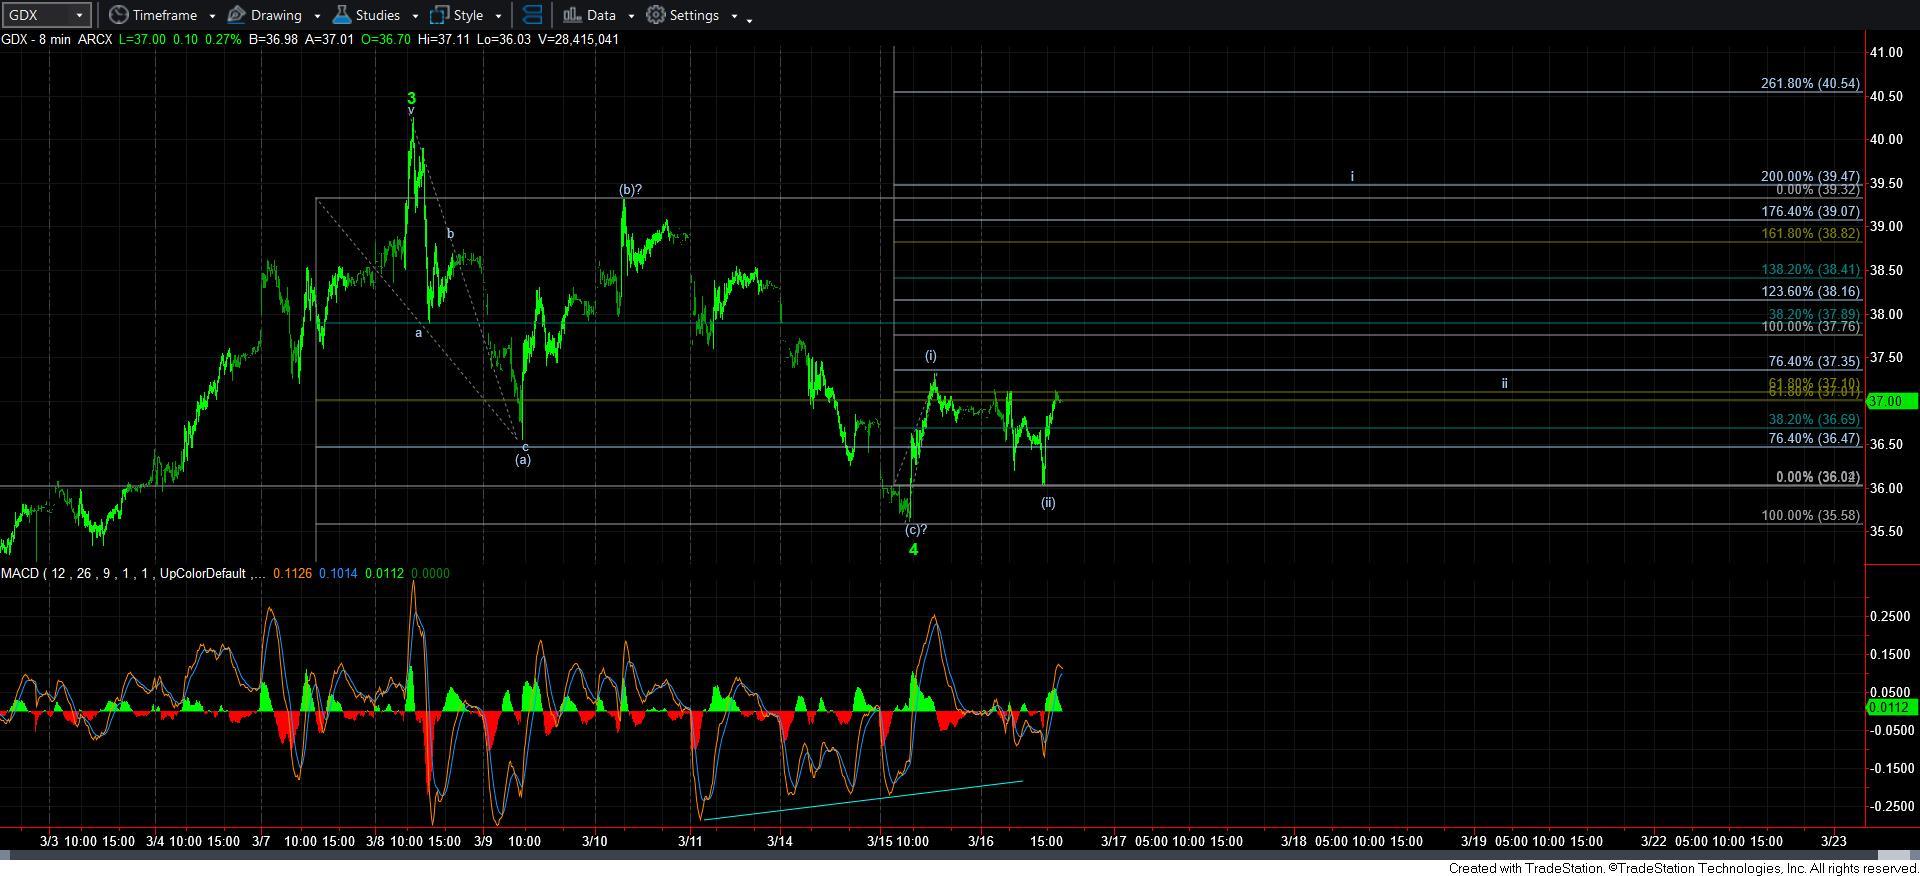
5minES
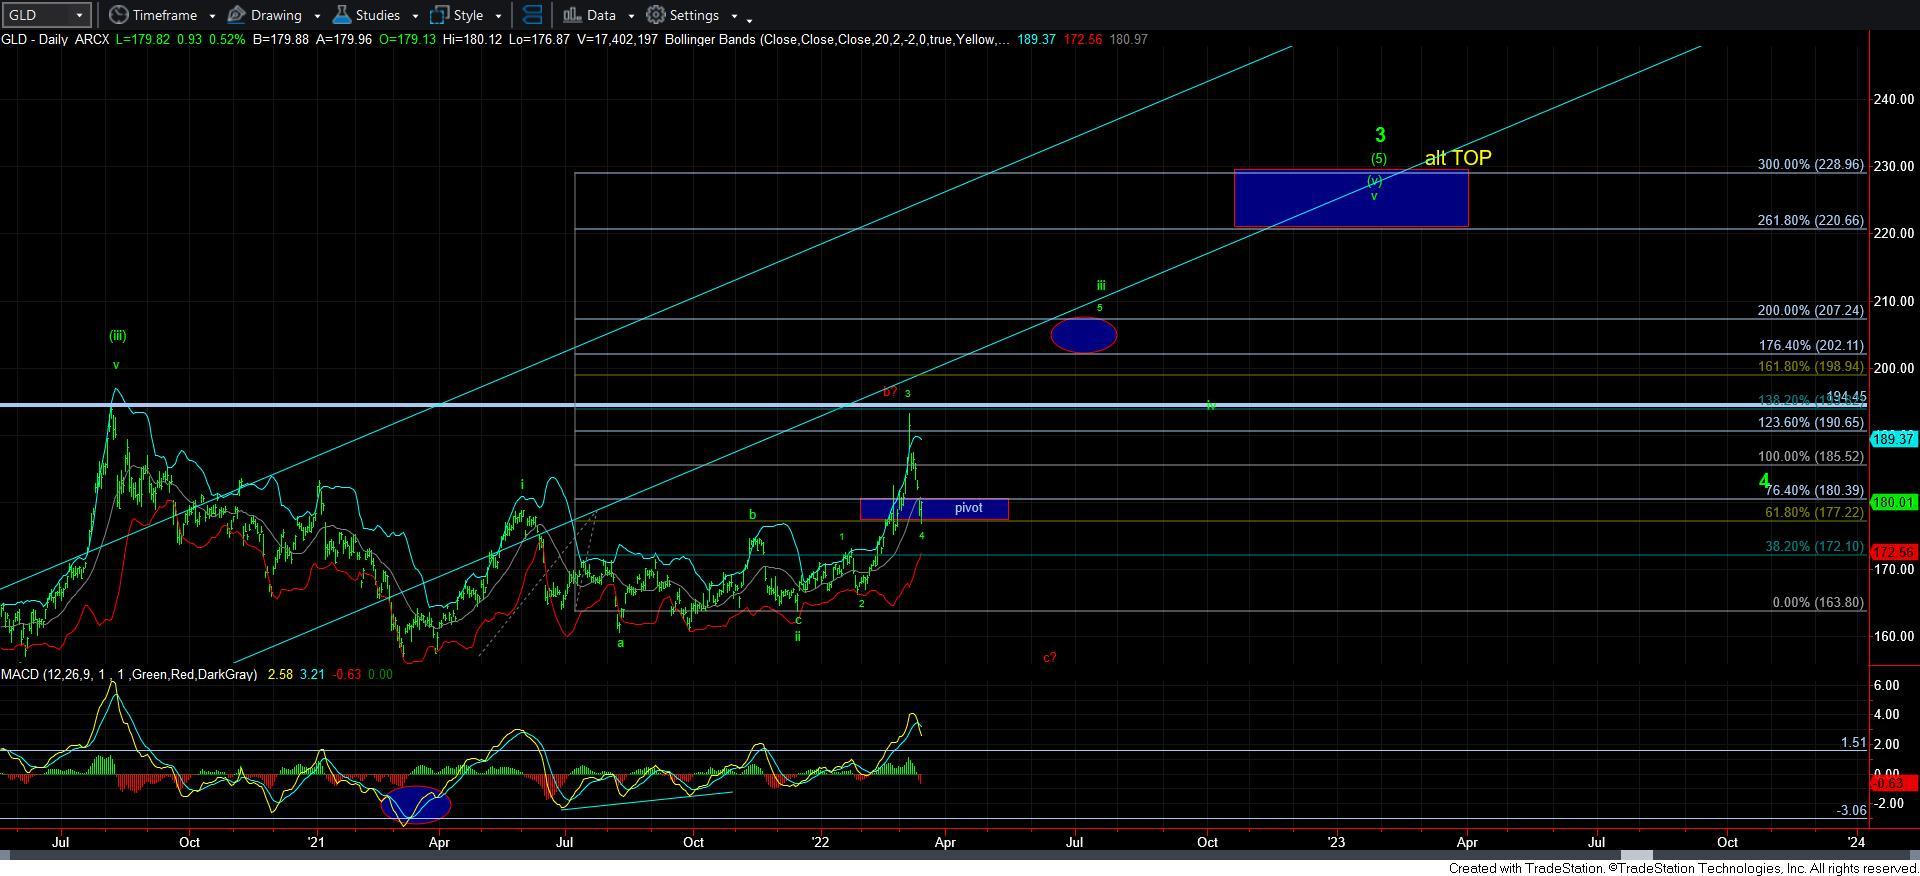
5minSPX
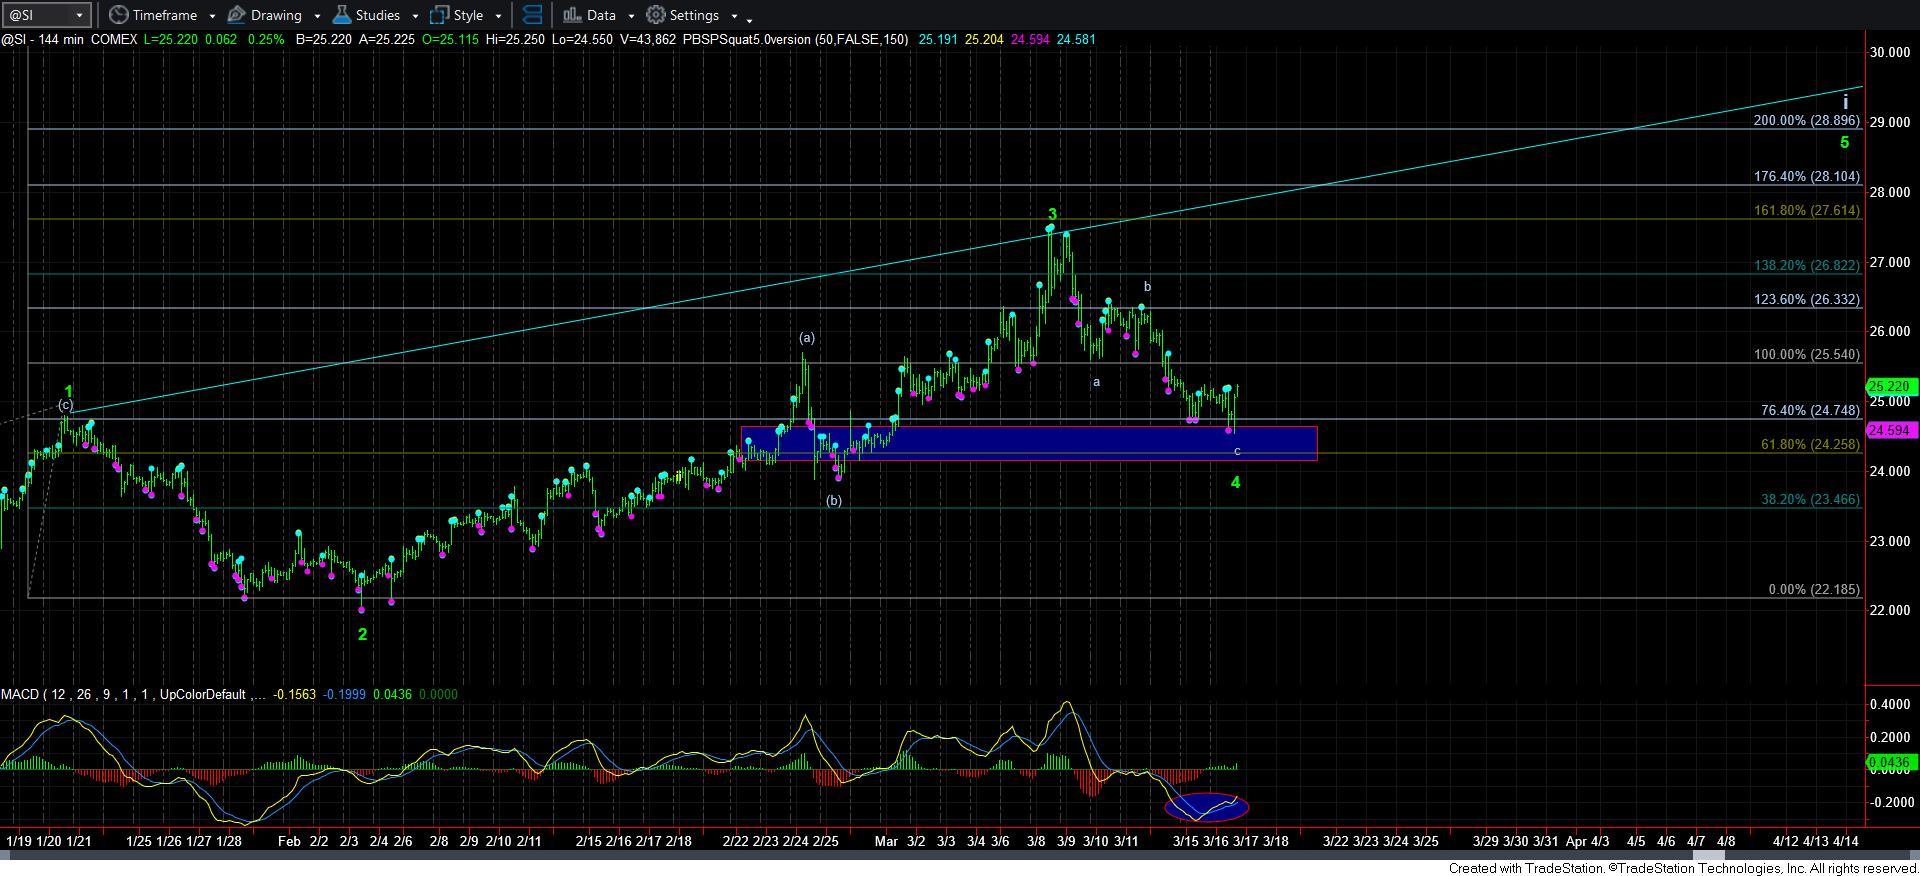
60minSPX
Read Full Story »»»
DiscoverGold
Barrick (GOLD) agrees deal with Pakistan to waive $11 billion penalty and restart Reko Diq
By: Reuters | March 20, 2022
An $11 billion penalty against Pakistan will be waived under a deal with Barrick Gold (NYSE:GOLD) to restart the Reko Diq gold and copper mining project, Pakistan's Finance Minister Shaukat Tarin said on Friday.
He said the out-of-court deal with the Canadian mining company will bring in $10 billion in investment in Pakistan.
A World Bank arbitration court had ruled in favour of Tethyan Copper, a joint venture between Chile's Antofagasta (LON:ANTO) Plc and Canada's Barrick Gold over a lease to the mine, located in a remote area of southwestern Pakistan.
"A $11 billion award on us has been nullified," Tarin told a news conference, adding that, "Barrick and its partners will invest $10 billion in the mining".
Read Full Story »»»
DiscoverGold
NY Gold Futures »» Weekly Summary Analysis
By: Marty Armstrong | March 19, 2022
NY Gold Futures closed today at 192930 and is trading up about 5.50% for the year from last year's settlement of 182860. Up to now, this market has been rising for this month going into March reflecting that this has been only still a bullish reactionary trend. As we stand right now, this market has made a new high exceeding the previous month's high reaching thus far 207880 while it has not broken last month's low so far of 178850. Nevertheless, this market is still trading above last month's close of 190070.
ECONOMIC CONFIDENCE MODEL CORRELATION
Here in NY Gold Futures, we do find that this particular market has correlated with our Economic Confidence Model in the past. The Last turning point on the ECM cycle low to line up with this market was 2015. The Last turning point on the ECM cycle high to line up with this market was 2020 and 2011 and 1996.
MARKET OVERVIEW
NEAR-TERM OUTLOOK
The historical perspective in the NY Gold Futures included a rally from 2015 moving into a major high for 2020, the market has been consolidating since the major high with the last significant reaction low established back in 2015. The market is still holding above last year's low. The last Yearly Reversal to be elected was a Bullish at the close of 2020.
This market remains in a positive position on the weekly to yearly levels of our indicating models.
Solely focusing on only the indicating ranges on the Daily level in the NY Gold Futures, this market remains neutral with resistance standing at 195260 and support forming below at 190810. The market is trading closer to the support level at this time.
On the weekly level, the last important high was established the week of March 7th at 207880, which was up 30 weeks from the low made back during the week of August 9th. We have seen the market drop sharply for the past week penetrating the previous week's low and it closed beneath that low which was 196060. This was a very bearish technical indicator warning that we have a shift in the immediate trend. We are still trading neutral on the Weekly Momentum Indicators and this is a warning that initial support has been breached. This strongly implies we should pay close attention now to the Weekly Bearish Reversals. If we begin to elect Weekly Bearish Reversals, then we are dealing with a more sustainable near-term correction.
INTERMEDIATE-TERM OUTLOOK
YEARLY MOMENTUM MODEL INDICATOR
Our Momentum Models are declining at this time with the previous high made 2020 while the last low formed on 2021. However, this market has rallied in price with the last cyclical high formed on 2020 and thus we have a divergence warning that this market is starting to run out of strength on the upside.
Interestingly, the NY Gold Futures has been in a bullish phase for the past 6 months since the low established back in August 2021.
Critical support still underlies this market at 180070 and a break of that level on a monthly closing basis would warn that a sustainable decline ahead becomes possible. Nevertheless, the market is trading above last month's high showing some strength.
DiscoverGold
Jack Chan: Gold Price Exclusive Update
By: Jack Chan | March 19, 2022

Our proprietary cycle indicator is UP.
To public readers of our updates, our cycle indicator is one of the most effective timing tool for traders and investors. It is not perfect, because periodically the market can be more volatile and can result in short term whipsaws. But overall, the cycle indicator provides us with a clear direction how we should be speculating.
Investors
During a major buy signal, investors can accumulate positions by cost averaging at cycle bottoms, ideally when prices are at or near the daily 200ema.
During a major sell signal, investors should be hedged or in cash.
Traders
Simply cost average in at cycle bottoms when prices are at or near the daily 200ema; and cost average out at cycle tops when prices are above the daily 50ema.

Gold sector is on long term SELL signal, but prices have found support at the 200ema.
A new buy signal here will confirm a new up leg for the bull market.

GLD is on short term sell signal.

GDX is on short term buy signal.

XGD.to is on short term buy signal.

GDXJ is on short term buy signal.
Analysis

Speculation pulling back from level of previous top.

Our ratio is on buy signal.

Trend is up for the dollar.

Trend is up for gold stocks.

Trend for gold is up.

And the multi-year “cup with handle” is in progress.

A closer look at the handle and it is in progress of a cup with handle itself.

Next resistance at $42.

A multi week consolidation between support and resistance will be ideal.
Summary
Long term – on SELL signal.
Short term – on buy signals.
Gold sector cycle is UP.
$$$ We are holding long term positions.
Read Full Story »»»
DiscoverGold
COT - Commitments of Traders in Metals Futures Market Reports
By: Software North | March 18, 2022
Gold
Silver
Read Full Story »»»
DiscoverGold
Gold Miners’ Q4’21 Fundamentals
By: Adam Hamilton | March 18, 2022
The gold miners’ stocks just surged to a major upside breakout, really ramping up traders’ interest in this small contrarian sector. Capital is flowing back into gold stocks to chase their strong upward momentum, which fuels increasing bullishness. That buying is fundamentally-justified based on the major gold miners’ recently-reported Q4’21 results. This latest earnings season reveals how gold stocks are actually faring.
With Q1’22 already winding down, looking at the prior quarter’s operational and financial reports seems dated. But because most companies run on calendar years, the Q4 reporting deadlines are extended. In the US companies don’t have to report full-year 10-K results until 60 days after quarter-ends, compared to 40 days for 10-Q quarterlies. In Canada, the epicenter of the gold-mining universe, year-ends extend to 90 days!
So mid-March is about the earliest that enough major gold miners have reported full Q4 results to analyze them. Right after each quarterly earnings season, I dig into the latest reports from the top-25 component companies of the leading GDX VanEck Gold Miners ETF. This benchmark dominates its sector, with $14.8b in net assets mid-week running 26.9x larger than the next-biggest 1x-long major-gold-miners-ETF competitor!
GDX has blipped up on far more speculators’ and investors’ radars after blasting 32.8% higher between late January to early March! Part of a larger upleg born in late September, that big-and-fast rally achieved a major upside breakout for gold stocks. Yet with 34.6% gains at best, their latest upleg remains small. GDX’s five previous uplegs during this secular gold bull averaged massive 85.0% gains before peaking!
Gold stocks are ultimately leveraged plays on gold, with GDX majors tending to amplify gold’s gains by 2x to 3x. Given the extraordinarily-bullish fundamental backdrop for the yellow metal, this latest gold-stock upleg ought to grow much larger than usual before giving up its ghost. Chief among gold’s bullish drivers is this raging inflation unleashed by the profligate Fed’s extreme money printing, which is wildly-unprecedented.
In just 24.4 months since March 2020’s pandemic-lockdown stock panic, the Fed ballooned its balance sheet by a truly-insane 114.3% or $4,752b! Effectively more than doubling the US-dollar supply is why inflation is out-of-control. Even lowballed government-reported inflation per the CPI is soaring 7.9% year-over-year, its hottest increase since January 1982! Americans increasingly realize the reality is even worse.
During the last similar inflation super-spikes in the 1970s, gold prices nearly tripled during the first then more than quadrupled in the second! The gold miners’ stocks shot stratospheric on that, generating life-changing wealth for contrarians deployed in them. Gold has always been the ultimate inflation hedge, as its supply growth is hard-limited by geology unlike fiat-money supplies. Gold-stock earnings amplify gold gains.
The Fed’s crazy inflation problem will persist until its QE4-mushroomed money supply radically shrinks and the Fed hikes its federal-funds rate well above headline inflation. But either would utterly crash these QE-levitated bubble-valued stock markets, forcing the US economy into a severe recession if not a full-blown depression. The Fed won’t risk that, so gold and gold stocks have a long inflation-fueled runway ahead.
Speculators and investors wanting to multiply wealth in this high-potential sector should understand gold miners’ fundamentals, which are only revealed in quarterly earnings seasons. I’ve painstakingly analyzed the GDX-top-25 gold miners’ latest results for 23 quarters in a row now. Including the world’s largest gold miners, they accounted for 88.5% of this ETF’s total weighting mid-week. That’s certainly a commanding sample.
This table summarizes the operational and financial highlights from the GDX top 25 during Q4’21. These gold miners’ stock symbols aren’t all US listings, and are preceded by their rankings changes within GDX over this past year. The shuffling in their ETF weightings reflects shifting market caps, which reveal both outperformers and underperformers since Q4’20. Those symbols are followed by their current GDX weightings.
Next comes these gold miners’ Q4’21 production in ounces, along with their year-over-year changes from the comparable Q4’20. Output is the lifeblood of this industry, with investors generally prizing production growth above everything else. After are the costs of wresting that gold from the bowels of the earth in per-ounce terms, both cash costs and all-in sustaining costs. The latter help illuminate miners’ profitability.
That’s followed by a bunch of hard accounting data reported to securities regulators, quarterly revenues, earnings, operating cash flows, and resulting cash treasuries. Blank data fields mean companies hadn’t reported that particular data as of the middle of this week. The annual changes aren’t included if they would be misleading, like comparing negative numbers or data shifting from positive to negative or vice versa.
Last quarter proved somewhat challenging for gold miners, with mounting inflationary cost pressures and lower average gold prices squeezing profitability. Yet the major gold miners are still earning money hand-over-fist with these high prevailing gold prices. And profits will power dramatically higher as the Fed’s colossal deluge of freshly-conjured US dollars continues to bid up all prices in coming years, including gold’s.
After actively speculating in gold stocks and writing popular financial newsletters about that for over two decades now, not much in this sector surprises me. But the GDX top 25’s Q4’21 results still managed to on multiple fronts. They were solid if not good, but still below my expectations given what was happening in gold. The gold miners earned nice profits, but those were hobbled by costs surging far faster than usual.
Starting on this table’s left and working our way to the right, GDX’s holdings have become increasingly-concentrated. This leading sector ETF’s top-25 components accounting for 88.5% of its weighting is just shy of the 23-quarter high of 88.6% seen just after Q1’20’s earnings season. But the top-five companies alone commanding 51.9% of this ETF is unprecedented in this dataset, GDX has become really top-heavy!
Another major-gold-stock mega-merger is one reason. Back in late September, Canadian major Agnico Eagle Mines announced it would purchase smaller rival Kirkland Lake Gold for $10.7b in stock. The latter had the best fundamentals by far among major gold miners, so it getting taken out was a sad day for gold investors. That old KL ranked below the GDX top five, but is now effectively included in AEM’s gorged weighting.
More importantly with gold miners’ latest bull upleg remaining small and young, much of the recent capital inflows have poured into ETFs led by GDX. The major gold stocks haven’t yet run high-enough for long-enough to generate sufficient bullishness to fuel big individual-stock buying by institutional and individual investors. Differential ETF-share demand requires ETFs to buy underlying stocks proportionally to their weightings.
Thus ETF capital inflows mostly benefit their larger holdings, growing them even bigger. That leaves less money moving into their smaller holdings, which are relatively-starved for capital. Outsized ETF buying exceeding individual-stock buying leaves sectors increasingly-concentrated, which boosts selloff risks. The bigger any company becomes compared to its peers, the more sector damage a selloff in it will wreak.
GDX’s high concentration risk makes it even less attractive compared to its little-brother GDXJ VanEck Junior Gold Miners ETF. Actually mostly a mid-tier gold-stock ETF, I’ll analyze its top-25 stocks’ latest Q4’21 results in next week’s essay. The mid-tier and junior gold miners have long been superior to the majors for stock-price-upside potential. They have better production growth along with smaller market caps.
Mid-tier gold miners produce between 300k to 1,000k ounces per year, with juniors mining less and majors mining more. Super-majors double the latter, running at 2,000k+ ounces of annual output. The higher gold miners’ production bases, the harder it is for them to outpace resource depletion and grow. That leaves their stocks less desirable to investors, since production growth heavily fuels stock-price gains.
In Q4’21 these GDX-top-25 gold miners produced 8,352k ounces, which fell a rather-sharp 6.2% YoY. That would be ominous if it wasn’t skewed by that AEM-KL mega-merger. This deal wasn’t consummated until early February, so AEM’s Q4 production didn’t yet include the 380.5k ounces KL mined last quarter. If that is added on to AEM’s 501.9k, the GDX top 25’s collective output only shrunk a much-milder 1.9% YoY.
And with Kirkland Lake Gold gobbled up by Agnico Eagle, China’s Zhaojin Mining climbed into the GDX-top-25 ranks to take its place. Unfortunately it and its larger compatriot Zijin Mining follow that country’s terrible financial-reporting standards. Represented by their numeric Hong Kong Stock Exchange symbols in GDX, these major Chinese gold miners rarely report anything timely in English. So they have no data.
Over the years I’ve even limped through their Chinese filings, both using translating software and having a Chinese friend wade through them with me. While half-year financial statements are presented, they usually don’t include gold production or costs. So had another GDX component actually reporting output taken the 25th-largest GDX spot on KL’s demise, the major gold miners’ collective output would’ve been flatter.
But stable production still isn’t growth, which is what investors prize most since it leads to bigger profits and higher share prices. Provocatively way back in Q2’16 when I launched this quarterly deep-research thread, the GDX-top-25 gold miners produced 8,788k ounces of gold. Fully 5.8 years later in Q4’21, that was still running 8,733k with KL added back in. The major gold miners have long failed on the growth front!
With inflation raging across the world thanks to the epic money printing by the Fed and other big central banks, I was really attuned to gold miners lamenting it in their Q4’21 results. Higher general price levels were indeed cited quite a bit as a key reason production costs are climbing. But the actual magnitude of cost increases was shocking. Q4’21 saw some of the biggest mining-cost jumps in at least the last 23 quarters!
Normally per-ounce mining costs are generally inversely-proportional to gold production. That’s because gold mines’ total operating costs are largely fixed during planning stages, when designed throughputs for mills that process gold-bearing ores are determined. Their nameplate capacities don’t change quarter-to-quarter, requiring similar levels of infrastructure, equipment, and employees to keep running at full-speed.
So the only real variable driving quarterly gold production is the ore grades fed into the mills. Those vary widely even within individual gold deposits. Richer ores yield more ounces to spread the big fixed costs of mining across, lowering unit costs and boosting profitability. So with the GDX top 25’s output slumping between 2% to 6% last quarter depending on KL’s inclusion or not, costs should’ve climbed in a similar range.
Cash costs are the classic measure of gold-mining costs, including all cash expenses necessary to mine each ounce of gold. But they are misleading as a true cost measure, excluding the big capital needed to explore for gold deposits and build mines. So cash costs are best viewed as survivability acid-test levels for the major gold miners. They illuminate the minimum gold prices necessary to keep the mines running.
These elite GDX-top-25 major gold miners reporting cash costs last quarter averaged a staggering $853 per ounce, which soared 21.8% YoY! That dwarfed the previous high over the last 23 quarters of $773 in Q1’21. While the raging inflation certainly contributed to higher costs, thankfully a couple of ugly outliers really skewed this metric high. They were First Majestic Silver’s extreme $1,624 and Harmony Gold’s $1,382.
For years the major silver miners have been increasingly diversifying into gold, as it simply has far-better mining economics than silver. Last year AG purchased its first pure gold mine to add to its stable of three silver mines, but that operation has been plagued with super-high costs. HMY’s old and very-deep South African gold mines are ever-more-expensive to run. Excluding these, GDX-top-25 cash costs averaged $780.
All-in sustaining costs are far superior than cash costs, and were introduced by the World Gold Council in June 2013. They add on to cash costs everything else that is necessary to maintain and replenish gold-mining operations at current output tempos. AISCs give a much-better understanding of what it really costs to maintain gold mines as ongoing concerns, and reveal the major gold miners’ true operating profitability.
The GDX-top-25 major gold miners’ AISCs also blasted up 14.5% YoY in Q4’21 to hit $1,188! That too was the last 23 quarters’ peak, and a new record. The previous high-water mark of $1,085 came in the preceding Q3’21, where inflationary cost pressures were mounting. But these AISCs were again skewed high by those same two outliers First Majestic Silver and Harmony Gold, which reported $2,048 and $1,660!
That South African major’s AISCs aren’t heading lower, with full-year-2022’s forecast near a midpoint of $1,652. But AG’s experienced management is making progress reining in costs at its new gold mine. They are projected to average a still-high-but-much-better $1,555 this year. Excluding AG and HMY, the rest of the GDX top 25 averaged $1,114 AISCs. Still a record, those would’ve climbed a more-reasonable 7.4% YoY.
I had expected the major gold miners’ all-in sustaining costs to come in more in-line with their four-quarter average of $1,057. Had GDX-top-25 production been stable and cost inflation run around 3.0% YoY, their AISCs would’ve shaken out around $1,088 per ounce. That’s fully $100 lower than the actual. Next week’s GDXJ essay will show whether these surging costs are also infecting the mid-tier and junior gold miners.
Gold-mining profits are the difference between prevailing gold prices and mining costs. So higher costs naturally lead to lower earnings. The best sector proxy for gold-mining profitability subtracts GDX-top-25 AISCs from quarterly-average gold levels. Last quarter the latter came in at $1,796, down 4.3% YoY. With major-gold-miner AISCs soaring 14.5% YoY to that lofty $1,188, sector earnings ran $608 per ounce.
That plunged 27.5% YoY, the worst drop over the last 23 quarters of this research thread. That eclipsed the preceding Q3’21’s 20.4%-YoY decline. So higher mining costs really slice into earnings, which sounds bad. And unfortunately GDX-top-25 AISCs aren’t expected to improve much this year, higher costs are here to stay. Fully 17 of these majors provided 2022 AISC guidance, which averaged $1,159 per ounce.
That’s still hovering near Q4’21’s record $1,188 read. But higher mining costs certainly aren’t bearish for gold miners with the yellow metal’s prices remaining high. Those $608-per-ounce profits these elite miners were collectively earning last quarter remained the seventh-highest on record, only behind the preceding six quarters. And those averaged $777 of unit earnings, not greatly higher than last quarter’s levels.
Before Q2’20, peak GDX-top-25 per-ounce profits ran $591 in Q3’19. And even with higher mining costs, the same raging inflation forcing gold much higher will colossally boost gold-mining earnings. Remember gold nearly tripled and more than quadrupled during the last similar inflation super-spikes in the 1970s. Today’s current one started accelerating a year ago in April, when the headline CPI first exceeded 4.0% YoY.
That month gold averaged $1,761, so at best by early March it had only rallied 16.5% so far. Because the gold market today is far larger than during the 1970s, gold prices probably won’t triple or quadruple again. But they ought to at least double, implying $3,500+ gold before the Fed unwinds enough QE money and hikes rates high enough to slay its inflation monster. Even at much-higher average AISCs, profits would be huge!
As long as gold’s secular bull keeps powering higher on balance, so will gold miners’ earnings. Ultimately stock prices gravitate to some reasonable multiple of underlying corporate profits. And with gold-mining earnings amplifying higher gold prices, way-higher profits are coming as gold continues marching higher. This is the strong fundamental foundation undergirding gold stocks’ secular bull, which will grow way bigger.
On the hard-accounting front, the GDX-top-25 gold miners’ $16.9b of total revenues reported last quarter fell 5.7% YoY. That’s congruent with their 6.2%-lower output and 4.3%-lower average gold prices. But sales were actually better, partially because Chinese gold miner Zhaojin now included in the GDX top 25 doesn’t report them. The great British major Endeavour Mining also dragged its feet on reporting Q4 results.
Those finally came in after the Wednesday-evening data cutoff for this essay. EDV’s Q4’21 revenues ran $697m. With those added in, the GDX-top-25 sales only retreated 1.8% YoY to $17.5b. That’s pretty impressive given the lower gold production and average gold prices last quarter. But actual bottom-line earnings under Generally Accepted Accounting Principles or other countries’ equivalents fared much worse.
The $2,552m earned by these elite major gold miners plunged 47.8% YoY! But that was again distorted by unusual items. Last quarter’s included an $874m reclamation-and-remediation charge by Newmont Mining, a $106m noncash writedown on a mine by Kinross Gold, and a $301m loss on discontinued operations by Buenaventura. These one-time charges dragged the overall GDX-top-25 profits sharply-lower.
Those were partially offset by big gains including a $157m impairment reversal at Wheaton Precious Metals and a $286m gain at Centerra Gold on a similar reversal that also created a deferred tax asset. Net these out, and GDX-top-25 operating earnings last quarter were closer to $3,090m. That was only down 24.5% YoY from Q4’20’s similar earnings running near $4,093m adjusted for big one-time unusual items.
So the major gold miners’ cleaner operating earnings fared better in Q4’21 than that sector unit-earnings proxy of average gold prices less average all-in sustaining costs. Gold-miner valuations in trailing-twelve-month price-to-earnings-ratio terms still generally remained quite low this week, with seven of these GDX-top-25 companies just trading under 20x. Gold mining remains very profitable despite those climbing costs!
That was also evident in these major gold miners’ cash flows generated from operations only dropping a milder 22.2% YoY to $6,488m. If Endeavour Mining’s straggling OCFs are added in, that moderates to a 17.9%-YoY decline to $6,844m. That’s again reasonable based on the GDX top 25’s lower production coupled with lower average gold prices. These strong operating cash flows helped keep treasuries full.
The GDX top 25 reported cash balances totaling $21.6b ending Q4’21, which slumped 5.3% YoY. But that was only because the comparable Q4’20 saw the highest on record of $22.8b! So the major gold miners are flush with cash from their hefty profitability over the past seven quarters, starting when gold’s average price first surged over $1,700. Their big warchests should fund plenty of expansion in coming years.
Operating at major and vast super-major scales, the GDX-top-25 gold miners have long struggled to grow their production organically. While they do expand existing mines and build new ones, that growth is usually outpaced by depletion at existing mines. Most of majors’ output growth comes from buying other mines and mining companies, which really benefits the smaller mid-tiers and juniors feeding gold’s supply pipeline.
If you regularly enjoy my essays, please support our hard work! For decades we’ve published popular weekly and monthly newsletters focused on contrarian speculation and investment. These essays wouldn’t exist without that revenue. Our newsletters draw on my vast experience, knowledge, wisdom, and ongoing research to explain what’s going on in the markets, why, and how to trade them with specific stocks.
That holistic integrated contrarian approach has proven very successful. All 1,280 newsletter stock trades realized since 2001 averaged outstanding +20.7% annualized gains! Today our trading books are full of great fundamentally-superior mid-tier and junior gold and silver miners to ride their uplegs. These stocks have surged with gold breaking out, but still have massive room to run. Subscribe today and get smarter and richer!
The bottom line is the major gold miners continued to thrive fundamentally in Q4, despite higher costs fueled by the raging inflation unleashed by the Fed and other big central banks. These companies still earned good profits last quarter with prevailing gold prices remaining high. While inflation-goosed mining costs are here to stay, gold’s coming gains on that same monetary deluge will drive mining profits way higher.
With its hard-limited supply growth, gold has always been the ultimate inflation hedge. Yet it has barely budged so far in the Fed’s latest inflation super-spike, implying much catch-up rallying to do. Gold prices nearly tripled and more than quadrupled during the last inflation super-spikes in the 1970s, launching gold miners’ earnings and stock prices stratospheric. A similar fundamental windfall should play out in this inflation.
Read Full Story »»»
DiscoverGold
$GDX Daily Chart. #GDX
By: ReciKnows | March 18, 2022
• $GDX Daily. #GDX.

Read Full Story »»»
DiscoverGold
$DG Thanks; INFLATION NIGHTMARE CONTINUES: Despite Takedown, Gold, Silver And Mining Stocks Set To Explode Higher
March 15, 2022
https://kingworldnews.com/inflation-nightmare-continues-despite-takedown-gold-silver-and-mining-stocks-set-to-explode-higher/
$TM Sanctions against Russia threaten London gold and silver markets, Maguire says
9:16a ET Saturday, March 12, 2022
Dear Friend of GATA and Gold:
Russia, like China, has much more official gold than it has reported and
the two nations are considering using the "nuclear option" against the
petrodollar, London gold trader Andrew Maguire claims in his weekly
interview with Shane Morand for Kinesis Money.
That is, Maguire says, Russia would demand gold as payment for its oil
exports.
Further, Maguire says, the Bank of Russia's increasing acquisition of
domestically produced gold will reduce supply on the international
market, just as economic sanctions against Russia will reduce supply of
Russian silver to the London market.
The interruption of Russian silver supply to London, Maguire says, is
already imperiling silver delivery commitments and silver derivatives,
raising the threat of defaults.
Maguire's interview with Morand is 37 minutes long and can be viewed at
YouTube here:
https://www.youtube.com/watch?v=JJ0XM8fufOQ
CHRIS POWELL, Secretary/Treasurer
Gold Anti-Trust Action Committee Inc.
CPowell@GATA.org
$They’re Lying, Inflation Is Out Of Control And It’s Bullish For Gold & Silver
February 10, 2022
https://kingworldnews.com/theyre-lying-inflation-is-out-of-control-and-its-bullish-for-gold-silver/
$Expert Says GOLD Could Hit $100,000 Soon!! (Here's How)
78,050 views Mar 8, 2022
https://www.youtube.com/watch?v=35x8N7Va8zg
) ) Should we buy the dip in Gold
By: SentimenTrader | March 16, 2022
• The 5-day rate of change for gold futures shows a massive downward shift in price momentum near a high. Similar signals to what we're seeing now have preceded positive returns and win rates across multiple time frames.
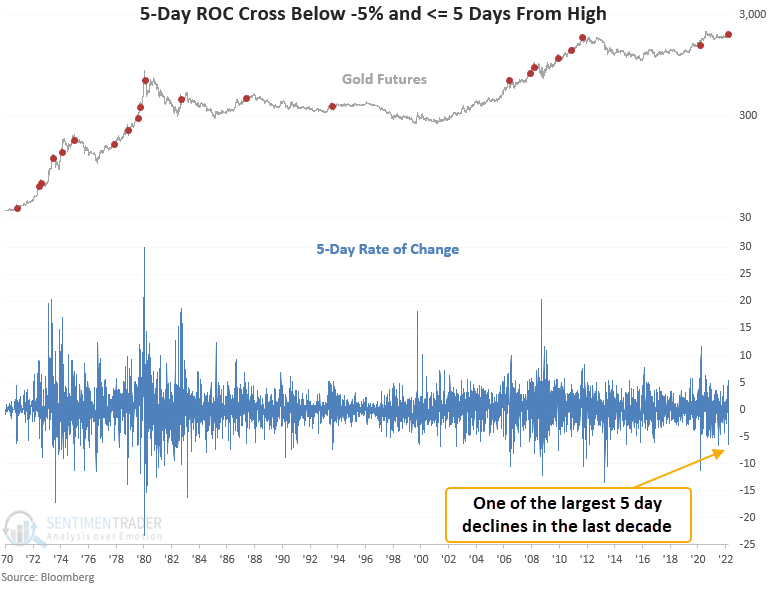
Read Full Story »»»
DiscoverGold
Precious Metals Consolidation/Stock Market Bear Action
By: Rambus | March 15, 2022
Last week I mentioned that it might be time for the PM stocks to start consolidating their gains from the last reversal point in the blue 5 point triangle reversal patterns. It looks like it has now started after last week’s high.
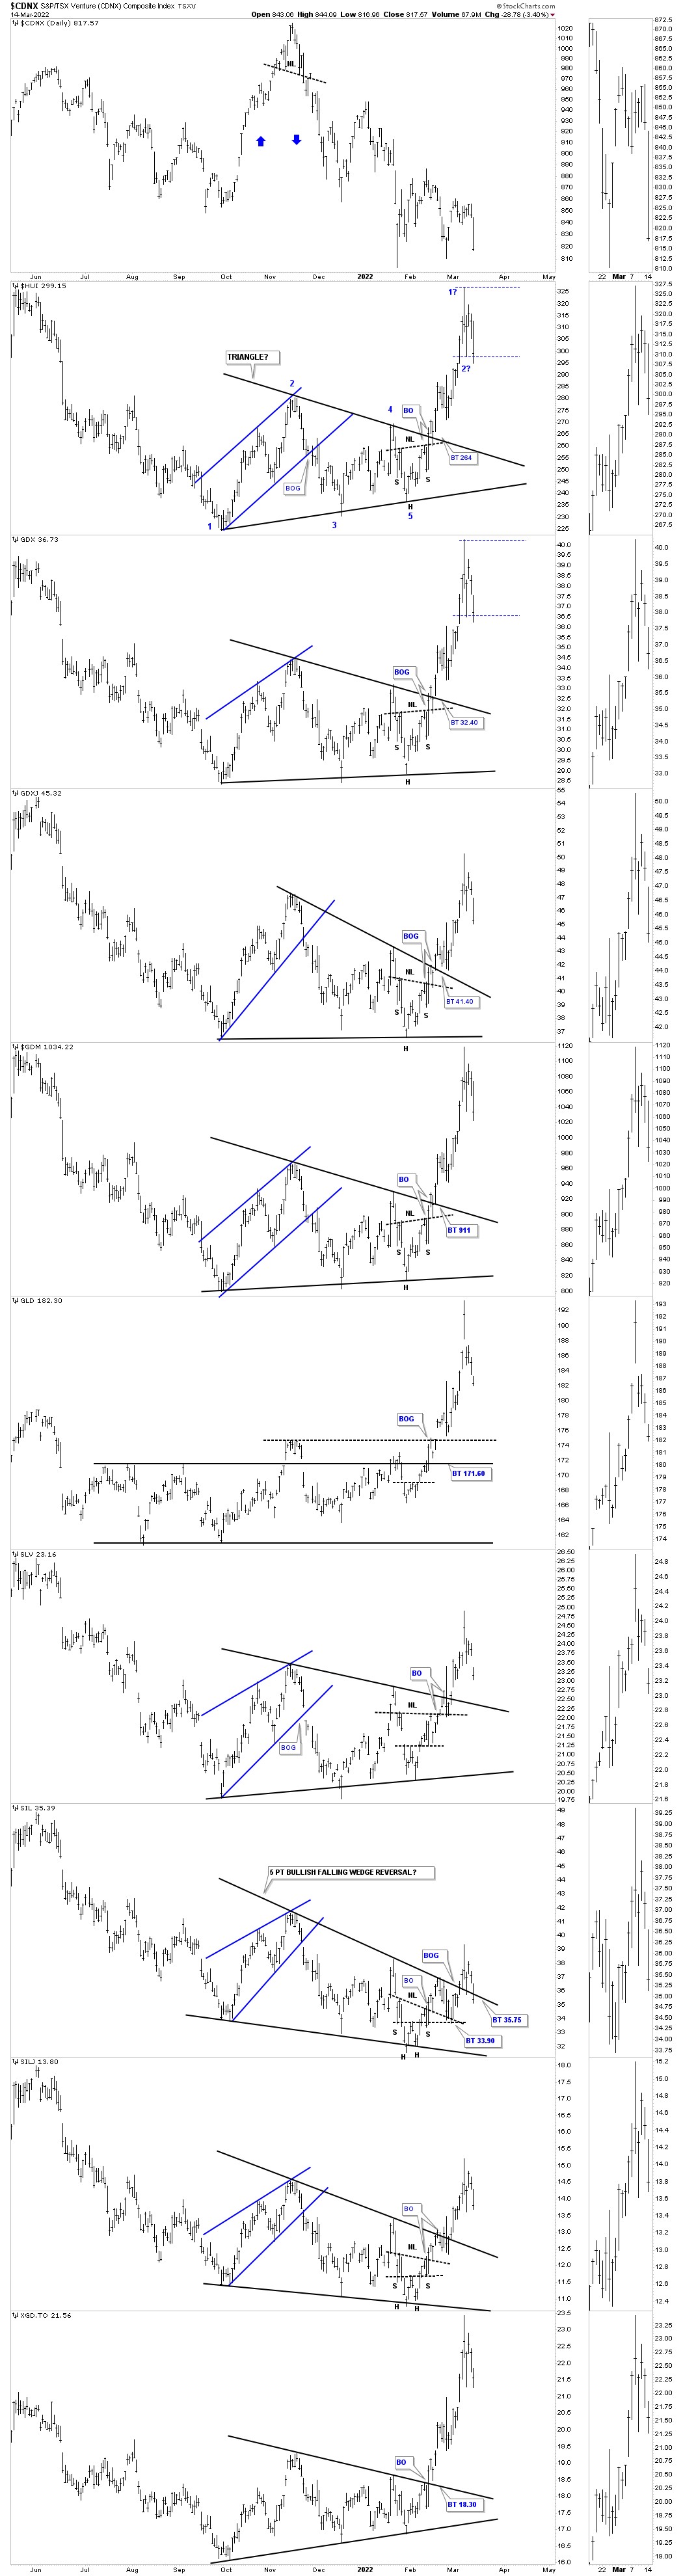
Next is the daily line chart which shows today’s move lower left a small double top suggesting the consolidation phase is beginning. I also added the Fib retracements to get a feel for where reversal point #2 may show up with the recent high being reversal point #1.
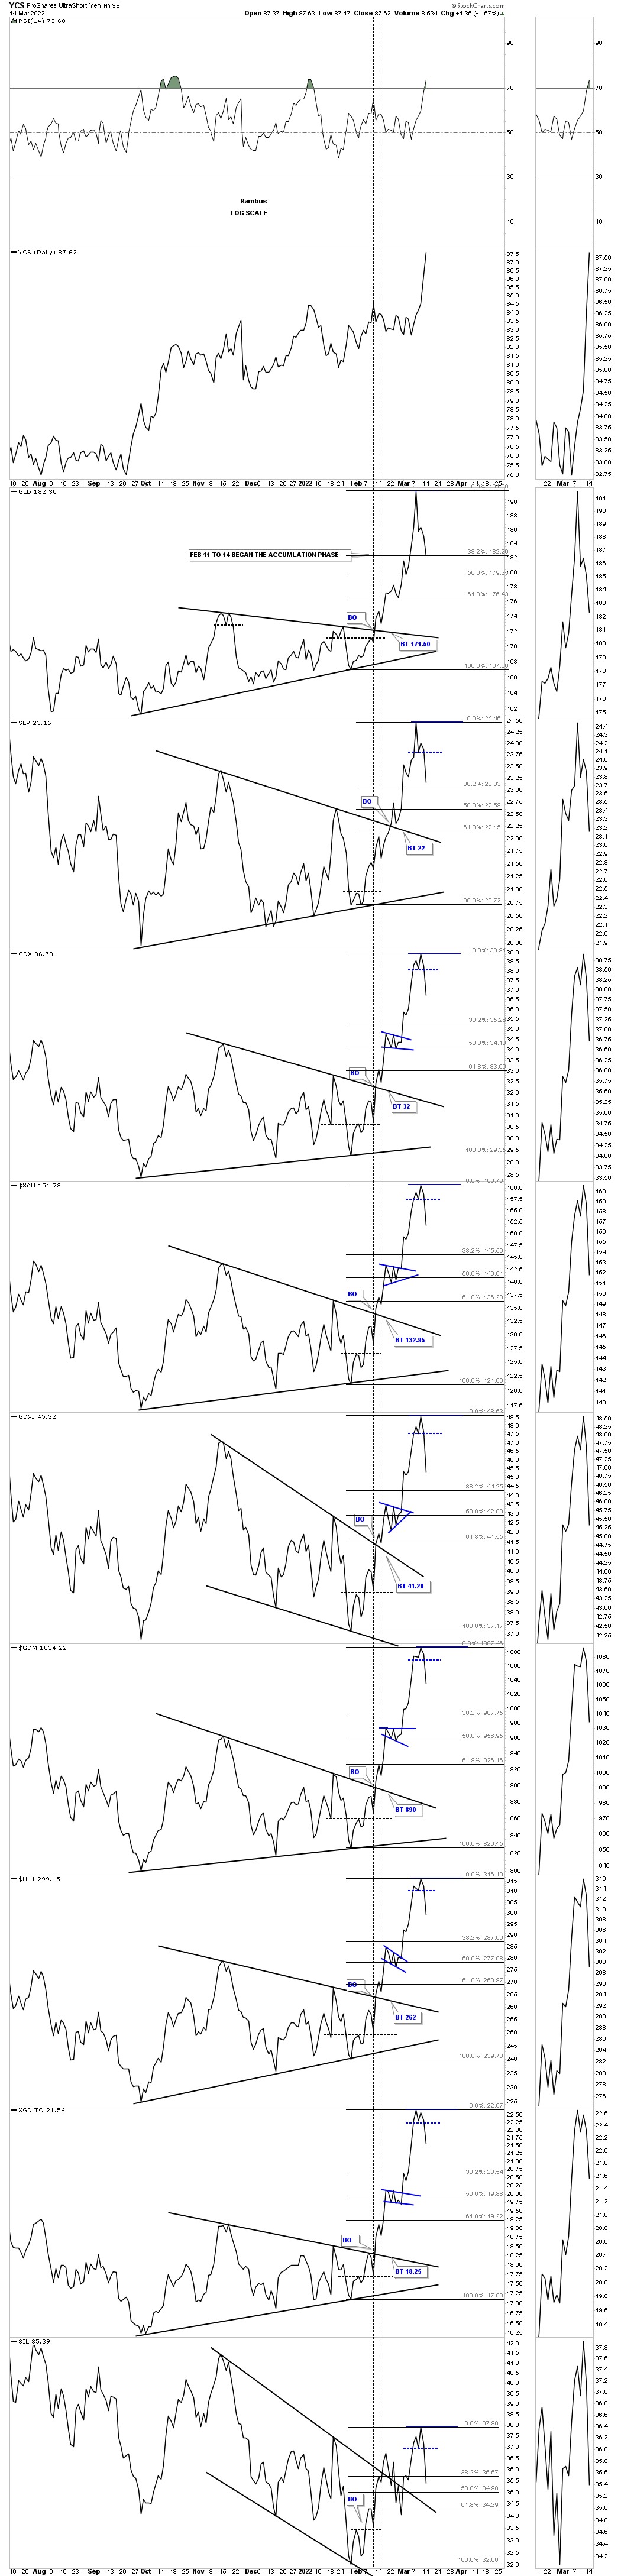
I also mentioned last week that we shouldn’t be surprised to see a backtest to the top rail of the August 2020 trading range. This weekly chart shows three areas to look for possible support. First is the top rail of the 2020 trading range. Second is the black dashed S&R line with the 3rd area being the 30 week ema.
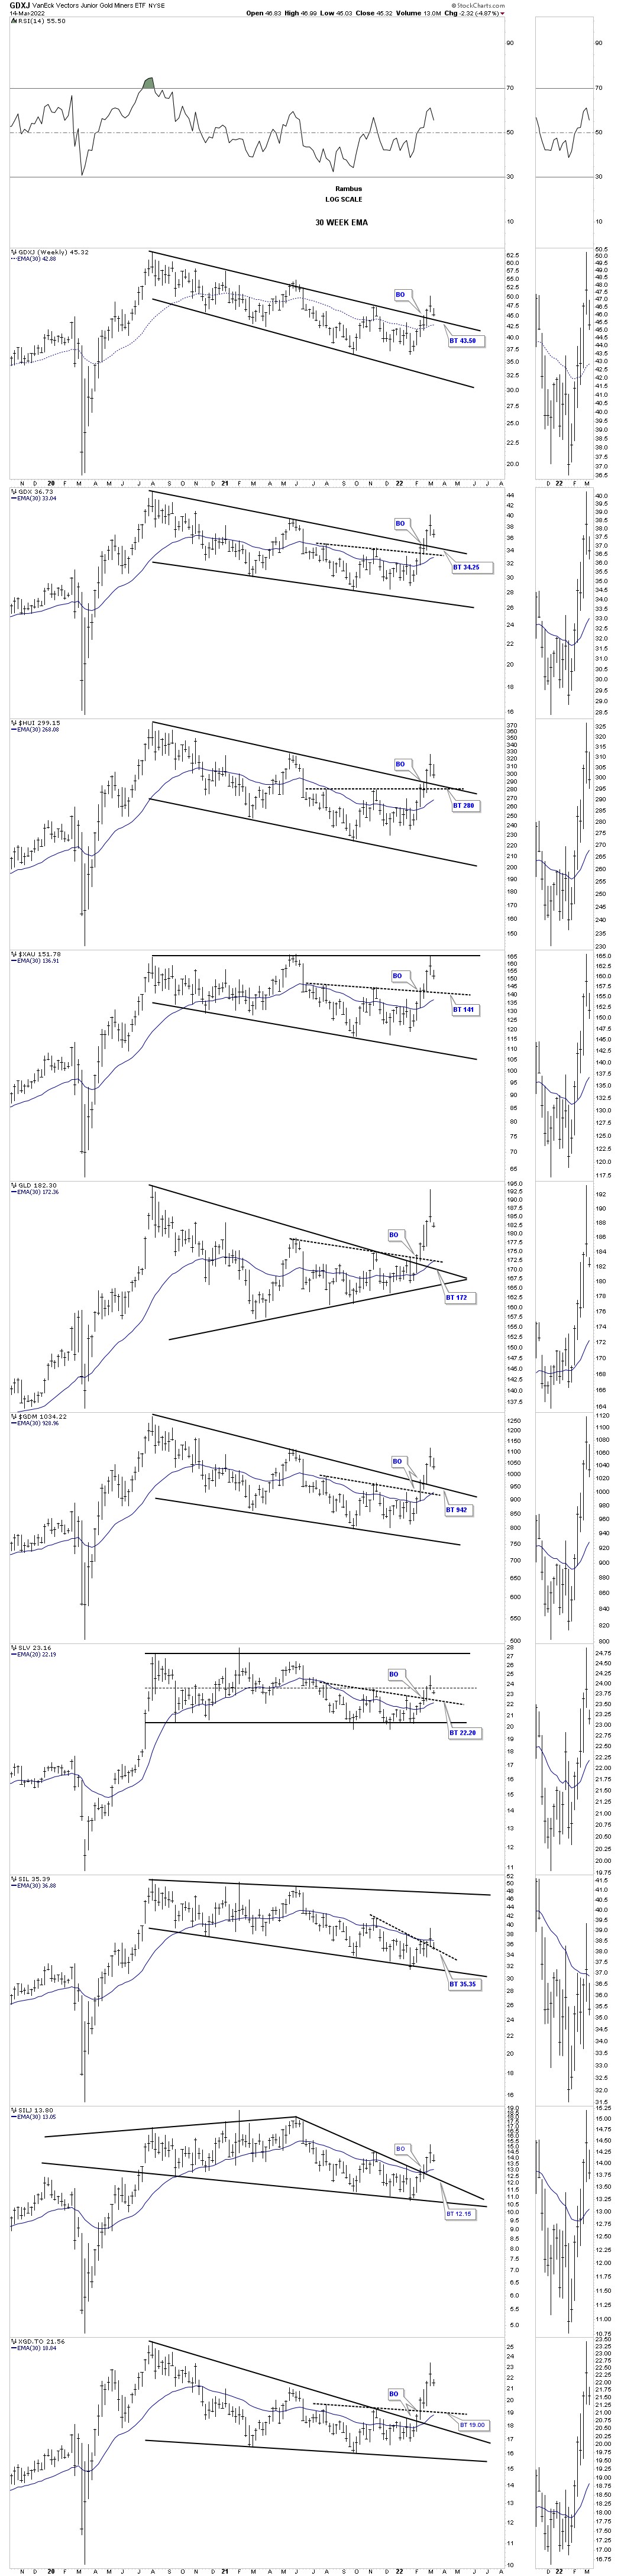
This short term daily line chart for the US stock markets show the H&S tops which are trying to finish up the backtesting process. The IWM is attempting to breakout from its blue triangle which will either be a halfway pattern to the downside or if things get really nasty it could be the first of several consolidation patterns that create the impulse move lower. Several of the indexes are showing a lower low which is what we want to see to help confirm the new downtrend.
This last chart for today is the longer term daily line chart. What stands out the most for me is the rally leading into the H&S tops. If there was ever a place to look for some reverse symmetry to the downside these charts show that possibility. One step at a time. All the best…Rambus
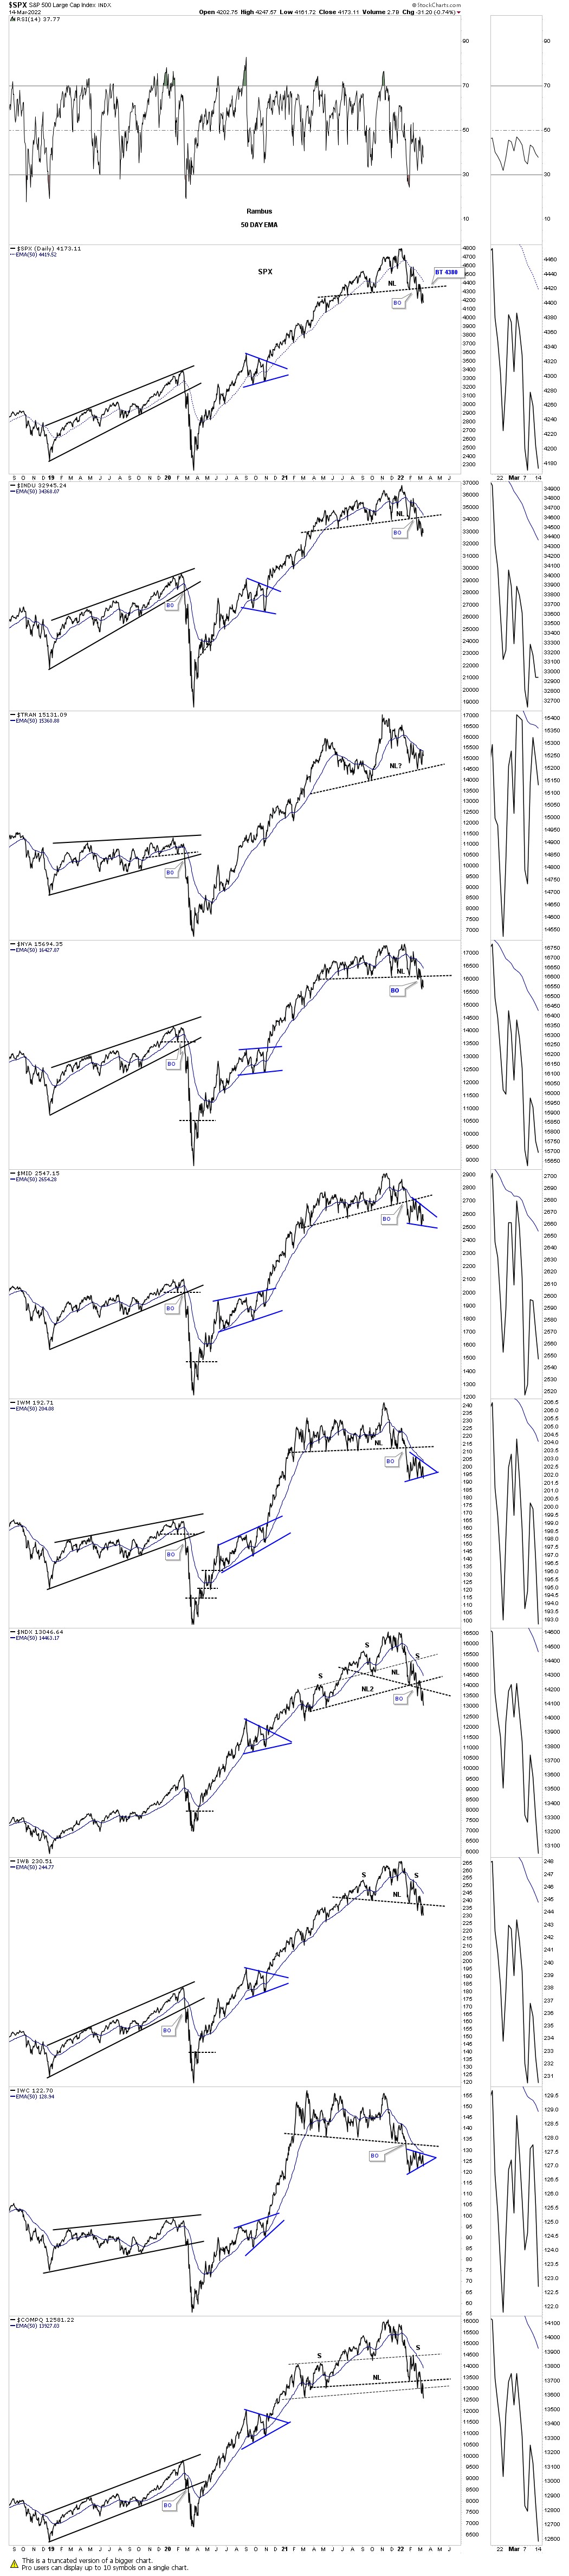
Read Full Story »»»
DiscoverGold
$GCM Mining Provides Production Update; Declares April 15, 2022 Monthly Dividend; Announces 2021 Fourth Quarter and Year End Results Webcast
March 15, 2022
https://www.gcm-mining.com/news-and-investors/press-releases/press-releases-details/2022/GCMMining-Provides-Production-Update-Declares-April-15-2022-Monthly-Dividend-Announces-2021-Fourth-Quarter-and-Year-End-Results-Webcast/default.aspx
TORONTO, March 15, 2022 (GLOBE NEWSWIRE) --
GCM Mining Corp. (“GCM Mining” or the “Company”) (TSX: GCM, OTCQX: TPRFF) announced today that its Segovia Operations produced 17,184 ounces of gold in February 2022, up from 15,360 ounces of gold in February last year. This brings the total gold production for the first two months of 2022 to 33,658 ounces, up from 30,415 ounces in the first two months last year. Segovia’s trailing 12-months’ total gold production at the end of February 2022 was 209,632 ounces, up about 1.6% over last year.
GCM Mining processed a total of 48,512 tonnes in February 2022 at its Maria Dama plant at Segovia, representing a daily processing rate of 1,733 tonnes per day (“tpd”), compared with 42,345 tonnes and 1,512 tpd in February 2021. Segovia’s head grades averaged 12.2 g/t in February 2022 compared with 12.5 g/t in February last year. For the first two months of 2022, a total of 90,527 tonnes were processed at Segovia at an average head grade of 12.8 g/t compared with a total of 83,771 tonnes at an average head grade of 12.6 g/t in the first two months last year.
The Company continued to operate the new 200 tpd polymetallic plant at Segovia in test mode in February, processing an average of approximately 98 tpd of tailings resulting in the production of approximately 110 tonnes of zinc concentrate and approximately 86 tonnes of lead concentrate which have been stockpiled and are awaiting shipment once contractual agreements are finalized for the sale of the concentrates. Payable production from the concentrates in February 2022 is estimated to total approximately 91,000 pounds of zinc, 100,000 pounds of lead, 8,000 ounces of silver and less than 50 ounces of gold. Actual payable quantities are subject to change and will be finalized once the concentrates are shipped.
Monthly Dividend Declaration
GCM Mining announced today that its Board of Directors has declared the next monthly dividend of CA$0.015 per common share will be paid on April 15, 2022 to shareholders of record as of the close of business on March 31, 2022.
2021 Fourth Quarter and Year End Results Webcast
GCM Mining announced today that it will release its fourth quarter and annual results for 2021 after market close on Thursday, March 31, 2022 and will host a conference call and webcast on Friday, April 1, 2022 at 9:00 a.m. Eastern Time to discuss the results.
Webcast and call-in details are as follows:
Live Event link: https://edge.media-server.com/mmc/p/rizkrutc
Canada/ International Toll: 1 (647) 484-8332 PIN: 21424747#
Canada Toll Free: 1 (866) 455-3403 PIN: 21424747#
United States Toll: 1 (404) 400-0571 PIN: 21424747#
United States Toll Free: 1 (866) 374-5140 PIN: 21424747#
Colombia Toll: +57 601 485-0348 PIN: 21424747#
Conference ID: EV00133198
A replay of the webcast will be available at www.gcm-mining.com from Friday, April 1, 2022 until Friday, April 29, 2022.
About GCM Mining Corp.
GCM Mining is a mid-tier gold producer with a proven track record of mine building and operating in Latin America. In Colombia, the Company is the leading high-grade underground gold and silver producer with several mines in operation at Segovia Operations. Segovia produced 206,000 ounces of gold in 2021. In Guyana, the Company is advancing its fully funded Toroparu Project, one of the largest undeveloped gold/copper projects in the Americas, which is expected to commence production of more than 200,000 ounces of gold annually in 2024. GCM Mining pays a monthly dividend to its shareholders and has equity interests in Aris Gold Corporation (44%; TSX: ARIS; Colombia – Marmato), Denarius Metals Corp. (27%; TSX-V: DSLV; Spain – Lomero-Poyatos and Colombia – Guia Antigua, Zancudo) and Western Atlas Resources Inc. (26%; TSX-V: WA: Nunavut – Meadowbank).
Additional information on GCM Mining can be found on its website at www.gcm-mining.com and by reviewing its profile on SEDAR at www.sedar.com.
Cautionary Statement on Forward-Looking Information:
This news release contains "forward-looking information", which may include, but is not limited to, statements with respect to the payment of dividends, timing for dissemination of 2021 financial results and other anticipated business plans or strategies. Often, but not always, forward-looking statements can be identified by the use of words such as "plans", "expects", "is expected", "budget", "scheduled", "estimates", "forecasts", "intends", "anticipates", or "believes" or variations (including negative variations) of such words and phrases, or state that certain actions, events or results "may", "could", "would", "might" or "will" be taken, occur or be achieved. Forward-looking statements involve known and unknown risks, uncertainties and other factors which may cause the actual results, performance or achievements of GCM Mining to be materially different from any future results, performance or achievements expressed or implied by the forward-looking statements. Factors that could cause actual results to differ materially from those anticipated in these forward-looking statements are described under the caption "Risk Factors" in the Company's Annual Information Form dated as of March 31, 2021 which is available for view on SEDAR at www.sedar.com. Forward-looking statements contained herein are made as of the date of this press release and GCM Mining disclaims, other than as required by law, any obligation to update any forward-looking statements whether as a result of new information, results, future events, circumstances, or if management's estimates or opinions should change, or otherwise. There can be no assurance that forward-looking statements will prove to be accurate, as actual results and future events could differ materially from those anticipated in such statements. Accordingly, the reader is cautioned not to place undue reliance on forward-looking statements.
For Further Information, Contact:
Mike Davies
Chief Financial Officer
(416) 360-4653
investorrelations@gcm-mining.com
https://www.gcm-mining.com/news-and-investors/press-releases/press-releases-details/2022/GCMMining-Provides-Production-Update-Declares-April-15-2022-Monthly-Dividend-Announces-2021-Fourth-Quarter-and-Year-End-Results-Webcast/default.aspx
Source: GCM Mining Corp.
View All News
Technical Analysis: Gold Finds Feet At 38.2% Fibonacci But Downside Risks Linger
By: XM Group | March 14, 2022
Gold’s downward pressures are weighing on the 1,959 level, which is the 38.2% Fibonacci retracement of the recent 1,780-2,070 rally.
Despite the deep retreat in the price of the commodity, the bullish simple moving averages (SMAs) continue to endorse the ascent in the precious metal.
Meanwhile, the short-term oscillators are skewed to the downside, confirming that positive impetus is fading. The MACD is far north of the zero threshold and looks set to slide beneath its red trigger line, while the RSI is falling in the bullish zone. Furthermore, the negatively charged stochastic oscillator is suggesting additional negative price action.
In the negative scenario, an immediate support band exists between the 38.2% Fibo of 1,959 and the inside swing high of 1,950. If this upside defence dissolves, sellers could meet the mid-Bollinger band at 1,934 before testing the 1,913 low. Surrendering extra ground, the bears may then target a buffer zone from the 61.8% Fibo of 1,891 until the 1,877 trough, recorded on February 24.
Alternatively, if buyers create positive traction off the 1,950-1,959 obstacle, upside constraints could emerge around the 23.6% Fibo of 2,001 and the 2,009 high overhead. If bullish drive grows, traders’ focus could shift to the upper Bollinger band at 2,034. Successfully overrunning it though, the price may revisit the section between the 2,059 barrier and the all-time high of 2,074, where the 19-month high also resides.
Summarizing, gold’s bullish bias is under strain but should remain active if the price holds above the 1,950-1,959 supporting barrier and the mid-Bollinger band at 1,934. Yet, in order to reinforce negative tendencies, the commodity’s price would need to sink past the 1,877-1,891 support border.
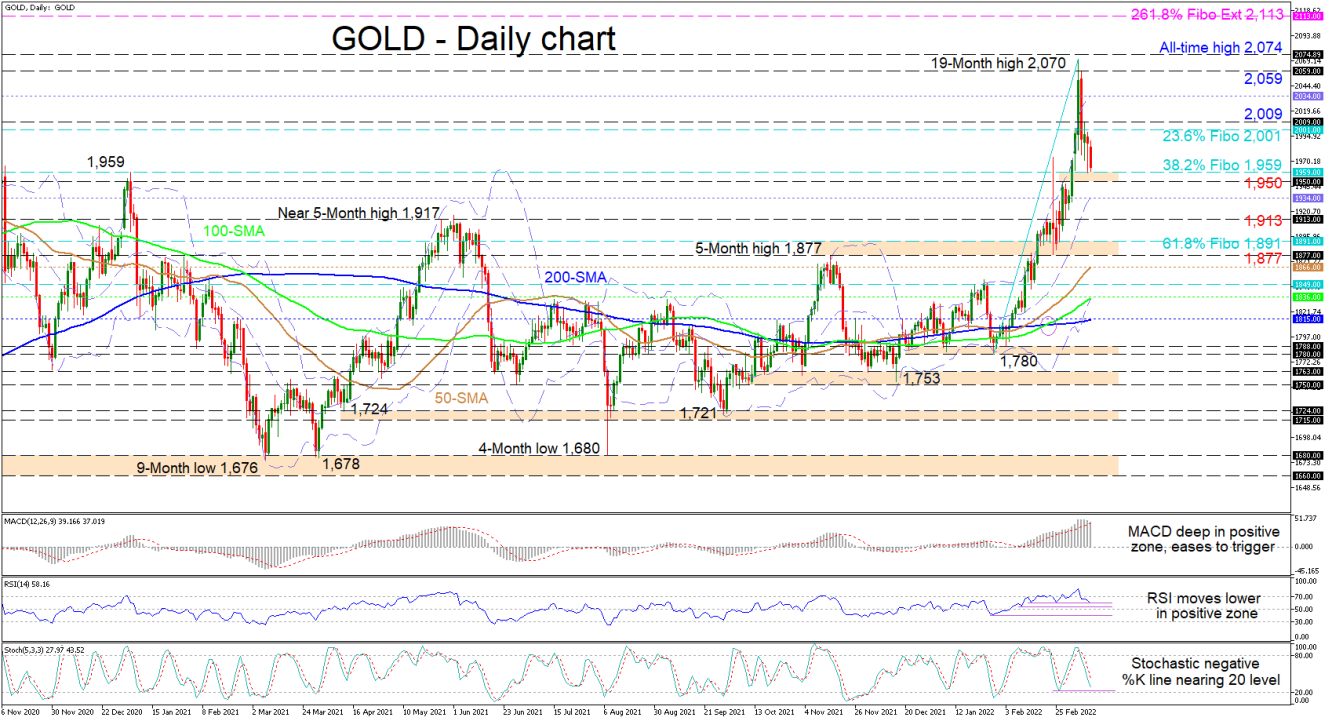
140322_GOLD Daily
Read Full Story »»»
DiscoverGold
$TM Sanctions against Russia threaten London gold and silver markets, Maguire says
9:16a ET Saturday, March 12, 2022
Dear Friend of GATA and Gold:
Russia, like China, has much more official gold than it has reported and
the two nations are considering using the "nuclear option" against the
petrodollar, London gold trader Andrew Maguire claims in his weekly
interview with Shane Morand for Kinesis Money.
That is, Maguire says, Russia would demand gold as payment for its oil
exports.
Further, Maguire says, the Bank of Russia's increasing acquisition of
domestically produced gold will reduce supply on the international
market, just as economic sanctions against Russia will reduce supply of
Russian silver to the London market.
The interruption of Russian silver supply to London, Maguire says, is
already imperiling silver delivery commitments and silver derivatives,
raising the threat of defaults.
Maguire's interview with Morand is 37 minutes long and can be viewed at
YouTube here:
https://www.youtube.com/watch?v=JJ0XM8fufOQ
CHRIS POWELL, Secretary/Treasurer
Gold Anti-Trust Action Committee Inc.
CPowell@GATA.org
$They’re Lying, Inflation Is Out Of Control And It’s Bullish For Gold & Silver
February 10, 2022
https://kingworldnews.com/theyre-lying-inflation-is-out-of-control-and-its-bullish-for-gold-silver/
$Expert Says GOLD Could Hit $100,000 Soon!! (Here's How)
78,050 views Mar 8, 2022
https://www.youtube.com/watch?v=35x8N7Va8zg
) ) Gold Market Update - Slingshot Advance Is Still In Its Infancy...
By: Clive Maund | March 13, 2022
Everything is “going to plan” as far as the Precious Metals sector is concerned with gold taking off strongly higher as predicted and the Precious Metals sector outperforming the broad market for the 1st time in a long time, also as predicted. Two articles were posted on the site about this. One entitled WHY THE PRECIOUS METALS SECTOR IS BELIEVED TO BE AT A TERRIFIC BUY SPOT HERE was posted at the sector low at the end of January right before the current vigorous rally started and the other entitled GOLD & SILVER SET TO SOAR AS BANK ACCOUNTS AND CRYPTO WALLETS COME UNDER THREAT called for further strong gains in gold and especially big high dividend paying gold stocks, which is what we saw courtesy of the Russian invasion of Ukraine.
On gold’s latest 13-year chart we can see how it has been projected higher by the boundary of a giant Bowl pattern and even though it may pause to consolidate for a little while at the resistance at its 2020 highs to allow its overbought condition to ease somewhat, new highs don’t look far away, and it is ultimately set to go much much higher as the value of the dollar continues to dwindle in the face of frenetic money creation.
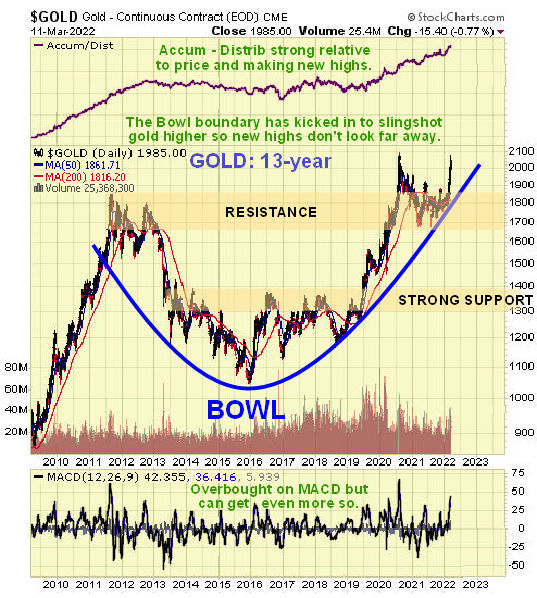
On the 4-year chart we can see how gold broke higher last month from a large triangular consolidation pattern exactly as predicted in ----. As it has already broken out to clear new highs against most all other currencies, it is unlikely that it will stopped for long by the resistance at the 2020 highs.
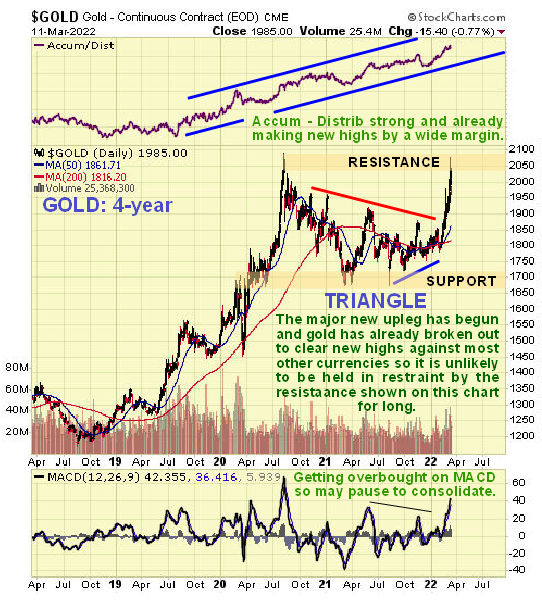
On the 13-year chart for gold in euros we can see how gold has already made a clear breakout against this currency, which is hardly surprising with Europe on the brink of another major conflict, which it likes to do every generation or two. The Ukraine war marks Stage 2 of The Great Reset, and it serves to draw attention away from the vaccine holocaust at a time when it was becoming more obvious, block closer economic ties between Europe and Russia, drive up the price of energy in order to both promote alternative energy and collapse the world economy, and stop the exports of both fertilisers and grains from Belarus, Hungary and the Ukraine the better to reduce the world population through starvation. So gold should continue to advanc e strongly against the euro and Europe is ground down and impoverished by spreading conflict.
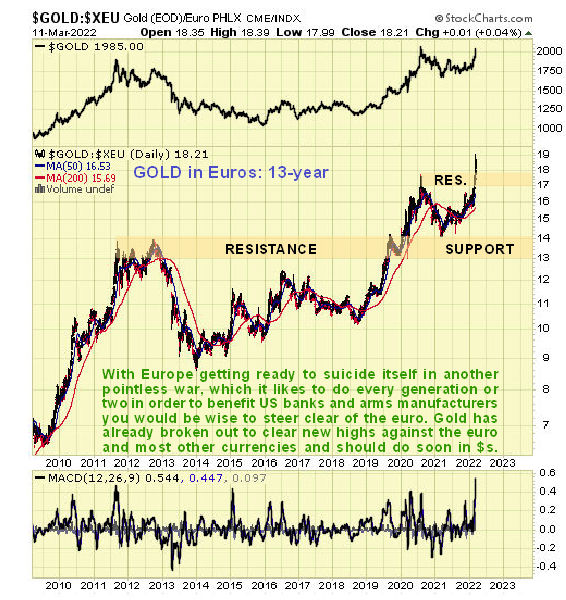
Turning now to Precious Metals stocks which have been doing very well in the recent past, we see on its 5-year chart that GDX has broken out strongly from the large consolidation Pennant that formed from the August 2020 highs. A major new uptrend is believed to have begun that should see it rally above these highs and then continue on, with pauses to consolidate along the way, towards the resistance at its 2011 highs, which it is expected to eventually overcome.
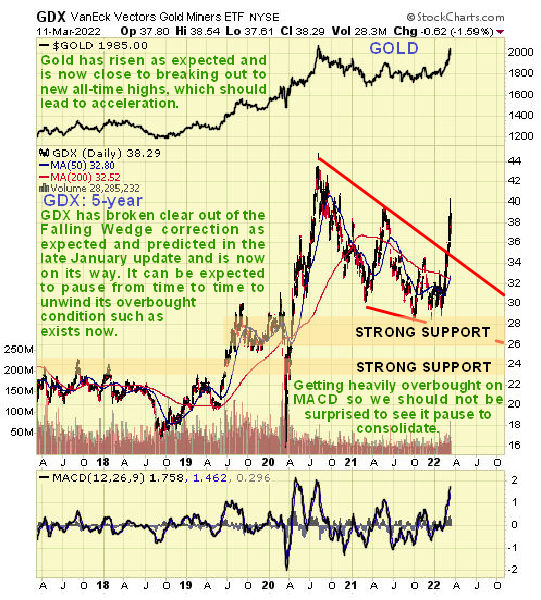
On the 2-year chart we can see how the strong advance by GDX brought it to a resistance level which it arrived at in a quite heavily overbought state, so it has paused to consolidate. Notice how, after markedly underperforming the broad stockmarket (shown at the top of this chart) from its August 2020 highs, it has now switched to outperforming it, as expected.
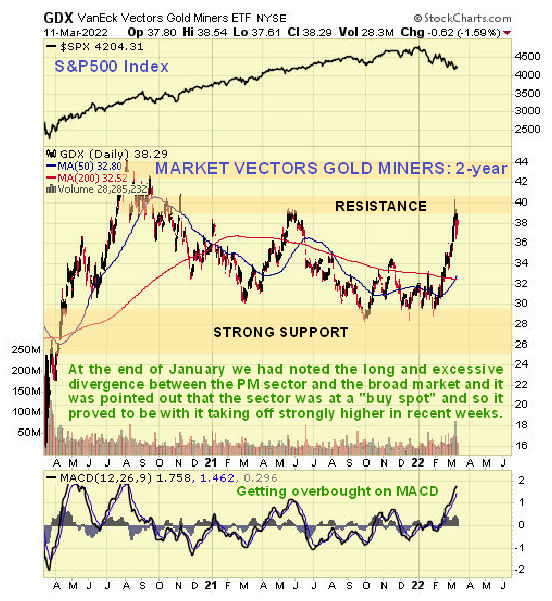
On the 6-month chart for GDX we can see the fine strong uptrend that has taken hold since the middle of February, obviously assisted by the Ukraine conflicto. As it is now overbought at resistance it may pause and possibly react back some, and it should be noted that it doesn’t matter much if it breaks down from this uptrend channel, as it is so steep. If it does it will probably form a consolidation pattern such as a trading range or a Flag / Pennant before advancing anew.
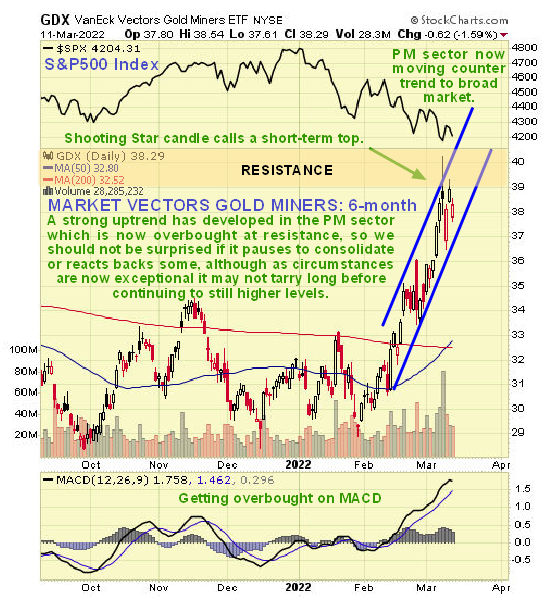
The 26-month chart for GDX relative to the S&P500 index reveals the serious underperformance of the sector relative to the broad market that went on until the end of last year, but this year it has reversed into significant outperformance although it still has quite a bit of ground to make up.
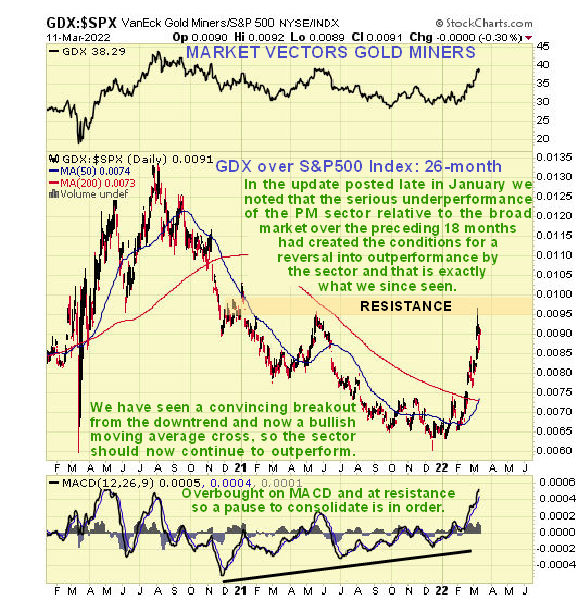
We’ll finish by taking a quick look at the dollar index which has rallied quite sharply with gold in recent weeks basically for the same reason, which is that at a time of crisis of this nature, both are regarded as relatively safe havens. Whilst the dollar is intrinsically weak and ultimately doomed, along with all other fiat, it is for now the best of a bad bunch, which is why its exchange rate against most other currencies has improved. On the dollar’s 13-year chart we can see that it is traversing back up across the giant trading range that has been forming since early 2015. It looks likely that it will continue on to the top of this range, but it is hard to say at this juncture if it will succeed in breaking out of the top of it.
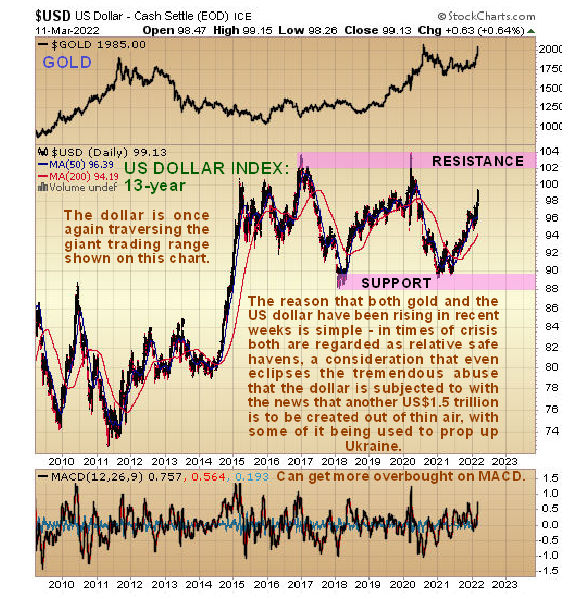
What is happening now across the world was predicted many years ago by Elliott Wave theorists who detailed a confluence of upward cycles all coming to an end around this time, including what they call a “grand supercycle” which is a massive long-term cycle, the biggest. We are at the end of an era or epoch, and are now entering the downward part of what is also known as the Kondratieff Wave which is a long-term economic cycle. The global collapse that is gathering pace is the inevitable result of yet another doomed fiat experiment that has gotten completely out of control and has been taken to the wildest extremes imaginable. This collapse is also laying bare who really governs the world, which is the World Economic Forum, also known as the Globalists or the New World Order, an elite transnational club of billionaires and plutocrats, who have come to the fore as they steer the world towards their objectives of mass depopulation, the implementation of a total control grid and the transfer of all assets and wealth to themselves.
Read Full Story »»»
DiscoverGold
$GDX great way to play $GLD and $SLV is the miners
By: Options Mike | March 12, 2022
• $GDX great way to play $GLD and $SLV is the miners.. Nice dip and hold of the 8D on this one. Very strong still.

Read Full Story »»»
DiscoverGold
Forecast: Gold Cycles Forge Ahead Into Key 'Panic' Zone
By: Jim Curry | March 13, 2022
Recapping Last week
Last week's trading saw gold forming its high in early-week trading, here doing so with Tuesday's spike up to the 2078.80 figure. From there, a sharp decline was seen into late-week, with the metal dropping all the way down to a Friday low of 1960.90 - before bouncing off the same into the weekly close.
Gold Market, Short-Term
For the near-term action, the current correction phase is coming from the smallest- tracked wave, the 10-day component, shown again on the chart below:
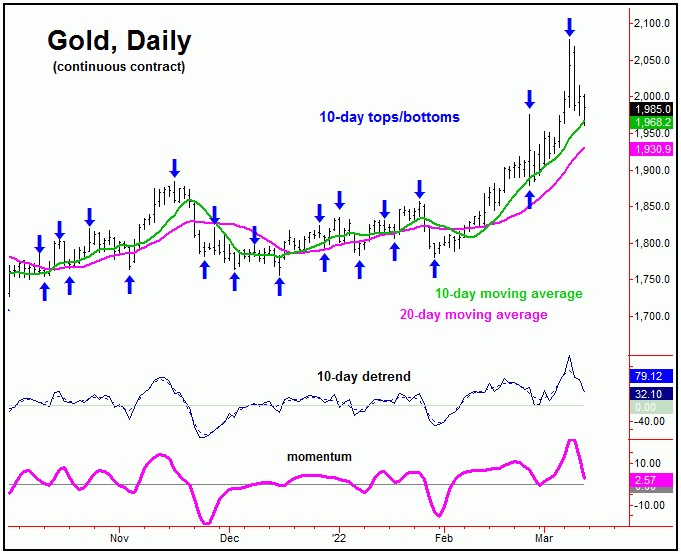
From last weekend: "should Gold take out the 1976.50 swing top, then we will have to label a 10 and 20-day trough in place, though there would still be the risk for a quick spike down to the 20-day moving average. That same moving average looks to be a key support level, should it be attempted at any point in the days ahead."
As mentioned above, taking out the 1976.50 swing top inferred a prior 10 and 20-day trough having formed with the February 24th low of 1878.60 - though it did so without our customary tag of the 20-day moving average. Following my rule in regards to cycles and moving averages, we should expect to see approximately 85-90% of the downward phases of the 20-day wave reverting back to this 20-day average.
Going further with the above, taking out the 1976.50 swing top saw an additional 100 points of upside follow-through into the March 8th peak. By the time that our 10 and 20-day trough was confirmed to have been registered, however, the smaller 10-day component was already 7 trading days along into its new upward phase.
With the above said and noted, we pointed out (in our Gold Wave Trader report) that the metal was due for another quick correction off the top, coming from this same 10-day wave. In terms of price, the 10-day moving average was noted as the ideal downside magnet, which was easily hit - doing so with Friday's early-day decline.
The chart below shows the larger 20-day cycle:
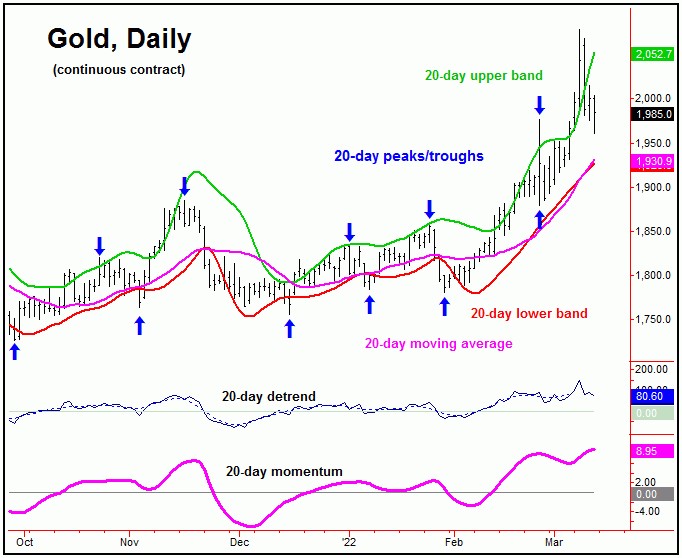
Stepping back slightly, the current downward phase of the 10-day cycle has support around the 10 and 20-day moving averages - if the upward phase of the larger 72-day cycle is going to remain intact. In other words, if this range of support is able to hold the current decline, then gold can see one more spike back to or above the highs in the next week or so, before completing an extended 72-day peak.
Here again is that larger 72-day cycle:
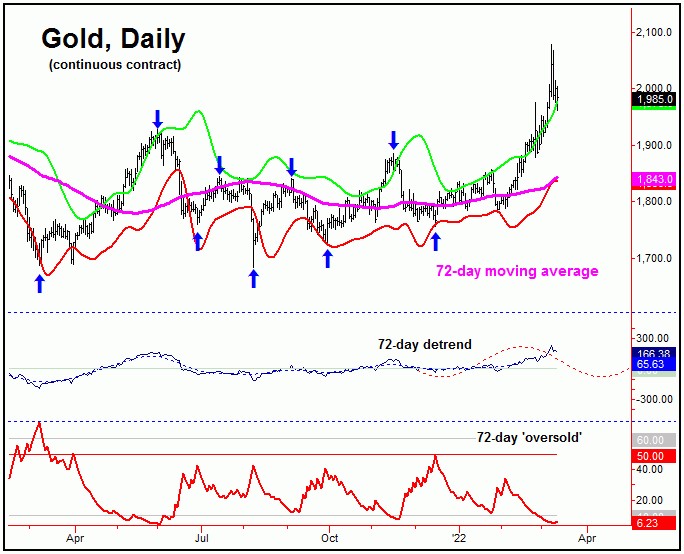
Gold Market, 3-6 Week View
Stepping back, the next correction of significance is still expected to come from the larger 72-day wave - which is now moving into extended territory. In terms of price, it was the early-January close above the 1818.00 figure (our upside reversal point at the time) that originally confirmed the upward phase of this wave to be in force.
With our 72-day 'oversold' indicator spiking below its lower reference line - and price well above the upper 72-day cycle band - this cycle is looking for its next peak to occur at anytime, and may have already formed with last week's tag of the 2078.80 figure. However, that has yet to actually be confirmed - by taking out a key level that we are watching in our Gold Wave Trader report.
Otherwise, if gold can hold short-term support (10 and 20-day moving averages) with the smaller 10-day cycle downward phase, then it could see one final spike higher into our March 16-21 'panic' zone - which was noted in last weekend's article. If seen, that move would be strongly favored to peak our extended 72-day cycle.
Once this 72-day wave does top, a decent correction into early-April is expected to play out, one which sees the 72-day moving average and/or lower 72-day cycle band acting as the magnet. That same region could provide a key mid-term support level, if the larger bullish trend is going to remain intact into mid-Summer, before topping the larger 154 and 310-day cycles. More on the bigger-picture assessment with these waves as we move forward.
Read Full Story »»»
DiscoverGold
|
Followers
|
150
|
Posters
|
|
|
Posts (Today)
|
0
|
Posts (Total)
|
5580
|
|
Created
|
06/29/08
|
Type
|
Free
|
| Moderators DiscoverGold trunkmonk | |||

http://www.vaneck.com/index.cfm?cat=3192&tkr=GDX&LN=3-02
The Gold Miners ETF seeks to replicate as closely as possible, before fees and expenses, the price and yield performance of the NYSE Arca Gold Miners Index. The Index provides exposure to publicly traded companies worldwide involved primarily in the mining for gold, representing a diversified blend of small-, mid- and large-capitalization stocks. As such, the Fund is subject to the risks of investing in this sector.
| ||||||||||||||||||||||||||||||||||||||||||||||||||||||||||||||||||||||||||||||||||||||||||||||||||||||
| DAILY |
| WEEKLY |
| Volume | |
| Day Range: | |
| Bid Price | |
| Ask Price | |
| Last Trade Time: |


