


| Followers | 687 |
| Posts | 142406 |
| Boards Moderated | 35 |
| Alias Born | 03/10/2004 |
Monday, March 14, 2022 8:18:38 PM
By: XM Group | March 14, 2022
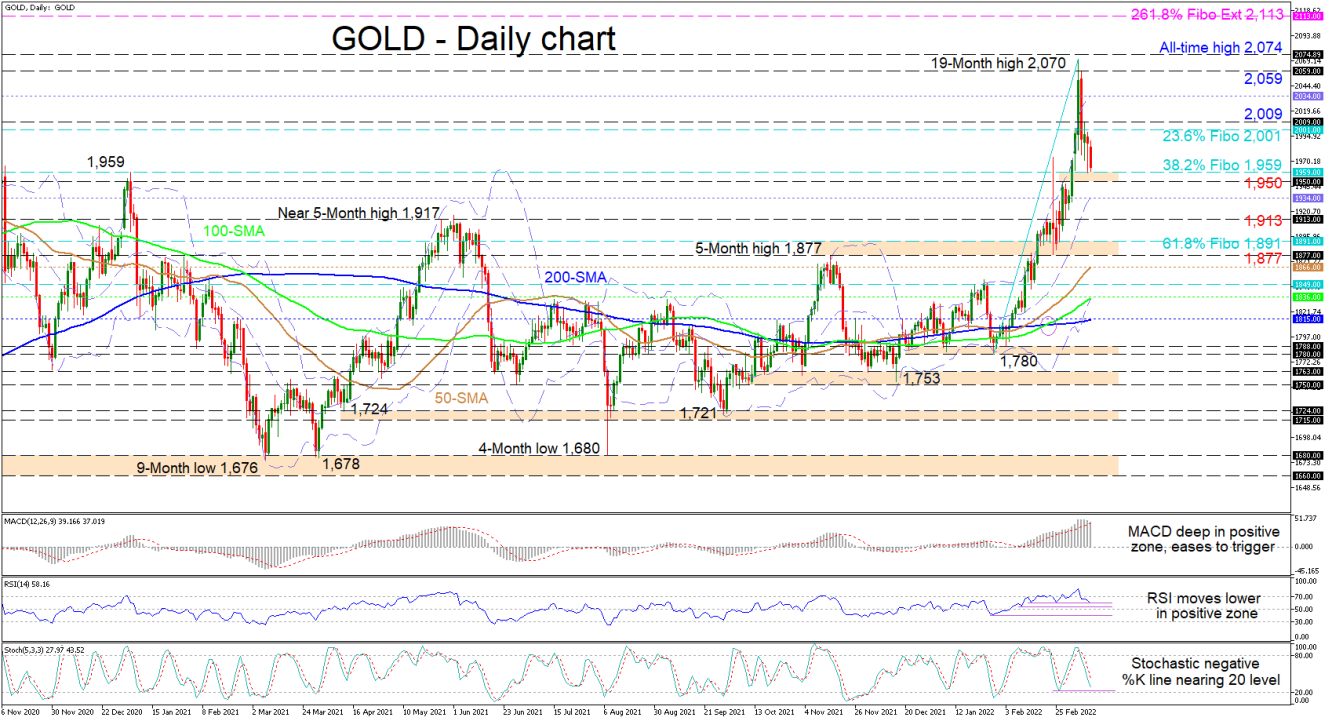
Gold’s downward pressures are weighing on the 1,959 level, which is the 38.2% Fibonacci retracement of the recent 1,780-2,070 rally.
Despite the deep retreat in the price of the commodity, the bullish simple moving averages (SMAs) continue to endorse the ascent in the precious metal.
Meanwhile, the short-term oscillators are skewed to the downside, confirming that positive impetus is fading. The MACD is far north of the zero threshold and looks set to slide beneath its red trigger line, while the RSI is falling in the bullish zone. Furthermore, the negatively charged stochastic oscillator is suggesting additional negative price action.
In the negative scenario, an immediate support band exists between the 38.2% Fibo of 1,959 and the inside swing high of 1,950. If this upside defence dissolves, sellers could meet the mid-Bollinger band at 1,934 before testing the 1,913 low. Surrendering extra ground, the bears may then target a buffer zone from the 61.8% Fibo of 1,891 until the 1,877 trough, recorded on February 24.
Alternatively, if buyers create positive traction off the 1,950-1,959 obstacle, upside constraints could emerge around the 23.6% Fibo of 2,001 and the 2,009 high overhead. If bullish drive grows, traders’ focus could shift to the upper Bollinger band at 2,034. Successfully overrunning it though, the price may revisit the section between the 2,059 barrier and the all-time high of 2,074, where the 19-month high also resides.
Summarizing, gold’s bullish bias is under strain but should remain active if the price holds above the 1,950-1,959 supporting barrier and the mid-Bollinger band at 1,934. Yet, in order to reinforce negative tendencies, the commodity’s price would need to sink past the 1,877-1,891 support border.
140322_GOLD Daily
Read Full Story »»»
 DiscoverGold
Information posted to this board is not meant to suggest any specific action, but to point out the technical signs that can help our readers make their own specific decisions. Caveat emptor!
• DiscoverGold
Recent GDX News
- YieldMax GDXY Name Change • GlobeNewswire Inc. • 01/25/2024 04:22:00 PM
- Surging S&P 500 Breadth • ValueWalk • 07/19/2023 03:16:37 PM
- S&P 500 Corrects In Breadth • ValueWalk • 07/18/2023 03:08:49 PM
- If The USDX Fell So Much, Why Didn’t Gold Truly Soar? • ValueWalk • 07/17/2023 05:16:20 PM
- USD’s Decline That’s… Bearish For Gold?! • ValueWalk • 07/12/2023 02:38:08 PM
- S&P 500 Late Day Reversal Worry • ValueWalk • 07/10/2023 03:17:34 PM
- Massive Gaming Celebrates Global Launch of House of Blackjack with USDC Earning Race • ValueWalk • 07/10/2023 02:44:17 PM
- Breathers In Mining Stocks Are Not Real Rallies • ValueWalk • 07/06/2023 05:20:55 PM
- S&P 500 Character Changes • ValueWalk • 07/06/2023 03:10:06 PM
Freedom Holdings Corporate Update; Announces Management Has Signed Letter of Intent • FHLD • Jul 3, 2024 9:00 AM
EWRC's 21 Moves Gaming Studios Moves to SONY Pictures Studios and Green Lights Development of a Third Upcoming Game • EWRC • Jul 2, 2024 8:00 AM
BNCM and DELEX Healthcare Group Announce Strategic Merger to Drive Expansion and Growth • BNCM • Jul 2, 2024 7:19 AM
NUBURU Announces Upcoming TV Interview Featuring CEO Brian Knaley on Fox Business, Bloomberg TV, and Newsmax TV as Sponsored Programming • BURU • Jul 1, 2024 1:57 PM
Mass Megawatts Announces $220,500 Debt Cancellation Agreement to Improve Financing and Sales of a New Product to be Announced on July 11 • MMMW • Jun 28, 2024 7:30 AM
VAYK Exited Caribbean Investments for $320,000 Profit • VAYK • Jun 27, 2024 9:00 AM

