


| Followers | 687 |
| Posts | 142406 |
| Boards Moderated | 35 |
| Alias Born | 03/10/2004 |
Monday, March 28, 2022 8:22:13 AM
By: Jim Curry | March 27, 2022
Recap of Last week
Last week's trading saw gold forming its low for the week in Tuesday's session, here doing so with the tag of the 1909.80 figure (April, 2022 contract). From there, a decent push higher was seen into later in the week, with the metal running up to a Thursday peak of 1967.20 - before backing off the same into Friday's session.
Gold's Short-Term Cycles
For the near-term action, the most recent strength for gold has come from our smallest-tracked wave, the 10-day component:
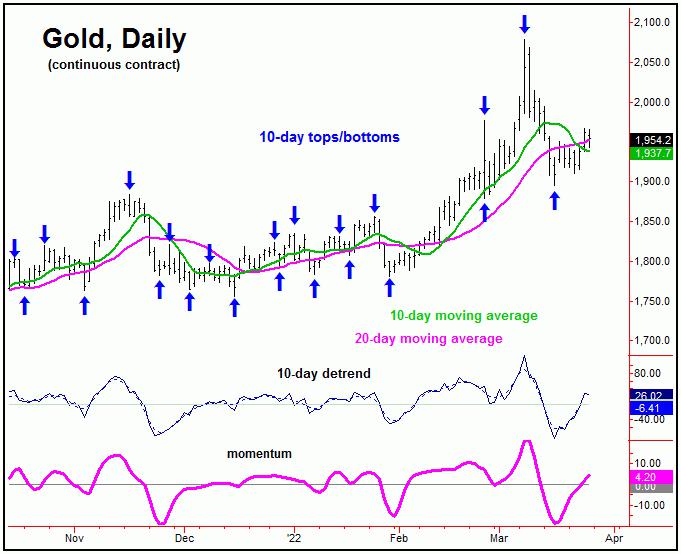
From last weekend: "for the very short-term, it looks like our 10-day cycle may have bottomed on Wednesday, which would be confirmed by any reversal above the 1952.00 figure (April, 2022 contract). If seen, the path would favor additional strength through the same, with the 10-day moving average acting as the normal minimum magnet to the upward phase of this component - a move which is now favored to end up as a countertrend affair."
As mentioned last weekend, the upward phase of the 10-day cycle was already suggested to be in force, and was later confirmed. In terms of price, our minimum expected magnet called for a rally back to the 10-day moving average for gold, which has easily been met. In terms of time, this 10-day wave is now some 6-7 trading days along, and thus is moving back into topping range.
Having said the above, there is a larger 20-day wave which is also influencing price action, with that particular cycle shown on our next chart:
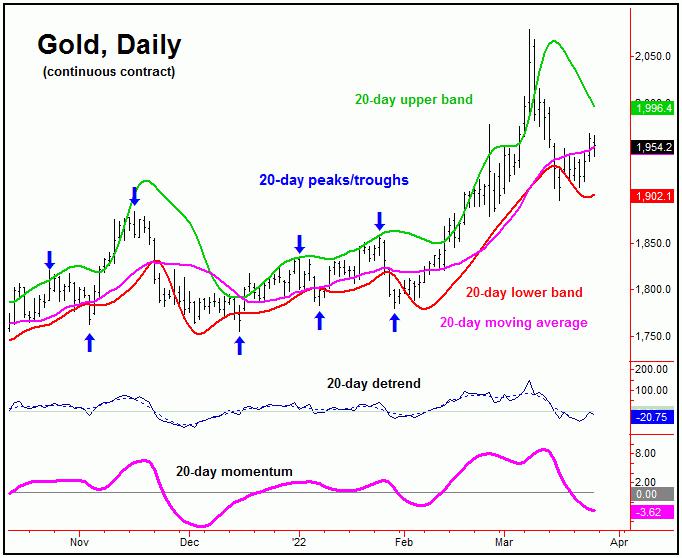
The fact that the 10-day cycle is bullishly right-translated means that the upward phase of this 20-day wave is also in force. With that, the next short-term peak should come from the combination of 10 and 20-day cycles, due to materialize in the coming days.
In terms of price, there is key resistance to the short-term upward phase at or into the 1986-2008 region for gold, which is the 50-61% retracement zone of the move down from the 2078 swing top to the 1895 swing low. This same range is also near our upper 20-day cycle band (i.e., 1996 and declining), and - if tested in the days ahead - would be an ideal area to watch for the next countertrend peak to form.
Gold's 72-Day Cycle
From the comments made in past articles, the last peak of significance was due to materialize, coming from the larger 72-day cycle, shown again below:
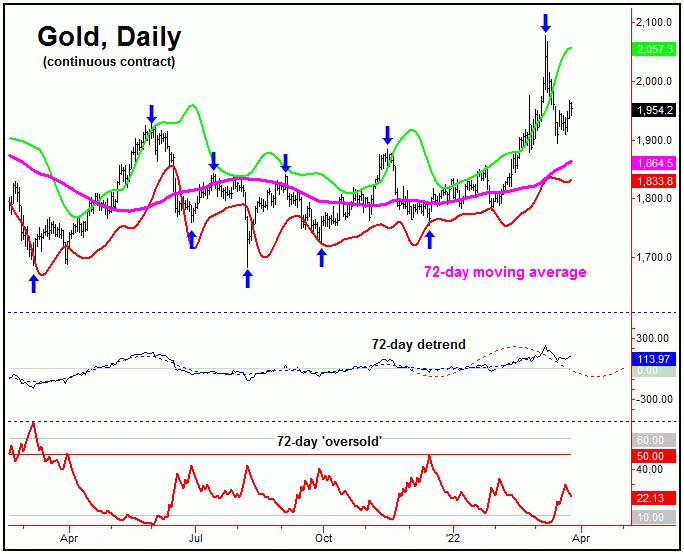
With the action seen in recent weeks, the downward phase of this 72-day wave has been confirmed to be in force, and with that is seen as pushing lower into the mid-April timeframe, plus or minus.
With the above then said and noted, a countertrend rally with the 10 and 20-day waves - if seen as expected in the days ahead - should give way to a lower lows for the larger 72-day cycle downward phase into mid-April, plus or minus. From there, we will need to be on the lookout for key indications of the next 72-day trough forming, as what follows should be another sizeable rally into the Summer months.
In terms of patterns, the downward phase of our 72-day cycle is favored to end up as a countertrend affair - against the mid-December, 2021 trough of 1755.30. If correct, the odds will favor a push back above the 2078.80 swing high on the next 72-day cycle upward phase into this Summer.
Going further with the above, lower lows for the swing into April, if seen as expected, would have us on the lookout for technical indications of the next 72-day trough forming. For one of those indications, I would like to see gold spiking down for a daily close below our lower 72-day cycle band, and - on the same day - a spike above our 72-day 'oversold' reference line.
From the comments made in recent articles, the aforementioned technical pattern with our 72-day band and 'oversold' indicator is one normally seen closer to 72-day troughs, just as the inverse of this pattern (and mentioned at that time) formed just a few days prior to the 2078.80 swing top.
For the mid-term picture, higher highs into the Summer months - if seen as expected - should set up a more important peak for the metal. From there, another sharp decline phase will be expected to play out into later this year, before turning back to strength into the Spring of 2023. More on all as we continue to move forward.
Read Full Story »»»
 DiscoverGold
Information posted to this board is not meant to suggest any specific action, but to point out the technical signs that can help our readers make their own specific decisions. Caveat emptor!
• DiscoverGold
Recent GDX News
- YieldMax GDXY Name Change • GlobeNewswire Inc. • 01/25/2024 04:22:00 PM
- Surging S&P 500 Breadth • ValueWalk • 07/19/2023 03:16:37 PM
- S&P 500 Corrects In Breadth • ValueWalk • 07/18/2023 03:08:49 PM
- If The USDX Fell So Much, Why Didn’t Gold Truly Soar? • ValueWalk • 07/17/2023 05:16:20 PM
- USD’s Decline That’s… Bearish For Gold?! • ValueWalk • 07/12/2023 02:38:08 PM
- S&P 500 Late Day Reversal Worry • ValueWalk • 07/10/2023 03:17:34 PM
- Massive Gaming Celebrates Global Launch of House of Blackjack with USDC Earning Race • ValueWalk • 07/10/2023 02:44:17 PM
- Breathers In Mining Stocks Are Not Real Rallies • ValueWalk • 07/06/2023 05:20:55 PM
- S&P 500 Character Changes • ValueWalk • 07/06/2023 03:10:06 PM
Freedom Holdings Corporate Update; Announces Management Has Signed Letter of Intent • FHLD • Jul 3, 2024 9:00 AM
EWRC's 21 Moves Gaming Studios Moves to SONY Pictures Studios and Green Lights Development of a Third Upcoming Game • EWRC • Jul 2, 2024 8:00 AM
BNCM and DELEX Healthcare Group Announce Strategic Merger to Drive Expansion and Growth • BNCM • Jul 2, 2024 7:19 AM
NUBURU Announces Upcoming TV Interview Featuring CEO Brian Knaley on Fox Business, Bloomberg TV, and Newsmax TV as Sponsored Programming • BURU • Jul 1, 2024 1:57 PM
Mass Megawatts Announces $220,500 Debt Cancellation Agreement to Improve Financing and Sales of a New Product to be Announced on July 11 • MMMW • Jun 28, 2024 7:30 AM
VAYK Exited Caribbean Investments for $320,000 Profit • VAYK • Jun 27, 2024 9:00 AM

