Register for free to join our community of investors and share your ideas. You will also get access to streaming quotes, interactive charts, trades, portfolio, live options flow and more tools.
Gold Bullish Behavior Points to Continued Upside
By: Bruce Powers | March 27, 2024
• Gold's resilience and bullish behavior suggest further gains, with key support levels and potential upside targets identified.
Although gold closed relatively weak on Tuesday, it has again successfully tested the 8-Day MA today (Wednesday) as support and bounced. It has found support around the 8-Day line for four of the past five days. Currently, gold is trading inside day, and it is up from the open with a green candle.

Further Signs Retracement Complete
The recent retracement from the new 2,212 record high hit last week found support at a low of 2,157 last Friday. In addition to the area around the 8-Day line denoting support, the 2,157 low was also at the 78.6% Fibonacci retracement and a top trendline beginning from the swing high on May 1. The relationship with the top trend line shows the market recognizing the price zone represented by the line. This is bullish behavior in an uptrend as prior resistance is now being shown as support. The way should be clear for gold to continue its ascent.
Breakout Signal Above 2,200
Nevertheless, a signal is needed to confirm the bullish thesis. That will be provided on a decisive breakout above yesterday’s high of 2,200. A slightly earlier sign will be given on an advance above today’s high of 2,198.
Gold Remains Above Previous Record High
Gold continues to trade in new high territory above the prior record high of 2,135 from December 4. And it has remained strong enough to not fall back to test that price area as support. In the near-term, it is working on following through from the bullish breakout of a small wedge pattern. When taking into consideration the sharp advance that proceeded the wedge consolidation, a potential upside target can be calculated. The sharp advance began upon the breakout of a large symmetrical triangle pattern on February 29. Counting from that day’s low, a sharp 8.2% six-day advance followed. A similar rise following the wedge breakout would put gold up at 2,320.
Pullback Complete
The first pullback following the wedge breakout last Wednesday should now be complete. But, as noted above, there needs to be another bullish confirmation signal. Once that triggers gold should be heading into two initial potential target zones. The first begins at 2,235 and the second at 2,277. A large rising ABCD pattern completes at 2,298, and as noted above the wedge pattern target 2,320.
Read Full Story »»»
 DiscoverGold
Gold $GLD - Latest: Holding its Daily Mustard 12/MA...
By: Sahara | March 27, 2024
• ... $GOLD $GLD - Latest
Holding its Daily Mustard 12/MA...

Read Full Story »»»
 DiscoverGold
Gold Bullish Reversal Signals Potential Upside Breakout
By: Bruce Powers | March 26, 2024
• Technical analysis indicates a potential bullish breakout in gold, with initial targets at 2,235-2,246 and 2,277-2,298 based on Fibonacci confluence.
Gold triggers a bullish reversal today as it breaks out from the inside day established on Monday on a rise above 2,181. A daily close above that high is needed next to confirm the reversal. The reversal is a bullish continuation from the minor retracement low of 2,157 established last Friday. It follows a rally from a bullish wedge breakout that occurred last Wednesday. After two days up, however, resistance was seen at 2,212 leading to last week’s pullback low.

Near-term Support at 2,168
Near-term support is at today’s low of 2,168. If it is busted to the downside the chance for a deeper retracement from the 2,212 high increases. However, the 2,157 area may still offer support. If it does and leads to a bullish reversal, further upside may be forthcoming. Moreover, if the 2,157 level is busted to the downside, a deeper retracement is likely in the works and the bullish wedge is at risk of failure.
Upside Targets
Price behavior following the bullish wedge has not been as strong as it might be as upward momentum ended after less than two days. Nevertheless, strength starts to return, as noted above, upon a daily close above 2,181, and further still on a close above the three-day high of 2,186. Initial upside targets are highlighted on the chart and are defined by Fibonacci confluence. That is where two or more Fibonacci levels identify a similar price area. The first is from 2,235 to 2,246 and the second is from 2,277 to 2,298.
Further, the high end of the range at 2,298 is where a rising ABCD pattern reflects symmetry. That is where the price change in the CD leg of the advance reflects symmetry with the AB leg. It marks a potential pivot level.
Wedge Targets 2,320
A higher and more significant target is derived from the measuring objective of the bullish wedge. Notice that prior to the wedge forming off the March 8 high gold advanced by 211 points or 10.6% in 17 trading days. However, momentum truly ramped up starting from February 29. When using that low to high measure the advance comes in at 167 points or 8.2%. That calculation presents a 2,320 target.
Read Full Story »»»
 DiscoverGold
Americas Gold and Silver Corporation Drills Bonanza Grade at Galena Complex
✌️✔️
Gold’s Fresh Highs; Fed’s Cred Demise?
By: Mark Mead Baillie | March 24, 2024
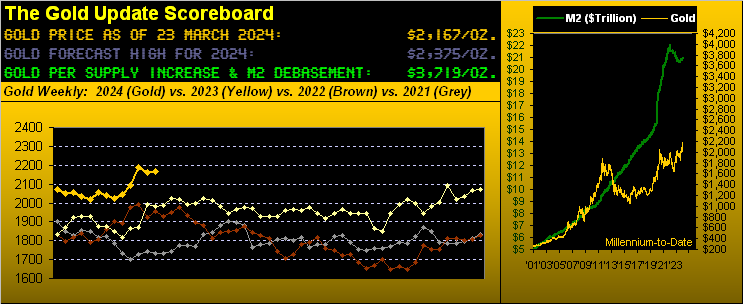
Gold recorded another series of fresh All-Time Highs this past week in eclipsing the 2203 level (from 08 March) in a swift run up to 2225 on Thursday before coming off (as we’ve written “expectedly”) in settling yesterday (Friday) at 2167. Still, given Gold’s momentum with but a week to go in Q1 of 2024, our forecasted year’s high at 2375 remains rightly reasonable.
But let us again head with the Fed, indeed query if ’tis losing its cred. Clearly that which we herein penned a week ago “…Obviously the FOMC shall unanimously vote to do nothing with its Bank’s Funds Rate…” is exactly what occurred per the Open Market Committee’s Policy Statement issued on Wednesday. Our takeaway these many years — rather than watch all the FinMedia bilge — comes from simply reading the Statement, in which for 20 March are these three key sentences:
• “The Committee seeks to achieve maximum employment and inflation at the rate of 2 percent over the longer run.”
• “The Committee does not expect it will be appropriate to reduce the target range until it has gained greater confidence that inflation is moving sustainably toward 2 percent.”
• “The Committee is strongly committed to returning inflation to its 2 percent objective.”
Yet even as inflation is ticking higher — above and beyond 2% — three FedFunds rate cuts remain on the table for the balance of 2024? What? “Curiouser and curiouser!” cried Alice…
To be sure, you’ve already seen the inflation tables we’ve presented in recent missives. So this time, let’s get graphic(!) Thus from 12 months ago-to-date (March ’23 through February ’24), below are the headline and core charts for the Consumer Price Index (CPI-retail inflation), Producer Price Index (PPI-wholesale inflation), and Personal Consumption Expenditures (PCE-Fed-favoured inflation). Note: the PCE February data points are the consensus estimates as the report is not due until next Friday, 29 March (the markets actually being closed that day). Therein: each data point is annualized per that month’s reading; each inflation track is accompanied by its dashed trendline; each panel is identically scaled; and the Federal Reserve’s 2% target level is in red. And again we say: “We’re going the wrong way”. Still, Bloomy ran this past week with “The Great Inflation Scare is Fading.” Clearly they don’t have these charts:
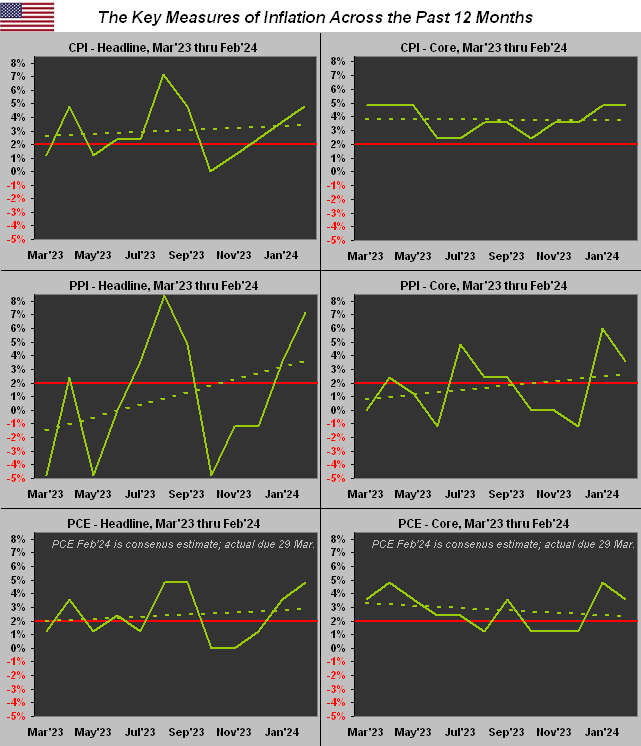
Demonstrably, the rightmost datapoint (February ’24) in every case is above the Fed’s 2% target. Moreover: most of the dashed trendlines are rising up and away from that target, the notable exception ironically being the “Fed-favoured” inflation measure of “PCE – Core”, the trend for which is admittedly nearing said 2% target. But really: three rate cuts? How about a rate hike? (Perhaps we ought apply to be on the FOMC, but the pay cut would be too dear…)
Hardly dear is dear old Gold. Its present 2167 price is -42% beneath our opening Gold Scoreboard’s Dollar-debasement valuation of 3719. So to Gold’s weekly bars we go, the rightmost blue-dotted parabolic Long trend now a young three weeks in duration in this year-over-year view:
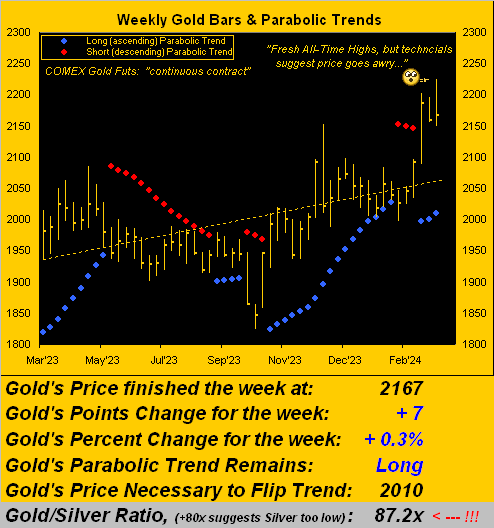
However, let us temper the rejoicing of Gold Going Great with some present technical negatives, courtesy of the “Party Pooper Dept.”, albeit with this caveat as penned a week ago: “…they’re clearly stretched to the upside, however great bull markets (or the resumption thereof) do breakout as such…” That for you WestPalmBeachers down there means Gold when technically overbought might actually be considered a good thing.
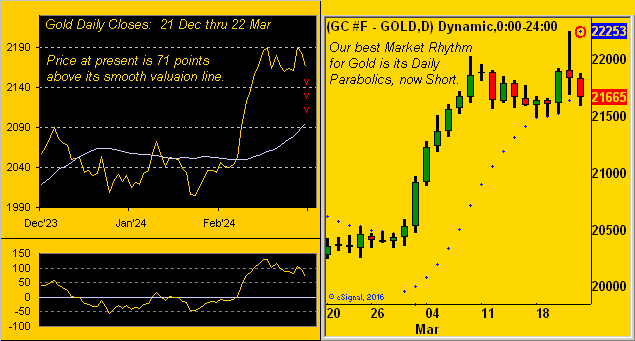
Either way, we’ve the following two-panel graphic. On the left again is Gold vis-à-vis its smooth valuation line from three months ago-to-date. Price at present is +71 points above the smooth line, the red down arrows suggestive of the eventual meeting of price with value, (that line itself on the rise; the points difference between price and value is at the foot of the panel). On the right are Gold’s daily candles across the past 21 trading days (one month) along with the Parabolics study that currently is our leading Market Rhythm for Gold: note the rightmost red-encircled dot which heralds the start of a Short trend. (Too, we’ll later see Gold’s “Baby Blues” of trend consistency suggesting lower price levels ahead). Here’s the graphic:
“So, mmb, the question becomes ‘How low is low’, eh?“
So ’tis, Squire, (barring the technicals instead catching up to price, which again in a bullish breakout is mathematically natural). Regardless, in looking above at the right-hand panel of Gold since a month ago, “The Big Move” in round numbers was +100 points from 2050 to 2150. Thus by structural support, that latter number ideally would be as low as Gold goes near-term. But with three technical negatives all simultaneously in play (price above value, Short daily parabolic trend, and as noted we’ll see, a breakdown in Gold’s “Baby Blues”), we sense 2150 shall bust, (this past week’s low having already touched 2149, but ’twas prior to Thursday’s 2225 All-Time High).
Nonetheless, does all that mean a full retracement back down to 2050 is warranted? ‘Tis dependent on buyside enthusiasm: through the 57 trading days year-to-date, Gold’s average daily COMEX contract volume is 208,633; yet for these past five days, the average is +15% higher at 240,638. We can therefore say that “Gold is in play”: however, Friday’s down day (high-to-low from 2188-to-2158) sported Gold’s largest one-day contract volume this year at 391,750, such “mo-mo suggesting more low” should dip buyers wait out more downside show. ‘Course, broadly on balance, Gold continues to look good to go with eventually higher levels to bestow.
Meanwhile, bestowed upon a needy, stagflative Economic Barometer this past week was improved data for housing. The National Association of Home Builders Index gained ground in March as did February’s readings for Housing Starts, Building Permits, and Existing Home Sales. In an otherwise light week for incoming data, the only “negative” metric was a slowing in March’s Philly Fed Index: but its result (3.2) was positive for just the fourth time in the past 22 months: “Fly, Eagles Fly”[Borrelli/Courtland, ’55]. Here’s the Baro:
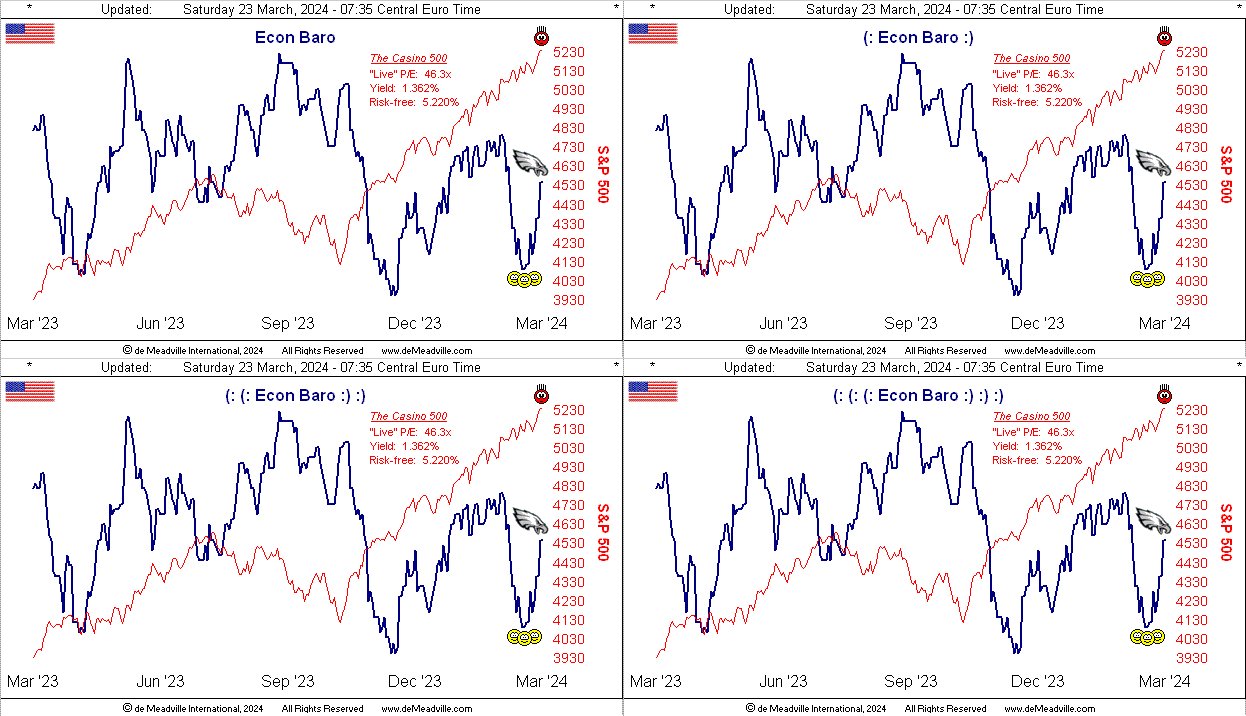
Yet does stagflation still lurk for the economy? Next week for the Econ Baro we’ve 14 metrics, just seven of which are expected to show period-over-period improvement. And again, the aforementioned February PCE, along with that month’s Personal Income/Spending, are to be released on next Friday’s holiday, meaning they can’t be traded upon until Monday, April Fools Day … oh baby.
As for the Casino 500, ’tis “nuthin’ but new highs” as the stock market continues to “price in” the same news over-and-over-and-over again. Week-after-week we read of the market rising day-after-day because of “Breaking News: The Fed Will Cuts Rates Three Times This Year!” The S&P is now “textbook overbought” to the tune of 45 consecutive trading days: going all the way back to the year 1980, that streak ranks in the 98th percentile of such overbought condition. Indeed yesterday, Janus’ Bill Gross characterized today’s investing climate as “excessive exuberance”. ‘Course, Smart Alec shan’t sell his shares until he (along with everyone else) is scared, the broker then crediting his account with IOUs when the money isn’t there*. (“Pssst: Got Gold?”)
* As of 22 March ’24: S&P 500 market cap: $45.7T; U.S. liquid money supply (M2): $21.0T.
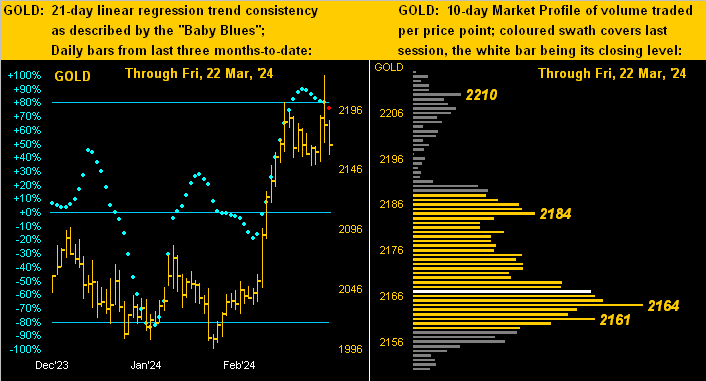
Next we’ve got more of Gold, and Silver too. Beginning with the yellow metal is our two-panel display of Gold’s daily bars from three months ago-to-date at left and 10-day Market Profile at right. Note the “Baby Blues” which depict trend consistency: we’ve actually coloured the rightmost one in red given its having dropped below the key +80 axis level. That generally leads to lower Gold levels near-term. For example: from one year ago-to-date, such “Baby Blues” slip phenomena has occurred on three occasions, the downside price movement within 21 trading days (one month) ranging from -10 points to -49 points, (i.e. were that to pan out in this case from today’s 2167 level, Gold would head down into a range between 2157 to 2118, just in case you’re scoring at home). As for the Profile, Gold is now sitting just above the trading support labeled as 2164:
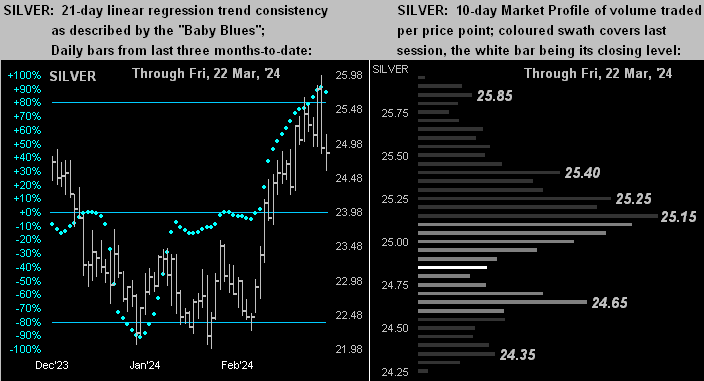
For the white metal, Sister Silver’s resent sweet ascent is now being met with some dissent. With the like drill as shown for Gold, her “Baby Blues” (below left) have just kinked down, and Profile support (below right) shows at 24.65. Should Silver sustain a bit of a hit, the high 23s would likely seem fit:
To close, we’ve these few quick quips.
This past Tuesday we awoke to read that Kazuo Ueda and his mates at Nippon Ginko — for the first time in 17 years — put positive the bank’s overnight lending rate in raising it from -0.1% to a sought range of 0.0% to 0.1%. Still, it all seems rather wee, but as goes the saying: “Saké to me, Saké to me, Saké to me…”
This past Thursday with Swiss precision at 09:00 CET, Tommy Jordan and his lads at Schweizerische Nationalbank cut — without scheduled notice — both their key lending and deposit rates to 1.50%. This in turn elicited the Swiss Franc’s largest single session high-to-low drop (-1.69%) versus the Dollar in better than a year. Or how would Emmental Robin put: “Holy cheese, Batman!”
And from the “You Can’t Make This BS Up Dept.”, hardly complete would be the week without having learned from “ABC News!” that according to The World Happiness Report, the Good Old USA no longer ranks amongst the Top 20 Happiest Countries. Aw shucks. But when your nation averages some 45 murders per day (per the Kaman Law Firm), ’tis hard to be happy. Indeed, that’s America, babe: “Death and Taxes!”
Read Full Story »»»
 DiscoverGold
Total open interest in gold futures has spiked in the past month. Normally a high open interest reading is a sign of a price top. But the correlation can invert.
By: Tom McClellan | March 23, 2024
• Total open interest in gold futures has spiked in the past month. Normally a high open interest reading is a sign of a price top. But the correlation can invert.

Read Full Story »»»
 DiscoverGold
NY Gold Futures »» Weekly Summary Analysis
By: Marty Armstrong | March 23, 2024
NY Gold Futures closed today at 21600 and is trading up about 4.25% for the year from last year's settlement of 20718. This price action here in March is reflecting that this has been still a bearish reactionary trend on the monthly level. As we stand right now, this market has made a new high exceeding the previous month's high reaching thus far 22253 intraday and is still trading above that high of 20832.
Up to now, we still have only a 2 month reaction decline from the high established during December 2023. We must exceed the 3 month mark in order to imply that a trend is developing.
ECONOMIC CONFIDENCE MODEL CORRELATION
Here in NY Gold Futures, we do find that this particular market has correlated with our Economic Confidence Model in the past. The Last turning point on the ECM cycle low to line up with this market was 2022 and 2015. The Last turning point on the ECM cycle high to line up with this market was 2020 and 2011 and 1996.
MARKET OVERVIEW
NEAR-TERM OUTLOOK
The NY Gold Futures has continued to make new historical highs over the course of the rally from 2015 moving into 2024. However, this last portion of the rally has taken place over 9 years from the last important low formed during 2015. Prominently, we have elected four Bullish Reversals to date.
This market remains in a positive position on the weekly to yearly levels of our indicating models. Pay attention to the Monthly level for any serious change in long-term trend ahead.
Solely focusing on only the indicating ranges on the Daily level in the NY Gold Futures, this market remains moderately bullish currently with underlying support beginning at 21587 and overhead resistance forming above at 21663. The market is trading closer to the support level at this time. An opening below this level in the next session will imply a decline is unfolding.
On the weekly level, the last important high was established the week of March 18th at 22253, which was up 5 weeks from the low made back during the week of February 12th. So far, this week is trading within last week's range of 22253 to 21492. Nevertheless, the market is still trading downward more toward support than resistance. A closing beneath last week's low would be a technical signal for a correction to retest support.
When we look deeply into the underlying tone of this immediate market, we see it is currently still in a semi neutral posture despite declining from the previous high at 22253 made 0 week ago. Still, this market is within our trading envelope which spans between 19857 and 21663. This market has made a new historical high this past week reaching 22253. Here the market is trading weak gravitating more toward support than resistance. We have technical support lying at 21878 which we are currently trading below implying the market is very weak. This infers that this level will now be resistance. Our Major Channel Support lies at 20256 and a break of that level would be a bearish indication for this market.
Right now, the market is above momentum on our weekly models hinting this is still bullish for now as well as trend, long-term trend, and cyclical strength. Looking at this from a wider perspective, this market has been trading up for the past 5 weeks overall.
INTERMEDIATE-TERM OUTLOOK
YEARLY MOMENTUM MODEL INDICATOR
Our Momentum Models are declining at this time with the previous high made 2020 while the last low formed on 2023. However, this market has rallied in price with the last cyclical high formed on 2023 and thus we have a divergence warning that this market is starting to run out of strength on the upside.
Looking at the longer-term monthly level, we did see that the market made a high in December 2023 at 21523. After a thirteen month rally from the previous low of 19879, it made last high in December. Since this last high, the market has corrected for thirteen months. However, this market has held important support last month. So far here in March, this market has held above last month's low of 19964 reaching 20470.
Critical support still underlies this market at 19070 and a break of that level on a monthly closing basis would warn that a sustainable decline ahead becomes possible. Nevertheless, the market is trading above last month's high showing some strength.
 DiscoverGold
Jack Chan: Gold Price Exclusive Update
By: Jack Chan | March 23, 2024

Our proprietary cycle indicator is UP.
To public readers of our updates, our cycle indicator is one of the most effective timing tool for traders and investors. It is not perfect, because periodically the market can be more volatile and can result in short term whipsaws. But overall, the cycle indicator provides us with a clear direction how we should be speculating.
Investors
Accumulate positions during an up cycle and hold for the long term.
Traders
Enter the market at cycle bottoms and exit at cycle tops for short term profits.

GLD is on short term buy signal.

GDX is on short term buy signal.

XGD.to is on short term buy signal.

GDXJ is on short term buy signal.
Analysis

Current data suggests a pullback/consolidation is imminent.

Current data supports an overall higher dollar.

Our ratio is on a new buy signal.

Trend is UP for USD.

Trend is DOWN for gold stocks.

Trend is UP for gold.

A similar candlestick suggests a pullback/consolidation is imminent.

A new high in gold and a lower high in gold stocks results in a divergence.

What is more alarming is that gold prices have been rallying higher since 2022 while gold stocks are struggling with lower highs.
Summary
Gold sector cycle is up.
Trend is up for USD and down gold stocks.
$$$ We are partially invested for the current up cycle.
Read Full Story »»»
 DiscoverGold
Gold CoT: Peek Into Future Through Futures, How Hedge Funds Are Positioned
By: Hedgopia | March 23, 2024
• Following futures positions of non-commercials are as of March 19, 2024.
Gold: Currently net long 201.6k, unchanged.
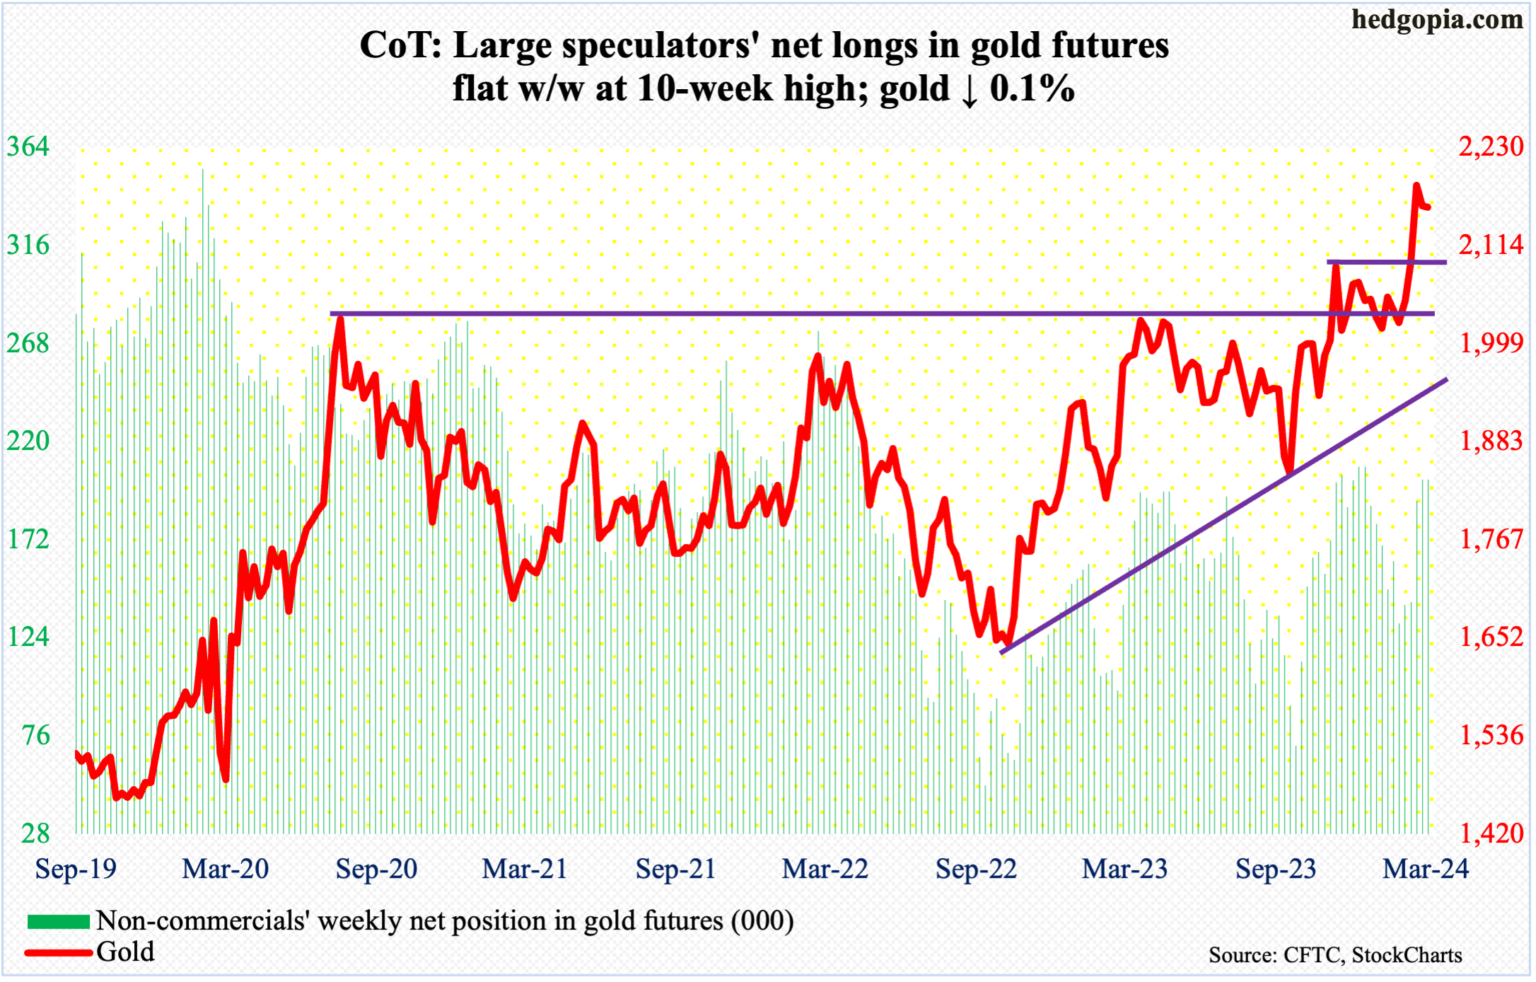
Gold was down 0.1 percent to $2,160/ounce, but that belies the intra-week volatility. Intraday Thursday, the metal rallied as high as $2,225 to surpass the March 8th high of $2,203, but only to reverse to close at $2,185, forming a spinning top. For the week, a gravestone doji developed.
Thus far, gold bugs have defended $2,150s, which was the high from early December. Odds favor this support gives way in the sessions ahead. In an ideal scenario for the bulls, gold then heads toward $2,080s for a successful breakout retest, laying the foundation for the next leg higher.
Since August 2020, when $2,080s was hit the first time, rally attempts stopped at that price point several more times, including in March 2022 ($2,079), May last year ($2,085) and a few more times this year. The 50-day at $2,075 is rising toward that level.
The yellow metal has come a long way from last October when it bottomed at $1,824 and is itching to unwind the overbought condition it is in.
Read Full Story »»»
 DiscoverGold
Gold Price Retreats, but Bullish Wedge Breakout Holds Promise
By: Bruce Powers | March 22, 2024
• Weekly chart signals potential bearish position for gold, but daily chart shows bullish reversal signal on rally above 2,186, with targets at 2,320 and 2,298.
Gold pulled back further on Friday from Thursday’s low, before finding support around the 78.6% retracement level. The low for the day was 2,157, at the time of this writing. Nonetheless, the breakout of a bullish wedge price pattern earlier in the week remains valid. And the potential for a strong bullish continuation rally remains. That outlook would change on a drop below the bottom of the flag pattern at 2,146, which is usually the maximum stop trigger used by traders, at least when using price patterns.

Wedge Breakout Still Valid
Granted, the retracement following the wedge breakout high at 2,212 yesterday has been more aggressive than we might like to see, as it didn’t go far before hitting strong resistance. Nevertheless, what happens next will be key. A 78.6% Fibonacci level is generally a maximum retracement expected before signs of failure. And when the chance for a continuation of the retracement beyond the prior swing low increases.
Weekly Chart is a Concern
Of concern is the weekly chart. Natural gas is on track to end the week in a bearish position. It will form a bearish shooting star candlestick pattern this week, barring an end of day rally. For next week it will provide a bearish setup in that time frame. A drop below this week’s low 2,212 triggers the setup. Of course, if that happens the bull wedge breakout on the daily chart will have failed to follow through.
On the Upside
On the upside, a bullish reversal signal is provided on the daily chart on a rally above today’s high of 2,186. There is a chance for a sharp rally given the rapid price advance that was seen prior to the wedge formation. The current advance would match the prior at a minimum of 2,320. Note that only the high momentum portion of the previous move is being used, starting from the March 1 daily low. Also of interest is the slightly lower target from a rising ABCD pattern. Symmetry between the CD and AB legs of the trend pattern occurs at a target of 2,298.
Read Full Story »»»
 DiscoverGold
Gold: Bull Wedge Breakout and Price Targets
By: Bruce Powers | March 21, 2024
• Gold's breakout from a bull wedge formation signals potential for a rally, with an upside target of 2,320, supported by a rising ABCD pattern.
Today’s bullish follow through in gold is not too convincing for the long side short term. Gold had a decisive breakout of a bull wedge yesterday and it closed near the high of a long-range green candle. More than 61.8% of yesterday’s advance was retraced today before support was seen at the 8-Day MA with a day’s low of 2,166, leading to an intraday rally. A new record high of 2,212 was reached earlier in the day but the close will likely complete below the open thereby generating a red candle.

Target from Wedge is 2,320
Nevertheless, yesterday’s breakout was strong and the first day of a new swing. We can calculate a measuring objective to help determine a target from the bull wedge formation. In this case we’re going to consider the sharp rally (pole) before the wedge formed as a measured move. The idea being that a similar rally may occur following the breakout of the wedge, like when there is a bull pennant or flag. The low of 2,039 from March 1 starts the pole and it ends at the recent swing high at 2,195. Just because there is a target, however, doesn’t mean it is reached in a direct fashion, although it could be.
Support Seen at 8-Day Moving Average
The measure for the pole starts at a low on February 29, which is when a breakout triggered, and bullish momentum kicked in. It gives us an upside target of 2,320. Finding support today at the 8-Day MA is bullish and should end the retracement before higher prices. If it does not and there is a deeper retracement before new highs or there is a daily close below that price level, the near-term bullish outlook can be maintained till 2,146 at the lowest. That is the bottom of the wedge and if gold drops below there it shows a failure of the pattern to follow through on the breakout.
ABCD Pattern Target is 2,298
In addition to the target from the wedge pattern there is a large rising ABCD pattern progressing that hits the first target at 2,298. That is at the high end of the Fibonacci price zones highlighted on the chart. Since both the wedge and ABCD pattern point to the top of the second Fibonacci price zone, it would indicate that there may only be temporary resistance seen around those price zones.
Read Full Story »»»
 DiscoverGold
Equinox Gold's Corporate Presentation and Fireside Chat at BMO Conference 2024
Equinox Gold Corp.
985 subscribers
$Equinox Gold - Investor Reception 2024
Equinox Gold Corp.
985 subscribers
Why Canada Pension Funds Must Invest More In Our Resource Sector
Red Cloud TV
12K subscribers[/b
https://www.youtube.com/watch?v=su_9gGzepK8&list=PLyp4dxFjISajKrYC16mKE7W65hZv-JMOO
ARIS MINING REPORTS 2023 RESULTS WITH GUIDANCE ACHIEVED, NET EARNINGS OF $11.4M, ADJUSTED EARNINGS OF $52.2M ($0.38/SHARE),
ADJUSTED EBITDA OF $159M
March 06, 2024
Download(opens in new window)
VANCOUVER, BC, March 6, 2024 /PRNewswire/ -
Aris Mining Corporation (Aris Mining or the Company) (TSX: ARIS) (NYSE-A: ARMN) announces financial and operating results for the three and twelve months
ended December 31, 2023 (Q4 2023 and FY 2023, respectively). All amounts are in US dollars unless otherwise indicated.
https://www.aris-mining.com/news/news-details/2024/ARIS-MINING-REPORTS-2023-RESULTS-WITH-GUIDANCE-ACHIEVED-NET-EARNINGS-OF-11.4M-ADJUSTED-EARNINGS-OF-52.2M-0.38SHARE-ADJUSTED-EBITDA-OF-159M/default.aspx
https://investorshub.advfn.com/boards/read_msg.aspx?message_id=173916527
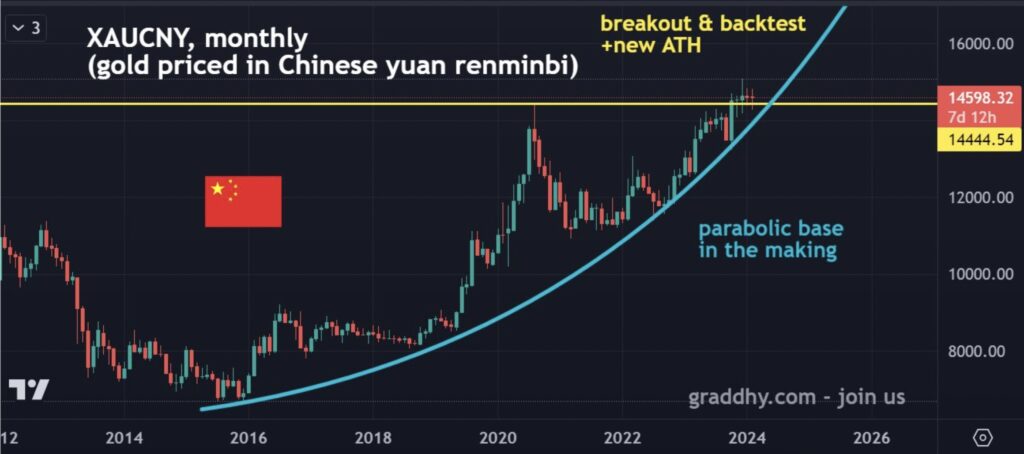
Gold vs M2 Money Supply:
Gold Massively Undervalued vs US Money Supply
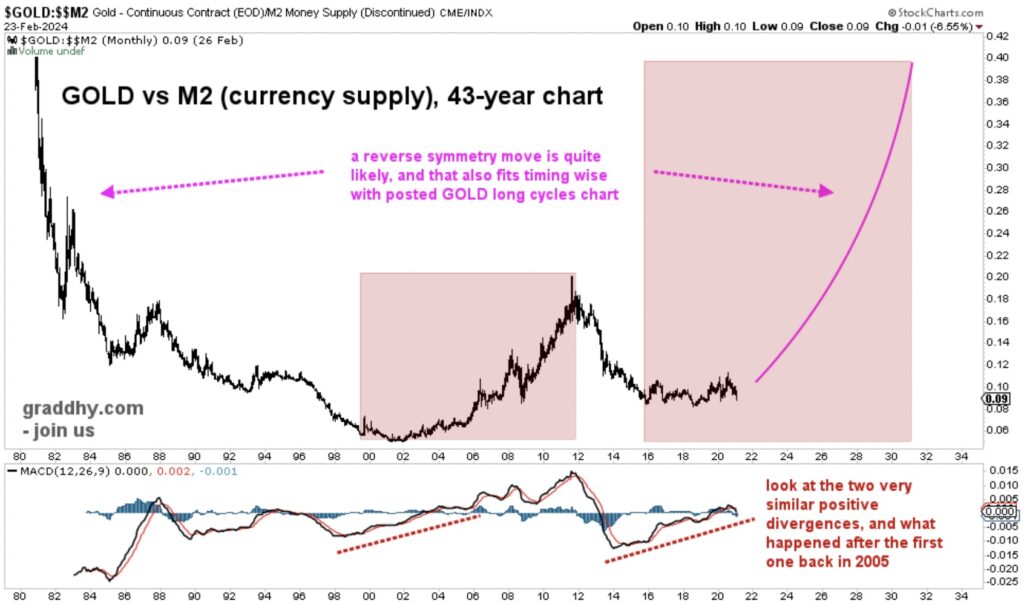
$NEWS - Is Gold Setting Up for a Huge, Once in a Generation, Rally?
By Chris Vermeulen
Is there a generational opportunity coming to get into gold?
https://www.youtube.com/watch?v=6HZiQ_-zSf4&t=1s
WORLD NEWS $Gold Price Closes At Record High -

https://kingworldnews.com/gold-price-closes-at-another-record-high-but-look-at-this/
SUPREME COURT RULES ON TRUMP BALLOT CASE TRUMP WINS

https://rumble.com/v4haeoh-supreme-court-rules-on-trump-ballot-case-trump-wins.html
World News - Sean Hannity: Trump scored a major victory today
Fox News
11.1M subscribers
https://www.youtube.com/watch?v=8e4DpRyt2Gc
TRUMP'S SHOCKING STATEMENT 🔥 TEXAS IS NOW A ‘WAR ZONE’ 🔥 MIGRANT CRISIS

https://rumble.com/v4h729o-trumps-shocking-statement-texas-is-now-a-war-zone-migrant-crisis.html
Poland signs arms deal with Sweden - Warsaw has agreed to buy thousands of anti-tank grenade launchers from Saab,
continuing its ramp-up in military spending
https://www.rt.com/news/593764-poland-buys-swedish-grenade-launchers/
Must Watch - $GOLD - 12 years in the making ![]() )
)
By: TrendSpider | March 2, 2024
• 12 years in the making. $GLD

NYC PROTEST BEGINS🔥TRUCKERS BLOCK NEW YORK! TRUMP WINS SUPREME COURT SIDES TRUMP. NY GOV KATHY WARNS

https://rumble.com/v4gz9xr-nyc-protest-beginstruckers-block-new-york-trump-wins-supreme-court-sides-tr.html
This Is Why The U.S. Must Consider Returning To The Gold Standard
https://www.forbes.com/sites/steveforbes/2023/03/17/this-is-why-the-us-must-consider-returning-to-the-gold-standard/?sh=77a36e6daa24
https://twitter.com/intent/post?url=https%3A%2F%2Fwww.forbes.com%2Fsites%2Fsteveforbes%2F2023%2F03%2F17%2Fthis-is-why-the-us-must-consider-returning-to-the-gold-standard%2F&text=This%20Is%20Why%20The%20U.S.%20Must%20Consider%20Returning%20To%20The%20Gold%20Standard%20via%20%40forbes
https://youtu.be/Z9VbROMxJ10
While everyone is focused on the $BTC pump, Gold is quietly working on an ATHs breakout of its own
By: TrendSpider | March 2, 2024
• While everyone is focused on the $BTC pump, Gold is quietly working on an ATHs breakout of its own

You Must Watch - Massive Comex Deliveries Sparks $42 Rally In Gold
March 01, 2024

https://kingworldnews.com/massive-comex-deliveries-sparks-42-rally-in-gold/
Stock Screener: Ep. 389: Leverage With Gold Miners Vs. Bankruptcy Risk
Albert S
https://www.youtube.com/watch?v=CdCiknyBF0k
$Gold Legal Tender GOD'S Real Money -
$GOD We Trust - Real Money - AU Safety 6000yrs

$Gold & Silver is the only REAL Legal Tender -
by The Founding Fathers for your -
Rights, Liberty and Freedom -[
Prayers TIA.
http://www.biblebelievers.org.au/monie.htm
https://www.usdebtclock.org/
God Bless
Amen
$Equinox Gold's Corporate Presentation and Fireside Chat at BMO Conference 2024
Equinox Gold Corp.
985 subscribers
Gold $GLD - Has met all the 'Measured Moves' today from that Bull Plot. And is now giving back...
By: Sahara | March 21, 2024
• $GOLD $GLD - Has met all the 'Measured Moves' today from that Bull Plot.
And is now giving back...

Read Full Story »»»
 DiscoverGold
Gold Price Forecast: Wedge Breakout Points to Higher Prices
By: Bruce Powers | March 20, 2024
• Gold's breakout from a bull wedge signals a potential rally to higher targets, with buyers showing enthusiasm for further gains.
Gold broke out of a small bull wedge on Wednesday following the U.S. Fed decision on rates. It was a decisive breakout with gold looking like it is ready to head to higher targets. Given the sharp 7.7% rally prior to the wedge formation, a similar level of enthusiasm from buyers may be seen again. Now that the consolidation phase is complete, today’s bullish price action is indicating such a scenario.

Current Leg Up Potential to 2,320
It is possible to see some degree of symmetry between the new leg of the uptrend that started today, and the rapid advance that started before the consolidation wedge formed. This can be one way to estimate a potential target. Since there is no prior price action to consider, key price levels to watch need to be determined by other methods. Symmetry occurs when the price distance in the second leg up relative to the wedge pattern matches the distance in the first leg. Also, when there is a Fibonacci relationship seen in the second leg relative to the first.
The first leg is being measured from the beginning of the sharp move. A price of 2,039 was used in this case. It results in a potential target of 2,320. That target is higher than two earlier Fibonacci confluence zones. However, those two price zones are identified by only two Fibonacci measurements. More confluence would produce a price zone with greater significance. The first Fibonacci zone is from around 2,235 to 2,246, and the second from 2,277 to 2,298.
Signs of Strength
As noted previously, the existing breakout into new highs for gold that began last week has just started. This could be the beginning of a multi-year advance, if not a multi-month advance. That means that market participants will likely need to get aggressive and stay aggressive if they want to participate in these early stages of the advance. Entry setups may not last for long before price moves again. Gold is on track to end this March with its highest monthly closing price on record, which will provide a new confirmation of strength, and on a long-time frame chart.
Read Full Story »»»
 DiscoverGold
Gold: Potential for Breakout of Bull Wedge
By: Bruce Powers | March 19, 2024
• Gold's recent retreat could be short-lived as bullish patterns emerge. A falling wedge and Fibonacci analysis suggest a potential rally towards new record highs above 2,195.
Gold enters its seventh day of a pullback following the new record high of 2,195 hit last week. Nevertheless, the retracement so far has been mild indicating remaining buying pressure for the precious metal. Yesterday gold completed a minor 23.6% Fibonacci retracement with a low of 2,146. That ratio is not used as frequently in Fibonacci analysis as deeper retracements that lead to reversals in the direction of the prevailing trend occur more frequently. Bullish reversals from earlier Fibonacci levels show stronger demand than bullish reversals that follow deeper retracements.

Support Seen at Minimum 23.6% Fibonacci Level
Support around the 23.6% retracement was tested successfully again today leading to an intraday bounce. Gold is on track to complete Tuesday with an inside day. Although the market has not yet closed at the time of this writing, it is looking like a bullish hammer candlestick may complete. If so, an upside breakout above today’s high of 2,163 shows strength, while a breakout above yesterday’s high of 2,164 offers greater confidence that the advance may be sustainable.
Bullish Falling Wedge Forms
Upon further investigation of recent price action, a small falling bullish wedge comes into view. It is a trend continuation pattern. Although the wedge may still need more time to form, or it can morph into a different pattern, a rise above yesterday’s 2,164 high triggers an upside breakout. That could be the beginning of the next move that takes gold above the 2,195-record high. Further signs of strength will then be needed, starting with a rally above the four-day high of 2,177. A Fibonacci target zone is up at 2,235 to 2,246, followed by a higher price zone from 2,277 to 2,298.
We can assess the wedge like a bull pennant by taking the previous sharp advance from before the wedge formed and then adding that distance to the breakout area to arrive at an approximate target. The low from March 1 is being used in this analysis for the bottom of the pole. It provides a potential target of 2,320.
Combined Analysis Points to 2,298 to 2,340 Target Zone
Also, a rising ABCD pattern, discussed previously and shown on the chart, targets 2,298. The measured move advance prior to the early-December previous record high (B) was 325 points or 17.9%. A similar move for the current advance would put gold at 2,309 when looking at the price difference. Calculated on a percentage basis, the target would be around 2,340. In summary, the analysis in this paragraph points to a target zone from approximately 2,298 to 2,340.
Read Full Story »»»
 DiscoverGold
Central Banks around the world are building gold positions at the fastest pace in at least the last half century
By: Barchart | March 19, 2024
• Central Banks around the world are building gold positions at the fastest pace in at least the last half century.

Read Full Story »»»
 DiscoverGold
So rates go up and yen goes down lol
Got it
Gold’s Expected Detinue; Fed HIKE Must Ensue?
By: Mark Mead Baillie | March 17, 2024
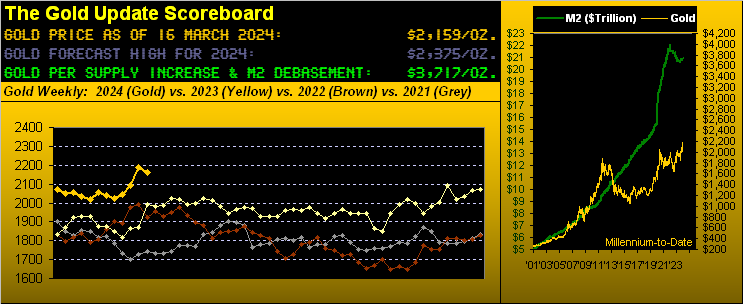
We start with the Federal Reserve, the Open Market Committee scheduled to deliver its next Policy Statement this coming Wednesday, 20 March (at 18:00 GMT).
Obviously the FOMC shall unanimously vote to do nothing with its Bank’s Funds Rate, the devil then being in the Statement’s details, followed by those then exorcised by the FinMedia from Chair Powell during his presser.
Now as you regular readers know, we’ve herein mused (albeit not predicted) since the beginning of this year that the Fed — rather than cut rates as everyone expects — instead have to further raise rates if for no other reason than the math suggests inflation is running well above the Fed’s infamous, annualized 2% “target”.
Recall two weeks ago our inflation summary for January. ‘Tis below on the left. Since then, the Bureau of Labor Statistics has chimed in for February with both retail inflation (Consumer Price Index) and wholesale inflation (Producer Price Index). Thus we’ve updated that graphic as now shown below on the right, (February’s Personal Consumption Expenditures not due from the Bureau of Economic Analysis until 29 March). Regardless: look at the “Averages” row at the foot of both panels: we’re continuing to go the wrong way, (i.e. inflation is increasing). And yet conventional wisdom is staying the rate reduction course? “C’mon, man!” Again, if in red, the metric is ostensibly “too high” for the Fed:

But nary a day goes by wherein we don’t read about the “timing” of the Fed’s cutting rates.
So query: what about the “timing” of the Fed instead rightly raising rates? Just sayin’ … for after all, math is a marvelous science for detecting the truth. (‘Course, “Math Class” has been long-removed from many a public school curriculum and replaced with “How to Grow a Tree Class”). Still, the insistance for the Fed to cut rates remains a core issue for the FinMedia. Following all this past week’s increasing inflation metrics for February, here are some choice headlines per the parroters:
• Bloomy: “Fed gets more reasons to delay interest cuts” (why not raise?);
• DJNw: “‘Perpetually optimistic’ investors worry Fed won’t cut rates three times this year” (dumb);
• CNBS: “This week provided a reminder that inflation isn’t going away anytime soon” (duh);
• Bloomy: “Fed Seen Sticking With Three 2024 Cuts Despite Higher Inflation” (denial).
At least Dallas FedPrez Lorie “Logical” Logan gets it, her saying in January: “…we shouldn’t take the possibility of another rate increase off the table just yet…” Too bad she is not (as yet) an FOMC Member.
Also — were the Fed to raise rates — are the fallout issues both for equities and political support. As you know ad nauseum, the S&P 500 is ridiculously over-extended, (see the historical case in last week’s missive for a material “correction” of some 16%-to-18% within these next three months). The last thing the Fed wishes to foster is a rate-hike-elicited stock market collapse, especially in a Presidential election year. As the U.S. Senate in May 2022 extended FedChair Powell’s term through May 2026, ’tis favourable for him not to see a power shift therein should higher rates cream equities. On verra…
The bottom line is: if the Fed truly desires annualized inflation not exceed 2%, they need tighten rates, and in turn, tighten belts of America.
As entitled for “Gold’s Expected Detinue” (which for you WestPalmBeachers down there means “a person or thing detained”), certainly so was Gold’s recent advance. For the week just past, Gold’s net change was -1.2% (-27 points) in settling yesterday (Friday) at 2159. Why “expected?” Recall from last week’s piece this now updated graphic of Gold vis-à-vis its smooth valuation line as derived from the relative movement of the five primary BEGOS Markets (Bond / Euro / Gold /Oil / S&P). Oh to be sure, per the Gold Scoreboard, price (2159) is vastly undervalued given its currency debasement level (3717); but more momentarily per the website’s Market Value graphic, price at present is nearly 100 points “too high” given what near-term typically ensues per the red encircled bits as displayed from one year ago-to-date:
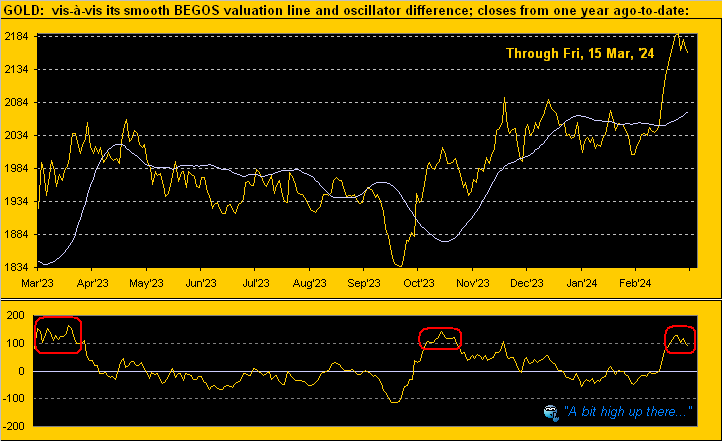
‘Course, across the same time frame by Gold’s weekly bars and parabolic trends, hardly does it get any better than this. And yet with respect to that just displayed for Gold being some 100 points above its BEGOS Market Value, our weekly graphic’s dashed linear regression trend line is similarly about 100 points below price, (that courtesy of the “Means Reversion Dept.”) Here ’tis:

Nonetheless more broadly — indeed by the day since 22 August 2011 (when Gold achieved an All-Time Closing High at 1900) — the upward tilt of price looks nice. This next display retains several of Gold’s more notorious levels of the past, along with this year’s 2375 forecast (green line) as rather ripe for the taking:

But taken for a ride of late — indeed one quite steeply down — is the Economic Barometer. That combined with increasing inflation maintains the reality of stagflation as detailed in our prior two missives. In fact, the StateSide economy did get a net bump for this past week, albeit the increasing CPI and PPI headline levels aided and abetted the Baro given “the rising tide of inflation lifts all boats” … until of course stagflation digs in deeply: “It now costs how much for that?” Not pretty:

As for the Casino 500, (red line in the Econ Baro chart), its “live” price/earnings ratio is now 45.3x (basically double its inceptive reading a dozen years ago) and the “textbook” measure (a concoction of John Bollinger’s Bands along with the classic measures of Relative Strength and Stochastics) is currently “overbought” through the past 40 consecutive trading days, (historically never sustainable).
Fortunately, both Gold and Silver — especially the latter — remain cheap relative to currency debasement. For Gold to match today’s debasement valuation, price need rise from 2159 to 3717 (i.e. +72%). And with the century-to-date average of the Gold/Silver ratio at 68.1x, priced to that per Gold’s 3717 valuation puts Silver from today’s 25.41 to 54.58 (i.e. +115%) … just in case you’re scoring at home.
Drilling down to the near-term view, here next we’ve the daily bars and baby blue dots of trend consistency from three months ago-to-date for Gold at left and for Silver at right:
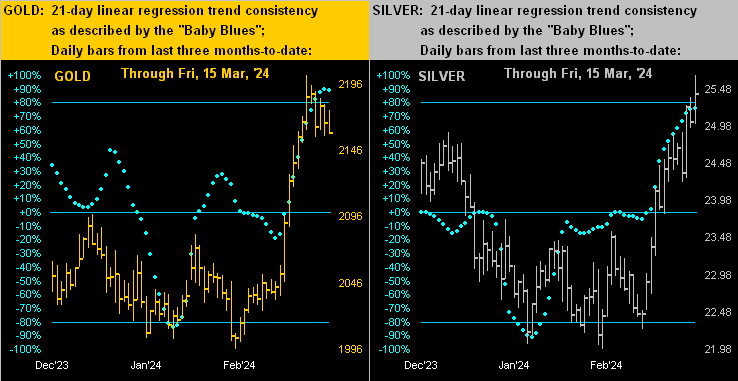
“Both do look over-extended, mmb…“
Squire, they’re clearly stretched to the upside, however great bull markets (or the resumption thereof) do breakout as such. ‘Course, market participation with a buy-side bias is foundational for the bull to run, and credit due both Gold and Silver, their contact trading volume for the past two weeks having been above average.
Indeed to further focus on the past two weeks, here we’ve the precious metals’ 10-day Market Profiles for Gold (below left) and for Silver (below right), their respective trading support and resistance levels as labeled. Of note, whilst Gold’s volume is toward the higher prices, that for Silver is around mid-Profile. But the aforementioned Gold/Silver ratio is now 85.0x, down from 89.1x a week ago. So Silver is getting a well-overdue bid, price having just closed above 25.00 for three consecutive days, an event not having occurred since last 29 November through 01 December:

Read Full Story »»»
 DiscoverGold
Jack Chan: Gold Price Exclusive Update
By: Jack Chan | March 16, 2024

Our proprietary cycle indicator is UP.
To public readers of our updates, our cycle indicator is one of the most effective timing tool for traders and investors. It is not perfect, because periodically the market can be more volatile and can result in short term whipsaws. But overall, the cycle indicator provides us with a clear direction how we should be speculating.
Investors
Accumulate positions during an up cycle and hold for the long term.
Traders
Enter the market at cycle bottoms and exit at cycle tops for short term profits.

GLD is on short term buy signal.

GDX is on short term buy signal.

XGD.to is on short term buy signal.

GDXJ is on short term buy signal.
Analysis

Current data suggests a pullback/consolidation is imminent.

Current data supports an overall higher dollar.

Our ratio is on a new buy signal.

Trend is DOWN for USD.

Trend is DOWN for gold stocks.

Trend is UP for gold.

The underperfomance reached the lowest point in 2015, and we are now testing that low.
Summary
Gold sector cycle is up.
Trend is up for gold and down gold stocks, and down for USD.
$$$ We are partially invested for the current up cycle.
Read Full Story »»»
 DiscoverGold
Gold Forecast: Gold Cycles Were Correct
By: Jim Curry | March 17, 2024
As mentioned in my last article back in February, Gold was in a correction phase - but was into bottoming territory, as represented by a key cycle that we noted at that time. That cycle ended up troughing with the February 14th tag of 1996.40, and with that should be headed higher into April - before another key top attempts to form.
Gold's 72-day Cycle
From the comments made some of my past articles, the next low of significance was expected to come from the most dominant cycle in the Gold market, our 72-day wave - which is shown again on the chart below:
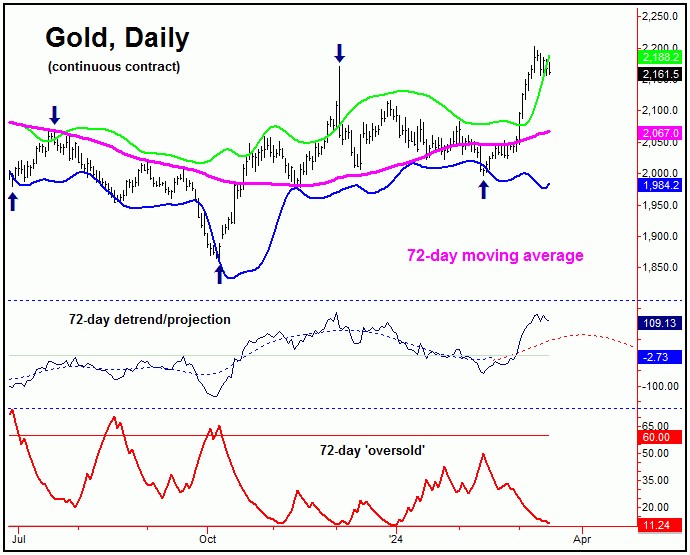
This 72-day cycle component was projected to bottom into the late-January to mid- February region - as per the path suggested by our 72-day detrend indicator. Its actual bottom came in with the February 14th tag of 1996.40 (April, 2024 contract). This action was confirmed by taking out a key upside price reversal figure for Gold.
From my 2/18/24 article: "in terms of price, we have a key 'reversal point' for Gold, a number - when broken to the upside - will confirm the next upward phase of this 72-day wave to be back in force, with more precise details noted in our Gold Wave Trader report."
With the above said and noted, our key upside reversal level for Gold was noted well in advance in our Gold Wave Trader market report. That 'reversal point' was the 2085.60 figure (April, 2024 contract).
With the above said and noted, once our reversal figure of 2085.60 was taken out to the upside, that was the trigger for a sharp move higher for Gold - one which was projected to be some 10-14% off the bottom.
In terms of price, that targeted a test of the 2195 (minimum) to 2270 level for the metal - with the lower-end of this range having already been met, with the spike higher into March 8th.
Having said the above, in terms of time, the average rally phases with this 72-day cycle have lasted around 39 trading days or more before peaking, which suggests its current upward phase will push higher into the early-April timeframe (or later) before forming yet another top with this wave. In terms of price, I see the potential for a push up to the 2230-2260 region before the upward phase of this wave is complete.
Gold's Short-Term View
For the very short-term, however, the metal has been in a smaller-degree correction phase, coming from the combination of 10 and 20-day cycles. The smallest of these waves - the 10-day cycle - is shown on our next chart:
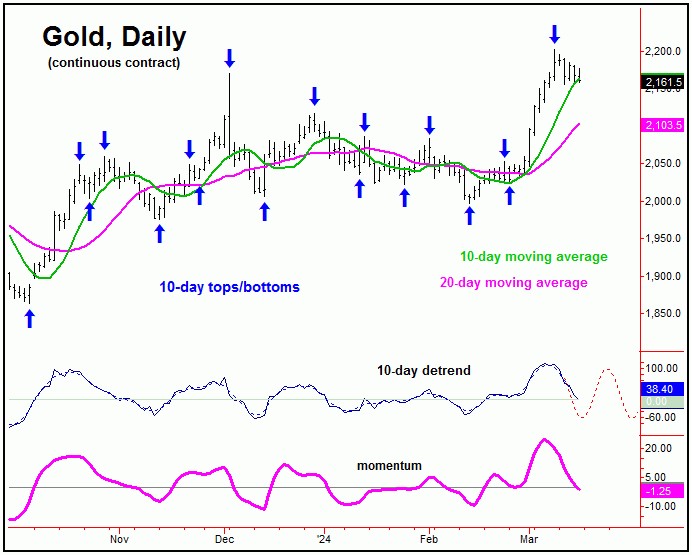
In terms of price, a more recent analysis called for a minimum drop back to the 10-day moving average for Gold - following my rule that a cycle will revert back to a moving average of the same length, better than 85% of the time.
However, due to the position of a larger 20-day wave (not shown), there is some potential for a drop back to the lower 20-day moving average, though - in bigger uptrends - the market will often hold around the shorter-term 10-day average.
Regardless of the above, due to the position of our larger 72-day cycle, the probabilities should favor the most recent correction to end up as countertrend, with first support around the 10-day moving average, then the lower 20-day average, if attempted.
If the above assessment is correct, the next upward phase of the short-term waves should take the metal back above the 2203.00 swing top into what looks to be the early-April timeframe. On or after that, the metal will then be set for the next decline of significance, expected to come from the aforementioned 72-day cycle.
Gold's Bigger Picture
From the comments made in past articles, the overall assumption was that the most recent correction with our 72-day wave would end up as countertrend, due to the position of our larger 310-day cycle - shown below:

Our 310-day cycle last bottomed back in October of last year (where it was projected), and with that has been seen as pushing higher into late-Spring to early-Summer of this year. In terms of price, I have mentioned in past months the potential for Gold to reach up to the 2270-2300 level, simply based upon the average rallies with this cycle.
With the above said and noted, another 72-day top made on or after early-April would seem favored to give way to a countertrend correction on the next downward phase of this wave. If correct, a final push back to higher highs for the bigger swing should ideally play out into what now looks to be the Summer of this year, before peaking our larger 310-day component.
For the mid-term picture, once our next 310-day cycle top does form, a larger percentage decline would be expected to play out in the months to follow - a decline similar to the one seen from the May, 2023 peak into October, 2023 bottom. In terms of time, this decline is likely to play out into (tentatively) the Spring of 2025, with more precise details of how this decline will unfold, posted in our Gold Wave Trader report.
Read Full Story »»»
 DiscoverGold
Gold Market Update - Another Strong Upleg Looks Imminent As Bull Flag Completes...
By: Clive Maund | March 16, 2024
After almost 4 years of going nowhere gold has this month broken out into what looks set to be by far its biggest bullmarket to date, and it would be surprising if it wasn’t given the fundamental outlook which is for currency and societal collapse, implosion of the debt and derivatives markets and war and general chaos and mayhem as the prelude to an intended global government involving the imposition of the CBDC (Central Bank Digital Currency) system as part of a total control grid.
Fortunately for investors the situation is now very clear with respect to gold and gold investments and easy and simple to elucidate.
Our very long-term chart going all the way back to the start of the year 2000 shines a giant searchlight on gold’s situation, quickly revealing that beyond the great 2000’s bullmarket, the price has marked out a fine example of a gigantic Cup & Handle base which is of such a magnitude that it can support a massive bullmarket, which as mentioned above is likely to be of unprecedented proportions. The reason for this update now is that it has just this month, at last, broken out of the top of this completed base pattern, so for investors in the sector there is still almost everything to go for.

Now we will zoom in to examine the latter part of this gigantic base pattern using a 5-year chart, which shows the strong rally in 2019 and 2020 to form the right side of the Cup and then the lengthy Handle trading range that followed which continued right up to the end of last month. This chart makes clear the importance of the resistance level marking the horizontal upper boundary of the Handle trading range, as the price got turned back from the $2050 - $2100 level on four occasions but the last time this happened, early in December, the bullishly aligned moving averages were at hand, not far beneath to provide support and limit the reaction that followed. The Accumulation line fell hard on this retreat, however, giving a false signal that temporarily fooled us (me) and this may somehow have been staged to throw people off before the big move, or it may simply be that it did have negative implications that were quickly eclipsed by subsequent developments. In any event, gold made the big breakout on good volume this month which we will now look at in more detail on the 6-month chart.

On the 6-month chart we can see to advantage gold’s powerful and decisive breakout on persistent strong volume and how it took it sharply higher to become super-critically overbought on its RSI indicator which is why it has stopped to “get its breath back” this past week. The resistance at $2100 has now deciisively fallen and with momentum positive and moving averages in strongly bullish alignment gold is now a bullmarket and for the reasons stated above it is likely to be one for the record books.

We will now proceed to look at gold again, this time on a shorter-term 3-month chart, the reason being to examine the price / volume action this month in an effort to determine what is going to happen next. The pattern that has formed as the price has reacted back slightly does not look like a top – price / volume action strongly suggests that it is a bull Flag / Pennant that will be followed by another strong upleg, similar in magnitude to the one that led into it and perhaps even stronger as gold is now in “open country” and moving away from the gravitational pull of the giant trading range. Volume has eased back in a most satisfactory manner during the past week with the MACD histogram (bars) also easing back considerably, suggesting that another big upleg is not just likely to happen soon, but imminent.

If gold looks like this on its 3-month chart, then what about gold stocks? Gold’s decisive breakout led to a powerful advance by gold stocks, as represented by the GDX ETF, whose 3-month chart shows a dynamic first impulse wave out of a Double Bottom, that was accompanied by high volume and gaps – this is very bullish. This waveform looks very like the first impulse wave in August of 1982 in the broad stockmarket that marked the start of the great 1980’s bullmarket which followed a decade of going nowhere (the 1970’s). On that occasion the market only reacted back a little – a lot less than many traders had expected and hoped for – before blasting higher again in a 2nd powerful impulse wave, and it never looked back. The lesson here is clear – if you are angling for a reaction back before buying the sector or adding to positions you are likely to be disappointed. The most it is likely to react back is to the minor support level near to $29.20 and it may not react back any more at all. From this position it could blast higher again almost without warning.

Adding fuel to the fire in a positive sense for gold (and silver) stocks is the fact that they are woefully undervalued relative to gold itself, as our chart for GDX going back to 2005 makes apparent. Gold is higher now than its 2011 peak, yet GDX, representing PM stocks, is about half the price it was in 2011, so it is clear that PM stocks have a lot of catching up to do and as gold continues to ascend they will attract growing speculative interest, eventually displaying the positive leverage to the gold price that they are famed for.

Lastly we can see how horribly undervalued Precious Metals stocks are relative to gold itself on our chart for GDX divided by gold going back to 2001. Only on two other occasions during the life of this chart have they been so undervalued – once at the nadir of the sector depression late in 2015 and early in 2016, and again at the depths of the Covid crash in the Spring of 2020 which was a freak event when the entire world was in the grip of an orchestrated mass psychosis. So, given that gold has entered a bullmarket that is likely to be of awesome magnitude, it should be clear that the upside potential of the better stocks in this sector is truly massive and that, despite their gains of the past couple of weeks they are still at exceedingly good prices compared to where they are headed.

Read Full Story »»»
 DiscoverGold
NY Gold Futures »» Weekly Summary Analysis
By: Marty Armstrong | March 16, 2024
Up to now, we still have only a 2 month reaction decline from the high established during December 2023. We must exceed the 3 month mark in order to imply that a trend is developing.
ECONOMIC CONFIDENCE MODEL CORRELATION
Here in NY Gold Futures, we do find that this particular market has correlated with our Economic Confidence Model in the past. The Last turning point on the ECM cycle low to line up with this market was 2022 and 2015. The Last turning point on the ECM cycle high to line up with this market was 2020 and 2011 and 1996.
MARKET OVERVIEW
NEAR-TERM OUTLOOK
The NY Gold Futures has continued to make new historical highs over the course of the rally from 2015 moving into 2024. However, this last portion of the rally has taken place over 9 years from the last important low formed during 2015. Noticeably, we have elected four Bullish Reversals to date.
This market remains in a positive position on the weekly to yearly levels of our indicating models. Pay attention to the Monthly level for any serious change in long-term trend ahead.
The perspective using the indicating ranges on the Daily level in the NY Gold Futures, this market remains moderately bullish currently with underlying support beginning at 21612 and overhead resistance forming above at 21908. The market is trading closer to the support level at this time. An opening below this level in the next session will imply a decline is unfolding.
On the weekly level, the last important high was established the week of March 4th at 22030, which was up 3 weeks from the low made back during the week of February 12th. Afterwards, the market bounced for 3 weeks reaching a high during the week of March 4th at 20881. Since that high, we have been generally trading down to sideways for the past week, which has been a reasonable move of 2.124% in a reactionary type decline. Nonetheless, the market still has not penetrated that previous low of 19964 as it has fallen back reaching only 4523 which still remains -77.3% above the former low.
When we look deeply into the underlying tone of this immediate market, we see it is cautiously starting to strengthen since the previous low at 19964 made 4 weeks. The broader perspective, this current rally into the week of March 4th has exceeded the previous high of 20832 made back during the week of January 29th. This immediate decline has thus far held the previous low formed at 19964 made the week of February 12th. Only a break of that low would signal a technical reversal of fortune and of course we must watch the Bearish Reversals.
Right now, the market is above momentum on our weekly models hinting this is still bullish for now as well as trend, long-term trend, and cyclical strength. From a pointed viewpoint, this market has been trading down for the past week.
INTERMEDIATE-TERM OUTLOOK
YEARLY MOMENTUM MODEL INDICATOR
Our Momentum Models are declining at this time with the previous high made 2020 while the last low formed on 2023. However, this market has rallied in price with the last cyclical high formed on 2023 and thus we have a divergence warning that this market is starting to run out of strength on the upside.
Looking at the longer-term monthly level, we did see that the market made a high in December 2023 at 21523. After a thirteen month rally from the previous low of 19879, it made last high in December. Since this last high, the market has corrected for thirteen months. However, this market has held important support last month. So far here in March, this market has held above last month's low of 19964 reaching 20470.
Critical support still underlies this market at 19070 and a break of that level on a monthly closing basis would warn that a sustainable decline ahead becomes possible. Nevertheless, the market is trading above last month's high showing some strength.
 DiscoverGold
Get ready, Gold and Silver run is gonna be HUUUUUUGA
Gold CoT: Peek Into Future Through Futures, How Hedge Funds Are Positioned
By: Hedgopia | March 16, 2024
• Following futures positions of non-commercials are as of March 12, 2024.
Gold: Currently net long 201.6k, up 10.3k.
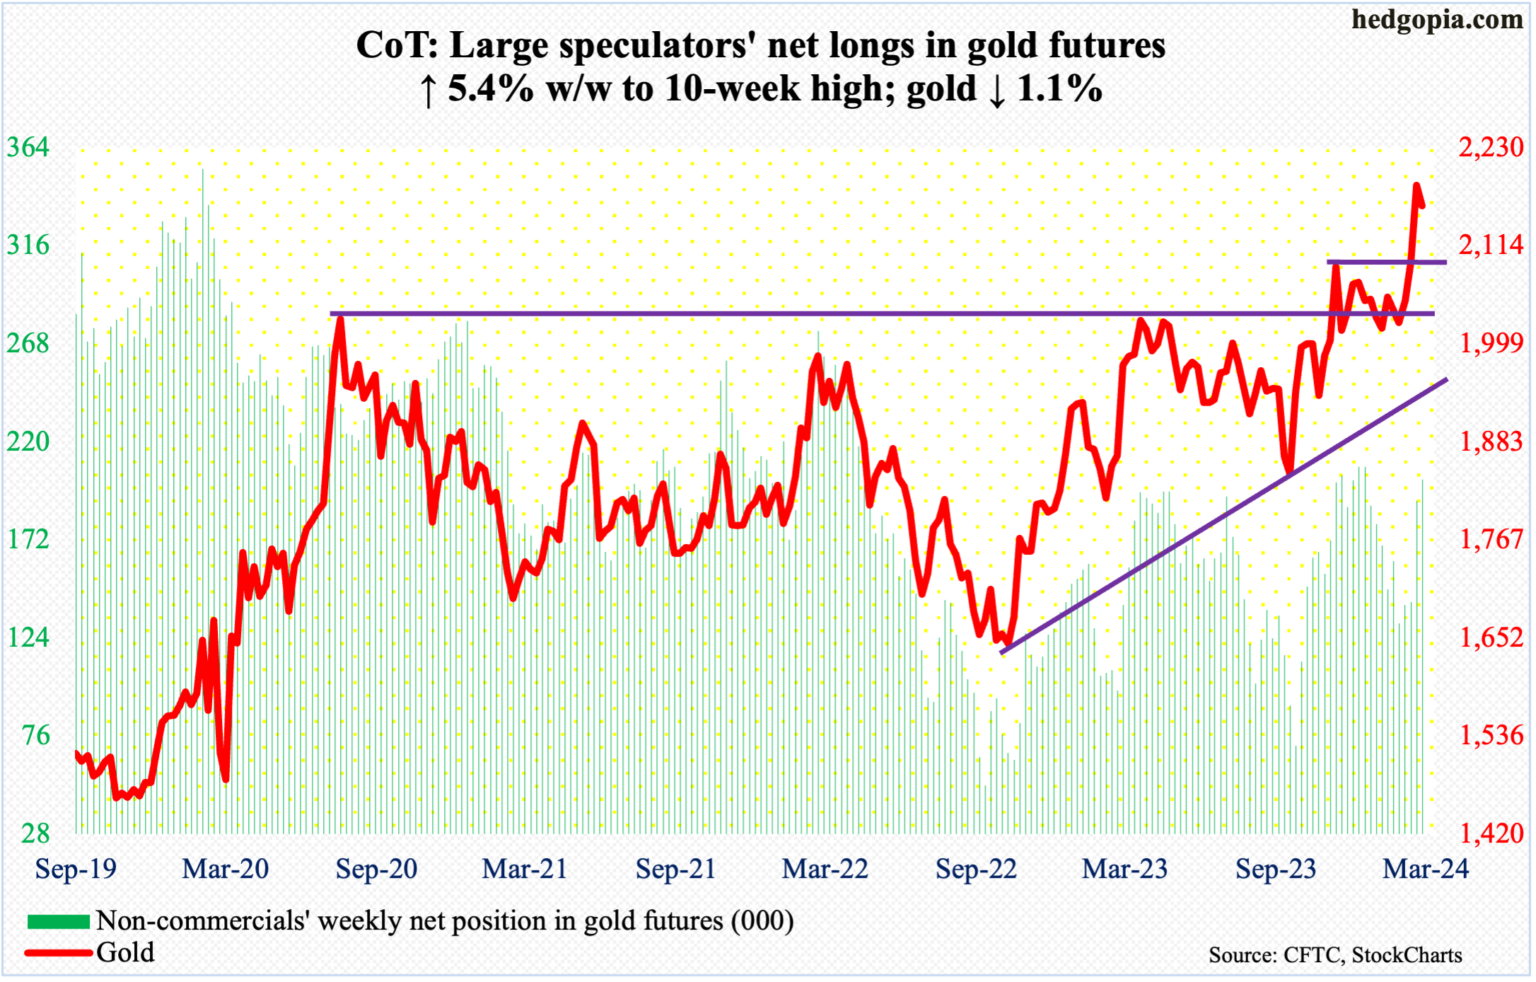
Since it hit $2,203/ounce – a record – last Friday, gold has come under slight pressure, closing this week down 1.1 percent to $2,162 – first down week in four. Gold bugs, however, showed up for most of this week at/near $2,150s. Last December, the metal ticked $2,152, which was a new high back then, and reversed lower. Before that in October, it bottomed at $1,824. It has come a long way from that low.
In the sessions ahead, gold is likely to breach the $2,150s support. In an ideal scenario for the bulls, it then heads toward $2,080s for a successful breakout retest, laying the foundation for the next leg higher.
Since August 2020, when $2,080s was hit the first time, rally attempts stopped at that level several more times, including March 2022 ($2,079), May last year ($2,085) and a few more times this year.
Read Full Story »»»
 DiscoverGold
Gold: Inside Week Sets Stage for Potential Bullish Continuation
By: Bruce Powers | March 15, 2024
• Gold's inside week suggests consolidation, setting the stage for a potential bullish breakout if this week's high is exceeded.
Gold is set to close the week with an inside week. This week’s trading range is contained within the price range of last week. It sets up a potential bullish continuation trigger on the weekly time frame if this week’s high of 2,189 is exceeded to the upside. An inside week shows price consolidating on that the weekly time frame.

Weekly Consolidation Shows Strength Remaining
Notice that this week’s price range occurred near the high of last week’s range. That shows strength remaining as demand was strong enough to keep gold from sliding further. It reflects a minimum impact from selling pressure this week as the pullback held support around the 8-Day MA (blue). A decisive breakout above this week’s high would be the first bullish signal. Following that, further signs of strength would be needed for indications that the continuation of the rally is sustainable. Of course, the recent high of 2,195 would be next on the agenda. Ideally, the weekly breakout is strong enough to quickly push through that high.

Higher Price Targets
Assuming that is the case, gold would then be heading toward a price range marked Fibonacci confluence of three extended measurements. That range is from 2,235 to 2,247. It includes the 161.8% extension of the retracement from the decline off the May 2023 swing high. Also, the 161.8% extension of the decline following the new record high in December is included.
Bearish Signal Likely Leads to Deeper Pullback
Nonetheless, today’s price action shows a minor weakening sign. It looks like gold may close below the 8-Day MA for the first time since the advance accelerated on February 29. This could be a clue that eventually leads to further weakening. However, a bearish signal would be needed and that doesn’t happen until gold drops below this week’s low is 2,151. The more significant support level looks to be down near the 50% retracement at 2,088. It is matched by the December 25 swing high, which gives it more weight than if the indicator was by itself. Higher levels to watch are marked on the charts.
Read Full Story »»»
 DiscoverGold
Decisive Long-Term Breakout for Gold
By: Carl Swenlin | March 15, 2024
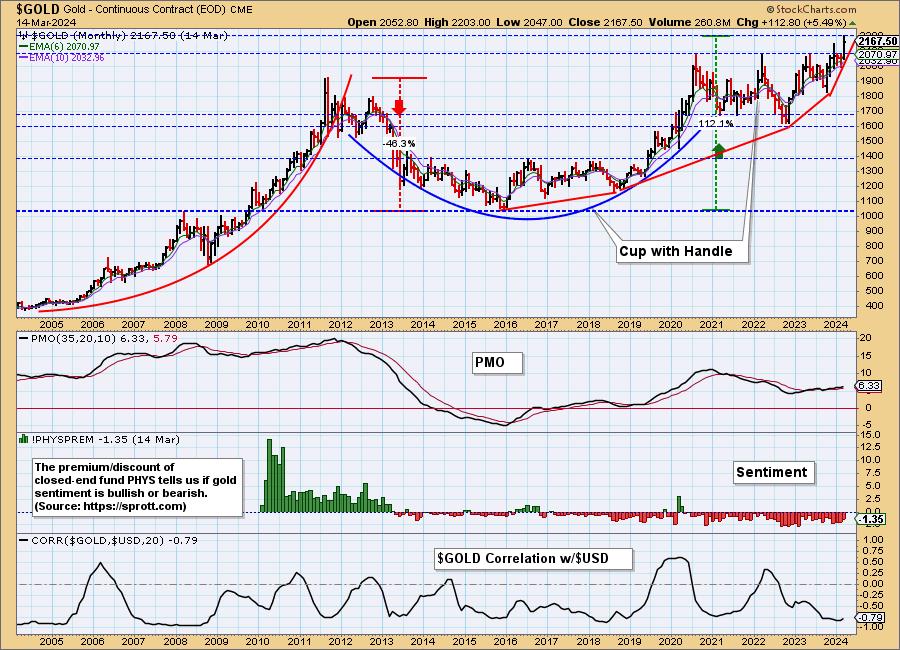
This month, the SPDR Gold Shares (GLD) broke out to new, all-time highs. That was a significant long-term move, which we will discuss when we get to the monthly chart.
Of more immediate interest is the fact that sentiment is still bearish, which bodes well for a continued advance. We gauge sentiment based upon whether closed-end fund Sprott Physical Gold Trust (PHYS) is selling at a premium (bullish sentiment) or discount (bearish sentiment). Currently, PHYS is selling at a discount to NAV.
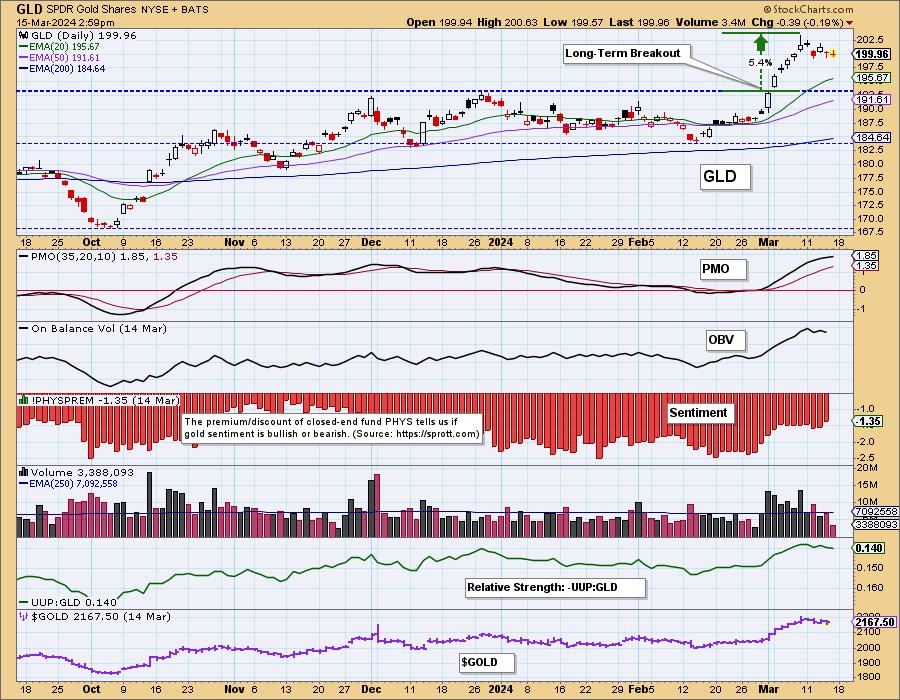
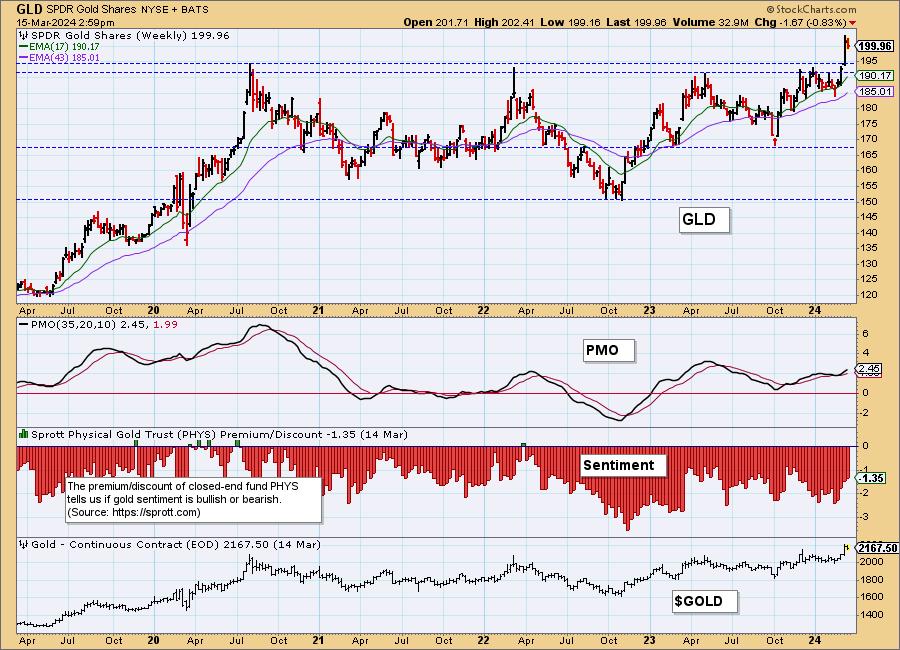
The weekly chart gives a better perspective of the significance of the breakout, which was decisive. The overhead resistance has held GLD back for more than three years, and has now become support.
But the monthly chart shows that it has been a much longer wait than three years. Gold made all-time highs back in 2011, following which it declined nearly fifty percent. It finally recovered to new, all-time highs in 2020, but it has been stalled until this month. Practically speaking, gold investors have been waiting about 13 years for this encouraging move. The positive side is that gold has established a solid high-level base at around 2,000 to provide future support. Also note how bullish sentiment got (a premium of about +14%) during the parabolic advance on the left side of the chart.
Investing in gold presents some difficulties that must be considered. (Disclaimer: This is information, not a recommendation.) If you buy physical gold, you have to have a safe place to store it. A safe deposit box can be accessed/frozen by the government, and an adequate safe is expensive, difficult to move, and entails some vulnerability. Some ETFs, like GLD, do not actually own physical gold. An alternative is iShares Gold Trust (IAU), which is a closed-end fund that owns physical gold. Sprott Physical Gold Trust (PHYS) is similar to IAU, but it is a foreign entity based in Canada. Consider the implications of all options available.
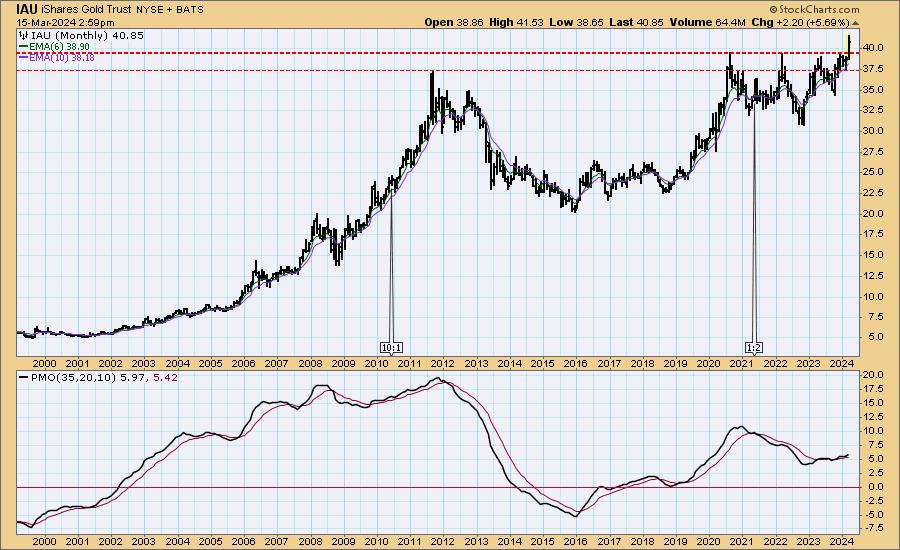
Conclusion: Gold's recent breakout was a long time coming and appears to have positive long-term implications. Also, the long period of consolidation has created an impressive base of long-term support.
Read Full Story »»»
 DiscoverGold
Gold Markets Continue to Pressure Resistance
By: Christopher Lewis | March 15, 2024
• Gold markets rallied during the course of the week, only to give up those gains and form a slightly negative candlestick. However, the range is rather tight in it does suggest that perhaps we may have some consolidation ahead of us.
Gold Markets Weekly Technical Analysis
The gold weekly chart has shown a little bit of a negative candlestick for the week, but really at this point in time, I think you still have a situation where you have to look at this through the prism of whether or not we can find any real value here. I do think that eventually we will pull back. That pullback more likely than not will continue to attract attention. And I think buyers and or value hunters will definitely be interested in this market. In that environment, I think we could see more money flood in, especially if we get anywhere near the $2,075 level.
That being said, if we can take out the highs here, then it’s very possible that we could be more or less on our way to the 2500 level via the 2200 level between here and there. I don’t like the idea of chasing gold, so I would be just as happy to buy it after several weeks of sideways action. We’ll just have to wait and see how it plays out. Pay attention to interest rates that of course has a major influence on gold, but also geopolitical concerns out there have really been driving gold higher as well.
We recently broke above that crucial $2075 level and that has now become your floor. As long as we stay above there, the uptrend is firmly ensconced in this market and there’s absolutely no reason to be selling gold in this environment as not only do we have all of the macroeconomic factors, but central banks have also been net buyers of gold bullion.
Read Full Story »»»
 DiscoverGold
MAPLE GOLD MINES
MGM, MGMLF
Recently spiked from 5-7c in CAD
Partnered with Agnico and measuring
3-4 million ozs thus far. ✔️
Gold Support Levels and Potential Upside Continuation
By: Bruce Powers | March 14, 2024
• Gold remains above key support at the 8-Day moving average, but a decline below 2,151 could lead to further selling pressure.
Gold continues to hold above support around the 8-Day MA with a with a three-day low of 2,151. That is the bottom of the price range and key near-term support. The 8-Day line was breached briefly today but it looks like the close will be at or above the line. Therefore, a decline below 2,151 could lead to further selling.

Deeper Retracement Still Possible
If a deeper retracement begins in gold there are several price zones to keep an eye on for possible support. The first being the prior record high at 2,135, followed by the 38.2% Fibonacci retracement at 2,115 and the 50% retracement at 2,090. The lower price zone is enhanced by the 20-Day MA, currently at 2,088, and the swing high from late December around 2,088. Further down is the 61.8% Fibonacci retracement at 2,065, which is confirmed by the swing high from February 1.
Bullish Continuation Scenario
Alternatively, since gold has been holding relatively strong since last week’s new record high of 2,195, an upside continuation remains a possibility before a deeper correction. A decisive breakout above today’s high of 2,177 would provide a bullish signal, with further confirmation provided on a rally above yesterday’s high of 2,180. This doesn’t mean it will keep rising though. It should be watched carefully for further signs confirming the bullish posture.
Nevertheless, the next higher targets comprise two ranges from Fibonacci extensions of prior swings. The first zone is from 2,235 to 2,246 and the second is from 2,277 to 2,298. The top of the second price zone also completes the initial target for a large rising ABCD pattern. That is where there is symmetry in price between the CD leg and the AB leg of the pattern. Once symmetry occurs the chance for a reversal increases.
Multi-Year Breakout in Play
Since there is only one more trading day left to the week it is likely that gold will end with a high inside week. In other words, the full trading range for the week is near the highs of last week. This shows strong demand remaining for gold. Keep in mind that gold closed at a new record high last week as it rose out of a multi-year basing pattern. That likely sets the stage for a multi-month or multi-year advance.
Read Full Story »»»
 DiscoverGold
What happens if the carry trade goes the other way?
Wouldn’t gold benefit?
Gold - I do have various targets as you may have seen. Here I show the percentage gains on two targets...
By: Sahara | March 14, 2024
• $GOLD $GLD - I do have various targets as you may have seen.
Here I show the percentage gains on two targets...

Read Full Story »»»
 DiscoverGold
Gold Strong Demand Amidst Mild Retrace
By: Bruce Powers | March 13, 2024
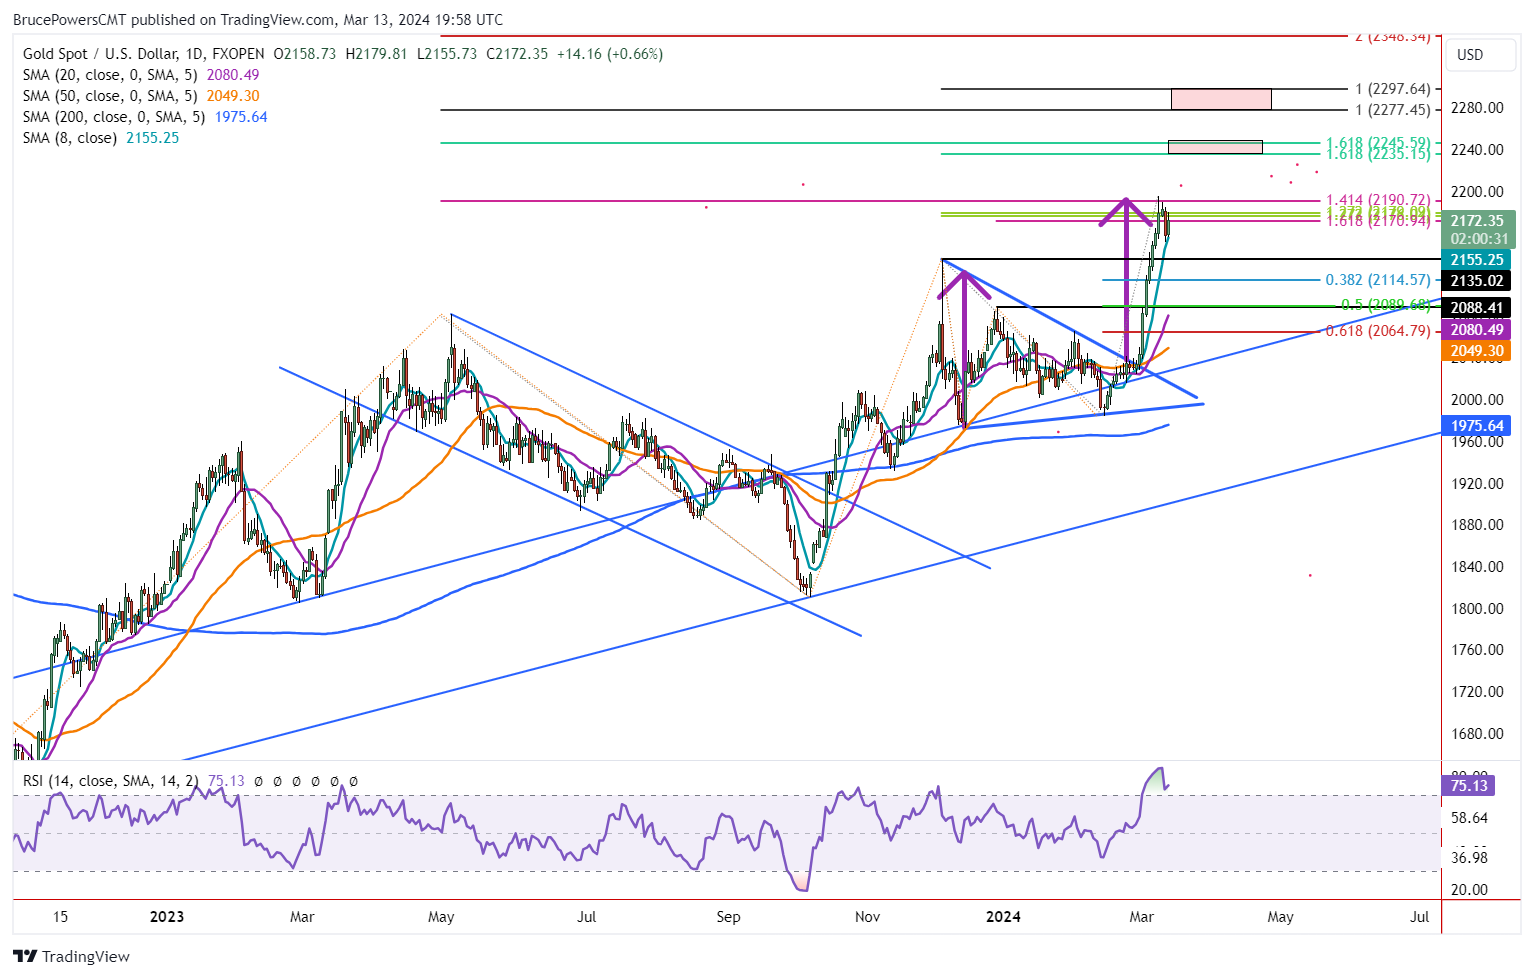
• Gold's retracement from a record high remains mild, supported by strong demand. Potential for further ascent exists, with key targets at 2,235 to 2,247.
Gold’s retracement from last week’s 2,195 record high has been mild so far with support seen around the 8-Day MA the past couple of days. Although last week’s high hit several key target areas that could lead to a deeper retracement, demand has stayed strong. Today’s low bounced off the 8-Day line almost exactly, putting gold in a position to finish in the green with an inside day.
Demand Stays Strong
Since demand has stayed strong following last week’s peak, there remains a chance that gold will continue its ascent before a more significant retracement. A rally above today’s high of 2,180 will provide the next sign of strength. However, that should be followed by a breakout above yesterday’s high of 2,184 as it will further confirm the bullish signal. A continuation of the bull trend above 2,185 then becomes more likely.
Long-Term Breakout Confirmed
Since gold has broken out to a new record high and it was confirmed by a weekly close above the prior high of 2,135, there is a good chance that the next higher target zone could be reached. In addition, bullish signals were triggered on the monthly chart for gold. The breakout is from a multi-year basing pattern and the breakout has only just begun. The next higher target zone is from 2,235 to 2,247 and is derived from Fibonacci ratio analysis. Two 161.8% extended targets make up that range. The next higher target range beyond 2,447 is from 2,277 to 2,298.
Drop Below 2,156 Likely Leads to Deeper Retracement
Nevertheless, a deeper retracement becomes more likely on a drop below today’s low of 2,156 and confirmed on a drop below yesterday’s low of 2,151. The 8-Day MA is currently at 2,155. Previous resistance at the prior high of 2,135 may then be tested as support. Further down is the 38.2% Fibonacci retracement at 2,115. However, the more significant support area looks to be around 2,088. That level includes the 50% retracement, and it was a resistance peak in late-December.
Read Full Story »»»
 DiscoverGold
Gold Bearish Reversal Triggers Retracement from Recent Peak
By: Bruce Powers | March 12, 2024
Gold experiences bearish reversal, triggered by breakdown from inside day following the 2,195 top. Potential retracement ahead based on key technical patterns.
A bearish reversal triggered in gold today with a breakdown from an inside day. This follows the 2,195-peak hit on Friday. There are several reasons why last week’s high might be followed by a retracement. It was a key target zone identified previously from measured moves, a symmetrical triangle pattern (blue boundary lines), and the completion of a rising ABCD pattern. Combined, the methods identified a strong target around 2,189 to 2,194.

Measured Move Completes
The 2,195-swing high completed a 10.6% rally from the February 14 swing low (C). It matches the two measured moves seen earlier in the uptrend structure beginning from October 2023 swing low. The first advance off that low was 11% and the second was 10.5%. This reflects symmetry in price between the three rallies. In addition, the time relationship was close. The first two advances took place over 15 days and the most recent topped after 17 days.
Symmetrical Triangle Target Hit
Moreover, the measuring objective derived from the symmetrical triangle on the chart identified 2,189 as a key new high target. Simply, the price height of the pattern (first rising purple arrow) is added to the breakout area to arrive at a minimum potential target.
ABCD Pattern Target Reached
Finally, a rising ABCD pattern shows symmetry between the AB leg of the rally and the CD leg of the pattern at 2,179. Not a perfect match with the above noted range, but still close. Regardless, it does provide further evidence for a price range where resistance is likely to be encountered.
Retracement Targets
Today’s bearish reversal breached a three-day low of 2,154 and puts gold on track to possibly close below that price level. Given the swing relationships noted above it seems likely to see a deeper retracement beyond the minimum before gold is ready to resume its ascent. The prior record high is at 2,035 and it marks the first zone where support might be seen. A little lower is the 38.2% Fibonacci retracement at 2,115. The next lower price level at 2,088 looks interesting as it is highlighted by two indicators. It is marked by the 50% retracement and was also a key peak resistance level in late-December (B).
Read Full Story »»»
 DiscoverGold
+++ Interest rates will rise+++
The stock markets are currently in bubble mode. Since inflation remains stubbornly high in order to prevent a second violent wave of inflation, it would not be a bad idea to raise interest rates again next week by 25 basis points. Due to the extremely overbought situation on the market, a violent market reaction to such an even would be bearable. That would clean up the markets in a healthy way, which in my opinion has long been necessary.
Gold has closed higher for the last 8 days in a row before the March 12 drop of more than 1% (not yet reflected in the chart)
By: Tom McClellan | March 12, 2024
• The indicator tracks the percentage of up closes over the past 9 days, smoothed with a 3MA. Gold has closed higher for the last 8 days in a row before the March 12 drop of more than 1% (not yet reflected in the chart). The message is that the rubber band is really stretched.

Read Full Story »»»
 DiscoverGold
Gold Market Update - Major Breakout Marks Start Of Rercord Breaking Bullmarket...
By: Clive Maund | March 11, 2024
It’s a very good time to review gold’s major breakout because, in addition to breaking above the key $2100 level that we had for some considerable time noted was key, it has broken above its intraday highs of early December at just above $2150. Gold is now on it’s way and nothing will stop it because it is simply rising to compensate for the exponentially growing ocean of dollars created by the Fed.
Some fear that gold will drop because the dollar index could continue to rise for a while due to countries and other dollar debtors struggling to redeem their dollar denominated debts by purchasing dollars, but with regard to this the crucial point to grasp is that new dollars are being created at such a fantastic rate by the Fed in order to backstop the failing Treasury market and to fund Israel and the Ukraine etc that gold has no choice but to go up to compensate. We are therefore likely to find ourselves in a situation for a while where the dollar and gold ascend in tandem. Eventually the debt market will blow to smithereens at which point gold and silver will go vertical and skyrocket.
On the 6-month chart for gold in dollars below you will observe that gold has now broken clear above the key resistance at $2100 which stopped it in its tracks early in December, and in addition to that it has in recent days pushed on above the residual resistance at its early December intraday highs at $2152.30 which confirms that the breakout is valid. You may recall that we were wary for a while because of the horrible deterioration of the Accumulation line in January, but that has now largely been made good by its strong recovery over the past couple of weeks mostly due to the persistent strong upside volume on this breakout drive. Although now short-term overbought because of its steep ascent this month which could result in its consolidating for a while or reacting back somewhat, any such reaction is unlikely to be more than trivial due to the picture now being so positive for gold both fundamentally and technically and to the extent that it occurs will be viewed as an opportunity to buy various PM stocks or add to positions.
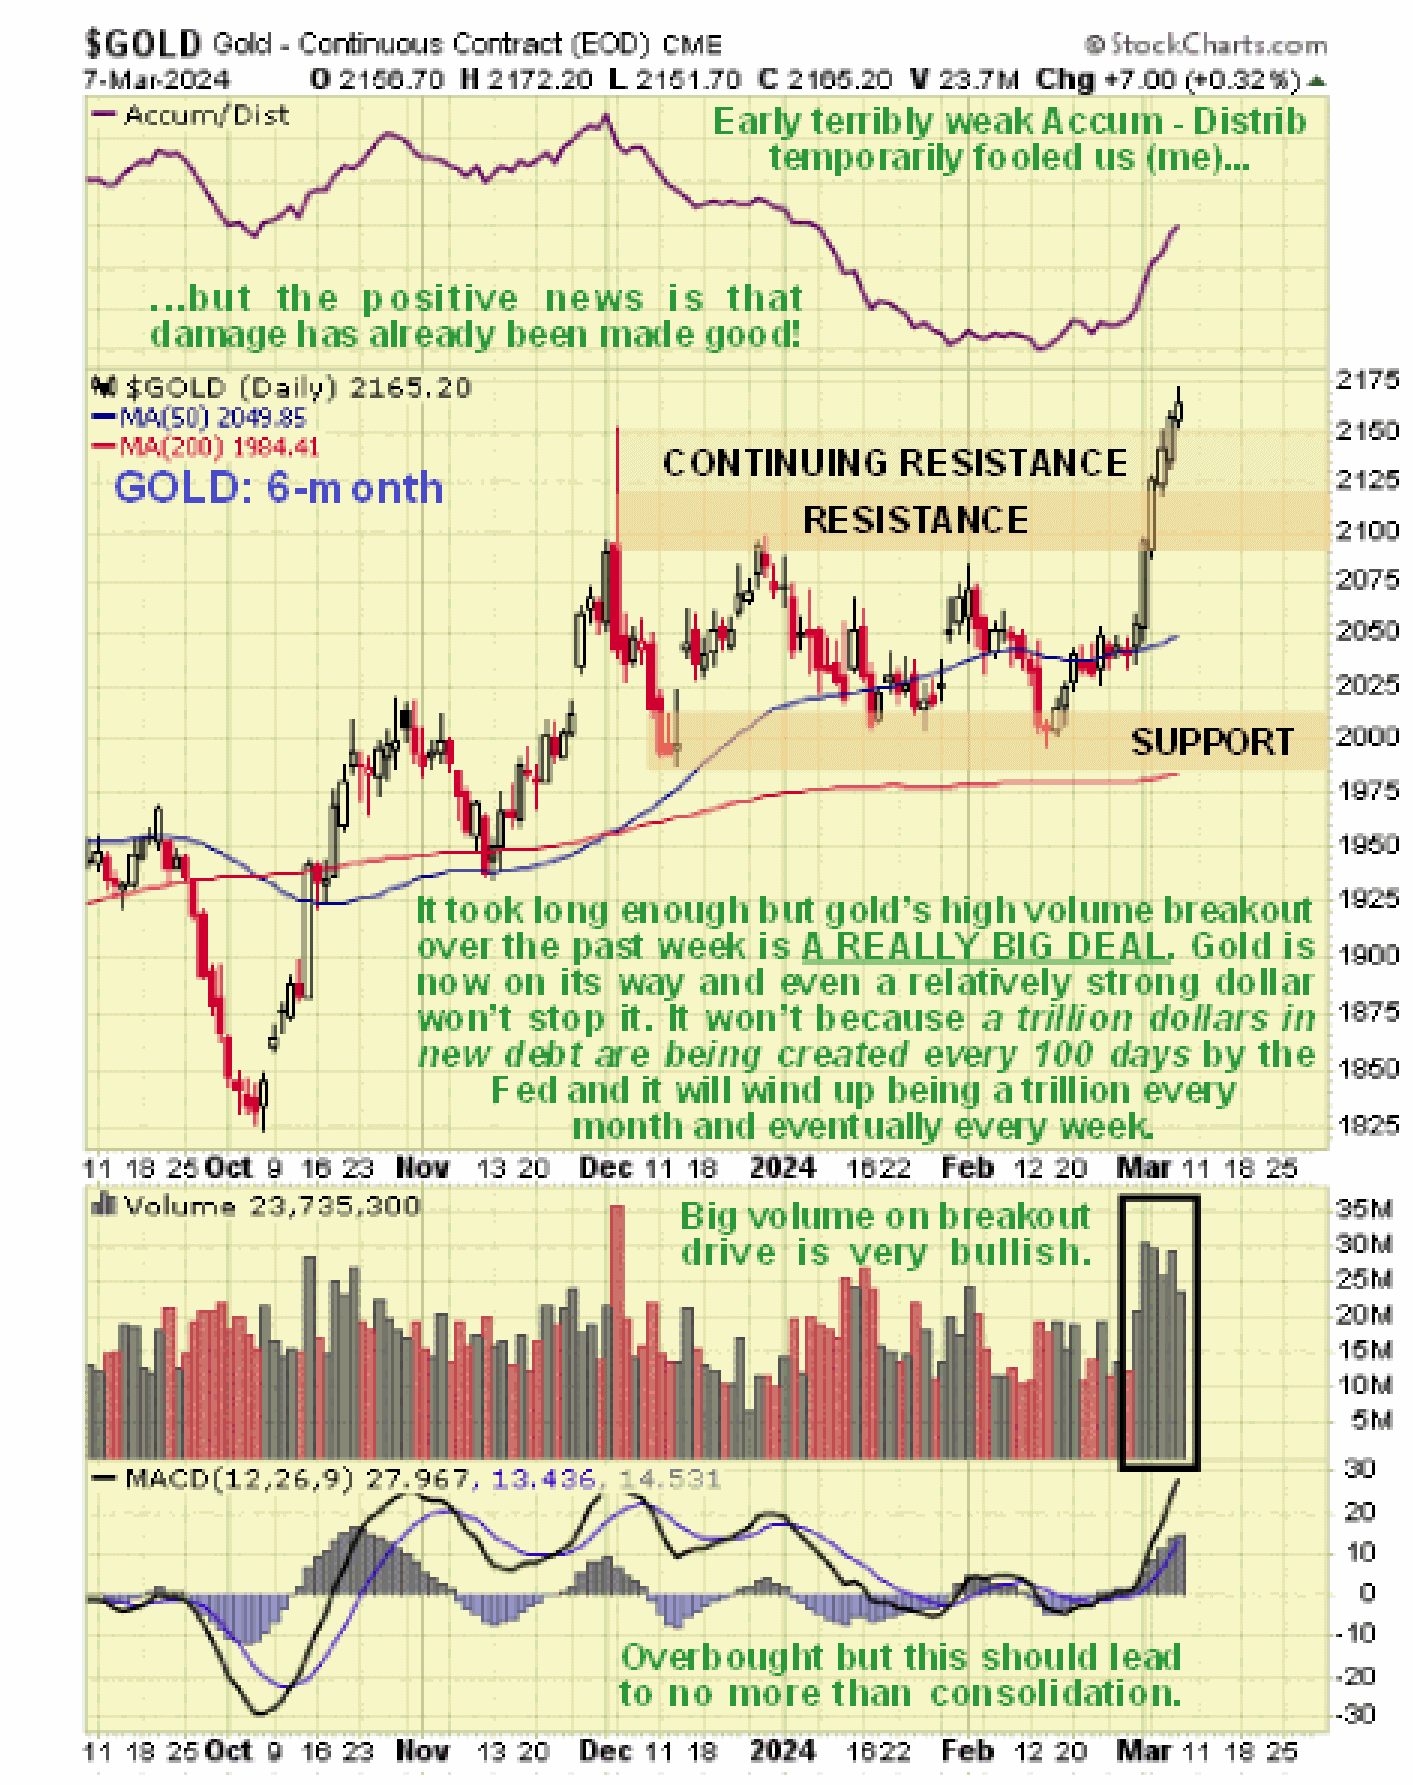
We can clearly see why the $2100 level was so important for gold on its 5-year chart, for this level had turned the price back on several occasions since the mid-2020 peak. We can also see on this chart that the price and moving averages are in most favorable alignment and that it can get a lot more overbought on its MACD indicator than it currently is. Also shown at the top of this chart is GDX (Market Vectors Gold Miners ETF) which makes plain how PM stocks have grossly underperformed gold itself , especially over the past year. This is very bullish, because when investors are excessively pessimistic towards the sector they favor gold over stocks, reasoning that it is less risky. We can therefore expect this divergence to narrow and with gold going up, it means gold (and silver) stocks should go up more.
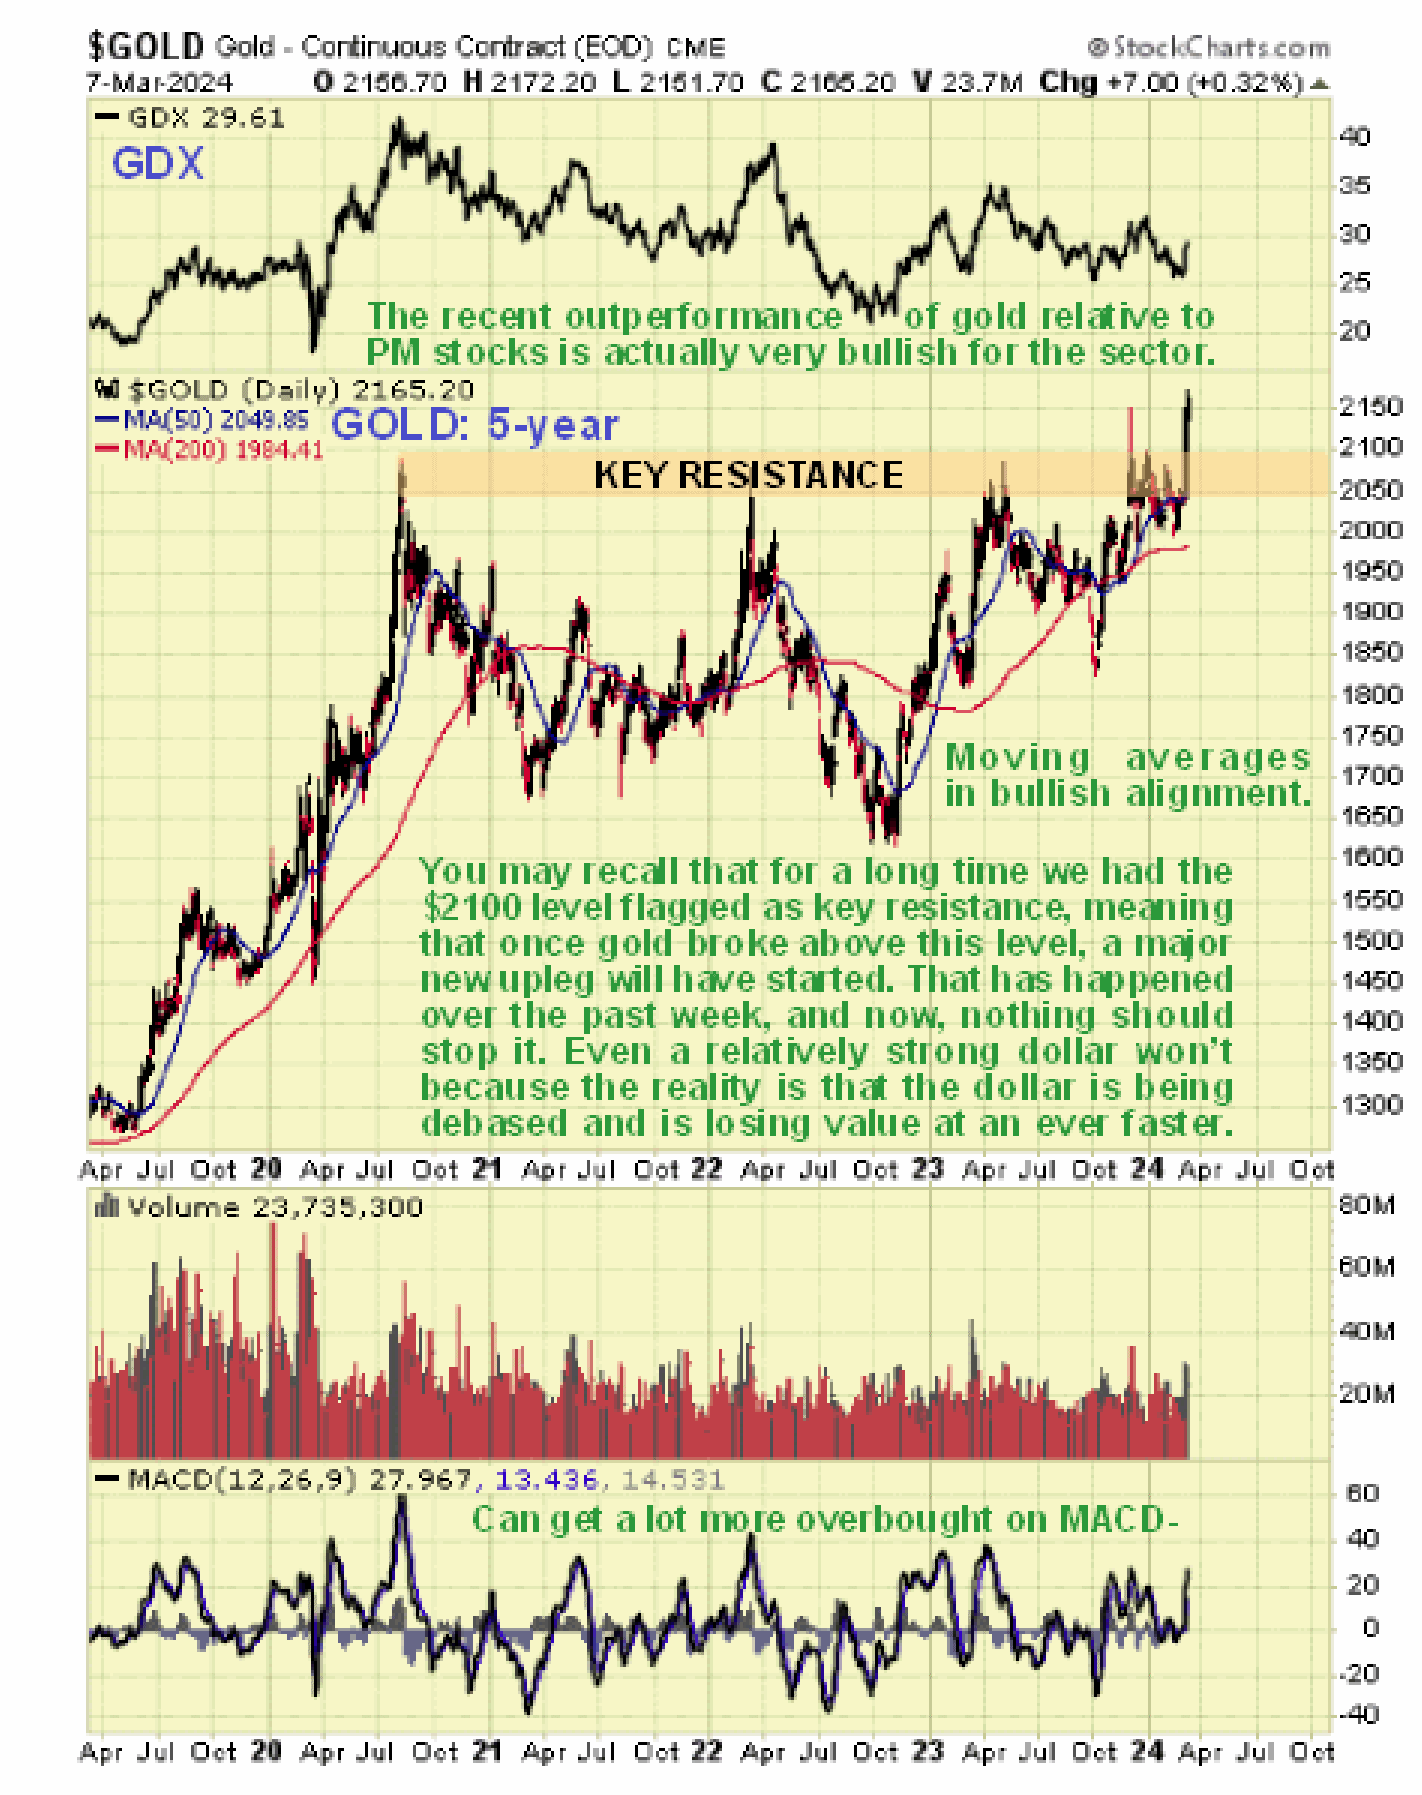
Read Full Story »»»
 DiscoverGold
$DOLLARS Fiats - Eventual Financial Death Spiral Now Imminent – John Rubino
By Greg Hunter On March 9, 2024 In Market Analysis 83 Comments

https://rumble.com/v4i4tv5-eventual-financial-death-spiral-now-imminent-john-rubino.html
$GOLD Mining Update - GOLD WEEKLY - Unless something dramatically changes, we have a weekly breakout in gold.
A 50% rally succeeded a similar breakout in 2019.
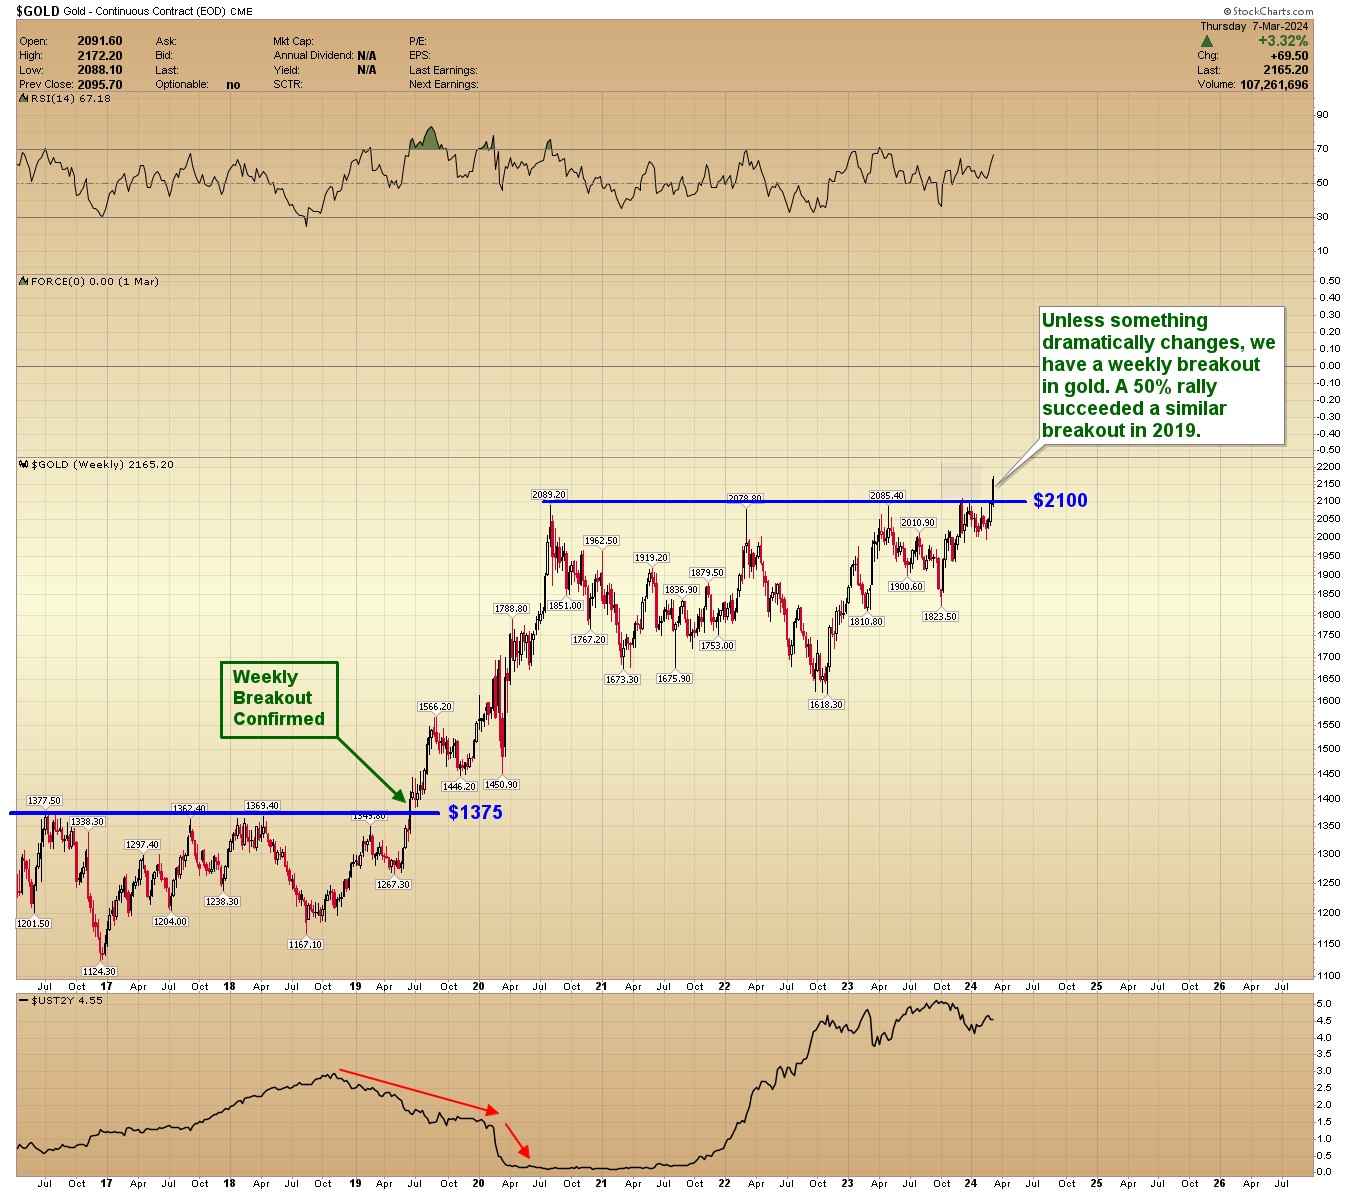
GOLD DAILY- Gold is finally breaking above $2100, and I believe we are in the initial stages of a powerful multi-month rally.
This cycle should press to the upside into late April or early May.
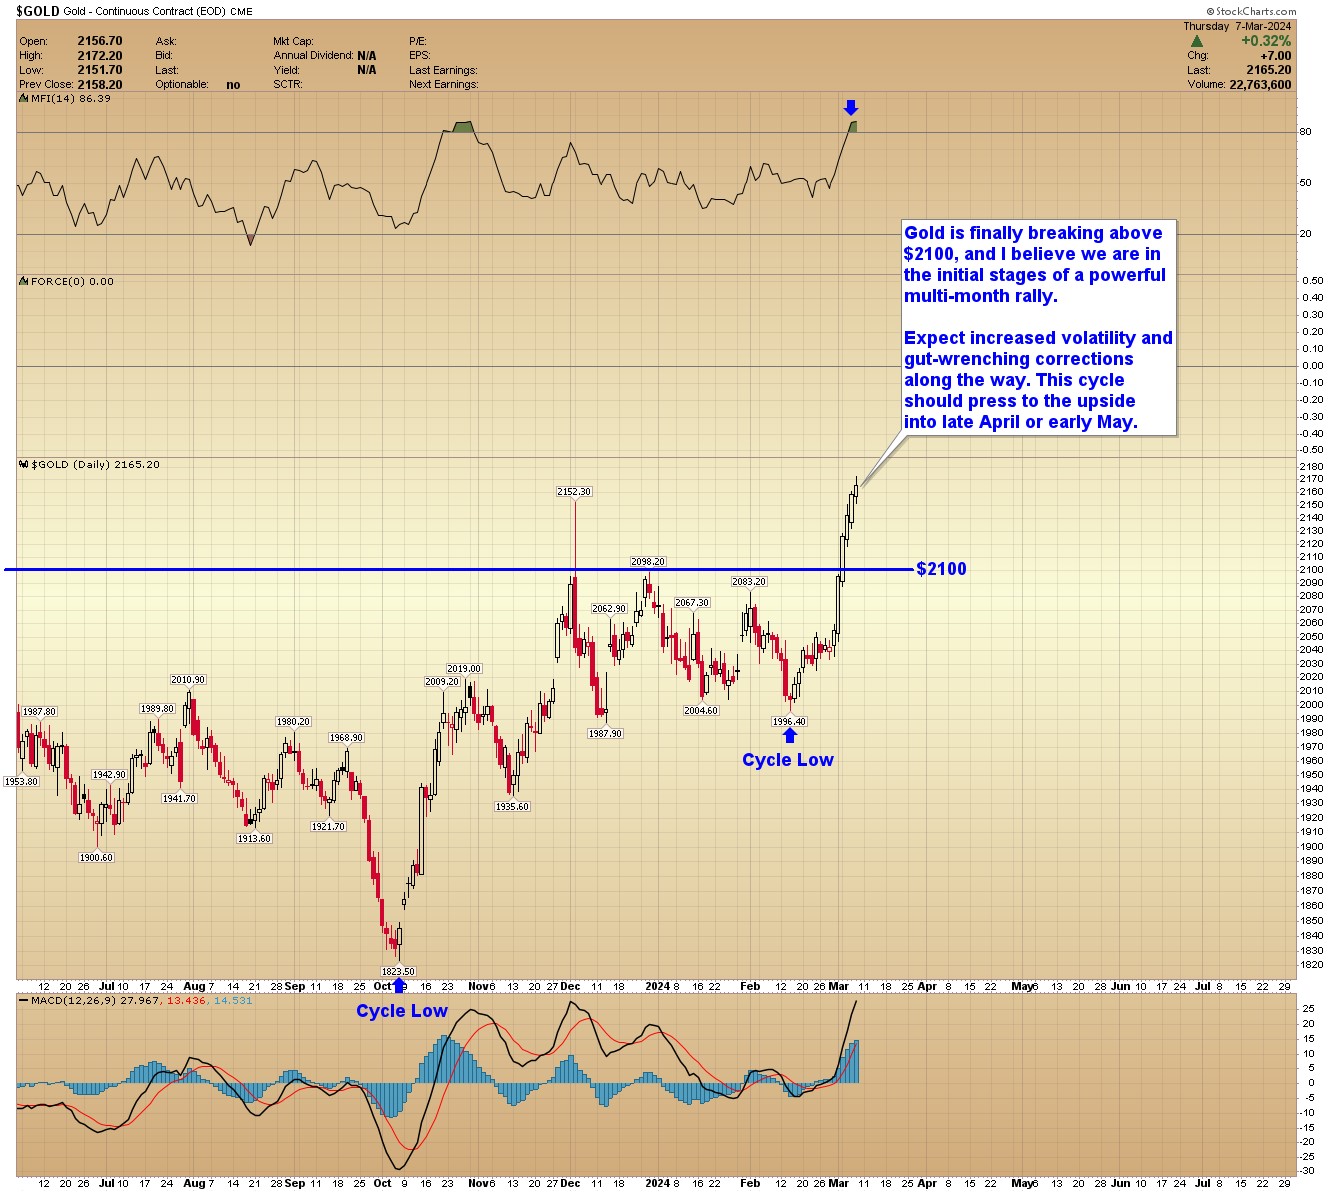
RESTART GREAT GOLD MINE - ABCOURT MINES | Red Cloud's Pre-PDAC 2024 -
Red Cloud TV


.jpg)


Precious Metals & Mining Update - GOLD WEEKLY - Unless something dramatically changes, we have a weekly breakout in gold.
A 50% rally succeeded a similar breakout in 2019.

GOLD DAILY- Gold is finally breaking above $2100, and I believe we are in the initial stages of a powerful multi-month rally.
This cycle should press to the upside into late April or early May.

RESTART GREAT GOLD MINE - ABCOURT MINES | Red Cloud's Pre-PDAC 2024 -
Red Cloud TV


.jpg)


Gold Flies to Fresh All-Time Highs
By: Mark J Lundeen | March 10, 2024
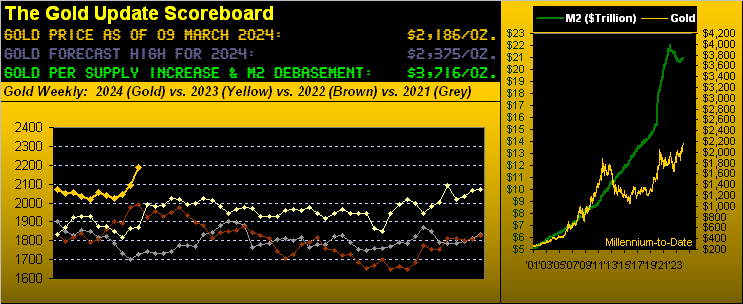
With The Gold Update now in its 16th calendar year and price having just made a series of marginal fresh All-Time Highs these past three trading days (2161 Wednesday, 2172 Thursday, 2203 Friday), on the surface we deem this as a somewhat exciting event, Gold having then settled out the past week yesterday at 2186.
However: from a more studied purview, ’tis admittedly adequate to couch it all as rather “ho-hum” given how vastly undervalued Gold remains vis-à-vis the above Scoreboard. Therein, the current market level of 2186 is -41% below the Dollar debasement valuation of 3716. Or for you WestPalmBeachers down there, Gold still has a very long way to go up — and moreover — that ’twill so do given price historically always catches up to prior high levels of valuation. This is starkly shown in the above right-hand panel, wherein clearly Gold whilst now nicely getting some up-curl remains well behind the money supply green line’s continuing to unfurl. And to be sure: this time ’round such catch-up process is seemingly taking forever.
Still, we take heart in Gold’s having thus far traveled this year some 38% of the route from last year’s settle (2072) toward this year’s forecast high (2375). And from the “Wishful Thinking Dept.”, extrapolating the current year-to-date pace would place Gold at our 2375 forecast high come 21 June, followed by 2764 for year-end. ‘Course, hardly are we holding our breath for it to all go that exquisitely perfect, but ’tis nonetheless a tasty technical tidbit.
Further from the “Keeping One’s Feet on the Ground Dept.” whilst such an extensive BEGOS Market (Bond / Euro / Gold /Oil / S&P) movement (be it up or down) naturally pulls price away from our proprietary “smooth valuation line”, as this next graphic shows, reversion to said smooth line eventually recurs over time. And per the lower panel oscillator (price less valuation), at present, Gold (2186) is +128 points above that line (2058): obviously the prior two such extremes (red vertical lines) from a year ago-to-date in turn both lead to at least some material near-term price retrenchment. That cited, Gold’s recent peaks across the past three months in the 2090-2070 area appear supportive, (or more optimistically: gone are the days of the 1900s). Here’s the graphic:
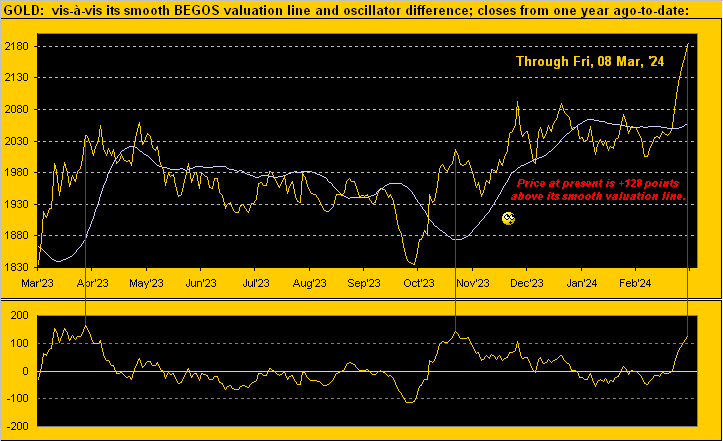
Next let’s turn to Gold’s weekly bars and parabolic trends from one year ago-to-date. This past week’s price upthrust comprehensively hoovered away the remnants of the ever so short-lived red-dotted parabolic Short trend, flipping it to Long in fine style per the new rightmost blue dot. Therein, we can’t help but notice the past two parabolic Short trends could not manage more than three weeks of red-dotted duration. Gold’s +5.5% low-to-high intra-week gain was the best in nearly a year, since that ending 17 March 2023, and the +4.5% net weekly gain the best since that ending this past 13 October. Think the buyers are in charge? “YES!!!” indeed:
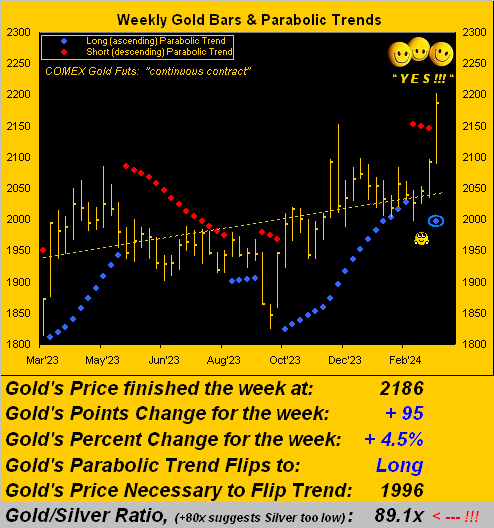
Meanwhile in charging along with the stagflation theme nauseatingly herein detailed a week ago, the Economic Barometer’s set of 13 incoming metrics produced — as surmised — just five period-over-period improvements, notably with respect to job creation, albeit the rate of February’s Unemployment (despite the increase in Payrolls) jumped two pips from 3.7% to 3.9%. Still, there were some sore stinkers in the past week’s bunch: January’s Factory Orders sank at a -3.6% pace, the month’s Trade Deficit was the worst since that of last April, and credit cards rocketed into orbit as January’s Consumer Credit level leapt from $0.9B in December to $19.5B. “When ya don’t gots da dough, get out da plastic!” Afterall, there was almost no growth in February’s Hourly Earnings. And as for the Econ Baro itself, straight down continued as … well … straight down, even as Federal Reserve Chairman Jerome Powell in his Humphrey-Hawkins Testimony remained non-committal toward any near-term change in his Bank’s Funds Rate, (for which as you regular readers know the case can be made to actually increase it). “Oh, say it ain’t so!” Here’s the Baro:

“But the S&P 500 keeps sailing right along, eh mmb?“
So ‘twould appear, Squire, albeit the mighty Index did just (barely) record a down week (-0.3%), only its third such demise of not just the past the ten weeks year-to-date, but indeed since that ending 23 October … which for those of you scoring at home means the Casino 500 has spun 16 up weeks of the last 19. How rare are such streaks? On a mutually-exclusive basis, before this run, it had only occurred on two other occasions across the past 25 calendar years (during 2018 and 2011, prior to which was during 1989). And following the 2018 stint, the S&P then “corrected” as much as -18.3% within three months, whilst after the 2011 stint, the Index similarly dumped -16.9%. Also, this Casino 500 is now characterized as 35 consecutive trading days “textbook overbought”. So “Get Ready”–[The Temptations, ’66].
Tempting, too, is the track of Gold, certainly so since mid-February from the rightmost dominant low (1996) in the following left-hand panel of price’s daily bars from three months ago-to-date. In the right-hand panel we’ve Gold’s 10-day Market Profile with its bevy of volume-dominant support levels as labeled:
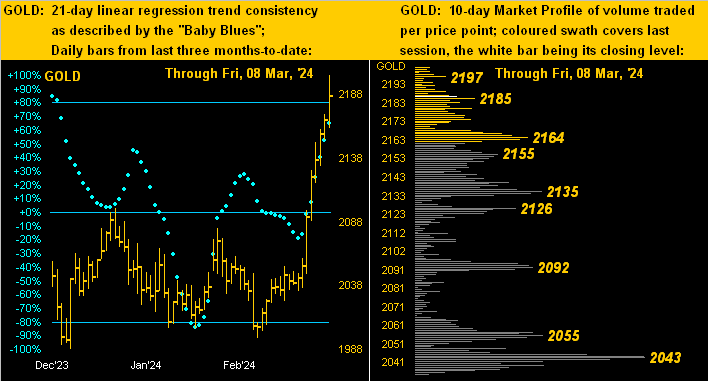
Silver’s setup is quite similar with her daily bars (below left) and Profile (below right). Again to expound upon that which we regulary harp, Silver — given the Gold/Silver ratio now at 89.1x — remains CHEAP! The ratio’s century-to-average is 68.1x: plug that into your HP 12C to see where Silver “ought” be(!)
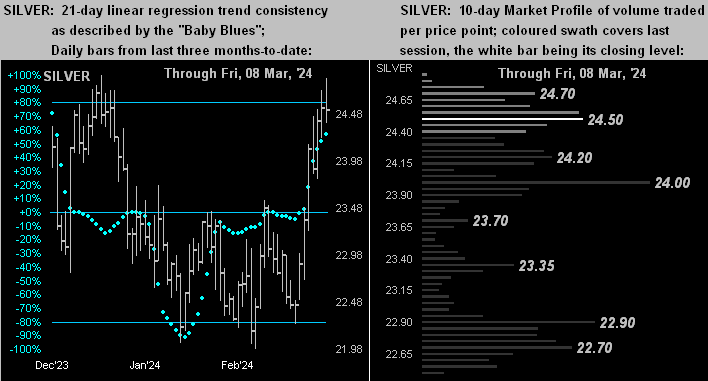
To finish, with 15 metrics due next week for the Econ Baro including the Bureau of Labor Statistics’ reads on the pace of February inflation at both the retail and wholesale levels, we can’t resist going with this closing graphic as — after all — ’tis The Gold Update No. 747:
What fuels your financial jet? We trust ’tis Gold!
Read Full Story »»»
 DiscoverGold
Jack Chan: Gold Price Exclusive Update
By: Jack Chan | March 9, 2024

Our proprietary cycle indicator is now UP.
To public readers of our updates, our cycle indicator is one of the most effective timing tool for traders and investors. It is not perfect, because periodically the market can be more volatile and can result in short term whipsaws. But overall, the cycle indicator provides us with a clear direction how we should be speculating.
Investors
Accumulate positions during an up cycle and hold for the long term.
Traders
Enter the market at cycle bottoms and exit at cycle tops for short term profits.

GLD is on short term buy signal.

GDX is on short term buy signal.

XGD.to is on short term buy signal.

GDXJ is on short term buy signal.
Analysis

Current data suggests overall higher gold prices.
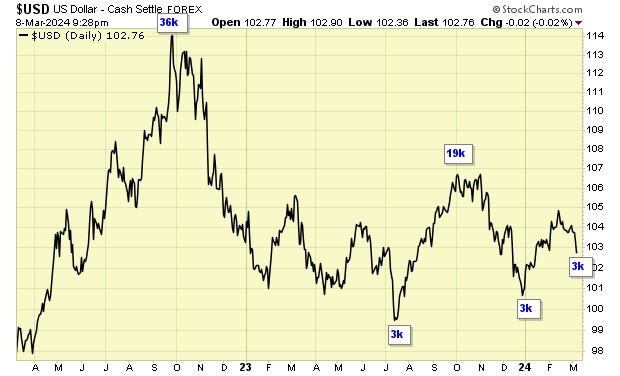
Current data supports an overall higher dollar.

Our ratio is on a new buy signal.

Trend is DOWN for USD.

Trend is DOWN for gold stocks.

Trend is UP for gold.

The underperfomance reached the lowest point in 2015, and we are now testing that low.
Summary
Gold sector cycle is up.
Trend is up for gold and down gold stocks, and down for USD.
$$$ We closed out 2023 with a nice profit. This marks the 5th straight profitable year for us.
Read Full Story »»»
 DiscoverGold
$Gold is headed higher into the next 30 week cycle high in early July. I guess it could go as high as the 2.618 extension of the May-October decline at 2500 by July. Keep in mind there's going to be 1 more weekly cycle low between now and July so it's not going to be straight up.
By: CyclesFan | March 9, 2024
• $Gold is headed higher into the next 30 week cycle high in early July. I guess it could go as high as the 2.618 extension of the May-October decline at 2500 by July. Keep in mind there's going to be 1 more weekly cycle low between now and July so it's not going to be straight up.

Read Full Story »»»
 DiscoverGold
Friday's Commitment of Traders (COT) Report from the CFTC had an interesting point about gold...
By: Tom McClellan | March 9, 2024
• Friday's Commitment of Traders (COT) Report from the CFTC had an interesting point about gold. The big money "commercial" traders responded to the rally in gold this week by posting the biggest jump in years in their collective net short position. This marks this week's pop as at least a short term price top.

Read Full Story »»»
 DiscoverGold
NY Gold Futures »» Weekly Summary Analysis
By: Marty Armstrong | March 9, 2024
NY Gold Futures closed today at 21855 and is trading up about 5.48% for the year from last year's settlement of 20718. This price action here in March is reflecting that this has been still a bearish reactionary trend on the monthly level. As we stand right now, this market has made a new high exceeding the previous month's high reaching thus far 22030 intraday and is still trading above that high of 20832.
Up to now, we still have only a 2 month reaction decline from the high established during December 2023. We must exceed the 3 month mark in order to imply that a trend is developing.
ECONOMIC CONFIDENCE MODEL CORRELATION
Here in NY Gold Futures, we do find that this particular market has correlated with our Economic Confidence Model in the past. The Last turning point on the ECM cycle low to line up with this market was 2022 and 2015. The Last turning point on the ECM cycle high to line up with this market was 2020 and 2011 and 1996.
MARKET OVERVIEW
NEAR-TERM OUTLOOK
The NY Gold Futures has continued to make new historical highs over the course of the rally from 2015 moving into 2024. However, this last portion of the rally has taken place over 9 years from the last important low formed during 2015. Prominently, we have elected four Bullish Reversals to date.
This market remains in a positive position on the weekly to yearly levels of our indicating models. Pay attention to the Monthly level for any serious change in long-term trend ahead.
Looking at the indicating ranges on the Daily level in the NY Gold Futures, this market remains in a bullish position at this time with the underlying support beginning at 21505.
On the weekly level, the last important high was established the week of March 4th at 22030, which was up 3 weeks from the low made back during the week of February 12th. So far, this week is trading within last week's range of 22030 to 20881. Nevertheless, the market is still trading upward more toward resistance than support. A closing beneath last week's low would be a technical signal for a correction to retest support.
When we look deeply into the underlying tone of this immediate market, we see it is currently still in a weak posture. This market has made a new historical high this past week reaching 22030. Here the market is trading positive gravitating more toward resistance than support. We have technical support lying at 21186 which we are still currently trading above for now.
Right now, the market is above momentum on our weekly models hinting this is still bullish for now as well as trend, long-term trend, and cyclical strength. Looking at this from a wider perspective, this market has been trading up for the past 3 weeks overall.
INTERMEDIATE-TERM OUTLOOK
YEARLY MOMENTUM MODEL INDICATOR
Our Momentum Models are declining at this time with the previous high made 2020 while the last low formed on 2023. However, this market has rallied in price with the last cyclical high formed on 2023 and thus we have a divergence warning that this market is starting to run out of strength on the upside.
Looking at the longer-term monthly level, we did see that the market made a high in December 2023 at 21523. After a thirteen month rally from the previous low of 19879, it made last high in December. Since this last high, the market has corrected for thirteen months. However, this market has held important support last month. So far here in March, this market has held above last month's low of 19964 reaching 20470.
Critical support still underlies this market at 19070 and a break of that level on a monthly closing basis would warn that a sustainable decline ahead becomes possible. Nevertheless, the market is trading above last month's high showing some strength.
 DiscoverGold
Gold $GLD - Extreme Bull. The targets are a combination of Swings, Patterns & Measured Moves, along with Fibonacci Extensions
By: Sahara | March 9, 2024
• $GOLD $GLD - Extreme Bull.
The targets are a combination of Swings, Patterns & Measured Moves, along with Fibonacci Extensions.
Want to see this pop of the 'Cup' hold. If so then I'll be monitoring those Channel-Lanes for resistance and spprts.

Read Full Story »»»
 DiscoverGold
|
Followers
|
412
|
Posters
|
|
|
Posts (Today)
|
1
|
Posts (Total)
|
44082
|
|
Created
|
01/21/05
|
Type
|
Free
|
| Moderators NYBob DiscoverGold | |||
GOLDBUGS - I-hub's #1 precious metals board was created for those with an affinity for the yellow stuff.
Gold has a long history as a hedge against inflation, and in these challenging times it seems prudent to have a certain portion of your portfolio in gold and other precious metals.
For the novice or experienced trader investing in mining stocks or NYMEX, bullion or coins, exploration stocks or producers, you'll find others with similar interests.
Whether a technical or fundamental trader, long or short term, your questions and input are welcomed and appreciated.
"The GOLDBUGS board" is the place where Goldbugs live.
Articles, technical analysis, charts, and data of interest to goldbugs are all welcome here. Information concerning currencies and commodities are also welcome as these markets influence the PM's.
Rules of the Road:
1) No insults or bashing of another member.
2) Members will maintain an attitude of humility.
3) Members who find they are able to help another member will do so.
If you find the board useful please let us know by clicking the "Add To Favorites" link.









| Volume | |
| Day Range: | |
| Bid Price | |
| Ask Price | |
| Last Trade Time: |
