


| Followers | 690 |
| Posts | 144123 |
| Boards Moderated | 35 |
| Alias Born | 03/10/2004 |
Tuesday, March 19, 2024 4:58:55 PM
By: Bruce Powers | March 19, 2024
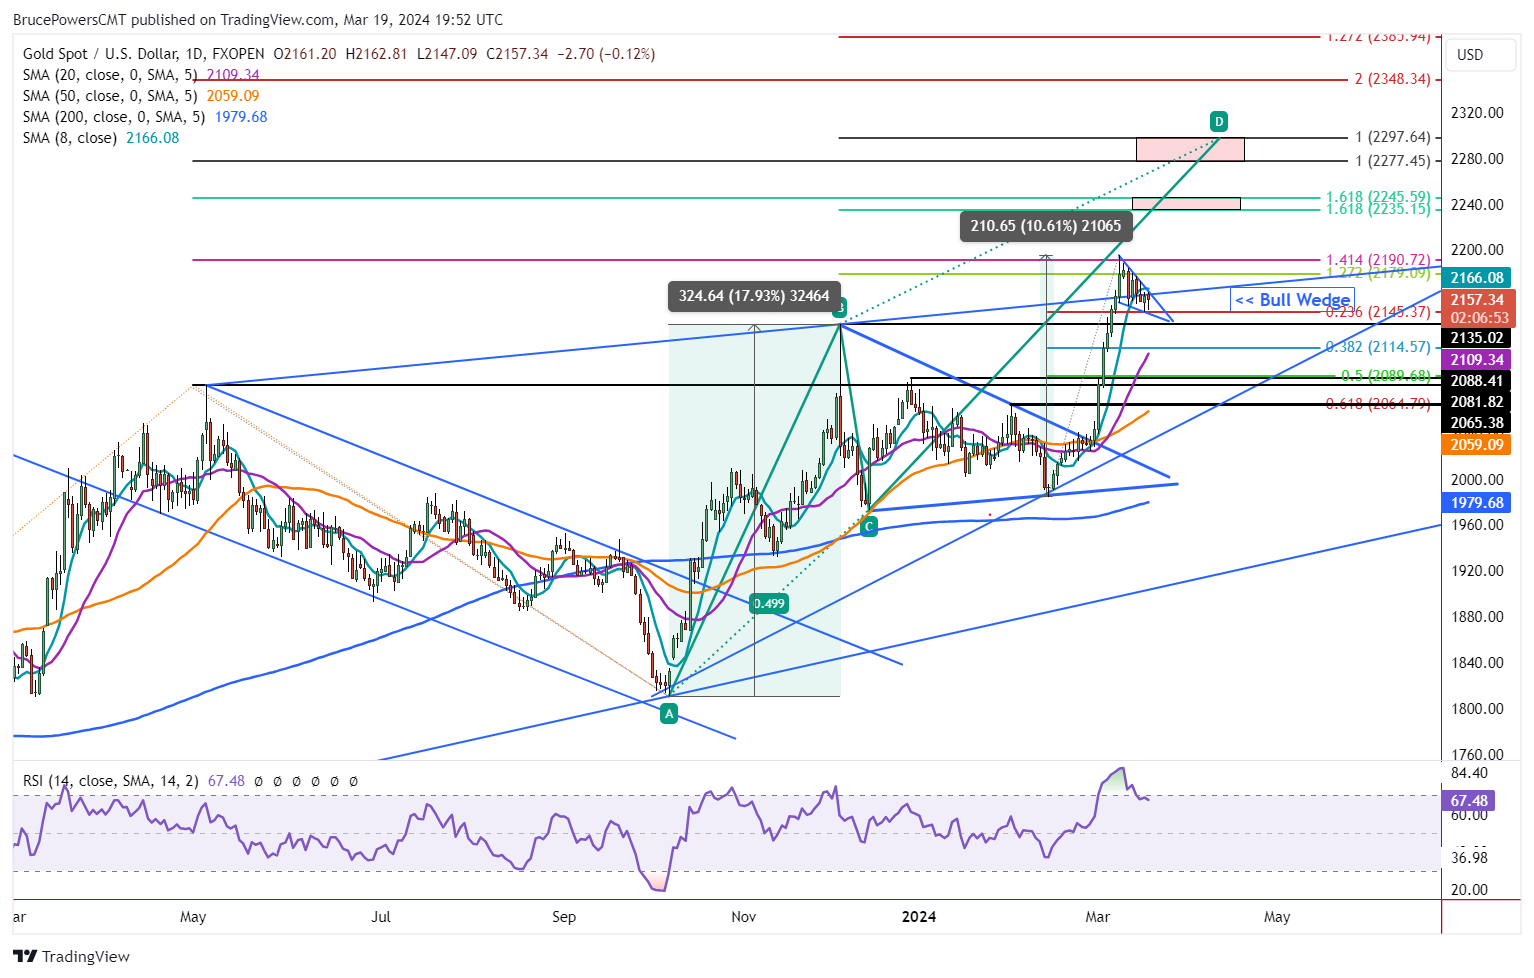
• Gold's recent retreat could be short-lived as bullish patterns emerge. A falling wedge and Fibonacci analysis suggest a potential rally towards new record highs above 2,195.
Gold enters its seventh day of a pullback following the new record high of 2,195 hit last week. Nevertheless, the retracement so far has been mild indicating remaining buying pressure for the precious metal. Yesterday gold completed a minor 23.6% Fibonacci retracement with a low of 2,146. That ratio is not used as frequently in Fibonacci analysis as deeper retracements that lead to reversals in the direction of the prevailing trend occur more frequently. Bullish reversals from earlier Fibonacci levels show stronger demand than bullish reversals that follow deeper retracements.
Support Seen at Minimum 23.6% Fibonacci Level
Support around the 23.6% retracement was tested successfully again today leading to an intraday bounce. Gold is on track to complete Tuesday with an inside day. Although the market has not yet closed at the time of this writing, it is looking like a bullish hammer candlestick may complete. If so, an upside breakout above today’s high of 2,163 shows strength, while a breakout above yesterday’s high of 2,164 offers greater confidence that the advance may be sustainable.
Bullish Falling Wedge Forms
Upon further investigation of recent price action, a small falling bullish wedge comes into view. It is a trend continuation pattern. Although the wedge may still need more time to form, or it can morph into a different pattern, a rise above yesterday’s 2,164 high triggers an upside breakout. That could be the beginning of the next move that takes gold above the 2,195-record high. Further signs of strength will then be needed, starting with a rally above the four-day high of 2,177. A Fibonacci target zone is up at 2,235 to 2,246, followed by a higher price zone from 2,277 to 2,298.
We can assess the wedge like a bull pennant by taking the previous sharp advance from before the wedge formed and then adding that distance to the breakout area to arrive at an approximate target. The low from March 1 is being used in this analysis for the bottom of the pole. It provides a potential target of 2,320.
Combined Analysis Points to 2,298 to 2,340 Target Zone
Also, a rising ABCD pattern, discussed previously and shown on the chart, targets 2,298. The measured move advance prior to the early-December previous record high (B) was 325 points or 17.9%. A similar move for the current advance would put gold at 2,309 when looking at the price difference. Calculated on a percentage basis, the target would be around 2,340. In summary, the analysis in this paragraph points to a target zone from approximately 2,298 to 2,340.
Read Full Story »»»
 DiscoverGold
Information posted to this board is not meant to suggest any specific action, but to point out the technical signs that can help our readers make their own specific decisions. Caveat emptor!
• DiscoverGold
Recent GOLD News
- Notice of Release of Barrick’s Third Quarter 2024 Results • GlobeNewswire Inc. • 10/10/2024 11:00:09 AM
- Africa’s Largest Gold Mine Probes Significant New Discoveries • GlobeNewswire Inc. • 10/08/2024 04:00:00 PM
- Twiga Partnership Leads Extractive Industry’s Contribution to Tanzanian Economy • GlobeNewswire Inc. • 10/05/2024 12:00:00 PM
- Lumwana’s Super Pit Expansion Officially Launched • GlobeNewswire Inc. • 10/02/2024 06:51:40 PM
- Barrick and Mali Reach Agreement to Settle Disputes • GlobeNewswire Inc. • 09/30/2024 06:35:12 PM
- Porgera Mine Working with UN and Enga Provincial Government to Provide Humanitarian Aid to Violence-Stricken Province • GlobeNewswire Inc. • 09/20/2024 03:35:21 PM
- Barrick Continues to Unlock Value Embedded in Its Asset Base • GlobeNewswire Inc. • 09/17/2024 05:00:29 PM
- Feasibility Study on Lumwana Super Pit Expansion Expected by Year-End • GlobeNewswire Inc. • 09/11/2024 09:00:00 PM
- Key Projects Advance as Barrick Keeps Tight Focus on Value Creation and Growth • GlobeNewswire Inc. • 08/12/2024 10:00:00 AM
- Barrick Declares Q2 Dividend and Buys Back Shares • GlobeNewswire Inc. • 08/12/2024 09:59:00 AM
- U.S. Futures Steady as Markets Await Key Inflation Data, Oil Prices Climb • IH Market News • 08/12/2024 09:47:41 AM
- Mining Plays a Vital Role in Advancing the UN’s Sustainable Development Goals, says Barrick • GlobeNewswire Inc. • 08/02/2024 06:45:39 PM
- Porgera Remains On Track Despite Mulitaka Landslide Challenges • GlobeNewswire Inc. • 07/25/2024 11:00:00 AM
- Higher Q2 Production Puts Barrick On Track to Deliver 2024 Targets • GlobeNewswire Inc. • 07/16/2024 11:00:00 AM
- Barrick Continues to Invest in Mali • GlobeNewswire Inc. • 07/09/2024 07:00:00 PM
- Exploration Success, Capital Investment and Reserve Growth to Sustain Kibali’s Production Profile • GlobeNewswire Inc. • 07/02/2024 04:00:00 PM
- Barrick and Zijin Contribute $1 Million to Support Papua New Guinea Landslide Victims • GlobeNewswire Inc. • 06/07/2024 11:18:39 AM
- Form SD - Specialized disclosure report • Edgar (US Regulatory) • 05/29/2024 08:01:04 PM
- Barrick’s Sustainability Strategy Delivers Real Value to Stakeholders • GlobeNewswire Inc. • 05/15/2024 11:00:00 AM
- Barrick Announces Extensive Exploration Partnership with Geophysx Jamaica • GlobeNewswire Inc. • 05/01/2024 10:15:00 AM
- Barrick to Ramp Up Production As It Remains On Track to Achieve 2024 Targets • GlobeNewswire Inc. • 05/01/2024 10:00:00 AM
- Barrick Declares Q1 Dividend • GlobeNewswire Inc. • 05/01/2024 09:59:00 AM
- Barrick Announces Election of Directors • GlobeNewswire Inc. • 04/30/2024 08:15:55 PM
- Barrick On Track to Achieve 2024 Targets • GlobeNewswire Inc. • 04/16/2024 11:00:00 AM
- Notice of Release of Barrick’s First Quarter 2024 Results • GlobeNewswire Inc. • 04/09/2024 11:00:00 AM
FEATURED ZenaTech, Inc. (NASDAQ: ZENA) Launchs IQ Nano Drone for Commercial Indoor Use • Oct 10, 2024 8:09 AM
FEATURED CBD Life Sciences Inc. (CBDL) Targets Alibaba as the Next Retail Giant for Wholesale Expansion of Top-Selling CBD Products • Oct 10, 2024 8:00 AM
Foremost Lithium Announces Option Agreement with Denison on 10 Uranium Projects Spanning over 330,000 Acres in the Athabasca Basin, Saskatchewan • FAT • Oct 10, 2024 5:51 AM
Element79 Gold Corp. Reports Significant Progress in Community Relations and Development Efforts in Chachas, Peru • ELEM • Oct 9, 2024 10:30 AM
Unitronix Corp Launches Share Buyback Initiative • UTRX • Oct 9, 2024 9:10 AM
BASANITE INDUSTRIES, LLC RECEIVES U.S. PATENT FOR ITS BASAFLEX™ BASALT FIBER COMPOSITE REBAR AND METHOD OF MANUFACTURING • BASA • Oct 9, 2024 7:30 AM

