 News
News  Market Data
  Discover
Support: 888-992-3836
Copyright © 2023 InvestorsHub Inc.


Register for free to join our community of investors and share your ideas. You will also get access to streaming quotes, interactive charts, trades, portfolio, live options flow and more tools.
Deliveries on Coffee/Crude/Cotton/Cocoa/Ldn Coffee
By: The PRICE Futures Group | February 16, 2023
• Tomorrow, Feb 17th is First Notice Day for Mar Coffee.
• Tues, Feb 21st is Last Trading Day for Mar Crude.
• Wed, Feb 22nd is First Notice Day for March Cotton and March Cocoa.
• Thurs, Feb 23rd is First Notice Day for March London Coffee.
Read Full Story »»»
 DiscoverGold
The Corn & Ethanol Report
By: Daniel Flynn | February 16, 2023
We kickoff the day with Export Sales, PPI MoM & YoY, Building Permits Prel, Building Permits MoM Prel, Housing Starts, Initial Jobless Claims, Philadelphia Fed Manufacturing Index, Philly Fed Business Conditions, Philly Fed CAPEX Index, Philly Fed Employment, Philly Fed New Orders, Philly Fed Prices Paid, US Jobless Claims 4-Week Average and Continuing Jobless Claims at 7:30 A.M., Fed Mester Speech at 7:45 A.M., EIA Natural Gas Storage at
9:30 A.M., 4-Week & 8-Week Bill Auction at 10:30 A.M., 30-Bill Auction at 10:30 A.M., 30-Year TIPS Auction at 12:00 P.M., at 12:00 P.M., Fed Bullard Speech at 12:30 P.M., Fed Cook Speech at 3:00 P.M., and Fed Mester Speech at 5:00 P.M.
On the Corn Front Alan burglar reports on corn flipping to the red this week. The close on March corn triggered some technicians doubts. The producers averaged 1.014m barrels a day which was 14,000 bale increase from last week. Ethanol stocks were up from 24.4 to 25.359 barrels.
Read Full Story »»»
DiscoverGold
Today's Futures Heat Map • Strongest: Palladium, Copper, Coffee, Cocoa
By: Barchart | February 16, 2023
• Today's Futures Heat Map
Strongest: Palladium, Copper, Coffee, Cocoa
Weakest: Gasoline, Lumber, Natural Gas, Heating Oil

Read Full Story »»»
DiscoverGold
Red SRW With Hard Red Wheat Gains
By: Barchart | February 16, 2023
Chicago wheat futures are off their lows, but are still trading 2 3/4 to 3 3/4 cents weaker on the day. The hard red wheats remain in the black for Thursday, with KC wheat up by 4 1/4 to 5 cents and front month MPLS wheat 4 1/2 to 6 1/2 cents higher.
USDA’s weekly Export Sales report had 209,847 MT of wheat bookings from the week that ended 2/9. That was a 3-wk high and was 78% above the same week last year. Taiwan was the top buyer but was closely followed by Japan and Nigeria each with +30k MT. HRS and white wheat had the most activity with 35% of the sales each, followed by SRW with 20% and HRW with 10%. Accumulated export shipments were 12.96 MMT, or 476.3 mbu as 61% of the WASDE forecast. Total commitments were at 78% of the forecast as of 2/9.
Russia’s SovEcon lifted their 22/23 wheat export forecast by 100k MT to 44.2 MMT, citing a weak ruble, large domestic stocks, and solid demand. USDA has their official forecast at 43 MMT for Russian wheat exports. Russia’s Interfax counted 19.8 MMT of wheat stocks in their January count, compared to 12.4 MMT at the same time last year.
CBH Group, a private exporter from Australia, said Western Australian farmers have delivered 22.7 MMT of grain, up from 21.3 MMT last year. They forecast a record crop from the region and suggest final counts will be revised higher.
Read Full Story »»»
DiscoverGold
Cattle Working On 3rd Down Day
By: Barchart | February 16, 2023
Live cattle futures are sitting 30 to 70 cents in the red for what could be the 3rd consecutive red day. Feb contracts are in the black at midday, but gains are limited to 2 cents so far during the delivery process. Front month feeder cattle futures are 27 to 80 cents weaker at the midday prints. FCE had 1,176 head listed in their Thursday auction, but saw no sales between $158-$160 bids and $162-$163 asks. USDA reported some more cash trade mostly near $159 for NE on Wednesday, with deals from $159 to $162 and $254 in the beef. The CME Feeder Cattle Index was just a penny higher on 2/14 to $183.07.
USDA reported the week’s beef export sales at 28,149 MT. That was up 71% for the week and was 22% above the same week last year. The week’s exports were 16,748 MT for an accumulated total of 91,826 MT. That is up 8% from last year’s record pace.
Wholesale Boxed Beef prices were $3.86 higher in Choice this morning and $2.10 stronger in Select. The Choice/Select spread was $16.24 from the AM report. The week’s FI cattle slaughter was estimated at 376k head through Wednesday, up by 6k from last week and 4k from the same week last year.
Read Full Story »»»
DiscoverGold
Hogs Off Lows But Still Red For Midday
By: Barchart | February 16, 2023
The hog market is trading 27 to 75 cents lower through Thursday’s midday, though April is up 85 cents from its earlier session low. USDA’s National Average Base Hog price for Thursday morning was withheld to protect confidentiality, yesterday afternoon’s quote was $1.17 higher to $77.36. The 2/13 CME Lean Hog Index was 54 cents higher to $75.18.
USDA reported pork export sales at 44,952 MT for the week of 2/9. That was a 5-wk high and was 145% above the same week last year. Mexico and Japan were each over 10k MT for the week’s sale. The weekly export shipment was 30,529 MT for a yearly total of 174k MT.
Pork cutout futures are also lower through midday, with the front months down by 37 to72 cents. USDA’s morning National Pork Carcass Cutout value was $83.08 after a $2.14 increase. USDA estimated the week’s FI hog slaughter at 1.445 million head through Wednesday. That is 4k head more wk/wk and compares to 1.414m head during the same week last year.
Read Full Story »»»
DiscoverGold
Corn Market Still In Red At Midday
By: Barchart | February 16, 2023
The market tried to erase the overnight weakness, but futures eventually found themselves back in the red. Current corn quotes are fractionally to 1 3/4 cents lower for midday.
USDA Weekly Export Sales data showed 1.024 MMT of old crop and 100k MT of new crop corn was sold during the week that ended 2/9. For old crop bookings, that was a slip from 1.16 MMT last week, but marked the 4th of the last 6 weeks for +1 MMT sold. Mexico was the week’s top buyer, followed by sales to unknown destinations and to China. The weekly report had cumulative commitments at 1.095 bbu, compared to 1.832 bbu last season, and to the 1.925 bbu full year export forecast.
The FAS also showed 112,984 MT of sorghum was sold during the week for a cumulative 897k MT commitment through 2/9.
EIA data showed ethanol producers averaged 1.014m barrels per day through the week that ended 2/10. That was a 14k bale increase from the prior week. The production increase was expected, but the growth in ethanol stocks was not. Ethanol stocks were up from 24.4m to 25.339 million barrels.
Read Full Story »»»
DiscoverGold
Soybeans Backing Off Into Midday
By: Barchart | February 16, 2023
Fading initial gains, the soybean futures are currently sitting 1 1/4 to 6 cents in the black. March beans were being bought from 10:20 (central), but have faded back near breakeven for the midday prints. Meal prices are sitting $1.10 to $1.40 in the red so far and are near their lows for the day. Soybean oil prices are up by 67 to 70 points for midday.
USDA’s weekly Export Sales report showed 512,802 MT of old crop soybeans were sold, which was within the range of estimates. Last week saw 374k MT sold but the same week last year had 1.317 MMT booked. The week’s top buyers were China (including 252k MT switched from unknown) and Mexico (including 47.5k MT switched from unknown). The weekly report also had 260k MT of new crop sales, mostly for China. Old crop commitments were 1.767 bbu, matching last year and 89% of the WASDE forecast. New crop commitments were at 42.7 mbu, compared to 165 mbu at the same point last year.
For the products, FAS data had 295,853 MT of meal sales, with 271k for 22/23 and 25k for 23/24 delivery, and 8.3k MT of soy oil sales. Pre-report estimates were topped out at 300k MT for meal and 10k MT for oil for 22/23.
NOPA members reported a 179.007 mbu crush for January. That was below the average trade guess going in, and was down 2% from January last year. Soy oil supplies were reported at 1.829b lbs, which was up from 1.79 billion in December.
Read Full Story »»»
DiscoverGold
Cotton Fell Back To Red For Midday
By: Barchart | February 16, 2023
Earlier in the Thursday session the cotton market attempted to buy back some of Wednesday’s drop. Current board prices have slipped nearly 2 cents off those rebound highs and are back in the red. The front months are trading with 57 to 133 point losses as of midday quotes.
USDA’s FAS reported 216,915 RBs of cotton was sold for export during the week that ended 2/9. That was a 17% drop off from last week’s business, though was still up 37% from the same week last year. Vietnam and China combined for over half of the week’s total business. The report also had 23,936 RBs of new crop sales for the week, which set the accumulated forward book at 1.285m RBs. Accumulated old crop commitments were 9.93m RBs, a 19% lag from last year’s pace.
The Cotlook A index was firm at 100.85 cents for 2/15. The Seam reported 4,812 bales were sold at spot on 2/14 for an average gross price of 79.03 cents/lb. The USDA AWP for cotton was 74.41 cents/lb this week and will be updated this afternoon.
Read Full Story »»»
DiscoverGold
Coffee Prices Gain On Signs Of Tighter U.S. Supplies
By: Barchart | February 16, 2023
March arabica coffee (KCH23) this morning is up +3.25 (+1.84%), and Mar ICE robusta coffee (RMH23) is up +19 (+0.93%).
Coffee prices this morning are moderately higher on signs of tighter U.S. coffee supplies after the Green Coffee Association late Wednesday reported U.S. Jan green coffee inventories fell -1.8% m/m to 6.265 mln bags. Also, ICE arabica coffee inventories fell to a 5-week low of 844,914 bags Wednesday.
Coffee prices also have support as recent heavy rain in Minas Gerais, Brazil's largest arabica growing region, kept farmers out of fields and delayed the application of fertilizers and pesticides, which may lead to lower coffee yields. Also, the heavy rain led to an increase in coffee rust in some trees. Somar Meteorologia reported Monday that Brazil's Minas Gerais region received 63.4 mm of rain last week, or 126% of the historical average. Minas Gerais accounts for about 30% of Brazil's arabica crop.
In a bullish factor, robusta coffee inventories are shrinking as ICE-monitored robusta coffee inventories Wednesday fell to 5,933 lots, the lowest since contract rules changed in 2016.
A bearish factor for arabica coffee is the recovery in ICE arabica coffee inventories. Since falling to a 23-year low of 382,695 bags on November 3, ICE arabica coffee inventories rose to a 7-1/4 month high of 891,933 bags last Wednesday.
Smaller global coffee exports are bullish for coffee prices after the International Coffee Organization (ICO) reported on February 2 that Oct-Dec global coffee exports have fallen -2.8% y/y to 30.27 mln bags. Cecafe reported last Thursday that Brazil Jan green coffee exports fell -18.5% y/y to 2.52 mln bags. Coffee exports from Guatemala, the second-largest coffee producer in Central America, fell -8% y/y in January to 172,439 bags. Coffee exports from Colombia, the world's second-largest producer of arabica coffee beans, fell -19% y/y to 835,000 in January. Vietnam Jan coffee exports sank -27.7% y/y to 142,544 MT.
Robusta has support after coffee trader Volcafe forecasted that the global 2023/24 robusta coffee market would see a record deficit of 5.6 mln bags as Indonesia, the world's third-largest robusta producer is expected to see its 2023/24 robusta coffee production fall to 9.1 mln bags, the smallest robusta crop in 10 years due to damage from excessive rainfall across its growing regions.
The USDA, in its bi-annual report released on December 23, cut its global 2022/23 coffee production estimate by -1.3% to 172.8 mln bags from a June estimate of 175.0 mln bags. In addition, the USDA cut its 2022/23 global coffee ending stocks estimate by -1.7% to 34.1 mln bags from a June estimate of 34.7 mln bags. Meanwhile, the USDA's Foreign Agriculture Service (FAS) on November 22 cut its Brazil 2022/23 coffee production forecast by -2.6% to 62.6 mln bags from a prior estimate of 64.3 mln bags. This year was supposed to be the higher-yielding year of Brazil's biennial coffee crop, but coffee output this year was slashed by drought. By contrast, Conab on January 19 forecasted the 2022/23 Brazil arabica crop would increase +14.4% to 37.4 mln bags.
Read Full Story »»»
DiscoverGold
There is a Flag. The Energy Report
By: Phil Flynn | February 16, 2023
There is a flag on the play. The EIA Energy Information Administration (EIA) sparked the biggest amount of outrage since the holding call against the Eagles in the Super Bowl. The EIA reported a record-breaking weekly adjustment of 2,669 million barrels of oil a day to their weekly supply data, or just a mere 13,769 million barrel weekly adjustment. That huge adjustment has oil traders calling foul and throwing things at their screens and they want their money back. Of course, they will have as much luck with that as they will have to get your Eagles to win bets back. Yet this is a growing source of irritation that the EIA model can be more broken at a time when the risk to the global oil supply has been this high. In fact, the adjustment is so large that market watcher Tin Dallinger says that the EIA should change its name to the “Adjustment Bureau”.
The adjustment helped play into a massive almost record-breaking 16.3 million barrel increase in weekly crude oil supply that catapulted supplies from about 3% above the average range for commercial inventories to a healthy 8% above the average range. Yet with SPR inventories down 213,000 million barrels from a year ago, are things really what they seem? Myra P. Saefong at MarketWatch wrote the U.S. Energy Information Administration’s weekly petroleum supply report released Wednesday included an upward “adjustment” to last week’s U.S. oil supplies — one of the larger ones reported in the government data. The change can be seen simply as a “balancing item,” as the EIA describes it, but can also lead to volatility in the oil market as traders digest it, analysts said.
The change “suggests that the EIA underestimated not only domestic crude production but also likely underestimated net imports of crude and overestimated refinery runs,” said Troy Vincent, senior market analyst at DTN. The “adjustment” line itself isn’t unusual. It’s included in the EIA’s U.S. petroleum balance sheet tables each week. The size of the latest weekly rise in inventories is notable, though the EIA pointed out to MarketWatch that the size of the latest adjustment was “surpassed twice in 2022.” In a footnote on the report, the EIA said the adjustment, formerly known as “unaccounted-for crude oil,” is a “balancing item.”
When asked for comment on the adjustment, the EIA pointed to a Nov. 30, 2022 tweet thread from Joseph DeCarolis, EIA administrator, which said the adjustment at that time represented “the difference between supply and disposition.” Ideally, “the adjustment would be zero since the crude oil supplied has to go somewhere,” he said, but there is a “degree of uncertainty associated with each term, stemming from imprecise statistical sampling and modeling inaccuracies.”
Yet did inaccuracies mean that last week’s increase was real? There is evidence that we should have got a supply build as the US refining sector has gone into maintenance season hibernation. The EIA showed a very slow crude oil refinery input of just 15.0 million barrels per day down 383.000 thousand barrels from last week. Refineries operated at just 86.5% down over 10% from where they were weeks ago their operable capacity last week. Gasoline production was down to 9.1 million barrels per day and distillate fuel production fell to 4.5 million barrels per day. That left gasoline inventories up by 2.3 million barrels from last week which is a small increase for this time of year and is about 5% below average.
Distillate inventories increased last week. Distillate fuel inventories decreased by 1.3 million barrels last week and are about 15% below the five-year average for this time of year.
The Energy Information Administration recently also admitted that they had been way underreporting US oil demand. My take is the EIA is doing the best it can but you cannot read too much into these numbers as the models are not adding up. The reality is that oil is seeing some weakness due to seasonal swings and warm weather, but that will soon change. Oil held key support and should start ripping higher as refiners start to reopen to meet what will be strong demand. Consumers are clearly holding up well and there are signs that global demand is also going to spike.
China’s demand is rising and that is why Saudi Arabia felt that they could raise prices. India’s oil demand is surging and perhaps US lawmakers should take note of India’s move to abolish the damaging “windfall profit” tax.
First, let’s look at demand. Energy World reported that India’s fuel demand witnessed saw a sharp rebound as month-on-month, the demand was up 13.6 percent, reversing the dip in the previous month. Sales fell 5.1 percent month-on-month in January as cold conditions cut vehicular movement. Now Oil Price is reporting that India, which introduced a windfall tax on its oil industry last year amid the oil price boom, has now cut the levy for crude oil and the export of jet fuel and diesel, Reuters has reported, citing government information.
The windfall tax was introduced in July last year as Indian refiners decided to take advantage of solid margins driven higher by robust demand and the energy supply disruptions in Europe. This advantage took the form of ramped-up oil and fuel exports to sell at higher international prices while domestic prices remained subdued. More recently, however, refiners have been stocking up on cheap Russian crude redirected from Europe, possibly in anticipation of higher demand for fuels in the near future, after the European Union embargoed most imports of Russian fuels.
Also in another bullish development, Oil Price reported that, “Barclays on Wednesday said it would no longer provide financing to oil sands companies or oil sands projects and tightened conditions for thermal coal lending in an updated policy, which fell short of announcing overall pledges or targets in funding oil and gas.”
Even after the shocking report from the EIA, oil prices held key support and as long as they do that, we believe that a move back towards 84 is in the cards next week. Strong U.S. economic data caused the dollar to rally and hit one-month highs which was also a headwind for the price of oil despite the smoke and mirrors and more oil coming from the Strategic Petroleum Reserve we still feel that the market is going to be undersupplied globally in the next couple of months. Underinvestment and the woke anti-energy policies around the globe point to higher prices later this year and more pain for the middle class.
We believe it is wise to start putting on long-term option strategies at the back end of the curve as the globe is heading towards a significant supply squeeze that could last for decades to come. In the meantime, energy is going to become more of a luxury item because the poor will not be able to afford it and the world continues its path to green energy madness.
Dan Molinski at the Wall Street Journal reported investors began betting that Freeport LNG, a plant in Texas shut since a fire in June, is on the verge of a restart and will be back to normal soon. But while regulators in Washington have received a request from Freeport to resume full commercial operations of Phase 1, no green light has yet been given. Once that approval to commence liquefaction operations is given, the facility will be permitted to place LNG in two of the site’s tanks, and transfer to ships through one loading dock, sources close to the matter tell WSJ.
In Europe they are taking victory laps over an energy crisis averted. The lack of winter saved the continent. Yet be careful. Oil Price reported that Europe’s natural gas futures point to structurally higher prices for the rest of the year, as Europe will soon have to start filling inventories for 2023/2024 winter.
Read Full Story »»»
DiscoverGold
Agriculture Master Report
By: Bill Moore | February 15, 2023
MAR WHT
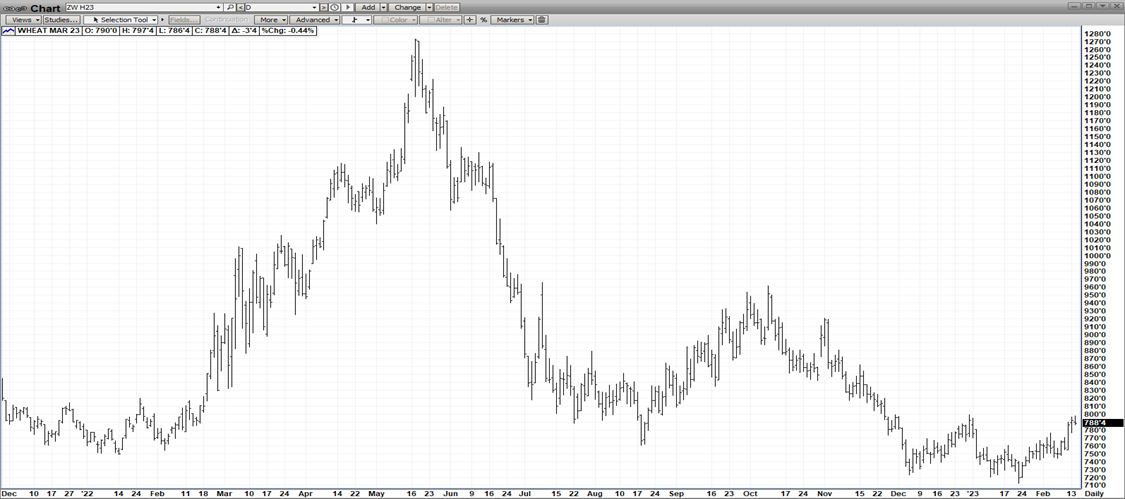
The Mar Wht contract was the beneficiary of an escalation of the Russian-Ukraine conflict – as fears mounted the increased bombings could jeopardize the Ukr Corridor Deal! The mkt – in response – added a “war premium”! Additionally, the mkt received spill-over aid from corn & beans as they reacted to continued dryness in Argentina! The net result was the mkt rallying to the top end of a 3-month range (720-800)! Further advances will be dependent upon an increased export flow – recently crimped by Russia’s relentless export of its surplus wheat at bottom-basement prices!
MAR CORN
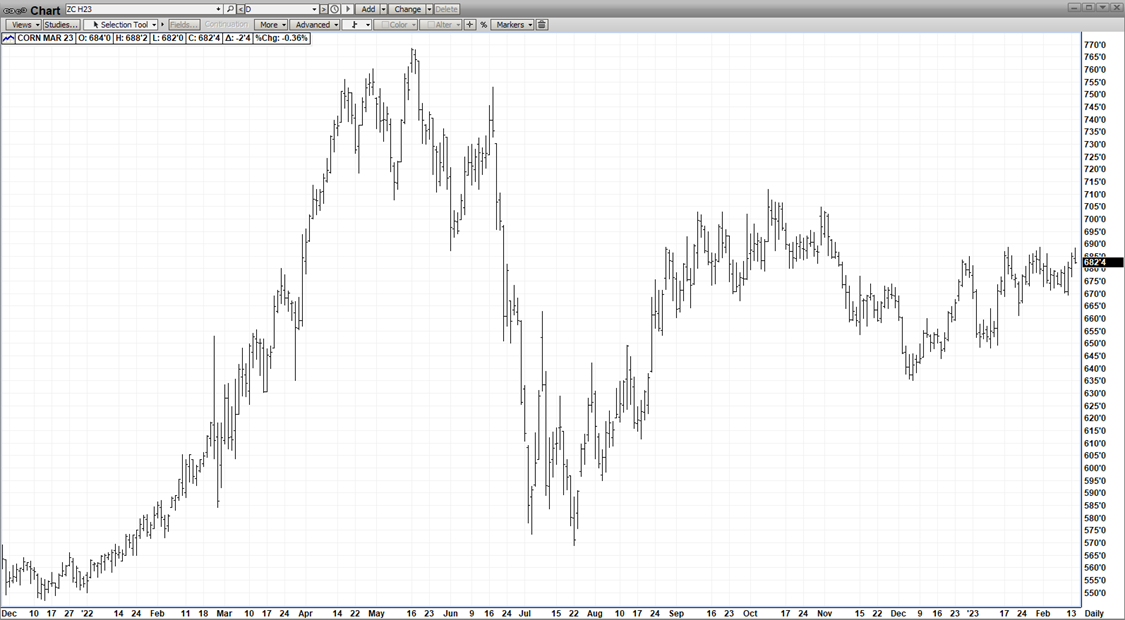
Mar Corn was also able to rally to the highs of their 3-month range (735-688) on the back of continuing dryness in Argentina – where production losses are being estimated upwards of 30%! And the crop is reaching the point where the drought-damage is deemed irreversible! Exports are incrementally better with the recent plummeting dollar and the re-opening of China after their recent easing of Covid restrictions! A negative today comes from the Macro arena – when the CPI was announced at 7:30am at 6.4% – under last months 6.5% but above the expectations of 6.2%! This implies the Fed may have to keep rates “higher for longer” in order to bring inflation down to their target 2%!
In the “big picture scenario”, the mere fact Mar Corn is holding just under $7.00 in Feb with a record Brazilian crop currently in harvest – is quote impressive and speaks to the underlying support provided by 6-7 year low global carry-out!
MAR BEAN
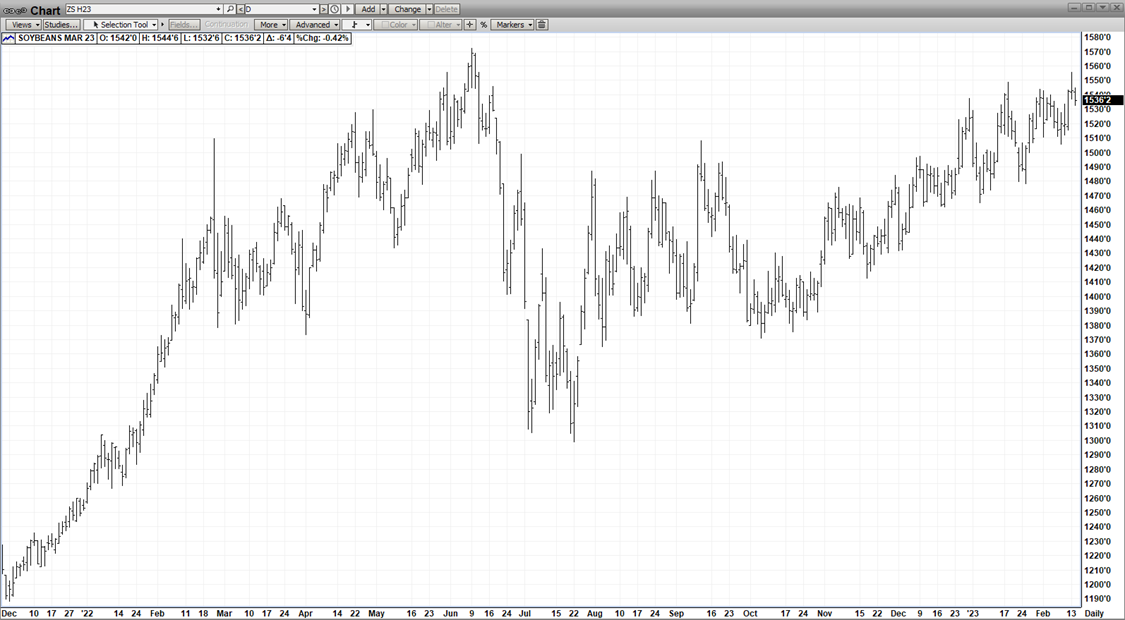
The largest beneficiary of the continuing Argentine drought was Mar Beans – as they soared to 6 month highs – last Friday! And this impressive mkt action in spite of an expected record Brazilian Bean Crop – at 154mmt – currently 20% complete! A plus $15.00 mkt in mid-Feb speaks to a mkt – already buoyed by tight stocks – that is anticipating a marked improvement in exports! Should somehow the Brazil bean crop not fully blossom, the Argentine dryness get worse and exports ratchet up as expected – current levels will not hold the mkt!
APL CAT
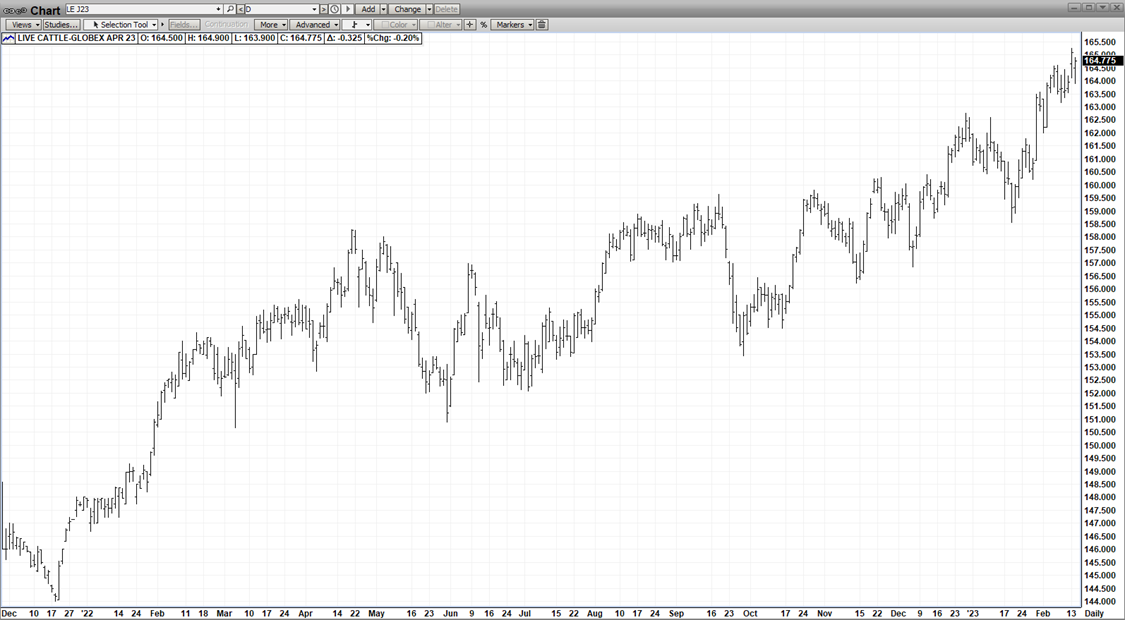
A relentless Bull – both technically & fundamentally – just keeps on chugging – with no top in sight! Fed by a tight supply with 1st Qtr supplies dropping way off from the 4th Qtr, lower slaughter weights than a year ago & more-than-adequate demand, the mkt achieved levels this week not seen since Jan 2015! Occasionally, the mkt gets overbought & stalls out for a while – before resuming its up! However, its eventual Achille Heel could be the cheap-as-dirt Hog mkt! Many days, while the cattle punches out new contract highs, the hog mkt is simultaneously scoring contract lows! This dichotomy can’t last as eventuall the consumer will turn the tide – opting for cheap pork chops over expensive steaks!
APL HOGS
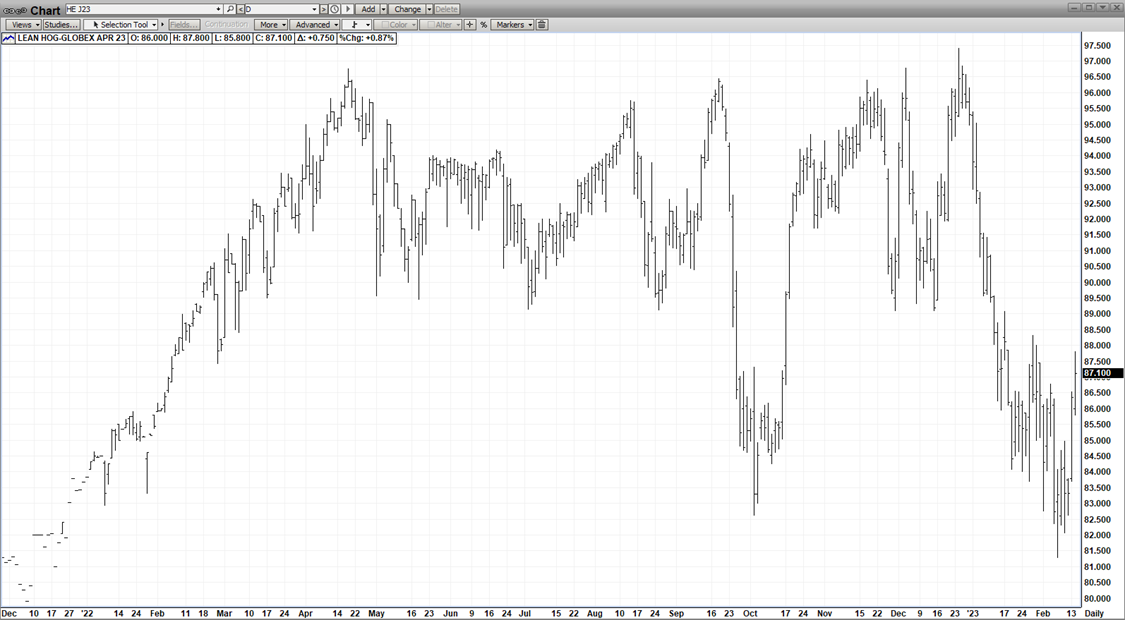
It appears “the worm has finally turned” for the woebegone hog mkt – which after a spike low last week, has rallied $6.00 in just a few days (81.50-87.50)! The widely publicized reason for the turn-around was the re-emergence of Asian Swine Flu in Hong Kong & China – jeopardizing the global pork supply! But the sheer cheapness of the product had to be very enticing for bargain-hunters on the board & shoppers in the grocery stores! Whatever it takes, it appears the mkt has finally bottomed! The ASF may not sustain the rally but the relative cheapness of pork chops vs steaks at the meat counter =- most probably will!
Read Full Story »»»
DiscoverGold
Today's Futures Heat Map • Strongest: Cocoa, Soybean Oil, U.S. Dollar Index, Russell 2000 E-Mini
By: Barchart | February 15, 2023
• Today's Futures Heat Map
Strongest: Cocoa, Soybean Oil, U.S. Dollar Index, Russell 2000 E-Mini
Weakest: Coffee, Cotton, Heating Oil, Lumber

Read Full Story »»»
DiscoverGold
Since late September 2022, cocoa has been ripping higher… amazing.
Grains Report: Wheat, Rice, Corn and Oats, Soybeans
By: Jack Scoville | February 15, 2023
• WHEAT
General Comments: Wheat markets were mostly lower yesterday in Chicago but a little higher in Minneapolis after a choppy session. News that Russia has launched a new offensive in Ukraine provided much of thew support on Monday but there was no real new yesterday about the war to propel futures higher. Russia appears to be sending three divisions across the border to fight and it looks as though this could be a major operation for the Russian army. Fears of deliveries of Wheat from the Black Sea will be cut significantly are surfacing again. Trends are turning up in all three markets on the daily and weekly charts. Ideas are that both Australia and Russia are harvesting record to near record Wheat crops this year. Russia is said to be plotting a huge new invasion of Ukraine that could prevent farmers in Ukraine from harvesting Wheat and planting Corn. Russia has a large production and is undercutting most world prices in the international market. However, Russian production estimates have dropped recently. The demand for US Wheat in international markets has been a disappointment all year and has been hindered by low prices and aggressive offers from Russia. Ukraine is also looking for new business for its crops and Russia is aggressive in the world market as it looks for cash to fund the war.
Overnight News: The southern Great Plains should get scattered showers. Temperatures should be variable. Northern areas should see isolated to scattered showers. Temperatures will average below normal. The Canadian Prairies should see isolated showers. Temperatures should average near to below normal.
Chart Analysis: Trends in Chicago are up with objectives of 802 and 834 March, Support is at 776, 766, and 757 March, with resistance at 809, 818, and 827 March. Trends in Kansas City are up with objectives of 936 March. Support is at 898, 888, and 877 March, with resistance at 916, 925, and 946 March. Trends in Minneapolis are mixed to up with objectives of 933, 948, and 968 March. Support is at 925, 912, and 907 March, and resistance is at 936, 942, and 946 March.
• RICE:
General Comments: Rice was lower again yesterday on what appeared to be some speculative profit taking and new commercial selling. Prices above $18.00/cwt offer good profits for farmers and reports indicate that they have been selling. Demand has been good from domestic sources but domestic users are hoping to buy cheaper. Export demand has been uneven. Demand has been an issue for the market all year. There is not much going on in the domestic market right now although mills are milling for the domestic market in Arkansas and are bidding for some Rice and although some Rice moved in Tein quiet trading at what were called very good prices. Demand in general has been slow to moderate for Rice for exports and solid for domestic uses.
Overnight News: The Delta should get mostly dry conditions. Temperatures should be below normal.
Chart Analysis: Trends are up with no objectives. Support is at 1760, 1746, and 1735 March and resistance is at 1790, 1801, and 1819 March.
DJ USDA World Market Rice Prices – Feb 15
USDA today announced the prevailing world market prices
of milled and rough rice, adjusted for U.S. milling yields
and location, and the resulting marketing loan gain (MLG)
and loan deficiency payment LDP) rates. Source: USDA
—–World Price—– MLG/LDP Rate
Milled Value Rough Rough
($/cwt) ($/cwt) ($/cwt)
Long Grain 18.69 11.75 0.00
Medium/Short Grain 18.32 12.18 0.00
Brokens 10.87 —- —-
This week’s prevailing world market prices and MLG/LDP
rates are based on the following U.S. milling yields and
the corresponding loan rates:
U.S. Milling Yields Loan Rate
Whole/Broken ($/cwt)
(lbs/cwt)
Long Grain 54.28/14.78 7.00
Medium Grain/Short Grain 60.31/10.41 7.00
• CORN AND OATS
General Comments: Corn and Oats closed lower yesterday with much of the selluing related to the CPI data released by the US government that showed inflation was still strong. Ideas are that the FED will continue to try to control inflation for a while and that could create a recession.. The short term trend is now sideways in Corn and down in Oats. The export demand was solid last week even though demand remains well behind the pace to make USDA objectives. Brazil has been hanging on for its Summer crop although losses are now being reported. Argentina has suffered through some extreme drought and losses could be large. The Brazil Winter crop is harvested and China is buying the surplus. The Summer crop and the Argentine crop is developing under stressful conditions. The next Winter crop is going into the ground in good conditions, but it has been wet so the Soybeans harvest has been delayed and the Corn planting is becoming delayed as well. There are concerns about demand with the Chinese economic problems caused by the lockdowns creating the possibility of less demand as South America has much better crops this year to compete with the US for sales. China is now moving rapidly to open the economy and allow people to move around with no lockdowns so the demand could start to improve
Overnight News: Mexico bought 213,370 tons of US Corn.
Chart Analysis: Trends in Corn are mixed to up with objectives of 701, 710, and 737 March. Support is at 678, 672, and 669 March, and resistance is at 689, 693, and 698 March. Trends in Oats are down with objectives of 358 March. Support is at 363, 361, and 351 March, and resistance is at 375, 382, and 389 March.
• SOYBEANS
General Comments: Soybeans and Soybean Meal were lower yesterday as the CPI data showed that the FED would likely need to work harder to control inflation. Soybean oil closed a little higher. It remains hot and dry in Argentina and southern Brazil and crop conditions are getting worse. It will turn cooler this week in Argentina but it should stay dry. Central and northern Brazil have seen harvest operations interrupted with too much rain. Soybean Meal saw strong weekly export sales as Argentina is having to withdraw from the market for Soy products sales due to the drought in the country and the fact that they have already sold a lot of Soybeans into the world market. They are now buying from Brazil. The harvest in Brazil is slowly expanding in central and northern areas. These areas have seen too much rain and the harvest has been slow. Production potential for the Brazil is called very strong even with potential problems and losses in the south. Argentine production ideas continue to drop with the drought as planting is delayed and the crops already in the ground are stressed. Ideas that Chinese demand will improve, but this could take a few more weeks as a very large part of the population now has Covid. This has delayed a robust economic return for the country.
Overnight News:
Chart Analysis: Trends in Soybeans are up with objectives of 1582 and 1619 March. Support is at 1545, 1528, and 1511 March, and resistance is at 1556, 1562, and 1574 March. Trends in Soybean Meal are up with objectives of 515.00, 528.00, and 568.00 March. Support is at 4500.00, 488.00, and 478.00 March, and resistance is at 508.00, 514.00, and 520.00 March. Trends in Soybean Oil are mixed. Support is at 5960, 5890, and 5840 March, with resistance at 6150, 6240, and 6360 March.
Read Full Story »»»
DiscoverGold
It's time to keep an eye on sugar
By: Jay Kaeppel | February 15, 2023
• Like many commodities, sugar tends to experience seasonal strength and weakness during certain times of the year. A period of typical first-half seasonal weakness is approaching. This piece looks closely at this trend and what it may mean for futures traders. We also highlight a potential play for non-futures traders.

Read Full Story »»»
DiscoverGold
Have Corn Prices Found Support?
By: Charles Schwab | February 15, 2023
Corn futures traded higher to start the month with weekly USDA data showing an increase in exports week over week. The outlook on Argentina corn crop has been reduced on drought concerns. Brazilian second crop planting could be pushed due to increased rain fall. Ukrainian grain production has dropped dramatically from last year. Hightower projections could indicate a surplus during the new crop season if the usage ratio is consistent with previous years.
Last week's USDA Export Inspections report indicated 511,506 MT of corn was shipped in the week ending 02/09. That was an increase from the previous week's 494,000 MT but significantly lower than the 1.46 MMT during the same week last year. The export total for the season is 13.06 MMT through 02/19, nearly 35% below the export total based on last year's pace.
Weather forecasts show a drought throughout Argentina over the next 10 days which has led USDA's Ag Attache to reduce the outlook for the Argentina corn crop to 45 MMT. 35-40% of the early planted corn has shown serious damage based on the lack of rain despite a solid rainfall in late January.
Too much rain in Brazil could lead to late plantings of their second corn crop. As of February 4th, plantings of the second crop reached 10% compared to 22% of the crop from the same time last year.
Early estimates for Ukrainian corn production are well below totals from last year which could lead to a tight global supply. Total production for the 2023/24 planting season is expected to come in near 18 million tonnes, down from 27 million during last years season, and 42.13 million tonnes in the 2021/2022 planting season.
Based on Hightower projections, a decrease in global production could lead to a substantially higher reliance on US corn crops, meaning a new crop stock could rise to its highest levels in nearly 35 years.
Technicals
Looking at the daily chart for the Corn Futures March 2023, CH23, contract we can see the 20-Day Simple Moving Average recently crossed the 200-Day SMA price point with heavier than average volume on up days. The 50-Day SMA price point had been acting as the support level and it will be interesting to see If the contract finds support at the 200-Day SMA moving forward.
Trading Central’s Daily Technical Analysis has support levels found at 681.00 and 678.75 and resistance levels at 689.25 and 690.72.
According to the CFTC Commitment of Traders report released January 24th managed money traders have increased their long position by +8,967 contracts and increased their short position by +4,326 contracts. Managed money traders are net long 203,506 contracts.
The Relative Strength Index at 57.94% indicates slightly more buyers than sellers but the contract has not moved into overbought territory.


Contract Specifications
Corn Futures March 2023 (CH23)

Read Full Story »»»
DiscoverGold
Softs Report: Cotton, OJ, Coffee, Sugar, Cocoa
By: Jack Scoville | February 15, 2023
• COTTON
General Comments: Cotton was a little lower yesterday in directionless trading and still remains inside the trading range created since the beginning of November. Futures are still showing bad demand fundamentals as the weekly export sales reports have shown moderate sales at best. Sales were moderate in the reports released last week. Overall, the demand for US Cotton has not been strong although better demand has developed over the last couple of weeks. Some ideas that demand could soon increase as China could start to open its economy in the next couple of months as Covid outbreaks should start to weaken as people get vaccinated or immune. Covid is now widespread in China so the beneficial economic effects of the opening are being delayed but these effects should start to be felt as the people there achieve immunity over the next few weeks.
Overnight News: The Delta will get scattered showers and near to above normal temperatures. The Southeast will see scattered showers and above normal temperatures. Texas will have mostly dry conditions and below normal temperatures. The USDA average price is now 83.66 ct/lb. ICE said that certified stocks are now 1,147 bales, from 8,900 bales yesterday.
Chart Trends: Trends in Cotton are mixed. Support is at 84.20, 83.10, and 82.00 March, with resistance of 87.00, 87.50 and 88.90 March.
• FCOJ
General Comments: FCOJ was sharply higher yesterday after two days of very big long liquidation and lower prices. Chart trends are up on the daily and weekly charts. Demand should start to improve as the northern Winter passes by. Historically low estimates of production due in part to the hurricanes and in part to the greening disease that have hurt production, but conditions are significantly better now with scattered showers and moderate temperatures. The weather remains generally good for production around the world for the next crop including production areas in Florida that have been impacted in a big way by the two storms seen previously in the state. Brazil has some rain and conditions are rated good.
Overnight News: Florida should get mostly dry conditions. Temperatures will average near to below normal. Brazil should get scattered showers and near normal temperatures.
Chart Trends: Trends in FCOJ are mixed. Support is at 230.00, 220.00, and 214.00 March, with resistance at 245.00, 253.00, and 256.00 March.
• COFFEE
General Comments: New York and London closed higher again yesterday and New York led the way on follow through buying tied to speculation about a reduced size of the Brazil production. Price trends are turning up on the charts. Ideas of big production for Brazil continue due primarily to rains falling in Coffee production areas now and as offers stayed strong from Brazil and increasingly from Vietnam. Vietnam is estimated to have veery good production this year due to a good growing season and less rain now as harvest expands again. There are ideas that production potential for Brazil had been overrated. The weather in Brazil is currently very good for production potential but worse conditions seen earlier in the growing cycle hurt the overall production prospects as did bad weather last year.
Overnight News: ICE certified stocks are lower today at 0.870 million bags. The ICO daily average price is now 176.25 ct/lb. Brazil will get isolated showers in northern areas with near to above normal temperatures. Central America will get scattered showers. Vietnam will see scattered showers.
Chart Trends: Trends in New York are mixed to up with objectives of 193.00, 204.00, and 206.00 March. Support is at 177.00, 174.00, and 172.00 March, and resistance is at 184.00, 186.00 and 192.00 March. Trends in London are mixed. Support is at 2050, 2020, and 2000 March, and resistance is at 2090, 2110, and 2120 March.
• SUGAR
General Comments: New York and London closed higher yesterday and trends are mixed on the daily charts. The US Dollar was a little weaker to support stronger prices in Sugar. Ideas are that the market has priced in production losses in India and Brazil and is providing renumeration for Indian and Thai exporters who want to sell. Thailand expects to export 9.0 million tons of Sugar in the current crop year, 7% more than last year. Ideas of better supplies coming might keep futures prices in check even with a rather tight nearby scenario. Good production prospects are seen for crops in central and northern areas of Brazil, but the south should turn dry again and so should some northern areas. The harvest is active in Thailand. Australia and Central America harvests are also active. Mills in Brazil are shutting down now with the majority of the harvest now complete and processed. European production is expected to be reduced again this year.
Overnight News: Brazil will get scattered showers. Temperatures should average near to above normal. India will get mostly dry conditions and near to above normal temperatures.
Chart Trends: Trends in New York are mixed. Support is at 1960, 1940, and 1900 May and resistance is at 2030, 2050, and 2080 May. Trends in London are mixed. Support is at 557.00, 549.00, and 543.00 May and resistance is at 574.00, 575.00, and 582.00 May.
• COCOA
General Comments: New York closed slightly lower and London closed a little higher yesterday as the US Dollar also moved slightly lower due to US inflation data. Inflation was higher than expected and should be enough to keep the FED in a tightening mode for a while. Talk is that hot and dry conditions reported in Ivory Coast could curtail mid crop production, but main crop production ideas are strong. Ghana has reported a disease in its Cocoa to hurt production potential there. The rest of West Africa appears to be in good condition. Good production is reported for the main crop and traders are worried about the world economy moving forward and how that could affect demand. Supplies of Cocoa are large at ports. The weather is good in Southeast Asia.
Overnight News: Mostly dry conditions are forecast for West Africa. Temperatures will be near normal. Malaysia and Indonesia should see scattered showers. Temperatures should average near normal. Brazil will get scattered showers and near to above normal temperatures. ICE certified stocks are higher today at 5.033 million bags.
Chart Trends: Trends in New York are mixed to up with objectives of 2730, 2740, and 2750 March. Support is at 2590, 2530, and 2510 March, with resistance at 2650, 2670, and 2700 March. Trends in London are mixed. Support is at 2000, 1950, and 1930 March, with resistance at 2060, 2090, and 2120 March.
Read Full Story »»»
DiscoverGold
The Corn & Ethanol Report
By: Daniel Flynn | February 15, 2023
We kickoff the day with MBA 30-Year Mortgage Rate, MBA Mortgage Index, MBA Mortgage Refinance Index, MBA Purchase Index and MBA Mortgage Applications at 6:00 A.M., Business Inventories, Retail Sales MoM & YoY, NY Empire State Manufacturing Index, Retail Sales Ex Autos MoM, Retail Sales Ex Gas/Autos MoM at 7:30 A.M. , Industrial Production MoM & YoY, Manufacturing Production MoM & YoY and Capacity Utilization at 8:15 A.M., NAHB Housing Market Index and Retail Inventories Ex Autos MoM at 9:00 A.M., EIA Energy Stocks at 9:30 A.M. 17-Week Bill Auction at 10:30 A.M., NOPA Crush at 11:00 A.M., 20-Year Bond Auction at 12:00 P.M., Dairy Products Sales at 2:00 P.M.Net long-term TIC Flows, Overall Net Capital Flows and Foreign Bond Investment at 3:00 P.M.
On the Corn Front farmers, ranchers and meat processors listened to a speech by US Secretary of Agriculture Tom Vilsack spoken by video conference held by President Biden held in Washington on Jan 3, 2022. And the results of that meeting over a year ago are in. The US said on Tuesday it was “disappointed” in the Mexican government’s announcement the previous day which walked back a deadline to ban genetically modified (GM) corn for animal feed and industrial use in the country, but retained its plans to ban the corn for human consumption.” The US believes in and adheres to a science-based, rules=based trading system and remains committed to preventing disruptions to bilateral agriculture trade and economic harm to US and Mexican producers,” Vilsack said in a statement And no victory lap after the Consumer Price Index (CPI). Corn futures closed mixed with news of widely scattered lite showers forecasted in northern portions of Argentina. Good rains across RGDS and Santa Catarina in Southern Brazil. In the overnight electronic session the March corn is currently trading at 678 ½ which is 3 ¾ cents lower. The trading range has been 682 ½ to 678.
On the Ethanol Front more infrastructure failure with Iowa ethanol plant closings without carbon capture pipelines. The lack of stewardship in every project this administration has put their paws on is more than evident. The Iowa Renewable Fuels Association released a study concluding up to 75% of Iowa’s ethanol production is at stake if the state is locked out of carbon capture and sequestration pipeline products. More government waste before our eyes. “Legislation that would effectively shut down Iowa ethanol production,” says Monte Shaw, executive director of the Iowa Renewable Fuels Association (IRFA). Ethanol futures remain in drydock.
Read Full Story »»»
DiscoverGold
Sticky. The Energy Report
By: Phil Flynn | February 15, 2023
Oil and inflation are sticky. Oil prices are trying to stabilize even after inflation data came in hotter than expected at a 6.4% increase in year-over-year inflation and a massive 10.5-million-barrel crude oil supply increase was reported by the American Petroleum Institute (API). Oil prices weakened after the inflation data. The dollar increased as hopes that we may see the Fed back off interest rate increases diminished. With inflation as sticky as oil, it is harder to believe that the Fed will relent on trying to slow the economy more in the coming months. Yet while the world seems like it is awash in oil right now with the big supply increase and Biden front loading barrels from the SPR, there are signs that the market is heading toward much tighter supplies ahead.
The International Energy Agency, (IEA) perhaps the most famous for un-reporting demand, is now raining on their oil demand forecast yet again. I will give you a moment for the shock to wear off. The IEA now says that world oil demand will rise by 2.32 million bpd in 2023, up 100,000 bpd from the previous forecast. As I said before, the IEA is most famous for is underreporting demand. Yet the IEA director Dr. Fatih Birol is also famous for saying that the world needs to stop investing in fossil fuels. He and his agency in May of 2021 said to achieve the net-zero target requires an “unprecedented transformation of how energy is produced, transported and used globally. In addition, from now on there should be “no investment in new fossil fuel supply projects and no further final investment decisions for new unabated coal plants.” Yet despite that not happening, Dr. Birol still says that reaching net zero targets is possible. How! I don’t know but they still say the sky is falling. Or maybe it is just China balloons.
The IEA also says that oil supplies will exceed demand in the first half of the year but the second half could be a deficit. Maybe Biden should have waited before he released those barrels from the SPR.
The API also reported that the gasoline supply increased by just 846,000 barrels. Those supplies should be rising more at this time of year. Gasoline demand is strong and that may become a problem later on as we start to make the switch to the summer blends. Distillate inventories did increase by 1.728 million barrels but are still way below average for this time of year.
OPEC yesterday said that China’s oil demand may increase by 590,000 bpd in 2023 after a contraction in 2022. They say they are concerned over the extent of China’s economic recovery and its oil demand impact. Yet at the same time, they lowered the OPEC oil supply growth forecast to 1.4 mln bpd (from +1.5 mbpd) citing lower expectations from Russia, US.
Lower supply growth from the US is in part due to the US meddling in the markets with unprecedented moves of oil releases and the most uncertain regulatory environment in history. Biden’s wild and baseless accusations of price gouging and war profiteering against the oil and gas industry have created a hostile environment for investment.
OPEC production is down. Non-OPEC production is down. Russian oil production is down. Demand is going to rise, what more do we need to know? Well, we must know whether China’s reopening is going to continue to increase oil demand. At this point, I don’t get why people don’t see that’s going to have a major impact on demand. I think people are underestimating the demand break from China and we’re going to find out very shortly. The other concern is whether the Fed forces us into a deep recession. I do not see that. Use weakness to get long and put on bullish options strategies.
Natural gas is still trying to bottom. EBW Analytics says that, “Natural gas again tested—and held—technical support Monday, laying the groundwork for prices to probe higher. Freeport LNG requested FERC authorization to restore operations to all three LNG trains and weather is turning steadily less bearish into late February—enabling recent gains. Storage surpluses are set to rocket higher in coming weeks to multi-year highs While partially priced-in, it may prove difficult for NYMEX futures to post a sizable rally in the face of continued oversupply conditions. Weather models are indicating risks for a possible polar vortex dislocation that could bring market-altering cold to the US into mid-March. Still, price-elastic gas-to-coal switching could help the market absorb bullish weather shifts. Within the next 30-45 days, it remains likely that Freeport’s return, more supportive weather, decelerating supply, and steadying storage surpluses could help NYMEX futures establish a bottom and migrate higher.
Read Full Story »»»
DiscoverGold
CPI Excludes Food--Have You Seen the ETF DBA?
By: Mish Schneider | February 14, 2023
Maybe it's just Valentine's Day, so the food and commodities market sees a push to chocolates, flowers, and fine dining.
And maybe not.
The CPI came out with an unexpected rise...but goods remained softer. Services on the other hand, rose. However, the CPI excludes food and energy prices.
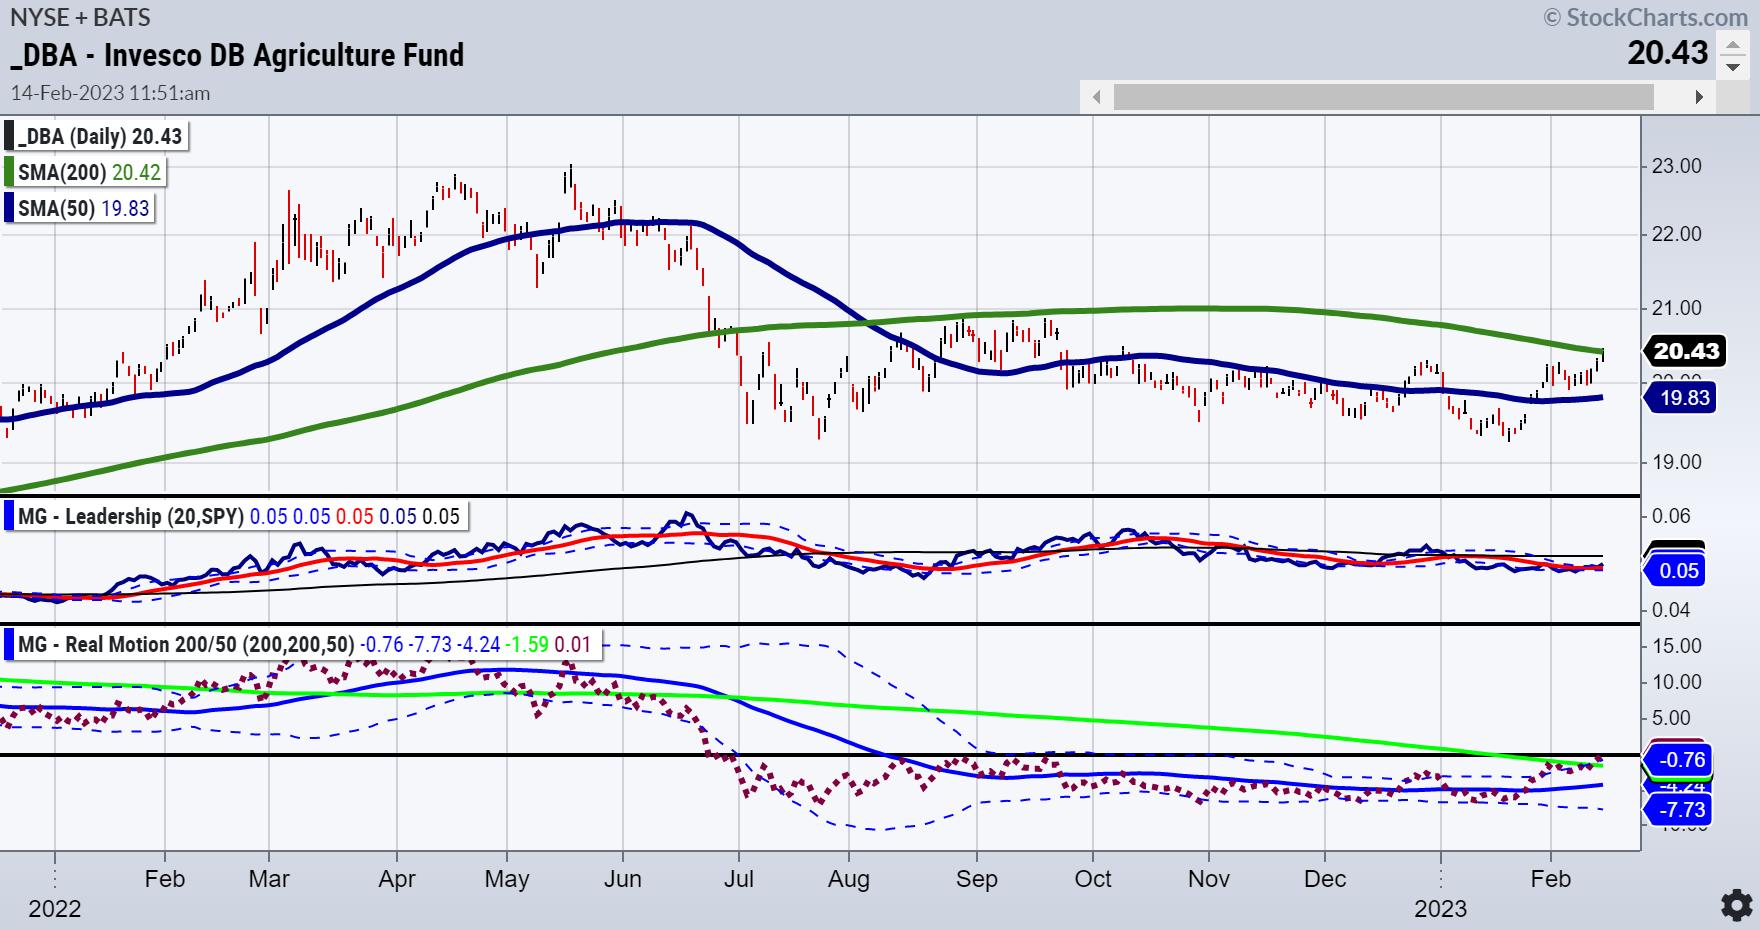
We see no relief in many of the agricultural commodities in the Investor DB Agricutural Fund ETF. The underlying index includes corn, soybeans, wheat, Kansas City wheat, sugar, cocoa, coffee, cotton, live cattle, feeder cattle, lean hogs, and, most recently, livestock.
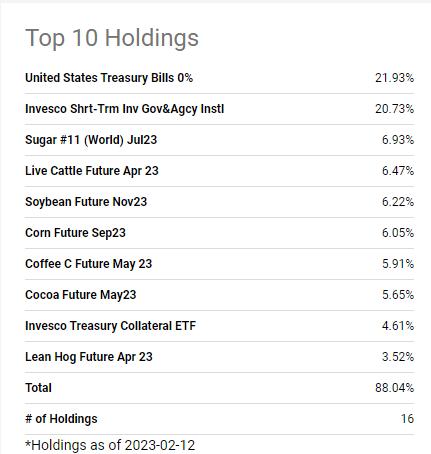
The investment seeks to track changes, whether positive or negative, in the level of the DBIQ Diversified Agriculture Index Excess Return™ (the "index") over time, plus the interest income from the Fund's holdings of primarily US Treasury securities and money market income less the Fund's expenses.
If you want to track how the Fed is doing controlling real inflation, regardless of the inverted yield curve, the rise in long bond yields or even the U.S. dollar holding support...
Before we review the chart, our quant models have lots of commodities holdings. In particular, the Sector Conservative, Sector Moderate, and GEMS models hold metals and oil exploration. Interestingly, we also hold SOXL or the 3-times leveraged Semiconductor bull (since January 11th).
Chips and commodities are where it's at right now. That makes chips as valuable as say, sugar (one of the largest holdings in DBA). And speaking of sugar, the futures are holding recent highs. Another blast higher in sugar and more chaos could ensue, as we have written about many times. Here is a timely article written in April 2020!!!
The CPI number excludes food. However, to date, while food prices have declined from the peak in July 2022, food inflation sits at 10%. Food at home is 11.3% and food away from home at 8.2%.
Circling back to the DBA chart, the price rose to clear all of the prior action since October 2022. However, the 200-day moving average looms large as resistance with today's high. Also noteworthy is that DBA is now outperforming the benchmark according to our Leadership indicator.
Real Motion had a breakout and diversion to the upside, as the momentum cleared over the 200-DMA and popped to new highs not seen since last September. The diversion is that the momentum indicator cleared the 200-DMA while price has yet to confirm. Something to watch out for.
With the four indices still rangebound, these continuing bullish trends in the most essential thing on the planet--FOOD--should keep those focusing on A) disinflation and B) a fed pivot a bit quieter.
Read Full Story »»»
DiscoverGold
Coffee Prices Jump On Heavy Rain In Brazil And Smaller Guatemalan Coffee Exports
By: Barchart | February 14, 2023
March arabica coffee (KCH23) this morning is up +6.45 (+3.64%), and Mar ICE robusta coffee (RMH23) is up +23 (+1.13%).
Coffee prices this morning are sharply higher, with arabica climbing to a 1-1/2 week high. Coffee has carry-over support from Monday as heavy rain in Minas Gerais, Brazil's largest arabica growing region, has kept farmers out of fields and delayed the application of fertilizers and pesticides, which may lead to lower coffee yields. Also, the heavy rain has led to an increase in coffee rust in some trees. Somar Meteorologia reported Monday that Brazil's Minas Gerais region received 63.4 mm of rain last week, or 126% of the historical average. Minas Gerais accounts for about 30% of Brazil's arabica crop.
In a bullish factor, robusta coffee inventories are shrinking as ICE-monitored robusta coffee inventories today fell to 5,935 lots, the lowest since contract rules changed in 2016.
A bearish factor for arabica coffee is the steady increase in ICE arabica coffee inventories. Since falling to a 23-year low of 382,695 bags on November 3, ICE arabica coffee inventories rose to a 7-1/4 month high of 891,933 bags last Wednesday.
Smaller global coffee exports are bullish for prices after the International Coffee Organization (ICO) reported February 2 that Oct-Dec global coffee exports have fallen -2.8% y/y to 30.27 mln bags. Cecafe reported last Thursday that Brazil Jan green coffee exports fell -18.5% y/y to 2.52 mln bags. Coffee exports from Guatemala, the second-largest producer and shipper of coffee in Central America, fell -8% y/y in January to 172,439 bags. Coffee exports from Colombia, the world's second-largest producer of arabica coffee beans, fell -19% y/y to 835,000 in January. Also, Vietnam Jan coffee exports sank -27.7% y/y to 142,544 MT.
Robusta has support after coffee trader Volcafe forecasted that the global 2023/24 robusta coffee market would see a record deficit of 5.6 mln bags as Indonesia, the world's third-largest robusta producer is expected to see its 2023/24 robusta coffee production fall to 9.1 mln bags, the smallest robusta crop in 10 years due to damage from excessive rainfall across its growing regions.
The USDA, in its bi-annual report released on December 23, cut its global 2022/23 coffee production estimate by -1.3% to 172.8 mln bags from a June estimate of 175.0 mln bags. In addition, the USDA cut its 2022/23 global coffee ending stocks estimate by -1.7% to 34.1 mln bags from a June estimate of 34.7 mln bags. Meanwhile, the USDA's Foreign Agriculture Service (FAS) on November 22 cut its Brazil 2022/23 coffee production forecast by -2.6% to 62.6 mln bags from a prior estimate of 64.3 mln bags. This year was supposed to be the higher-yielding year of Brazil's biennial coffee crop, but coffee output this year was slashed by drought. Conab on January 19 forecasted the 2022/23 Brazil arabica crop would increase +14.4% to 37.4 mln bags.
Read Full Story »»»
DiscoverGold
Today's Futures Heat Map • Weakest: Palladium, Platinum, Gasoline, Lumber
By: Barchart | February 14, 2023
• Today's Futures Heat Map
Strongest: Natural Gas, Coffee, Sugar, Lean Hogs
Weakest: Palladium, Platinum, Gasoline, Lumber

Read Full Story »»»
DiscoverGold
Commodities may be due for a bounce
By: Jay Kaeppel | February 14, 2023
• The CRB Index serves as a proxy for commodities as an asset class. This index has been consolidating for seven months and may be poised for a bounce. Buttressing this possibility is that the index is entering a short, but typically quite favorable, seasonal window. This piece looks more closely at the history and how an investor can participate.

Read Full Story »»»
DiscoverGold
Front Loaded. The Energy Report
By: Phil Flynn | February 14, 2023
The Biden administration is front-loading the 26 million barrels in US Strategic Petroleum Reserve crude oil sales using smoke and mirrors as this administration is running out of both.
In an act of desperation, the Biden administration pulled forward barrels of SPR oil that were going to be released later and instead rolled the sale forward so they can be released between April and June. This is a desperate attempt to keep oil and gasoline prices from surging. While that might sound like a noble endeavor, the Biden administrations’ interference in the marketplace is only going to create a situation where supplies are much tighter down the road and gas prices are higher.
Maybe the move was in response to the Russian oil production cut or more than likely it was because Biden knows that there is nothing that can zap a President’s popularity more than rising gas prices. This is especially true when it comes to this President as he has directly had a hand in making it harder to produce oil and gas in this country.
Fox Business reported, “Unlike the largest-ever drawdown of the SPR that Biden announced in response to Russia’s war in Ukraine, the latest release of 26 million barrels is in response to a requirement included in two laws enacted by Congress during the Obama administration under the Bipartisan Budget Act of 2015 and the Fixing America’s Surface Transportation (FAST) Act. The announcement comes ahead of a potential uptick in gas prices as the U.S. nears the summer driving season.
“Biden is front-loading SPR barrels to avoid a summer gasoline price spike,” said Phil Flynn, analyst Price Futures Group and FOX Business Network contributor. “There are growing concerns among the Biden administration that gas prices are headed back to $4.00 a gallon and the president is fearful of the political heat he will have to take.”
Yet despite the administration bragging about how they were able to sell oil out of the reserve at over $100 a barrel, they have failed totally in their plan to buy oil back below $70 a barrel. Javier Blas of Bloomberg Pointed out that, “It increasingly looks like the Biden administration missed the window to buy oil for the SPR. US officials said they wanted to see prices in the $67-$72 range. WTI is not trading at $72 until January 2025. And the benchmark is not trading below $67 until March 2026. Yet they say they still have the plan to buy back the oil that they mortgaged from taxpayers’ future.
Reuters reports that, “the Department Of Energy said it is implementing a three-part strategy to refill the reserve in the long term, including repurchases with revenues from emergency sales, returns of more than 25 million barrels of oil from previous exchanges, and working with Congress to avoid “unnecessary sales unrelated to supply disruptions to strategically maintain volume. Reuters pointed out that last month the department rejected the first batch of bids from oil companies to sell back up to 3 million barrels to the reserve, saying it would only accept bids for oil meeting required specifications at a price that was a “good deal” for taxpayers. The administration had been seeking to repurchase oil for the stockpile at about $70 a barrel.
The other question is whether this oil is going to be exported to places like China. Right now, despite the fact that Fox Business Network pointed out that, “The Republican House recently passed a pair of bills putting conditions on future sales from the SPR, including a prohibition on selling SPR oil to the Chinese government or companies it controls, and a bill that would require the development of a plan to make more federal lands available for oil and gas leasing prior to a non-emergency drawdown of the SPR. The former passed with a broadly bipartisan vote of 331-97, while the latter advanced along party lines following a 220-205 vote. Yet the bill has not been signed and unless it is, more than likely, China will be a destination for this taxpayer-paid for oil. The other question is whether this oil is going to be sweet or sour. US refiners covet the supply of sour crude.
Yet for oil, they may shake off this attempt by Biden to lower gas prices if the Inflation data comes out weak. Market watch reports that the CPI data for January 2023 will be a key indicator for the market observers, analysts, investors and traders to gauge the level of price rise in the economy. The US Bureau of Labor Statistics (BLS) will release the January inflation numbers on February 14 at 8:30 A.M. Eastern Time. They point out that for the first time, a new approach is to be applied when generating January CPI data that will be reflected in US inflation figures. Beginning in 2023, the Bureau of Labor Statistics will change the method of calculating inflation data. The release of the January 2023 CPI data on Friday, February 14, 2023, will mark the start of the transition to yearly weights.
The title of the cable and satellite television service index is being changed to cable, satellite, and live streaming television service. The title of the video discs and other media, including rental of video index is being changed to purchase, subscription, and rental of video. The title of the rental of video discs and other media index is being changed to subscription and rental of video and video games. The title of the baby food index is being changed to baby food and formula.
Market Watch says that from 7.1% in November, the inflation fell to 6.5% in December and now the stock market investors expect the annual inflation to trend even lower as has been seen over the last few months. However, any negative surprise may spook the market sentiments. Meanwhile, Fed Chief Powell has been talking about ‘disinflation’ but the strong job market may play the spoilsport in Fed’s action plan. Fed officials remain hawkish and they have already pointed towards more rate hikes unless inflation is fully controlled and brought under target range of 2%.
US oil production may be rising but the production per well is plateauing. That is a concern for future prices. The EIA Rig Productivity Projection forecasts New Well oil production per rig at: 1,705 bpd for Bakken (vs 1,704 bpd month ago); 1,060 bpd for Permian (vs 1,061 bpd month ago); 1,469 bpd for Eagle Ford (vs 1,486 bpd month ago). EIA Projection: US total Shale regions oil production for March seen up about 74,000 bpd at 9.356 mln bpd (vs 81,000 bpd rise in February). EIA Projection: US Bakken oil production for March seen up 21,000 bpd at 1.199 mln bpd (vs 22,000 bpd rise in February).Bakken Crude output is due to rise in March to the highest since December 2020. IA Projection: US Eagle Ford oil production for March seen up 3,800 bpd at 1.18 mln bpd (vs 5,600 bpd rise in February) – EIA.
Eagle Ford crude output in March is due to rise to its highest since April 2020. EIA Projection: US Permian Basin oil production for march seen up 29,000 bpd at 5.682 mln bpd (vs 30,000 bpd rise in February).
To keep production rising in these basins the Biden administration had better change course or we are entering a new era of sky-high energy prices. Forget about the short term impact of this oil. The reality is that this oil will be soaked up quickly. This is not going to have the same impact the 180million barrel release had. And it only will add to our pain down the road.
Scott DiSavino of Reuters reported that, “Freeport LNG sought permission from federal regulators on Monday to restart commercial operations at its long-idled liquefied natural gas (LNG) export plant in Texas, a move that could soon provide the world with another much-needed source of the super-cooled fuel. The amount of gas flowing from U.S. pipelines to Freeport jumped on Monday to its highest since the facility was shut by a fire in June 2022 after the company restarted one of the plant’s three liquefaction trains, which turn gas into LNG for export.
Breaking OPEC says World oil demand will rise by 2.32 million bpd in 2023 (up 100,000 bpd from the previous forecast).
Read Full Story »»»
DiscoverGold
Corn Mixed For Day Session
By: Barchart | February 14, 2023
Corn futures are trading fractionally mixed to 2 cents higher following the overnight session. They ended Monday with contracts firm to 4 ½ cents higher. The nearby March was up the 4 ½. New Crop December added to the discount, only seeing a ¾ cent gain.
USDA’s weekly Export Inspections report showed 511,506 MT of corn was shipped during the week that ended 2/09. That was up from 494,000 MT last week but was well below the 1.46 MMT during the same week last year. Mexico was the top destination @ 297,817 MT. The season’s exports reached 13.06 MMT through February 9, which remains 35% behind last year's pace. Milo exports from the report reached 497,639 MT compared to 2.62 MMT during the same point last year.
AgRural estimates Brazil’s Corn planting is 25% complete on the second crop, lagging behind the 42% pace from last year.
USDA’s Ag Attache reduced their outlook for the Argentina corn crop to 45 MMT citing the drought. They showed that 35-40% of the early planted corn crop had serious damage and that the late planted corn is also showing some effects despite beneficial rain in late Jan – early Feb.
Read Full Story »»»
DiscoverGold
Soy Working Weaker Into Monday
By: Barchart | February 14, 2023
Soybeans are showing weakness so far, while BO is staying firm into the day session. Futures closed the Monday session on a stronger note, with contracts up ¼ to 6 ½ cents. The new crop months were the strongest, with Nov up 6 cents. Meal futures were $3.30 to 6.30 higher across the board, with March up $4.60. Soybean oil futures were the weak spot of the complex, with contracts down 33 to 47 points.
Weekly soybean exports were again an excellent 1.555 MMT according to the weekly inspections data. That was down from 1.915 MMT last week but was still larger than the 1.233 MMT shipped during the same week last year. China was the destination of 998,660 MT of the total. USDA also added 85k MT to past reports, bringing the season’s total to 39.540 MMT. That is 1.6% ahead of last year's pace.
Brazil’s soybean harvest was 17% finished according AgRural, trailing last year’s 24% pace.
Read Full Story »»»
DiscoverGold
Wheats Off Overnight Highs
By: Barchart | February 14, 2023
The wheat market is showing a mixed mostly higher but futures were working back towards break even so far on Tuesday. They closed out the Monday session higher. CBT SRW futures were up 1 ¼ to 6 cents across the board. KC wheat contracts were mostly steady to 3 ¼ cents higher at the close. Spring wheat futures settled with contracts firm to 2 cents in the green.
Weekly wheat exports were reported at 472,327 MT for the week of 2/09. That is 118k MT lower on the week, but is up 13k MT from the same week last year. HRW and HRS made up 70% of the week’s total. USDA also added 55k MT of shipments to past reports for a MY total of 14.286 MMT, now trailing last year by 1.5%.
The Texas state Crop Progress report showed that 11% of the state’s winter wheat crop was rated gd/ex as of February 12, down 2% on the week. That translates to a Brugler500 index of 231, 4 points lower vs. last week.
Read Full Story »»»
DiscoverGold
Cattle Were Higher Out Of The Weekend
By: Barchart | February 14, 2023
Live cattle posted fresh life of contract highs in the front months on Monday, with futures closing 57 cents to $1.15 higher. Cash has continued to remain firm, with last week’s trade around $160 to 161.
Feeder cattle futures were 45 cents to $1.02 higher to start the week. USDA’s OKC Feeder Cattle Auction review showed solid volume at 10.5k head, broken down with 44% heifers and with 40% over 600lbs. The CME Feeder Cattle Index was up 24 cents on 2/10 to $183.33.
Wholesale Boxed Beef prices were stronger in the pm report. Choice boxes were up 29 cents at $269.95, with Select $1.92 higher at $256.21. USDA estimated Monday’s FI cattle slaughter at 126,000 head. That is 6,000 head above last week and 4,000 head more than the same week last year.
Read Full Story »»»
DiscoverGold
Higher Monday From Hog Trade
By: Barchart | February 14, 2023
Lean hog futures found some fresh buying to start the week, with contracts up 37 cents to as much as $3.02 across the board. Front months led the way. Feb hogs expire today, and were down a nickel. USDA’s National Average Base Hog price for Monday afternoon was down $1.65 at $76.82. The 2/09 CME Lean Hog Index was up by 21 cents to $74.01.
Pork cutout futures were also up by triple digits past the Feb contract. USDA’s National Pork Carcass Cutout value was up 69 cents this afternoon at $81.74. USDA estimated FI hog slaughter for Monday at 485,000 head. That is 5,000 above the same day last week and 19,000 more than last year.
Read Full Story »»»
DiscoverGold
Front Month Cotton Futures Red Into Day Trade
By: Barchart | February 14, 2023
Cotton is trading down by 40 to 48 points so far. Front month cotton futures ended the first trade session of the new week with contracts up 7 to 37 points. March was the leader, up 37 points. Weakness out of the US Dollar index may have helped, as it was down 35 points on the session.
The Cotlook A index was 10 points higher on 2/10 to 100.85 cents/lb. The USDA AWP for cotton is 74.41 cents/lb this week through Thursday.
Read Full Story »»»
DiscoverGold
Corn Volatility
By: Barchart | February 14, 2023
Last week the CME corn curve traded mostly steady with the front and old crop contracts leading. The March’23 contract closed +$3.00/bu and May was +$2.75/bu. The fundamental data continues to show lackluster domestic demand and incrementally encouraging export orders.
Aside from a -25 mbu decline in corn used for ethanol, the February WASDE report on Wednesday did not present any material changes to the balance sheet that would alter the price projections for July or December corn futures. Brazilian corn production was unchanged at a record 125.0 mmt and raised exports by 3.0 mmt to a record 50.0 mmt. It was no surprise that Argentina production was reduced by 5.0 mmt to 47.5 mmt. The country’s exports fell by 5 mmt to 35.0 mmt. This would be the lowest harvest and export program since MY 17/18. On the surface, the weakening Argentina crop can present bullish undertones for US corn futures, but the 2.0 mmt increase in Ukraine exports is a bearish signal and a stark reminder that global end users have choices.
Historically, implied corn volatility starts to accelerate rate over the next two weeks , driven by growing uncertainty about the upcoming US planted acres, the size and marketability of corn produced in the southern hemisphere, pace of the US export program, US weather outlooks and US stocks. Currently, we see the global corn risk paradigm pointing to lower prices for MY 23/24 corn. While Ukraine will still command a geopolitical risk premium, we believe that owning volatility headed into the key market-moving data points in February and March can be advantageous.
Read Full Story »»»
DiscoverGold
I’m still liking Natgas and soybean oil here.
Today's Futures Heat Map • Strongest: Cocoa, Lean Hogs, Coffee, Pork Cutout
By: Barchart | February 13, 2023
• Today's Futures Heat Map
Strongest: Cocoa, Lean Hogs, Coffee, Pork Cutout
Weakest: Orange Juice, Natural Gas, Lumber, Sugar

Read Full Story »»»
DiscoverGold
Deliveries on Can$/Coffee/Crude
By: The PRICE Futures Group | February 13, 2023
• Tomorrow, Tues Feb 14th is Last Trading Day for Feb Canadian Dollar.
• Fri, Feb 17th is First Notice Day for Mar Coffee.
• Tues Feb 21st is Last Trading Day for Mar Crude.
Read Full Story »»»
DiscoverGold
Waiting On Inflation. The Energy Report
By: Phil Flynn | February 13, 2023
Oil prices are down to start the week on concerns that this week’s January consumer price index (CPI), which is set to be released at 8:30 am Eastern on Tuesday, may come in hotter than expected even after Federal Reserve Jerome Powell declared that “the disinflationary process” is underway. Yet a rebound in oil prices, strong jobs data, and an uptick in consumer confidence is raising concerns that the CPI will be too hot for the Fed to handle. Oil prices are ignoring geopolitical risks that seem to be rising every day that Biden is been in office. The market seems unconcerned that the US has had to shoot down objects in the sky violating US air space and even shot-down aviation over Lake Michigan which for me is getting too close to home.
Yet it is inflation data fears and a rising dollar that seems to be holding oil back. Yet the fundamental backdrop for oil is still very strong. Russia is cutting supply and OPEC says that the market is balanced.
Reuters is reporting that, “Russia’s seaborne oil product exports fell about 10% on Feb 1-12 from the same period in January due to the European Union’s embargo, the lack of available tankers, and the closure of ports due to storms, traders said and Refinitiv data showed.
Now it is being reported that the UAE Energy Minister H.E. Suhail Mohamed Al Mazrouei says that the oil market is balanced and that there is no need for an extraordinary OPEC+ meeting.
With oil producers restricting supply and demand on the rise, we will see a supply squeeze. In simple terms, with China reopening, we will see more demand and from Russia and OPEC the same or less supply which is bullish. We expect to see supplies of crude tighten. Refiners in maintenance should mean that we will have a hard time building up product supply.
Can natural gas find a bottom? The natural gas market is a classic riches-to-rags story. Soaring late last year on fears of shortages became a story of supply. A historically warm winter along with the shutdown of the Freeports LNG export facility changed the dynamics. Now could things finally be bottoming? Scott Disavino of Reuters reported Friday that Freeport LNG’s long-idled liquefied natural gas (LNG) export plant in Texas was on track to start receiving small amounts of natural gas from pipelines on Wednesday after receiving no gas on Tuesday, Refinitiv Eikon data showed. The restarting of Freeport could help cut into the oversupply. Yet will the regulators let the recovery continue? Reuters reported that, “Texas residents grilled U.S. energy regulators on Saturday over their supervision of liquefied natural gas processing plants at a meeting to discuss conditions at the fire-idled Freeport LNG plant. When fully running, Freeport LNG processes about 2 billion cubic feet per day of natural gas and exports up to 15 million tonnes of LNG per year. Its progress toward reopening is closely watched because of the impact on U.S. natural gas prices.”
Naureen Malik of Bloomberg reports that the operator of the largest US grid should scrap its method of using the threat of fines to ensure power plants are available to operate in any weather and instead require them to have backup fuel, the watchdog for the system says. The independent monitor for the 13-state grid stretching from New Jersey to Illinois said in a report Friday that plans to issue up to $2 billion in fines to power plants that couldn’t supply the grid on Dec. 23-24 “was a failed experiment.” “There is no reason that in a rational market design, two cold days would result in a crisis,” Monitoring Analytics, the independent market monitor of PJM, said Friday in a report. The watchdog recommends scrapping the penalties. Instead, generators should be required to demonstrate on a weekly basis that they have the ability to burn an alternative fuel, like a gas plant having the ability to burn oil; access to more than one gas pipeline; or on-site fuel storage, according to the report. PJM has sent generators preliminary estimates for their share of the penalties, and final bills will be issued on April 7, according to a notice Friday.
Read Full Story »»»
DiscoverGold
Technically and fundamentally, I really like $Natgas right here.
Wheat Has Lift Off!
By: Barchart | February 11, 2023
Come on down to Enid Brewing Company for Kansas City BBQ sandwiches and Philly cheesesteaks! And then bring her back for Valentine’s Day on Tuesday for a steak dinner and bottle of wine, sangria or one of our many craft beers. It will seem as if you really didplan it in advance…
It was an exciting end to the week in the grain markets. After Wednesday’s largely uneventful monthly USDA WASDE and Crop Production reports, grains gave back most of the week’s gains up to that point. And then just as we looked set for more profit taking, we had lift off in Friday’s session.
Though seldom the case, wheat contracts led the way starting with Kansas City and followed by Chicago. While March KC wheat traded above end of December highs on Wednesday, deferred months only did so on Friday. This March contract traded AND closed above the 100-day moving average to finish the week. Chicago and KC contracts closed only 4 cents off session highs with July KC new crop closing just above $8.82, only 8 cents shy of the 100-day moving average. I have been targeting this level for protection of new crop bushels.
While I still think that to be the case, returning tensions in the Black Sea region could provoke short covering among managed funds in the wheat market and accelerate a rally. Weather-wise, the high probability of rains in the US plains wheat belt in the 6-10 and 11-15 day forecasts should put downward pressure on the market. However, the precarious nature of large net shorts in a market combined with the frothy nature of geopolitical headliners particularly from war games could see the news of welcome rains take a back seat.
I recently discovered a small, quarter cent gap on the July KC chart up at $10.12 ¾. This will likely take some time to get there, but we should see that gap eventually filled before this contract expires.
As we approach the one-year anniversary of Russia’s initial attack on the Ukraine, it is said that a major offensive is soon to bear down on the eastern part of the country. Russia announced Friday that they would cut oil production by five percent, which sent oil prices surging. Grain commodities soon followed after Russians were said to have taken over major water reservoirs used for agriculture, drinking water and Europe’s largest nuclear plant.
The oil production cut was announced by a deputy prime minister and Russia’s point man on energy, saying that the cuts would “contribute to the restoration of market relations.” This seems to suggest that the resulting rebound in oil prices following the announcement was just the outcome Russia was targeting given sanctions and the recent $60 per barrel price cap.
The USDA increased 2022/23 ending stocks for US corn and soybeans that also came in above average trade guesses. Ending stocks for US wheat came in one million bushels above USDA’s previous figure, but 10 million bushels below average trade guesses. World ending stocks came in slightly above expectations for wheat and beans, but below for corn.
Perhaps the notable surprise, if any, were reductions in Brazil corn and soybeans versus expectations although unchanged from USDA’s previous figures and reductions in Argentine corn and soybeans well below last month and expectations. Brazil soybean exports were increased by 1.0 million metric tonnes while corn was increased by 3.0 MMT that largely offset Argentina’s soybean export reduction of 1.5 MMT and corn of 3.0 MMT. Returning dryness in Argentina and rains in Brazil have brought support back to soybean futures. Brazil soybean harvest has been slowed by rains and is slightly behind average, but well behind last year as is the planting of the safrinha corn planting. China imports of corn and soybeans were unchanged while wheat imports were increased by 0.5 MMT.
Russia wheat production for last year was increased by 1.0 MMT and exports by 0.5 MMT. This came as news of Russia’s current wheat production is expected to be well below last year’s record production. India’s continued flip flop in wheat trade emerged again this week with news that the wheat export ban is now expected to extend for another year due to surging domestic prices. This should continue to be a supportive factor on the international front until soon-to-be harvested new crop is in the bin that was this week said to be less than expected.
US grain exports have been more active in recent weeks. Export sales for wheat and corn will be of particular support given the lackluster year up until recently. The US dollar index will be key to this and rallied last week in conjunction with the Federal Reserve interest rate increase.
The cattle market started out the week strong, but faded as the week progressed in light of higher grains. Cash trade was slow to develop for fats this week, but managed to post $160 in Texas and Kansas on Friday. This should be supportive in next weeks trade. Higher corn should translate to higher fat cattle prices, but serve as a headwind for feeders.
While key moving averages remain well below on the feeder charts, I still think these contracts have support with the potential for March feeders to fill the gap at $190.600. We first have to break through the double top around $188.700. Strength in the equity market will be needed to get feeder contracts to this level and so relief in corn strength.
For the time being, it looks as if corn strength will be more a function of wheat strength that its own. As we approach planting in the northern hemisphere, weather will play a key role. If spring planting weather cooperates, I believe we will see an increase in intended corn acres. If this materializes, we could see weakness in new crop corn futures and some upward momentum in feeder cattle. December corn futures have not been able to hold above the 50-day moving average since last November and continues to face strong resistance at the now $5.96-level.
As international tensions rise and grain markets increase in volatility, be cautious in overextending your risk exposure due to overall bullish sentiments as headlines can and will move these markets quickly. Profits can be exhausted in short order among higher costs of feed and interest. Price protection through April and May is now quite reasonable given shorter time value.
Give me a call for strategies to trade these key events coming up before year’s end and get a plan for 2023. If you’re ready to trade commodity markets, give me a call at (580) 232-2272 or stop by my office to get your account set up and discuss risk management and marketing solutions to pursue your objectives. Self-trading accounts are also available. It is never too late to start and there is no operation too small to get a risk management and marketing plan in place.
Read Full Story »»»
DiscoverGold
Coffee: Between a Rock and a Hard Place
By: Investing.com | February 10, 2023
Short-term bullish factors propped up coffee futures of both major blends on Tuesday, February 7. Still, traders and importers should be aware of the transitory nature of these factors, as the overall supply-plus-stocks/demand equation suggest further prices' downslope.
Coffee prices have been edging moderately higher lately. March Arabica coffee (KCH23) this week was up +0.71%, and Mar ICE (NYSE:ICE) Robusta coffee (RMH23) was up a whopping +1.91%. In contrast, on CME, May Arabica coffee KCc2 fell 1.4% to $1.7470 per pound. Dealers said a run-up to a 3-month high of $1.84 a week ago had lost momentum, and prices could fall further in the short term. Coffee's technical indicators suggested lower price levels, but to confirm that outlook, the market needed to close below the 10-day moving average of $1.7331.
Smaller coffee exports from Colombia were considered bullish in many dedicated media articles – at least, for Arabica prices – after the Colombia Coffee Growers Federation reported that Colombia January coffee exports fell -19% YoY to 835,000 bags. All in all, coffee exports from Colombia have been declining recently as Colombia's 2022 coffee exports fell -8% YoY to 11.1 mln bags. Important to note: Colombia is the world's second-largest producer of Arabica coffee beans.
Another supportive factor for Arabica prices was heavy rainfall in Minas Gerais, Brazil's largest Arabica growing region, which keeps farmers out of fields and delayed applying fertilizers and pesticides. Also, the heavy rain has led to an increase in coffee rust in some trees. Brazil's Somar Meteorologia reported that Brazil's Minas Gerais region was soaked with 81.3 mm of rain last week, or 116% of the historical average. Important to note: Minas Gerais accounts for about 30% of Brazil's arabica crop.
Nevertheless, other resources suggest Arabica coffee prices can actually post an annual drop to the tune of 12% in 2023, with a large crop in top producer Brazil expected to generally lead to a global coffee surplus in the 2023/24 season going forward.
The Brazilian Institute of Geography and Statistics (IBGE) said on Wednesday Brazil's 2023 coffee crop is forecast to rise by 5.7% to 55.5 million 60kg bags. Brazil's Arabica production alternates years of high and lower volumes. The harsh frosts in 2021 changed that pattern since they hurt the 2022/23 crop, which should have been a 'one-year' in the cycle.
Summary of Outlook
Brazil's coffee crop in 2023/24 was forecast to climb to 67.1 million 60 kg bags, up from a median estimate of 61.5 million bags for the 2022/23 crop. Comexim estimates that Brazil's arabica coffee production will grow 15.8% in 2023/24 versus the previous crop to 41.3 million bags, while it sees Robusta coffee output growing only 1.3% to 22.7 million bags.
Top robusta producer Vietnam was forecast to have a crop of 31 million bags in 2023/24, up from 30 million in 2022/23.
Larger crops in Brazil and Vietnam led to a global surplus of 3.35 million bags in 2023/24 compared with a deficit of 4.15 million in 2022/23, according to the poll's median forecasts.
Read Full Story »»»
DiscoverGold
Orange Juice Record a Boon to Speculators, Curse to Industry
By: Investing.com | February 10, 2023
- Frozen concentrated orange juice futures hit record highs at $2.67 a pound, could breach $3
- Florida’s oranges see multi whammy of storms, frost, “crop greening” and realty land grab
- After skyrocketing egg prices, consumers might find distaste for rallying orange juice
- Further retail price spikes could still be avoided with the help of Brazilian imports
Six dollars for a dozen didn’t kill the egg industry. But $3 a lb could do a lot of damage to orange juice.
Frozen concentrated orange juice futures — which determines shelf prices for the citrusy beverage — hit record highs of $2.67 a pound on New York’s InterContinental Exchange on Thursday.
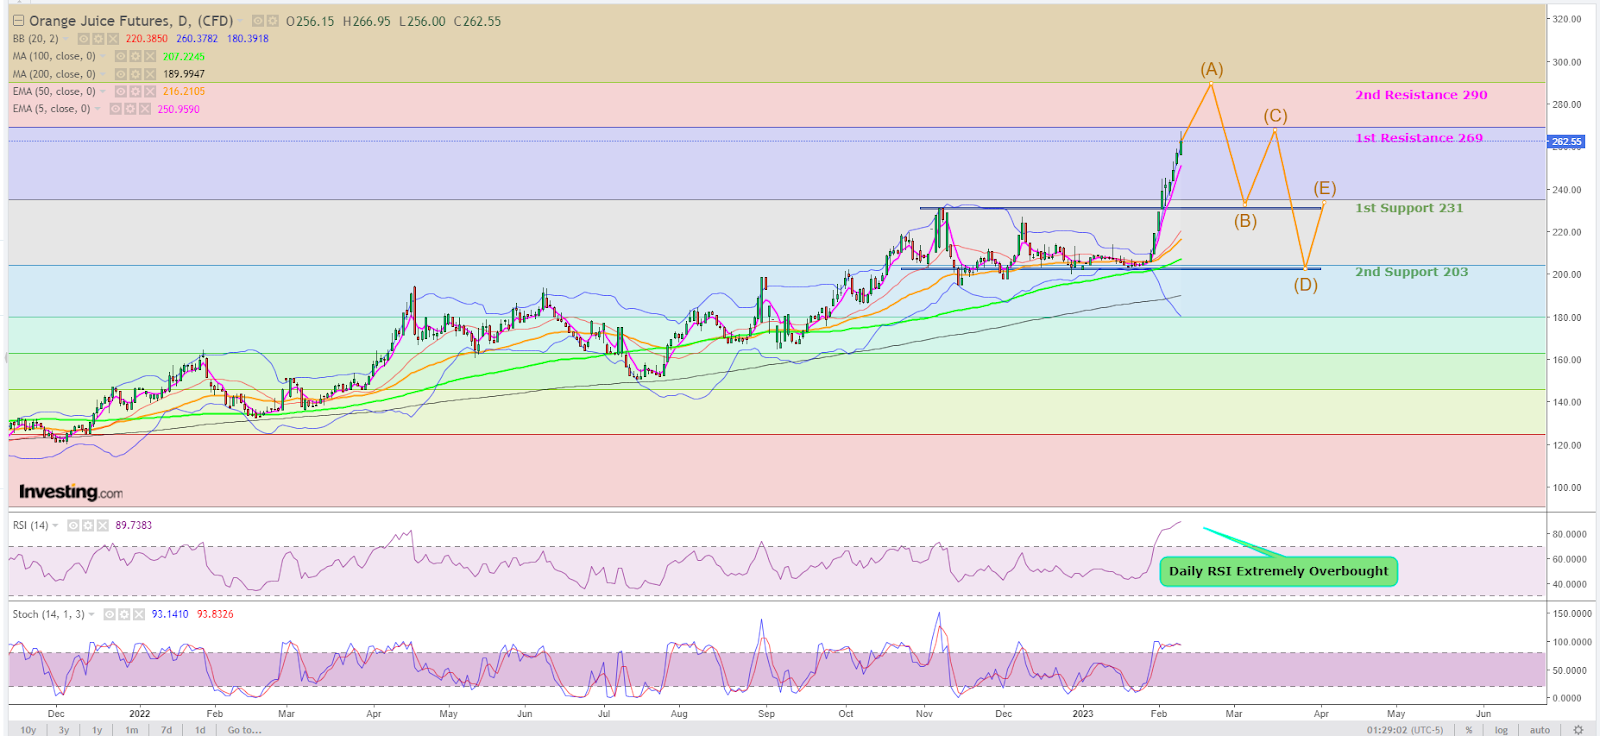
FCOJ Daily Chart
Charts by SKCharting.com, with data powered by Investing.com
The so-called FCOJ market has had this coming for a while. Two back-to-back hurricanes last year devastated the crop, while frost from each cold season retards fruit growth. Besides these, a tough-to-fight ?plant disease called “citrus greening,” along with aggressive residential development, helped swallow acres and acres of groves in the top orange-growing state of Florida.
The impact of all these is likely to be more upward pricing pressure that could be a boon to FCOJ speculators but a curse to orange growers, as well as juice processors and merchandisers, say those who follow both the futures trade and retail juice industry.
For now, the peak in futures pricing may have just started despite the market being extremely overbought, said Sunil Kumar Dixit, chief technical strategist at SKCharting.com. He adds:
“At a reading of 89, FCOJ’s Daily RSI, or Relative Strength Index, is highly stretched and calling for a correction towards the first support area of $2.31, followed by $2.03.
At the same time, resistance is seen at $2.69. If that breaks, it could be followed by a breach into $2.90. The simple matter of fact is that orange juice futures are trading in uncharted territory. Thus, there is room for establishing a new high further before signs for a liquidation appear. The downward move could be identified by price action that closes below the 5-Day EMA, or Exponential Moving Average, of $2.50.”
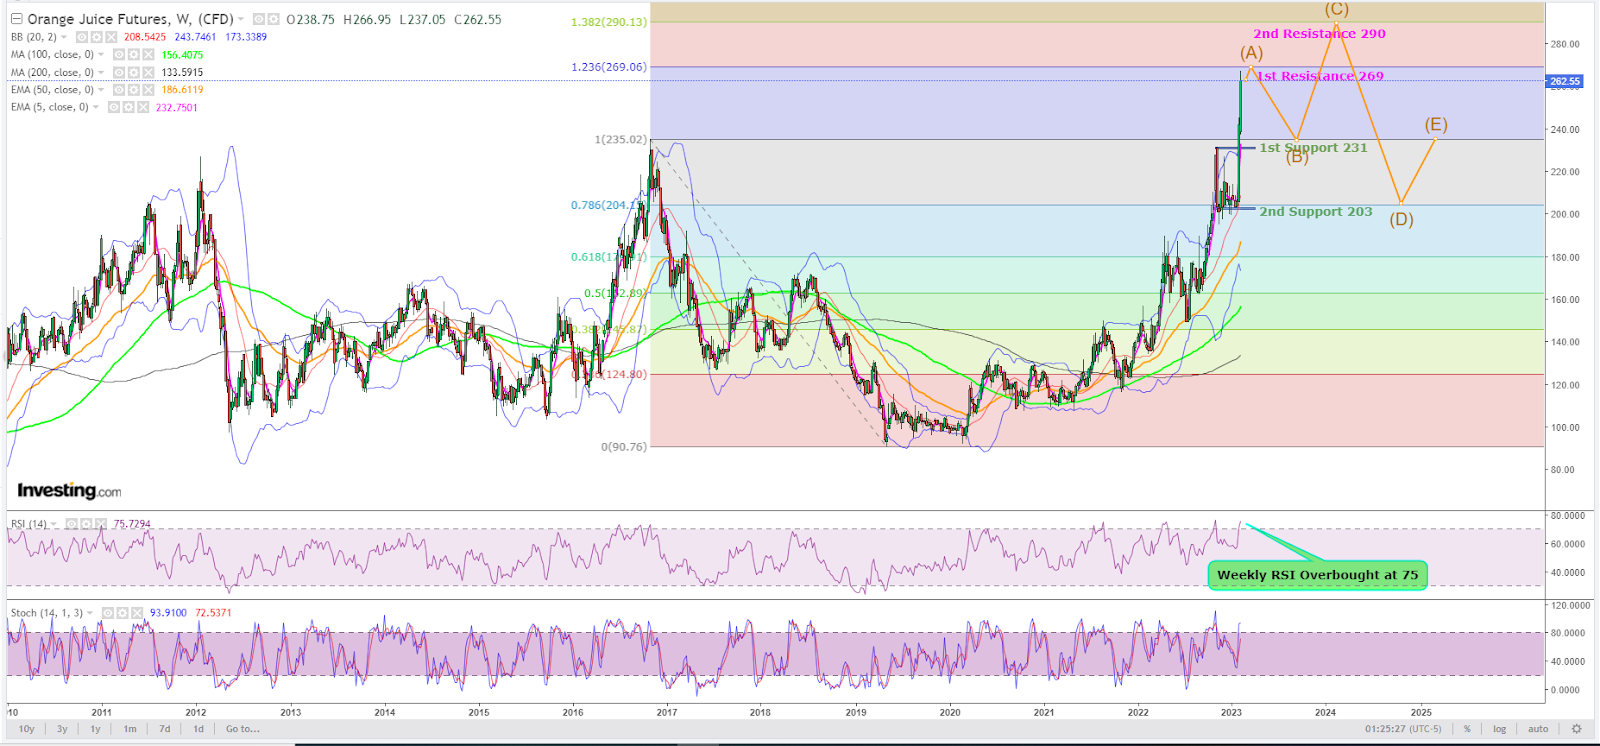
FCOJ Weekly Chart
A Market Gone Parabolic
Sterling Smith, director of agricultural research at AgriSompo North America in Omaha, Nebraska, said the FJOC market “has simply gone parabolic”. He adds:
“It can lead to a lot of volatility and we could see some downdraft. But this being orange juice, it’s not the most liquid commodity. Seeing it trade north of $3 a lb would not in any way surprise me.”
So far this year, orange juice futures have risen 30%, ending Thursday with a 12-day winning streak. That’s the longest stretch in the green for the market since 1967, according to Bloomberg data. Compared with a year ago, FCOJ is up 87%, when it traded at around $1.40 per pound.
Orange juice became the world’s favorite fruit drink and a commodity due to processing, freezing, and flavoring agents. While there are other orange juice products, FCOJ is the asset used to benchmark orange juice pricing and is also the most widely traded.
But Florida’s orange production is in a dire state now, having plummeted more than 90% from the peak of the late 1990s. As supply falls and prices rise, demand for orange juice will likely also take a hit, as consumers tend to be less willing to shell out the big bucks for the citrusy beverage than, say, coffee.
Consumers have already shown their distaste for costly eggs this year after an avian flu outbreak, and the mass culling of layer hens caused prices to triple from around $2 a dozen to above $6. “Consumer demand for shell eggs continues to track lower and is below average and below the levels recorded a year ago,” the U.S. Department of Agriculture, or USDA, said in an outlook released last week.
Forecasters at the U.S. Department of Agriculture estimated that this year’s orange crop would fall to its lowest level since the 1930s after Hurricane Ian dealt extensive damage to orange groves across Florida last year, followed by Hurricane Nicole. Florida’s farmers were still recovering from the devastation wrought by Hurricane Irma in 2017 before the latest storms struck.
According to the USDA, Florida orange production will slump 61% in 2023 to 16 million boxes. The total U.S. orange harvest is expected to fall 23% to 63 million boxes. The boxes can vary in weight but are typically measured as 90 pounds to one box. In 1998, Florida produced as many as 244 million boxes.
The higher raw cost of juice could weigh on the bottom line of companies such as PepsiCo (NASDAQ:PEP), which makes the Tropicana brand of orange juice, and Coca-Cola (NYSE:KO), which produces Simply orange, pressuring them to pass the higher cost onto consumers.
Said Smith:
“I suspect if you’re an orange juice provider, you’re not going to want to raise prices. You’re trying to avoid, in fact, from anything that brings attention to food inflation. But much like eggs, when you kill 40 million chickens, the price of eggs is going to go up. What’s going on with FCOJ is invariably going to reflect itself in the store price, and that’ll be something that will again hurt consumption.”
A Staple That’s Turned Into Luxury
U.S. consumption of juice has already fallen exponentially over the past two decades after doubling from 800 million gallons in 1970 to 1.6 billion in 2000. In 2019, per capita, juice consumption was at 2.25 gallons, down 40% from 2010. But in the mind of the average American, orange juice is still a breakfast drink that’s on almost every table — a myth that hasn’t helped nurture enough concern for the embattled industry in Florida.
Adds Smith:
“In COVID times, people were looking for healthier foods, so OJ got a bit of a boost. Since then, it has lost so much market share to vitamin-and-energy drinks. Orange juice is not really a breakfast staple anymore. It’s become a luxury.
Also, avoiding carbohydrates became a big thing in 2000, and orange juice went off the table. What happens is you have kids who grow up not drinking orange juice; they become adults who don’t buy orange juice. If you had a five-year-old in 2000, that kid’s 28 now. When he has kids of his own, those habits are going to get passed on. When you go to the grocery store, you can see how little shelf space is devoted to OJ compared to the vitamin waters, the soda pop and the coffee creamers. It’s just something that’s falling well out of favor.”
The only thing that has kept U.S. orange juice production — and prices — constant are imports from Brazil, the world’s largest citrus grower.
“Brazil has some rain, and conditions are rated good,” said Jack Scoville, chief crop analyst at Price Futures Group in Chicago. Compared with the crop decimation in Florida, Brazilian FCOJ production is forecast to drop only 1% from the prior year to reach 1.12 million metric tons in 2022–23.
Smith concurs about the bumper agriculture production in Florida this year.
“All the crops there are doing magnificently. They’ve had good weather for everything from sugar to coffee and oranges."
He concludes:
"Look, the price of OJ is going to become elevated; there’s no question about that. The question is how much Brazilian imports can offset that.”
Read Full Story »»»
DiscoverGold
Until this article, I had not been familiar with 23 and 80 month MA's. Thanks.
Grains Report: Wheat, Rice, Corn and Oats, Soybeans
By: Jack Scoville | February 10, 2023
• WHEAT
General Comments: Wheat markets were a little lower yesterday in response to the USDA export sales reports that showed weak demand once again. USDA in its WASDE reports released on Wednesday made only minor changes to the demand data and ending stocks were increased by just one million bushels. Trends are sideways in all three markets on the daily and weekly charts. Ideas are that both Australia and Russia are harvesting record to near record Wheat crops this year. Russia is said to be plotting a huge new invasion of Ukraine that could prevent farmers in Ukraine from harvesting Whet and planting Corn. Russia has a large production and is undercutting most world prices in the international market. However, Russian production estimates have dropped recently. The demand for US Wheat in international markets has been a disappointment all year and has been hindered by low prices and aggressive offers from Russia. Ukraine is also looking for new business for its crops and Russia is aggressive in the world market as it looks for cash to fund the war.
Overnight News: The southern Great Plains should get scattered showers in the southeastern areas. Temperatures should average near to above normal. Northern areas should see mostly dry conditions. Temperatures will average above normal. The Canadian Prairies should see mostly dry conditions. Temperatures should average above normal.
Chart Analysis: Trends in Chicago are mixed, Support is at 742, 729, and 721 March, with resistance at 767, 776, and 784 March. Trends in Kansas City are mixed to up with objectives of 910 March. Support is at 866, 859, and 850 March, with resistance at 901, 915, and 925 March. Trends in Minneapolis are mixed. Support is at 912, 907, and 897 March, and resistance is at 932, 935, and 942 March.
• RICE:
General Comments: Rice was higher yesterday in response to the USDA reports from Wednesday and the weekly export sales report that showed much improved sales on Thursday. The market had expected reductions in demand and increases in ending stocks. That is what they got, but not at levels big enough to keep the selling pressure on so the market rallied in a major way. Demand has been an issue for the market all year. There is not much going on in the domestic market right now although mills are milling for the domestic market in Arkansas and are bidding for some Rice and although some Rice moved in Tein quiet trading at what were called very good prices. Demand in general has been slow to moderate for Rice for exports and solid for domestic uses.
Overnight News: The Delta should get mostly dry conditions. Temperatures should be below normal.
Chart Analysis: Trends are up with no objectives. Support is at 1776, 1760, and 1746 March and resistance is at 1814, 1825, and 1836 March.
• CORN AND OATS
General Comments: Corn and Oats closed lower yesterday despite another week of positive export sales as shown in the USDA reports released Thursday. On Wednesday, USDA cut demand by 25 million bushels and added to ending stocks estimates that are now at 1.267 billion bushels. USDA cut ethanol demand and increased ending stocks for Corn by 25 million bushels. There had been fears of a cut to export demand and a larger increase in ending stocks estimates, but USDA chose to hold off on any export demand changes for now. Both markets remain in up trends established in early December although the short term trend in both is now sideways. The export demand was solid last week even though demand remains well behind the pace to make USDA objectives. Brazil has been hanging on for its Summer crop although losses are now being reported. Argentina has suffered through some extreme drought and losses could be large. The Brazil Winter crop is harvested and China is buying the surplus. The Summer crop and the Argentine crop is developing under stressful conditions. The next Winter crop is going into the ground in good conditions, but it has been wet so the Soybeans harvest has been delayed and the Corn planting is becoming delayed as well. There are concerns about demand with the Chinese economic problems caused by the lockdowns creating the possibility of less demand as South America has much better crops this year to compete with the US for sales. China is now moving rapidly to open the economy and allow people to move around with no lockdowns so the demand could start to improve
Overnight News:
Chart Analysis: Trends in Corn are mixed. Support is at 672, 669, and 666 March, and resistance is at 682, 686, and 689 March. Trends in Oats are mixed. Support is at 377, 372, and 363 March, and resistance is at 389, 392, and 399 March.
• SOYBEANS
General Comments: Soybeans and the products were lower yesterday on weaker than expected export sales, especially for Soybeans. Soybean Meal saw strong sales as Argentina is having to withdraw from the market for Soy products sales due to the drought in the country and the fact that they have already sold a lot of Soybeans into the world market. They are now buying from Brazil. USDA cut domestic demand and increased ending stocks on Wednesday which was a small surprise for the market. But it was not real bearish so the market embarked on a sell the rumor and buy the fact type of trade. USDA left Brazil production estimates unchanged but cut back on production estimates for Argentina. The pattern in southern Brazil and Argentina is dry again. The harvest in Brazil is slowly expanding in central and northern areas. These areas have seen too much rain and the harvest has been slow. Production potential for the Brazil is called very strong even with potential problems and losses in the south. Even so, production of less than 150 million tons is possible now although most estimates remain near 153 million tons. Argentine production ideas continue to drop with the drought as planting is delayed and the crops already in the ground are stressed. Production estimates are now closer to 435 million tons. Ideas that Chinese demand will improve, but this could take a few more weeks as a very large part of the population now has Covid. This has delayed a robust economic return for the country.
Overnight News:
Chart Analysis: Trends in Soybeans are mixed. Support is at 1506, 1503, and 1487 March, and resistance is at 1540, 1544, and 1548 March. Trends in Soybean Meal are mixed. Support is at 488.00, 478.00, and 472.00 March, and resistance is at 500.00, 502.00, and 505.00 March. Trends in Soybean Oil are mixed. Support is at 5840, 5720, and 5600 March, with resistance at 6010, 6150, and 6240 March.
Read Full Story »»»
DiscoverGold
Deliveries on Currencies/London Sugar/Can$
By: The PRICE Futures Group | February 10, 2023
• Mon Feb 13th is Last Trading Day for Feb Currencies and March London Sugar.
• Tues Feb 14th is Last Trading Day for Feb Canadian Dollar.
Read Full Story »»»
DiscoverGold
Softs Report: Cotton, OJ, Coffee, Sugar, Cocoa
By: Jack Scoville | February 10, 2023
• COTTON
General Comments: Cotton was lower mixed in directionless trading and still remains inside the trading range created since the beginning of November. The market recovered much of its losses after the WASDE report weas released. WASDE showed less domestic use and an increase in ending stocks to 230,000 bales. World data showed less production to help futures recover from the lows. Futures still appear destined to trade down to the bottom of that range at about 8000 March. Futures are still showing bad demand fundamentals as the weekly export sales reports have shown moderate sales at best. Sales were moderate in the reports released yesterday. Overall, the demand for US Cotton has not been strong although better demand has developed over the last couple of weeks. Some ideas that demand could soon increase as China could start to open its economy in the next couple of months as Covid outbreaks should start to weaken as people get vaccinated or immune. Covid is now widespread in China so the beneficial economic effects of the opening are being delayed but these effects should start to be felt as the people there achieve immunity over the next few weeks.
Overnight News: The Delta will get isolated to scattered showers and above normal temperatures. The Southeast will see scattered showers and above normal temperatures. Texas will have mostly dry conditions and near to below normal temperatures. The USDA average price is now 83.32 ct/lb. ICE said that certified stocks are now 1,147 bales, from 8,900 bales yesterday. USDA said that weekly net Upland Cotton expot sales were 262,800 bales this year and 4,800 bales next year. Net Pima sales were 1,300 bales this year and 0 bales next year.
Chart Trends: Trends in Cotton are mixed. Support is at 83.10, 82.00, and 81.30 March, with resistance of 87.00, 87.50 and 88.90 March.
• FCOJ
General Comments: FCOJ was higher again yesterday and closed at new highs for the move. The moves were supported by a new round of USDA production reports released on Wednesday. The reports showed that Florida produced only 16 million boxes of Oranges this year. Florida oranges are the main food stock for the FCOJ processors. Chart trends are up on the daily and weekly charts. Demand should start to improve as the northern Winter passes by. Historically low estimates of production due in part to the hurricanes and in part to the greening disease that have hurt production, but conditions are significantly better now with scattered showers and moderate temperatures. The weather remains generally good for production around the world for the next crop including production areas in Florida that have been impacted in a big way by the two storms seen previously in the state. Brazil has some rain and conditions are rated good.
Overnight News: Florida should get mostly dry conditions. Temperatures will average above normal. Brazil should get scattered showers and near normal temperatures.
Chart Trends: Trends in FCOJ are up with no objectives. Support is at 257.00, 251.00, and 245.00 March, with resistance at 271.00, 277.00, and 283.00 March.
DJ Retail OJ Prices Surge to New Record — Market Talk
0926 ET – Retail orange juice prices have reached a new record-high, according to data from Nielsen. Average price rose to $8.78 a gallon, which is up 3.1% from Nielsen’s previous assessment and a record high. The uptick in retail OJ prices comes as futures prices have surged in recent days, finding new record highs in reaction to the USDA pegging Florida orange production at 16 million boxes in the 2022/23 marketing year — down from roughly 41 million boxes last year. However, FCOJ futures on the ICE are down 3.8% this morning. If they close down, then it’ll be the first time in the past 13 trading sessions that FCOJ futures have dropped — with some traders pointing out that orange crops in other countries like Brazil are robust. (kirk.maltais@wsj.com; @kirkmaltais)
• COFFEE
General Comments: New York and London closed lower again yesterday. Price trends are sideways on the charts, but both markets show the potential to work lower into next week. Ideas of big production for Brazil continue due primarily to rains falling in Coffee production areas now and as offers stayed strong from Brazil and increasingly from Vietnam. Vietnam is estimated to have veery good production this year due to a good growing season and less rain now as harvest expands again. There are ideas that production potential for Brazil had been overrated. The weather in Brazil is currently very good for production potential but worse conditions seen earlier in the growing cycle hurt the overall production prospects as did bad weather last year.
Overnight News: ICE certified stocks are lower today at 0.880 million bags. The ICO daily average price is now 172.50 ct/lb. Brazil will get isolated showers in northern areas with near to above normal temperatures. Central America will get scattered showers. Vietnam will see scattered showers.
Chart Trends: Trends in New York are mixed to up with objectives of 204.00 and 237.00 March. Support is at 170.00, 167.00, and 165.00 March, and resistance is at 178.00, 184.00 and 186.00 March. Trends in London are mixed to up with no objectives. Support is at 2020, 2000, and 1970 March, and resistance is at 2110, 2120, and 2150 March.
DJ Brazil Coffee Exports Fell 16.8% in January, Cecafe Says
By Jeffrey T. Lewis
SÃO PAULO–Brazilian coffee exports fell in January amid scant reserves from previous crops and reluctance by farmers to sell their remaining stocks, according to exporters group Cecafe.
The South American country exported 2.8 million 132-pound bags of coffee last month, a decline of 16.8% from the same month a year earlier, Cecafe said Thursday. From a year ago, sales abroad of the arabica variety of coffee dropped 18.7%, to 2.4 million bags, while exports of robusta beans fell 12.3%, to 87,584 bags.
Exports of ground, roast and soluble coffee fell 0.6% from a year ago, to 322,506 bags, Cecafe said.
The crops of 2021 and 2022 were both hit by bad weather that reduced output, leaving less beans available for sale ahead of this year’s harvest, said Cecafe President Marcio Ferreira.
“We are in the off-season, after two smaller harvests that were impacted by strongly adverse weather in the last few years. There is also still some resistance on the part of producers to sell their 2022 harvest stock at the current price,” which has fallen significantly since October, Mr. Ferreira said.
• SUGAR
General Comments: New York and London closed higher again yesterday and trends are turning up on the daily charts. Ideas are that the market has priced in production losses in India and is providing renumeration for Indian and Thai exporters who want to sell. Ideas of better supplies coming might keep futures prices in check even with a rather tight nearby scenario. Good production prospects are seen for crops in central and northern areas of Brazil, but the south should turn dry again and so should some northern areas. The harvest is active in Thailand. Australia and Central America harvests are also active. Mills in Brazil are shutting down now with the majority of the harvest now complete and processed.
Overnight News: Brazil will get scattered showers. Temperatures should average near to above normal. India will get mostly dry conditions and near to above normal temperatures. ICE NY said that 98 notices were post4ed against March futures for Sugar 16 contracts
Chart Trends: Trends in New York are mixed to up with objectives of 2150 and 2200 March. Support is at 2130, 2100, and 2050 March and resistance is at 2190, 2220, and 2250 March. Trends in London are mixed to up with objectives of 603.00 and 692.00 March. Support is at 569.00, 555.00, and 547.00 March and resistance is at 574.00, 579.00, and 583.00 March.
DJ Brazil Center-South Mills Crushed 307,300 Tons of Sugar Cane in 2H January
By Jeffrey T. Lewis
SAO PAULO–Brazilian sugar mills in the country’s center-south region continued to operate in the second half of January after crushing no cane in the same period a year earlier, according to industry group Unica.
Center-south mills crushed 307,300 metric tons of cane in the period, Unica said Friday. They produced 17,000 tons of sugar, after producing none a year earlier, and made 213.1 million liters of ethanol, an increase of 30%.
The production mix for the second half of January was 43.1% sugar to 56.9% ethanol, compared with 100% ethanol in the same period a year ago.
The center-south accounts for about 90% of Brazil’s sugarcane production. Bad weather limited the amount of cane available for processing in 2021 and early 2022, so mills in the center-south closed earlier than normal a year ago.
In the period from April 1 through Jan. 31, mills in the region crushed 542.4 million tons of cane, up 3.8% from the same period a year earlier. Sugar production rose 4.5%, to 33.5 million tons, and ethanol output climbed 3.5%, to 27.9 billion liters.
The production mix for the season through Jan. 31 was 45.9% sugar to 54.1% ethanol, compared with 45% sugar and 55% ethanol in the same period a year earlier.
• COCOA
General Comments: New York closed a little lower and London closed lower yesterday with currency considerations most important. Both markets show that futures are starting to turn down from mostly a range trade, with London leading the way down. Talk is that hot and dry conditions reported in Ivory Coast could curtail mid crop production, but main crop production ideas are strong. Ghana has reported a disease in its Cocoa to hurt production potential there. The rest of West Africa appears to be in good condition. The North American grind was 8.1% lower and the EU and Asian grinds were about 2% lower. Good production is reported for the main crop and traders are worried about the world economy moving forward and how that could affect demand. Supplies of Cocoa are large at ports. The weather is good in Southeast Asia.
Overnight News: Mostly dry conditions are forecast for West Africa. Temperatures will be near normal. Malaysia and Indonesia should see scattered showers. Temperatures should average near normal. Brazil will get scattered showers and near to above normal temperatures. ICE certified stocks are higher today at 4.952 million bags.
Chart Trends: Trends in New York are mixed to down with objectives of 2470, 2460, and 2420 March. Support is at 2540, 2510, and 2490 March, with resistance at 2630, 2650, and 2670 March. Trends in London are mixed. Support is at 1950, 1930, and 1880 March, with resistance at 2010, 2030, and 2050 March.
Read Full Story »»»
DiscoverGold
Doubts In Corn Marketplace. The Corn & Ethanol Report
By: Daniel Flynn | February 10, 2023
We kickoff the day with Michigan Consumer Sentiment Prel, Michigan 5-Year Inflation Expectations Prel, Michigan Consumer Expectations Prel, Michigan Current Conditions Prel, and Michigan Inflation Expectations Prel at 9:00 A.M., Fed Waller Speech at 11:30 A.M., Baker Hughes Oil & Total Rig Count at 12;00 P.M., Monthly Budget Statement at 1:00 P.M., and Fed Harker Speech at 3:00 P.M.
On the Corn Front the market traded lackluster and sold off on the close and made new lows after Wednesday’s reports. Weak export markets continue to cast doubts on the market. The March contract had an outside day down, closing at its lowest level in 3-weeks. China was the largest buyer of Brazilian corn in Jan 23 with 985 thousand tons. Brazilian corn bought by China will now exceed 2.1 million tons since approving from the South American country in November The USDA WASDE report raised Brazil export forecast to 50 mmt surpassing the US 48.9 mmt. With corn settling 8 cents lower. We may see sideways volatile moves ahead of the acreage forecast data. In the overnight electronic session the March corn is currently trading at 670 ¼ which is a ½ of a cent lower. The trading range has been 671 ¼ to 669 ¼.
On the Ethanol Front Midwest lawmakers ask Biden to make ethanol-heavy fuel available year round. Dozens of bipartisan lawmakers representing Midwestern states continue to call on the Biden administration to permit the ethanol-heavy fuel. The demand centers around E15, the fuel blend that contains 15% ethanol that has long been subject to restrictions on its sale during the summer months. Last year, amid spiraling gas prices following Russia’s invasion of Ukraine, the Biden administration issued a waiver suspending the federal rule that prevents such sales. Eight Midwestern governors have petitioned the Environmental Protection Agency (EPA) to permanently end the seasonal limitations. In a letter yesterday, 10 senators and 21 House members representing both parties called EPA Administrator Michael Regan to grant the request. The Clean Air Act allows the EPA to waive some fuel blending restrictions. The governors first made the request in Mid-2022. This story should have some more twists as we gear up for the 2023 travel season. There were no trades or open interest in ethanol futures.
Read Full Story »»»
DiscoverGold
Russian Rage and Revenge. The Energy Report
By: Phil Flynn | February 10, 2023
Russia is showing its rage against the world by unleashing one of the biggest missile barrages against Ukraine since the beginning of the war and by announcing a 500,0000 barrel-a-day oil production cut. They are threatening not to sell oil to any country involved in the EU price cap.
As reports surfaced that Russia launched the biggest wave of missile strikes in weeks and one of the largest since the war began, Russia’s Deputy PM Novak announced that Russia would cut oil production by 500,000 barrels a day starting in March and OPEC said they would not make up the difference. Russia’s Novak said he did not consult OPEC about the production but that statement is probably an attempt to give the cartel some political cover saying that they are not supporting Russia but just staying the course on previously agreed-upon production levels.
Yet Russia’s Novak didn’t stop with just an oil production cut. Mr. Novak made a threat that Russia will not sell oil to those who directly or indirectly adhere to the price cap. Mr. Novak correctly said that the price caps interfere with market relations and may lead to cuts in investment in the oil sector and oil shortages.
Novak also warned, in what could be a veiled threat, that the price caps could be applied to other global economic sectors. That could be a threat to grain and perhaps platinum and palladium that the Biden administration will need in its push for electric cars. Russia is the world’s top producer of palladium and the world’s second-largest producer of platinum.
There is also a threat that Russia’s aggressive attitude could block Ukrainian grain exports in what will be a much smaller Ukrainian crop.
The reports caused oil to spike over $80 and open up the door for a test of $84. Oil products also should see bottoming action off of this move. If there were not some demand concerns based upon recent US data showing rising inventories all year, the move would have been larger. We think that when US inventories start falling, as we predict that they will soon, then we will see the longer-term impact of the Russian cut.
The other headwind was the dollar. It popped as we saw a bit of risk aversion. There is also a possibility that the Biden administration may react by releasing more oil from the SPR. Of course, that will only kick the can down the road and raise the risk later in the year.
Natural gas is also desperately seeking the bottom. Reports that the Freeport LNG terminal is giving permission to resume some ship loading may be a reason for optimism but a reason for pessimism is weather should be above normal. I sure wish that the back-month natural gas options had some open interest.
Read Full Story »»»
DiscoverGold
Today's Futures Heat Map direction • Strongest: Soybean Meal, Natural Gas, Orange Juice, Sugar
By: Barchart | February 9, 2023
• Today's Futures Heat Map
Strongest: Soybean Meal, Natural Gas, Orange Juice, Sugar
Weakest: Lumber, Platinum, Soybean Oil, Heating Oil

Read Full Story »»»
DiscoverGold
The Corn & Ethanol Report
By: Jack Scoville | February 9, 2023
We kickoff the day with Export Sales, Initial Jobless Claims, Jobless Claims 4-Week Average, and Continuing Jobless Claims at 7:30 A.M., EIA Natural Gas Stocks at 9:30 A.M., 4-Week & 8-Week Bill Auction at 10:30 A.M., and 30-Year Bond Auction at 12:00 P.M.
On the Corn Front yesterday’s USDA & WASDE data were not a complete surprise. Exports were down and Brazil unseats the US as the top global corn exporter. The USDA made sweeping cuts to 2022/23 Argentine corn and soybeans production that caused global ending stocks for both crops tighten the WASDE report. The USDA’s downward revisions were higher than the market had been anticipating, but any potential bullish price action was largely offset cuts to US corn and soybean usage for ethanol and crush processing, respectively. In the overnight electronic session the March corn is currently trading at 677 ½ which is 1 cent lower. The trading range has been 679 ¾ to 675 ¼.
On the Ethanol Front production and stocks were down on the week. The US Energy Information Administration (EIA) said production averaged 1 million barrels a day, 28,000 on the week as major indicators pointed to slower demand. That was up 6,000 barrels a day on the year. The domestic ethanol supply was reported at 24.417 million barrels, a decrease of 25,000 from the previous week and 382,000 below a year ago. The USDA expects 5.25 billion bushels of corn to be used for ethanol production this marketing season, 50 million in January. There were no trades in ethanol futures.
Analysts expect draws in the EIA Natural Gas Stocks 198 bcf.
Read Full Story »»»
DiscoverGold
|
Followers
|
89
|
Posters
|
|
|
Posts (Today)
|
1
|
Posts (Total)
|
8936
|
|
Created
|
05/01/07
|
Type
|
Free
|
| Moderators DiscoverGold Pro-Life | |||
- The Commodity Bull is Running... Inflation is Running... Harder Living (i.e. FOOD, CLOTHING, SHELTER) is Dead Ahead... -
- Commodity Futures Trading -
http://finviz.com/futures_performance.ashx
All Commodity Futures Charts From Finbiz.com Available Below:
Daily
Weekly
Monthly
Quarterly
6 Months
12 Months
YTD
2 Years
5 Years
Max
Beneficial Educational Resources on Futures TradingThe futures market is volatile, and it cuts both ways. Leverage that makes it profitable can also ruin reckless, undisciplined traders overnight. Most brokers have paper trading available on their platforms, so those who are new to futures should take advantage and learn with these tools before going live with real money. Mitigate risk with stop loss orders at all times, and cut losses quickly instead of adding contracts and attempting to flip your way out of a losing position. Also, use mini instruments when available, with lower margin requirements, until you have sufficient capital to buy and sell more expensive contracts. Even though the potential is there, don't try to make too many profits at once. If things aren't going well, often times quitting for the day and collecting one's thoughts is the best decision. New opportunities come along daily. Markets are open nearly 24 hours, so set a schedule and stick to it. Avoid trading while tired or distracted, and please don't listen to the advice of others. Do research on fundamentals affecting markets as well as paying attention to TA. Watch key indices, and listen to accurate, real-time news during the session to stay aware of shifting trends. Trade smart, trade safely, and have fun.
Videos on Futureshttps://www.youtube.com/playlist?list=PL9A5C5A93D243CA44 Continuous Improvement in Progress |
Commodity Futures Trading
https://www.tdameritrade.com/investment-products/futures-trading.page
| Volume | |
| Day Range: | |
| Bid Price | |
| Ask Price | |
| Last Trade Time: |


