 News
News  Market Data
  Discover
Support: 888-992-3836
Copyright © 2023 InvestorsHub Inc.


Register for free to join our community of investors and share your ideas. You will also get access to streaming quotes, interactive charts, trades, portfolio, live options flow and more tools.
You're kicking a dead horse. For local slobbering "players" the only allocation strategy is to find a red hot play, marry it, plunge in 100%, and pump it to fellow members of the unwashed masses. If if drops, average down. And down.
That way the lottery-like effect remains undiluted by sensible diversification.
>>> Buffett: 'I would disagree quite violently' with notion that passive investing is dead
By Dhara SinghReporter
Yahoo Money
May 5, 2020
https://finance.yahoo.com/news/buffett-i-would-disagree-quite-violently-with-notion-that-passive-investing-is-dead-202620430.html
Despite the stock market volatility in recent months set off by the coronavirus pandemic, the Oracle of Omaha declared passive investing isn’t dead.
Warren Buffett stood by his defense of index funds, which are mutual funds that track market indices, such as the Standard & Poor’s 500 index. These investments aren’t actively traded by a wealth manager.
“If you say the day of investing in America is over, I would disagree quite violently,” Buffett said during the 2020 Berkshire Hathaway Annual Shareholders meeting. “There’s something special about index funds.”
He remains so passionate about index funds that it’s a key component of his estate planning.
“Well I can tell you I haven’t changed my will and it directs that my widow would have 90% of the funds in index funds,” Buffett said. “I think it’s better advice than people are generally getting from people that are paid a lot to give advice.”
‘I know which side is going to win over time’
Buffett extolled the low fees offered by index funds along with their profitable performance. He also alluded to some financial advisors who focus more on selling investments than seeing them grow.
“One side has high fees and they think they can pick out stocks and the other side has low fees,” Buffett said. “I know which side is going to win over time.”
A recent study by Index Fund Advisors, an investment firm that showed that just two of Vanguard's actively managed funds could outperform the market.
While he said not all advisors don’t know what they’re doing, he cautioned investors to understand that many are sales-driven.
“You’re dealing with an industry where it pays to be a great salesperson,” Buffett said. “There’s a lot more money in selling than in actually managing, if you look into the essence of investment management.”
<<<
>>> The Retirement ‘Bucket Strategy’ Didn’t Leak During the Worst of the Crash, Because It’s Heavy on Cash
Barron's
By Gail MarksJarvis
April 19, 2020
https://www.barrons.com/articles/the-retirement-bucket-strategy-didnt-leak-during-the-worst-of-the-crash-because-its-heavy-on-cash-51587297601
Reta Lancaster worries a lot that she or her husband, Richard, will be stricken by the new coronavirus. But the retired Indianapolis couple haven’t had a moment’s worry about paying their bills.
The couple, who spent careers in teaching and nonprofits, proved to themselves during two bear markets since 2000 that a large cash stash and what’s known as a “bucket strategy” would get them through the cruelest of markets. And it seems to be working again during the market’s abrupt turn from near record highs to a nearly 35% drop at one point in recent weeks.
“We really are feeling fortunate,” said the 88-year-old Reta, contrasting her peace of mind with retirees whose savings have been savaged during the coronavirus crisis.
A typical iteration of the Lancasters’ strategy includes three buckets designed to give retirees long-term growth potential as well as a stash of cash and liquid investments that can be drawn upon for living expenses and as a bulwark from having to sell stocks in a market downturn.
In the first bucket, a retiree typically has at least two years of cash for any expenses no matter what the stock market does.
A second bucket, containing primarily bonds, provides another safeguard—a stash to get through a stock-market beating as Treasuries typically act as a haven when equities are tumbling. As time goes on, bond income via interest or through maturity replenishes cash that’s been spent from the first bucket.
The third bucket is key: This is where stocks go to provide more long-term growth than bonds or cash, while also potentially yielding cash dividends for use in the first bucket. When a market downturn comes, however, this bucket can be left untouched until stocks rebound.
Christine Benz, director of personal finance for Morningstar, examined the impact of the market tumult on a prototypical bucket strategy in late March. Her conclusion: The third bucket made up of stocks was awful, but that was to be expected. The second bucket of bonds, which are supposed to be relatively safe, had been hit with some “worrisome” losses.
But investors were pacified by their cash, Benz said. “Now is the bucket portfolio’s time to shine. It’s giving people comfort,” she said, and keeping people from bailing out of deep losses on the riskier stock investments they will need over time.
Benz contrasts this volatile period with times when stocks are steadily climbing. During long rising markets, Benz said, investors look at stock gains and question why they should keep two years of cash out of stocks and bonds. Some studies have questioned the strategy, too, because sizable cash stashes can deprive retirees of the growth they need to make portfolios last for 20 or 30 years.
What’s more, bonds have provided meager income in recent years and haven’t always performed as expected during recent downturns. In 2018, bonds were a disappointment and in March, safe Treasuries fell along with stocks at a certain point although they have been cushioning stock losses recently.
“The long-held belief that bonds give you a hedge against a fall in stocks is not always true,” said Patrick Leary, head of trading for InCapital.
While the bucket approach is used by many financial planners, the design of the buckets varies. Some financial planners in the first bucket want cash to last three years in case a long bear market occurs. Others are satisfied with one year. Advisors differ on investment choices, too: Some stick to federally insured savings accounts and certificates of deposit for cash, while some take on a little more risk with money-market funds and short-term bond funds.
“We really are feeling fortunate. ”
— Reta Lancaster, 88, on how the “bucket strategy” has given her and her husband peace of mind during the market crash
In the second bucket, bonds and bond funds are key because they replenish cash as retirees spend the money they originally had stashed away in bucket one. But there is no universal prescription. Advisors usually pick a mixture of bond types, but some lean toward safe U.S. Treasury bonds and top-quality corporates, while others try to boost income with larger exposures to riskier corporate bonds and small allocations of dividend-paying stocks.
This second bucket has been a particular thorn in recent years for many financial planners, who say they have been struggling to hold relatively safe bonds that will provide enough income to replenish the cash retirees need. Ten-year Treasuries, for instance, were recently yielding around 0.70%, compared with 1.6% early this year.
Yet higher-yielding bonds—everything from corporate bonds, to floating rate bank loans, mortgages and municipal bonds—have been dicey as the coronavirus crisis has pummeled the economy. For example, the iShares iBoxx $ Investment Grade Corporate Bond ETF (LQD), lost 21% between March 6 and March 19.
Meanwhile, financial planners say they are sticking with well-diversified portfolios and the security their clients have from large amounts of cash to ride out the coronavirus lockdown.
“Most people have 10 or more years to ride out the storm, and during that time money comes to them virtually every month,” said Marc Hadley, the Lancasters’ financial planner.
If this crisis goes on long enough, though, Long Island financial planner Larry Heller said he might need to suggest some clients reduce their spending. That happened in the financial crisis as the market fell 57% and people panicked and demanded an escape from stocks.
Yet retirees appear positioned well and no one has asked him to sell stocks, Heller says. “They get a check every month so they don’t worry,” he said. “They can sleep.”
<<<
>>> BlackRock Becomes Key Player in Crisis Response for Trump and the Fed
Bloomberg
By Annie Massa
April 17, 2020
President sought advice from Larry Fink in coronavirus fallout
World’s largest asset manager also helped in ‘08 crisis
https://www.bloomberg.com/news/articles/2020-04-17/blackrock-takes-center-stage-with-trump-seeking-to-calm-markets?srnd=premium
As President Donald Trump grappled with the coronavirus outbreak last month, he boasted at a press conference of tapping a secret weapon for advice: Larry Fink.
The chief executive of BlackRock Inc. provided insight to Trump on coping with the fallout from the pandemic -- and once again put his firm at center of a white-hot economic emergency.
BlackRock is no stranger to stepping in during a financial crisis cleanup. It played a similar role in 2008. But back then, it was a smaller firm with a focus on fixed income, closer to Pacific Investment Management Co., which had renowned money managers Mohamed El-Erian and Bill Gross at the helm.
More than a decade later, the investing landscape has shifted. BlackRock has a premiere role in helping the Federal Reserve stabilize markets. The central bank has hired the firm to help manage its economic relief efforts. Beyond U.S. borders, the Bank of Canada has called on the asset manager as it shapes its response to the meltdown.
BlackRock’s government connections reflect the dominance it has achieved in the asset management arena since the last financial crisis. It became the world’s largest asset manager with $6.5 trillion in assets -- a size and breadth that make the firm an essential player on Wall Street, in Washington, and beyond.
That may be an advantage amid the current tumult. “The companies that are going to come out in better shape are going to be the big businesses,” said Greggory Warren, an analyst at Morningstar Inc.
Financial crises can mark inflection points in investor preferences. After 2008, inexpensive index-based investing took off, buoying BlackRock, which holds about two-thirds of its assets in passive funds. Scale allows a massive firm like BlackRock or competitor Vanguard Group Inc. to offer prices that were once unheard of in the industry. Think U.S. stock-tracking funds that cost a few cents for every $100 invested.
“The one thing that rules in this world is cheap,” said Eric Balchunas, an analyst at Bloomberg Intelligence.
The economic recession following the 2008 crash helped set that tone. In the trenches of that contraction, investors became more comfortable using exchange-traded funds, which are tethered to indexes and can be bought or sold at any time in the trading day. Those funds hold about $4 trillion in the U.S., compared to about $531 billion in 2008, according to data compiled by Bloomberg.
BlackRock owes much of its dominance to a well-timed bet on those products. The firm got its start as a bond-focused shop, and had about $1.3 trillion in assets at the end of 2008. Today it is a formidable giant, overseeing about five times that sum. BlackRock first moved into ETFs with its purchase of Barclays Global Investors in 2009, a defining moment in the company’s history. The British bank sold the prized unit after rejecting U.K. government bailout money.
Moving into passive investing put BlackRock’s growth “on steroids,” Warren said. It is the world’s largest global issuer of ETFs today.
BlackRock’s government advisory business also cemented some crucial relationships in the fallout from 2008. BlackRock scored mandates to manage portfolios of toxic assets from Bear Stearns Cos. and American International Group Inc., playing to Fink’s roots in structuring mortgage-backed securities.
Today, BlackRock’s role is even more expansive. The Fed enlisted the New York-based firm to shepherd three debt buying programs. Canada’s central bank is bringing in BlackRock as an adviser in purchases of commercial paper, a form of short-term debt companies use to fund day-to-day expenses like payroll.
Beyond Covid-19-related mandates, the firm also won a contract to help incorporate sustainability into the European Union banking system.
“I do believe it’s going to continue to bring opportunities for us,” Fink said on an earnings call on Thursday, referring to BlackRock’s government assignments. He added he’s “very proud of” such work.
Another giant located across the country, Pimco, is reprising a role it played in the 2008 financial crisis too. The Fed once again called on Pimco as the investment manager for its purchases of commercial paper.
The Newport Beach, California-based firm oversaw $1.8 trillion at the end of the first quarter. In the intervening years since the last financial collapse, it has stuck to its original ethos as an active fixed income investment company.
Along with the rest of the active fund management industry, Pimco faced some challenges in an era when belief in star fund managers began to fade. One of the most dramatic examples of that arc was investing legend Bill Gross.
Gross, Pimco’s former chief investment officer, founded the Pimco Total Return Fund in 1987 and turned it into a behemoth. The fund had almost $300 billion in assets at its peak in 2013, and generated annualized returns of 7.8% from inception through his last day.
But when Gross left for Janus Henderson Group Plc in September 2014, an investor exodus followed. The fund suffered total redemptions of more than $100 billion in the 12 months after he departed.
Pimco spokesman Michael Reid responded to a request for comment on Gross by pointing to remarks from Morningstar analyst Eric Jacobson. “The firm didn’t flinch,” Jacobson said. “Pimco managed to keep performance competitive or better in most cases despite the outflows.”
“As an active manager, Pimco’s defensive positioning and liquidity management enabled us to navigate unprecedented market volatility,” Reid said in a statement. “We now see some extremely attractive long-term value in higher-quality segments of the investment-grade credit and mortgage markets as well as in more resilient areas of emerging markets.”
Gross was also known for his discursive investor letters that touched on topics like his dead cat and the eroticism of sneezing. In recent years, Fink’s annual missives have attracted similarly broad industry attention, albeit with a more staid style.
Proponents of active management argue that the industry gains additional edge in times of volatility. Though cheap index funds are easy to love when markets rise, active managers say they’re better suited to pick through the rubble after a downturn. (BlackRock has significant resources in active funds of its own, with $1.8 trillion in such strategies.)
Size and ties to governments put firms like BlackRock and Pimco, which is owned by German insurance giant Allianz SE, on stronger footing as the world navigates the unprecedented changes brought by the pandemic, said John Morley, a Yale University Law School professor who studies the regulation and structure of investment funds.
“The small asset managers may not have the resources to weather the storm,” he said.
<<<
Here is where the 're-entry' funds will be invested if anyone is interested -
Broad Market ETF (double weight this)
High Dividend ETF
Utilities ETF
Consumer Staples ETF
REIT ETF
Info Tech ETF
Energy ETF (not to keep forever)
Gold ETF (to supplement the 10% already in bullion)
>>> A $33 Billion ETF Sees Most Cash in 18 Years on Fed-Fueled Rally
Bloomberg
By Katherine Greifeld
March 25, 2020
https://www.bloomberg.com/news/articles/2020-03-25/a-33-billion-etf-sees-most-cash-in-18-years-on-fed-fueled-rally?srnd=premium
LQD on track for best week ever after $1.5 billion inflows
Fed signaled ‘unlimited firepower’ for bond markets: Tannuzzo
The Federal Reserve’s planned foray into the corporate-bond market has exchange-traded fund investors rushing in at a breakneck pace.
Investors poured a record $1.5 billion into the iShares iBoxx $ Investment Grade Corporate Bond ETF on Tuesday, following a $1 billion influx on Monday, according to data compiled by Bloomberg. The back-to-back inflows have put the $33 billion LQD on track for its best week on record after the U.S. central bank said it would begin buying corporate bonds and certain credit ETFs.
The Fed’s pledge of support and a $2 trillion stimulus deal have eased corporate default fears after the coronavirus outbreak reignited solvency concerns. Now, investors are racing to get ahead of the central bank’s purchases. LQD has rallied for four consecutive sessions and posted its biggest gain since 2008 on Monday after the Fed announced its plans.
“Signaling that they have unlimited firepower is huge for the market,” said Gene Tannuzzo, a Columbia Threadneedle portfolio manager. “The investment-grade market offers the best risk-adjusted return right now.”
LQD sees biggest inflow ever as high-grade bonds rally
The U.S. central bank said Monday that it would create a Secondary Market Corporate Credit Facility, one of several new measures aimed at cushioning the economic blow from the coronavirus. The terms of the facility allow for the purchase of up to 10% of an issuer’s outstanding bonds and up to 20% of the assets of any ETF “whose investment objective is to provide broad exposure to the market for U.S. investment grade corporate bonds,” a primer accompanying the Fed action said.
The Fed’s involvement is also helping to restore order to credit ETFs, Tannuzzo said. LQD’s share priced has climbed nearly 3% higher than the value of its underlying assets -- the fund’s biggest premium since 2009. Last week, it slumped to a discount of 5% relative to the presumptive value of its bond holdings.
While policy makers have committed to being the “broker of last resort” for U.S. corporations, uncertainty over the virus’ economic fallout will limit the rally in high-grade bonds, according to Janney Montgomery Scott LLC’s Guy LeBas.
“Now that the liquidity floor is in place, that should support valuations to a point, but I doubt spreads return to pre-February levels for some time,” said LeBas, chief fixed income strategist. “Pricing credit is a very imprecise exercise right now given the unprecedented nature of the economic downturn.”
<<<
>>> Utilities Plunge: Making Sense Of The Sector's Big Decline
Seeking Alpha
Mar. 23, 2020
by Ian Bezek
https://seekingalpha.com/article/4333697-utilities-plunge-making-sense-of-sectors-big-decline
Summary
Utility stocks dropped nearly 20% between last Tuesday and last Friday.
This has to be concerning to investors that bought these stocks as strong defensive plays.
There are two factors that could hurt utility profitability going forward.
The sector offers fine yields, but isn't compelling yet aside from the income.
This idea was discussed in more depth with members of my private investing community, Ian's Insider Corner. Get started today »
This article was highlighted for PRO subscribers, Seeking Alpha's service for professional investors. Find out how you can get the best content on Seeking Alpha here.
Last week, the Utility Select Sector SPDR (XLU) sector got utterly smashed. From Tuesday's high onward, the XLU ETF lost 18% of its value. I don't recall these names ever getting hit this badly, even in 2008. It's simply been an incredible drop, with the sector giving back 5 years of gains in a little over a month:
Even more incredibly, if you go way back, XLU was trading for $43 prior to the financial crisis. Thus it's only gone up 10% over the past 13 years, with all other returns coming from dividends. Even farther back, XLU traded for as much as $34 in the year 2000, meaning that the ETF is up only 40% over the past 20 years. Of course, with dividends, things look a lot better. Still, it's a stunning turn of events for a sector that had looked unstoppable over the past two years. On a longer-term chart, you can see that XLU is rapidly threatening to breach price levels from more than a decade ago:
What can we take away from this? For one, utilities have reverted to form - they're simply not a great (nor particularly bad) industry historically. Over the past 82 years (data through 2015) utilities were the median sector, coming in 15th out of 30 in the market, producing essentially market-matching returns:
That table comes from this article, where I discussed this data in much more detail. The fundamental return is calculated based on the real annual growth of dividends over the past eight decades.
As for the question of utilities being defensive, though their stock prices suddenly gave way last week, the companies are still favorable ones to hold in an economic downturn. But investors were using them to play offense throughout 2019, hoping that falling interest rates would lead to sustained higher valuation ratios for the sector. In theory, that's probably still a reasonable hypothesis; reliable dividend streams are worth a lot more in a zero interest rate world.
In the short-run, however, above average valuation ratios become their own risk factor. When people are getting margin calls, or simply wanting to shift funds into more beaten-up names, they're going to sell the stuff where they are still showing a profit. Defensive assets can turn into a source of funds during a panic; even gold (GLD) started selling off at the height of the market panic. Simply put, people will get funds in the short-term wherever they can find them.
Over the long-haul, however, utilities should remain a defensive sector. Thus, is now the time to be buying as prices have come in dramatically? In some cases, yes. A lot of individual utility stocks have come down a great deal in March. That said, before you get too aggressive with your purchases, here are a couple of things to keep in mind.
Potential Issues: Declining Demand, Declining Returns On Equity
Interestingly, there's been (at least that I've seen) little discussion of the economic impact of the current situation on utility companies. Sure, some folks are considering the possibility of the government stopping utilities from collecting on past due clients for the duration of the crisis. That could hurt a bit on a marginal basis.
But zoom out. If the economy grinds to a halt for a few months, what happens to electricity usage? Over in the oil market, traders have quickly reacted to the slowdown by absolutely slamming the price of crude, and its refined products such as gasoline. Oil is more sensitive to the economy than electricity, as oil is the dominate transportation fuel. Most electricity uses, by contrast, aren't greatly impacted by a near-term economic slowdown.
Still, it probably isn't reasonable to think that electricity demand will remain steady. What do we have for data? I haven't seen much yet, but I did run across this interesting data point on New York City electricity usage. There's a ton of caveats here, as it's just one city, the weather could be a factor, and so on. But there appears to be a sharp rollover that started in the week of March 16th:
Historically, we can also look back to 2000 and 2009. Interestingly, due to rises in efficiency, electricity usage per person has pretty much stopped going up in the U.S. - it peaked in 2000 and has gone no higher:
Looking at the data, we can see there was a noticeable decline between 2000 and 2001, in some part likely due to the overall economic slowdown and then also specifically the sizable drop-off in economic activity immediately following the 9/11 attacks.
Moving forward, from 2008 to 2009, electricity consumption per capita dropped from 13,663kWh to 12,914. The effect was particularly harsh in the first quarter of 2009, when the economy and stock market were still heading downward. For that quarter, Power Magazine reported that residential electricity consumption was down 2.5%, commercial consumption was down 4.7%, and industrial consumption was down by fully 13.8%.
We should expect as much of a decline, and probably significantly more in the near-term, in 2020. Residential usage may actually go up a touch, as people spend far more time at home. That said, the marginal electricity use from staying at home probably isn't that high, many high-impact uses such as heating and appliances aren't going to change too much.
Meanwhile, commercial use is going to get pummeled. In 2009, stores had less activity, but there wasn't a mass government-ordered shutdown. You had malls with few shoppers, but not malls that were locked up with everything turned off inside as we have now. Similarly, industrial use will plummet for the length of the shutdown, as non-essential factories simply won't operate.
Longer-term, there's also the question of authorized returns on equity "ROE". Utilities tend to bargain with states and localities to earn a set rate on their capital investments. These ROE targets are a balance that should give utilities sufficient incentive to invest in needed services and provide safe and reliable operations for consumers. On the other hand, the locality has an obvious incentive to keep the utility from price gouging. These ROE targets are a well-known feature of the industry - here's a table by S&P from 2017, for example, showing this process in action:
There are now two factors working against utilities going forward. For one, with the economy hurting, look for states to be tougher at the negotiating table. When times are tough, there's less slack to be had overall. Second, the lower interest rates for longer environment is going to drag down the overall "fair" ROE target as time goes on. In a world where a utility's capital costs, say, 5%, a 10% ROE might make sense. But if the utility can now get capital at half that, the state or locality is likely to want a chunk of that savings as well. At the end of the day, utilities are regulated businesses, and as such, they aren't going to get the full benefits of favorable market-pricing developments.
As I showed above, historically utilities have been an average industry, doing no better or worse than the market as a whole. And after their recent sell-off, many individual utility stocks are back to more normal valuations, though they're by no means "cheap" yet.
Should you buy some? They're still one of the safest income sources around, no doubt, and the current yields have moved up nicely. For longer-term investors, however, you can surely find more attractive stocks that are much more deeply-discounted at the moment.
<<<
Fwiw, started nibbling today, and will be using a re-balancing plan to get the stock allocation back up to 25%, and eventually up to 30% or 33% over the next 10 weeks. The basic idea is to add equal amounts daily to these 4 categories until the allocation goal is reached. I figure a systematic approach reduces the timing risk, and reduces the emotional aspects. Plus, if you are buying every day, you don't mind when the prices drop -
A) Broad Market (VOO, IVV, ITOT, VTI)
B) High Dividend (VYM, SCHD, HDV)
C) Utility (XLU, VPU, FUTY)
D) Consumer Staples (VDC, XLP, FSTA)
For my own account I'll probably add in a few additional categories -
E) Cloud Computing (SKYY, CLOU, WCLD)
F) Energy (XLE, VDE)
G) Alternate Energy (PZD)
>>> High-Grade Bond-Fund Outflows Hit $35.6 Billion, Smashing Record
Bloomberg
By Claire Boston, Olivia Raimonde, and Alex Harris
March 19, 2020
https://www.bloomberg.com/news/articles/2020-03-19/investors-pull-record-35-6-billion-from-investment-grade-debt?srnd=premium
Withdrawal dwarfs second-largest outflow of $7.3 billion
Record $249 billion added to government money-market funds
Investors withdrew an unprecedented $35.6 billion from U.S. funds that buy up investment-grade debt this week as the global market rout from the spreading coronavirus intensified. At the same time, a record $249 billion poured into U.S. government money-market funds.
The withdrawals from corporate high-grade debt blow through the previous record $7.3 billion outflow from last week, according to Refinitiv Lipper. Funds that buy junk bonds lost $2.9 billion in the five business days ended March 18, while leveraged loan investors withdrew about $3.5 billion.
Credit markets had another volatile week amid a worldwide meltdown in risk assets. Risk premiums on investment-grade bonds reached levels not seen since the financial crisis, while junk bond yields breached 10% for the first time in more than eight years.
”The number is off the charts, but so is the magnitude of this market correction,” Dorian Garay, a portfolio manager at NN Investment Partners, said in reference to the investment-grade bond outflows.
Despite the turmoil, investment-grade companies including Walt Disney Co. and PepsiCo Inc. seized moments of relative calm to issue new debt. Many firms selling bonds this week were doing so to reduce their reliance on the commercial paper market, where prices have risen rapidly amid a broad market seize-up. Lipper fund flow data covers investment-grade funds that manage about $1.3 trillion in assets.
“The flows into IG have been so steady over the past eight years, that it was like the farmer coming with a daily handful of grain to feed the turkey in the back yard,” said Gregory Staples, head of fixed income at DWS Investment Management. “Today what the farmer had in his hand was an axe.”
Investment-grade bonds are poised for another one of the largest weekly losses on record as spreads widen to crisis levels. The three most recent daily outflows from high-grade funds and exchange-traded funds are the largest on record, Bank of America Corp. strategists led by Hans Mikkelsen said in a report Wednesday.
Money-Market Funds
The Federal Reserve stepped in on Tuesday, announcing that it would reintroduce the Commercial Paper Funding Facility, a measure it used during the financial crisis to shore up short-term funding markets.
Total assets in government money-market funds rose to an all-time high of $3.09 trillion in the week ended March 18, according to Investment Company Institute data that stretches back to 2007.
The prior weekly inflows record of $176 billion was set in September 2008 during the financial crisis caused by the collapse of Lehman Brothers.
Prime money-market funds, which tend to invest in higher-risk assets such as commercial paper, saw outflows of $85.4 billion, the largest move since October 2016, according to ICI. Total assets fell to $713 billion.
<<<
Some vehicles (ETFs) to re-enter the stock market in the weeks/months ahead -
A) Broad Market (VOO, IVV, ITOT, VTI)
B) High Dividend (VYM, SCHD, HDV)
C) Utility (XLU, VPU, FUTY)
D) Consumer Staples (VDC, XLP, FSTA)
These conservative sectors may lag somewhat as the overall market recovers (vrs say tech stocks), but they should drop less if the market continues to fall more than expected (beyond the 40% drop to the S+P support area at 2000-2100).
>>> Best & Worst ETFs During Market Chaos
ETF.com
March 05, 2020
by Sumit Roy
https://www.etf.com/sections/features-and-news/best-worst-etfs-during-market-chaos?nopaging=1
Not many areas of the market have been immune to the enormous gyrations the financial markets have seen lately. In the two weeks since the S&P 500 peaked, most exchange-traded funds have fallen. Likewise, most ETFs rose when the market had two extraordinary rallies of more than 4% on Monday and Wednesday.
But while most ETFs have been moving in tandem, the gains and losses haven’t been equal. Since its Feb. 19 top, the SPDR S&P 500 ETF Trust (SPY) is down 10.6% through March 4 (it was down as much as 12.4% on a closing basis, and 15.8% on an intraday basis at its trough on Feb. 28). On a year-to-date basis, SPY is down about 6%.
SPY’s performance in the past two weeks sits at about the middle of the pack; some ETFs have done better, while others have done worse.
Safe Havens
Inverse ETFs aside, it’s been extremely difficult to generate gains in the market since the Feb. 19 peak. It comes as no surprise that one of the few segments to perform well in that time frame is the bond market. Treasuries and other investment-grade bond ETFs have simply been on fire.
The iShares 20+ Year Treasury Bond ETF (TLT) and the iShares 7-10 Year Treasury Bond ETF (IEF) gained 9.1% and 5.2%, respectively, since Feb. 19. On a year-to-date basis through March 4, the two funds are up 17.4% and 8.4%.
Those are fantastic returns, and come as interest rates hover at record lows (bond yields and prices move inversely).
Another safe-haven winner during the past two weeks is gold. The yellow metal leapt to seven-year highs of $1,689/oz on Feb. 24. Since then, prices cooled down a little bit to around $1,670, but the SPDR Gold Trust (GLD) is still up 3.8% since Feb. 19 and 10.2% on a year-to-date basis—not as good as long-duration Treasuries, but better than IEF, the 7-10 year Treasury fund.
Gold Near A 7-Year High

China ETFs
Who could have imagined that stocks trading in China, the epicenter of the coronavirus, would end up being among the best performers of the past two weeks? But that’s precisely what’s happened.
The Xtrackers Harvest CSI 300 China A-Shares ETF (ASHR) is up 4.3% in the period and 1.7% year-to-date. Two explanations for this puzzling performance come to mind. One, China got hit by the virus first, the government took drastic action to combat it, and there are signs the epidemic may be peaking in the country. The market may be anticipating that China will be the first country to recover from the crisis thanks to decisive action from the authoritarian government.
Another explanation is that the Chinese government may be propping up the financial markets. It wouldn’t be the first time that China lent support to its equity markets to prevent panic and provide confidence to its financial system.
Surprising Strength In ASHR

Sector Outperformers
Within the U.S. equity market, sector performance has deviated significantly. The S&P 500 may be down 10.6% over the past couple of weeks, but relatively safe consumer staples stocks are down only 3.8%, as measured by the Consumer Staples Select Sector SPDR Fund (XLP).
The Utilities Select Sector SPDR Fund (XLU) and the Real Estate Select Sector SPDR Fund (XLRE) are also outperforming, with losses of 3.6% and 5%, respectively, in the same period. The two sectors have been aided by plunging interest rates.
Then there is the Health Care Select Sector SPDR Fund (XLV), which has fallen 6.1% since the correction began. XLV made up a lot of ground on Wednesday, when it surged 5.7%, its biggest single-session gain since 2008. Surprise victories by Joe Biden in the Super Tuesday democratic primaries reduced concerns about Medicare-for-all and other health care measures that could negatively impact the sector’s profits.
On a year-to-date basis, XLP is down 1.5%; XLU is up 4.7%; XLRE is up 1.3%; and XLV is down 4.1%.
XLU Is Up Year-To-Date

Sector Laggards
On the flip side of the sector ledger are laggards like the Energy Select Sector SPDR Fund (XLE) and the Financial Select Sector SPDR Fund (XLF). The two worst-performing sectors, energy and financials, were down 17.9% and 15%, respectively, in the two weeks since Feb. 19.
In a way, financials are the flip side of real estate. The latter gets a boost from lower rates, while the former is hurt by them. Investors in financials certainly don’t want to see a situation like that in Europe, where negative interest rates have decimated the profitability of the region’s banking sector.
Additionally, the energy sector, already a pariah among investors, was hit yet again by the coronavirus-induced sell-off in oil prices. Crude was last trading below $46/barrel as traders anticipate the biggest slowdown in oil demand since the financial crisis.
The only saving grace for energy investors are the sky-high dividend yields the sector provides. XLE was last yielding nearly 5%.
XLE At An 11-Year Low

Other Laggards
XLE isn’t the only energy ETF to be walloped in the past two weeks. Two popular ETFs with exposure to smaller companies in the space, the SPDR S&P Oil & Gas Exploration & Production ETF (XOP) and the VanEck Vectors Oil Services ETF (OIH) each tumbled more than 25% in just the past two weeks alone and are down by more than 37% on a year-to-date basis.
Meanwhile, cheaper fuel prices haven’t been enough to offset the plunging demand for travel that airlines are facing. The US Global Jets ETF (JETS) sank nearly 30% since the market top and by a similar amount for the year as a whole.
On Wednesday, United Airlines announced that it is cutting its international flights by 20% and its domestic flights by 10% next month.
JETS Losing Altitude

<<<
>>> Heading Into Negative (Real) Interest Rates
BY JAMES RICKARDS
MARCH 5, 2020
https://dailyreckoning.com/heading-into-negative-real-interest-rates/
Heading Into Negative (Real) Interest Rates
Last July I was in Bretton Woods, New Hampshire, along with a host of monetary elites, to commemorate the 75th anniversary of the Bretton Woods conference that established the post-WWII international monetary system. But I wasn’t just there to commemorate the past —I was there to seek insight into the future of the monetary system.
One day I was part of a select group in a closed-door “off the record” meeting with top Federal Reserve and European Central Bank (ECB) officials who announced exactly what you can expect with interest rates going forward — and why.
They included a senior official from a regional Federal Reserve bank, a senior official from the Fed’s Board of Governors and a member of the ECB’s Board of Governors.
Chatham House rules apply, so I still can’t reveal the names of anyone present at this particular meeting or quote them directly.
But I can discuss the main points. They essentially came out and announced that rates are heading lower, and not by just 25 or 50 basis points. Rates were 2.25% at the time. They said they have to cut interest rates by a lot going forward.
Well, that’s already happened. The Fed cut rates last September and October (each 25 basis points), bringing rates down to 1.75%. And now, after Tuesday’s emergency 50-basis point rate cut, rates are down to 1.25%.
That’s a drop of one full percentage point. If the Fed keeps cutting (which is likely), it’ll soon be flirting with the zero bound. And if the economic effects of the coronavirus don’t dissipate (very possible), the Fed could easily hit zero.
But then what?
These officials didn’t officially announce that interest rates will go negative. But they said that when rates are back to zero, they’ll have to take a hard look at negative rates.
Reading between the lines, they will likely resort to negative rates when the time comes.
Normally forecasting interest rate policy can be tricky, and I use a number of sophisticated models to try to determine where it’s heading. But these guys made my job incredibly easy. It’s almost like cheating!
The most interesting part of the meeting was the reason they gave for the coming rate cuts. They were very relaxed about it, almost as if it was too obvious to even point out.
The reason has to do with real interest rates.
The real interest rate is the nominal interest rate minus the inflation rate. You might look at today’s interest rates and think they’re already extremely low. And in nominal terms they certainly are. But when you consider real interest rates, you’ll see that they can be substantially higher than the nominal rate.
That’s why the real rate is so important. If you’re an economist or analyst trying to forecast markets based on the impact of rates on the economy, then you need to focus on real rates.
Assume the nominal rate on a bond is 4%; what you see is what you get. But the real rate is the nominal rate minus inflation. If the nominal rate is 4% and inflation is 2%, then the real rate is 2% (4 – 2 = 2).
That difference between nominal and real rates seems simple until you get into a strange situation where inflation is higher than the nominal rate. Then the real rate is negative.
For example, if the nominal rate is 4% and inflation is 5%, then the real rate of interest is negative 1% (4 – 5 = -1).
The U.S. has never had negative nominal rates (Japan, the eurozone and Switzerland have), but it has had negative real rates.
By the early 1980s, nominal interest rates on long-term Treasury securities hit 13%. But inflation at the time was 15%, so the real rate was negative 2%. The real cost of money was cheap even as nominal rates hit all-time highs.
Nominal rates of 13% when inflation is 15% are actually stimulative. Rates of 3% when inflation is 1% aren’t. In these examples, nominal 2% is a “high” rate and 13% is a “low” rate once inflation is factored in.
What is the real rate today?
The yield to maturity on 10-year Treasury notes is currently at a record low of under 1% (it actually fell to 0.899% today before edging slightly higher). That’s never happened before in history, which is an indication of how unusual these times are.
Meanwhile, inflation as measured by the PCE core deflator (the Fed’s preferred measure) is currently about 1.6% year over year, below the Fed’s 2% target.
Using those metrics, real interest rates are in the neighborhood of -.5%. But believe it or not, that’s actually higher than the early ’80s when nominal rates were 13%, but real rates were -2%.
That’s why it’s critical to understand the significance of real interest rates.
And real rates are important because the central banks want to drive real rates meaningfully negative. That’s why they have to lower the nominal rate substantially, which is what these central bank officials said at Bretton Woods.
So you can expect rates to go to zero, probably sooner or later. Then, nominal negative rates are probably close behind.
The Fed is very concerned about recession, for which it’s presently unprepared. And with the coronavirus, now even more so. It usually takes five percentage points of rate cuts to pull the U.S. out of a recession. During its hiking cycle that ended in December 2018, the Fed was trying to get rates closer to 5% so they could cut them as much as needed in a new recession. But, they failed.
Interest rates only topped out at 2.5%, only halfway to the target. The market reaction and a slowing economy caused the Fed to reverse course and engage in easing. That was good for markets, but terrible in terms of getting ready for the next recession.
The Fed also reduced its balance sheet from $4.5 trillion to $3.8 trillion, but that was still well above the $800 billion level that existed before QE1 (“QE-lite” has since taken the balance sheet up above $4 trillion, and it’s probably going higher since new cracks are forming in the repo market).
In short, the Fed (and other central banks) only partly normalized and are far from being able to cure a new recession or panic if one were to arise tomorrow.
The Fed is therefore trapped in a conundrum that it can’t escape. It needs to rate hikes to prepare for recession, but lower rates to avoid recession. It’s obviously chosen the latter option.
If a recession hit now, the Fed would cut rates by another 1.25% in stages, but then they would be at the zero bound and out of bullets.
Beyond that, the Fed’s only tools are negative rates, more QE, a higher inflation target, or forward guidance guaranteeing no rate hikes without further notice.
Of course, negative nominal interest rates have never worked where they’ve been tried. They only fuel asset bubbles, not economic growth. There’s no reason to believe they’ll work next time.
But the central banks really have no other tools to choose from. When your only tool is a hammer, every problem looks like a nail.
Now’s the time to stock up on gold and other hard assets to protect your wealth.
Regards,
Jim Rickards
for The Daily Reckoning
<<<
>>> Hottest Bond Market in History Is Starting to Make Some Nervous
Bloomberg
By Cecile Gutscher and Anchalee Worrachate
March 3, 2020
https://www.bloomberg.com/news/articles/2020-03-03/hottest-bond-market-in-history-is-starting-to-make-some-nervous?srnd=premium
Duration bets at a record as coronavirus spurs caution
Haven play may turn dangerous if doomsday doesn’t come
Surging rate-cut expectations and a desperate lunge for safe assets amid the coronavirus outbreak have earned the bond market a lot of fans in recent weeks. The resulting rally is creating a few detractors, too.
A growing chorus of strategists and money managers is voicing concern as investors charge into government debt at seemingly any price.
The fear is they’re exposing themselves to interest rate risk like never before, risking a precipitous slump on even a modest bump in yields. One breakthrough in the fight against the illness, or a sign the global economy is recovering faster-than-expected, might be all it takes.
The yield on 10-year Treasuries touched an all-time low on Monday but traders didn’t have to look far for clues of just how fast the narrative can change. The S&P 500 Index surged 4.6% on bets central banks would coordinate to limit the economic impact of the virus. The moves highlight belief in some corners that policy action will stoke growth, creating upward pressure for stocks and bond yields.
“If things go a little better -- if there is a cure in the next two, three months or if with warmer weather the virus fades -- then long-end rates will sell off,” said Alberto Gallo at Algebris Investments. “Duration is expensive to protect the portfolio.”
The London-based money manager said he’s using short positions in credit to hedge the risk of a deeper sell-off.
Bond duration risk rises to record
Amid a rally so ferocious that it has stirred speculation some Treasury yields could even be headed below zero, the danger of rising bond yields still seems remote. Even those flagging it as a concern aren’t ready to unwind their bets on longer bonds -- for now.
The Federal Reserve’s announcement Friday that it was ready to act if needed took 10- and 30-year Treasury yields to new lows, with futures markets now pricing in more than 100 basis points of Fed cuts this year. The announcement by the Fed, a rare departure from typical central bank protocol, ushered in similar assurances from the Bank of Japan and the Bank of England.
The yield on the Bloomberg Barclays Global Aggregate Bond Index, which includes developed and emerging-market debt from governments and corporations, tumbled to 1.05% Monday, its lowest ever.
Global bond yields hit record low as investors seek virus havens
Still, the risks of taking one-way bets on bonds at such elevated valuations loom large. Sensitivity to changes in rates measured by duration is running at a record 8.6 years in the Bloomberg Barclays Global Aggregate Treasuries Index. That means every percentage point increase in average yields would spark a price decline of about 8.6%.
Bond traders throwing their faith behind policy makers should also be thinking about how steps to shore up confidence will affect those bets, according to Jim McCormick, the London-based global head of desk strategy at NatWest Markets. A boost to economic growth would ultimately mean higher long-dated yields.
“Central banks will likely cut and unlikely unwind them when things settle, but a recovery plus more fiscal policy should pressure the back end of the curve,” he said. “The curve steepens if the combination of policy response works.”
A sobering assessment by the OECD Monday did little to assuage market panic. The Paris-based group warned of possible global contraction this quarter and cut its full-year growth to just 2.4% from 2.9%, which would be the weakest since 2009.
As the number of new virus cases in China declines, those elsewhere are climbing, with countries like Brazil and Pakistan reporting instances of the illness for the first time.
But if measures to contain and stamp out the illness take hold, China returns to work and records an upswing in growth in the second quarter, bets on expensive government bonds may start to look dangerous.
Bond momentum signals tracked by a type of systematic investors known as trend followers have turned so extreme their bullish bets are now vulnerable to profit-taking, according to JPMorgan Chase & Co.
TLT posts its largest weekly outflow in more than a month
Wariness is reflected in passive flows in the world’s most heavily traded government debt product, the iShares 20+ Year Treasury Bond fund, which shows investors’ love affair with duration may be cooling somewhat. The ETF just posted its largest weekly outflow in more than a month.
“Chasing bonds when yields are at an all-time low seems very risky,” said Mark Dowding, a money manager at BlueBay Asset Management, who has a neutral stance on duration. “At the same time it seems that news flow on the virus will get worse before it gets better.”
<<<
Here's how the various sectors have performed since the S+P peaked on Feb 19 (approx figures) -
S+P 500 ------------ down 13%
1x Inverse S+P 500 ETF -- up 14%
HDGE -------------------- up 11%
Long Term Treasuries ---- up 7%
Intermediate Treasuries - up 2%
Total Bond Market ------- up 2%
Cash -------------------- no change
Gold bullion -------------- down 2%
Gold Miners (GDX) ------- down 12%
Gold Miners (GDXJ) ------ down 14%
Looking at how the various 'hedges' did today in comparison to the S+P 500 -
STOCKS -
**************
SPY - down 3.3%
SH --- up 3.5%
CASH -
***********
no change
BONDS -
***********
VGLT --- up 1.5% (Long term Treasuries)
VGIT --- up 0.5% (Int term Treasuries)
BND ---- up 0.31% (Total bond market)
GOLD BULLION -
***********************
GLD ---- up 0.90%
GOLD MINER ETFs -
**************************
GDX ---- up 1.3%
GDXJ -- down 0.13%
GOLD MINING STOCKS -
*******************************
AUY --- down 0.64%
LMCNF - down 1.5%
HL ---- down 5.5%
CDE --- down 7.2%
MUX --- down 7.7%
>>> There’s a Wall of Cash Eager to Buy Treasuries on Any Price Dip
Bloomberg
By Liz McCormick and Ruth Carson
February 16, 2020
https://www.bloomberg.com/news/articles/2020-02-16/there-s-a-wall-of-cash-eager-to-buy-treasuries-on-any-price-dip?srnd=premium
It’s ‘a resilience play that makes sense’: BlackRock’s Thiel
Pensions, mutual funds and hedge funds have all piled in
Investors overseeing trillions of dollars are plowing money into U.S. government debt like never before, in a wave that’s only gaining strength as the spreading coronavirus casts doubt on the global growth outlook.
Evidence of the insatiable demand can be found across the fixed-income universe. Pensions, which have been ramping up bond allocations for more than a decade after a change in regulations, now hold a record amount of longer-dated Treasuries. Bond mutual funds saw a historic inflow of money last year, with no sign of a slowdown. Even hedge funds have piled in.
The wall of cash is a boon to American taxpayers as the federal deficit swells. It’s keeping Treasury yields, a benchmark for global borrowing, near all-time lows. With buyers ready to pounce, even surging stocks, record auction sizes and the tightest labor market since the 1960s can barely make a dent in bond prices.
“Treasuries are a resilience play that makes sense,” said Scott Thiel, chief fixed-income strategist at BlackRock Inc. “And so far, people have been rewarded for coming in and buying when yields get to the high end of the range.”
Investors have been buying on dips in Treasury prices
Just weeks ago, global economic reflation and the seeming inevitability of higher yields were the buzz among strategists and investors. The virus’s onslaught is unraveling that narrative, which already faced skepticism from those who argue that persistently low inflation and shifting demographics will pull yields lower.
“I expect the Treasury 10-year yield to fall to zero, perhaps within two years,” said Akira Takei, a global fixed-income fund manager at Asset Management One Co., which oversees more than $450 billion. “I’ve been overweight U.S. Treasuries. That’s based on my view that developed economies are facing a combination of aging demographics and falling birth rates, slow growth and low inflation.”
Investors snapping up Treasuries as an insurance policy have turned the U.S. yield curve on its head. With inflation still subdued and concern mounting that the spreading illness will damage an already fragile global economy, traders have boosted bets on Federal Reserve rate cuts in 2020. That prospect is in turn supporting equities.
The appetite for debt has extended to sovereign obligations of all flavors. One example: Greek 10-year rates once near 45% slid below 1% this month. The country’s junk rating is proving little deterrent with the world’s pile of negative-yield debt climbing above $13 trillion amid the latest global bond rally.
Benchmark 10-year U.S. yields have dropped to around 1.6%, from a 2020 peak of 1.94% in the first week of the year. The world’s biggest bond market has earned about 2.2% this year, after a 6.9% return in 2019 -- the best performance since 2011.
READ MORE
Bond Market Braces for Fresh Trillion-Dollar Fund Flow Wave
Bond Funds See Record Inflows After Virus Spurs Bets on Stimulus
Inverting Treasury Curve Shows Global Fear More Than U.S. Slump
“You still need a duration ballast and shock absorber,” said Con Michalakis, chief investment officer of retirement fund Statewide Superannuation Pty., which manages about $7 billion in Adelaide, Australia. “And I don’t see yields moving materially higher from here.”
The likely economic hit from the virus reinforces that view. Fed Chairman Jerome Powell last week cited the outbreak as a risk. Goldman Sachs Group Inc. predicts it will subtract two percentage points from annualized global growth this quarter.
“If the Fed is staying super-accommodative -- basically in reflation mode -- then you want to buy equities, credit and, strangely, you also want to buy Treasuries,” said Ralph Axel, an analyst at Bank of America Corp.
The demand for Treasuries in some corners has been building for years. U.S. corporate pensions, for example, have been big buyers since the federal Pension Protection Act, passed in 2006.
For the top 100 funds, with combined assets of more than $1.4 trillion, the fixed-income allocation surged to about 49% at the end of 2018 from 29% in 2005, as equities’ share fell by half to 31%, according to Milliman Inc., a pension and risk advisory firm. JPMorgan Chase & Co. strategists estimate the debt portion topped 50% as of December.
An up-to-date read on retirement funds’ demand can be seen in the record surge in Strips, which are created when Treasuries are split into principal- and interest-only securities. Pensions tend to favor these assets, which have longer duration, or sensitivity to interest-rate changes, to match the length of their liabilities.
Pension funds' Treasury demand seen in Strips rise
Soaring stocks are also spurring buying of bonds on price declines.
U.S. public pensions, with total assets of over $4 trillion, have kept holdings steady over the past five years, at about 25% in fixed income, 50% in public equities and the rest in alternative investments, according to data from the Pew Charitable Trusts.
As equities have climbed, the funds have needed to buy more debt to keep the breakdown stable, said Greg Mennis, director of public sector retirement systems at Pew.
Veteran bond manager Dan Fuss says he’s been been buying Treasuries as a safety play. He points to last week’s 10-year auction as a sign that yields won’t bust higher anytime soon. A measure of demand for the $27 billion sale was the highest since March.
“When you look at the bids for the 10-year notes, you’d have thought, ‘Wow, the government was giving out free ice cream’,” said Fuss, vice chairman of Loomis Sayles & Co. “There’s just more money available to invest than there’s marketable investment opportunities, and no risk of inflation at this time.”
<<<
Ray Dalio and Jim Rickards each have a big chunk in Treasuries, 55% and 40% respectively, to go along with their 7.5% and 10% in physical gold.
Rickards recommends Treasury notes (which mature in 2-10 years), while Dalio uses longer maturity Treasuries (40% long term, 15% intermediate term). Rickards also said he has 30% in cash.
Beyond gold, both recommend owning real assets. Dalio has 7.5% in commodities, and Rickards likes fine art and natural resource plays like oil, water, and land.
More on Ray Dalio's 'All Weather Fund' allocation -
Apparently it took Dalio 10 years to perfect his 'All Weather Fund' approach, and he has his entire family fortune (approx $18 bil) invested using this asset allocation.
According to Robbins, Dalio back tested this allocation going back 75 years, and it performed phenomenally well, even during the 1970s stagflation and the 2008 crisis. He said the worst year was a loss of under 4%. Apparently Dalio also uses a certain amount of leverage on the bond side in order to make the entire portfolio risk neutral.
Of course we've had a 4 decade bull market in bonds since they peaked in 1982. So that won't be repeated, but Dalio back tested to 1945 and his allocation worked well even when interest rates were rising. The key to his allocation is getting the entire package 'risk neutral', by which I think he means having the asset classes as uncorrelated as possible. In another video Dalio explains how his hedge fund Bridgewater is constructed the same way, with each bet as uncorrelated to the others as possible.
One thing I've noticed about these famous investors is their obsession with controlling risk. They may look like wild gunslingers, but what they do is more like arbitrage, where bets may individually be high but are counterbalanced off each other to achieve a low risk in the overall package.
Dalio said a great advantage to this approach is on the emotional side, since with the risks being balanced, the overall volatility is muted and thus it's much easier to 'stay the course'.
Ray Dalio's recommended 'All Weather Fund' portfolio, which has been back-tested for 75 years, as explained by Tony Robbins -
(from 8:15 to 14:45) -
>>> 6 biggest pitfalls for investors
Avoid these common emotional biases to help improve your financial life.
FIDELITY VIEWPOINTS
Fidelity Investments
01/22/2020
Key takeaways
Natural human instincts often undermine our success as investors.
Common pitfalls include aversion to loss and ambiguity, following the crowd, and focusing on information that's recent or confirms what we already believe.
Antidotes include seeking out alternative information, doing your research, and developing a long-term financial plan that you can stick with.
Our brains evolved to protect us from all kinds of primal dangers—saber-toothed tigers, earthquakes, dodgy-looking strangers from the other side of the river. Trouble is, the instincts and mental shortcuts humans developed to manage life-and-death scenarios aren't all that helpful when deciding when to sell a losing investment, or whether to buy that stock or mutual fund everyone was talking about at lunch.
In fact, these tendencies aren't just unhelpful—they can be harmful. They often prompt us to make decisions that seem rational but are self-defeating. To disrupt this cycle, it helps to know a bit about the mental shortcuts that human brains are prone to taking—and how to short-circuit them.
"It's very easy to fall back on gut decisions and intuition—it's automatic, and it feels good," says Andy Reed, PhD, Fidelity's Vice President for Behavioral Science. "It's a little harder, and takes more awareness, to reflect on our own reasoning that leads us to the decisions we make. But there's all sorts of evidence that when you broaden the scope of your thinking, you come up with better solutions to the problems you're facing."
Start broadening your own thinking by familiarizing yourself with the following mental pitfalls, and ways to avoid them.
1. Avoid losses at all costs: Loss aversion
What it is: The fear of loss is a stronger motivator than the pleasure of gain. As a result, people tend to avoid the risk of losing money, even if that means not reaching their goals.
How it plays out: Fear of loss can cause investors to invest too conservatively, and overreact during market volatility, selling low.
The problem: If you only invest in low-risk, low-return investments, your money may not grow enough to reach long-term goals like retirement. And selling out of fear during market downturns locks in losses, making it harder to catch up.
How to prevent it: Planning helps you focus on long-term goals, not short-term fears. If your goal is 20 years away, a loss over one month or year probably isn't all that important. Focus on your individual goals and time horizon. And monitor your investments and progress toward your goals on a set, not-too-frequent schedule—perhaps once or twice a year, or if your goals or situation change.
2."I am the greatest!" Confirmation bias
What it is: We tend to seek out information that confirms or supports what we already think, and reject information that doesn't. In the words of Muhammad Ali, "I don't always know what I'm talking about, but I know I'm right."
How it plays out: Say you've just invested in a company's stock. As you continue reading up on the firm, you come across 10 positive headlines and 10 negative ones—and click only on the ones that support your decision.
The problem: Limiting yourself to information that confirms what you already think can cause you to miss important warning signs.
How to prevent it: Repeatedly ask yourself: "What could I have gotten wrong?" Seek out information from a diverse range of sources. A good place to start is Fidelity's stock, bond, and fund research pages.
3. Getting stuck on the first thing you see: Anchoring bias
What it is: We tend to latch onto the information we receive first—whether it's relevant to the decision we're making or not.
How it plays out: We commonly anchor on specific numbers just because, well, we know about them. Imagine your friend is raving about a mutual fund you've never heard of that she just bought at $50. But by the time you check the quote it's already at $55. So you decide not to pursue the idea.
The problem: The anchors our brains pick often have zero bearing on the decision to be made. For example, whether it makes sense to buy a fund at a given price depends on factors such as your situation, the fund's strategy, and future prospects. The price your friend bought at is completely irrelevant.
How to prevent it: Ignore the anchor. Do your homework. For stocks and stock funds, consider investment fundamentals like earnings growth, price-earnings ratio, and free cash flow. For bonds and bond funds, research factors like the issuing company's strength and credit rating as well as interest rates. Also consider how these investments would fit into your overall financial plan. And if you can't do it yourself, get help from a professional.
4. The breaking news problem: Recency bias
What it is: We tend to over-emphasize information we just received, because it's most readily available to our brains.
How it plays out: When the market is down, we tend to feel—and sometimes act—like it's going to keep falling forever. And when the market is rising, we tend to feel and act like it will never stop.
The problem: Recency bias can lead you to invest more at market tops and sell at market bottoms—just the opposite of what successful investors do. Add to that a 24-hour news cycle that bombards us with breaking news, and there is no shortage of stimuli to point us in the wrong direction as investors.
How to prevent it: Stop constantly checking on what the market is doing. Most scary headlines have little impact on long-term market trends. Focus on your personal goals. Consider building a mix of stocks, bonds, and short-term investment to get there. If market moves shift your asset allocation—or your situation or goals change—think about how you can rebalance back to your target mix. That discipline can help you buy low, sell high, and build wealth over time.
5. There's safety in numbers ... right? Herding bias
What it is: We humans tend to follow the crowd, saving time and mental energy by doing what people around us do.
How it plays out: Multiple people in your life start talking about a particular investment. You figure if it's that popular, it must be worth buying.
The problem: The crowd is often wrong. When it is, the repercussions can be costly: Think internet stocks in 2001 and Bitcoin in 2018.
How to prevent it: Rather than following the crowd, focus on developing an investment plan that's right for you. That means a plan that takes into account your individual goals, situation, and time horizon—and one that's diversified. Diversification doesn't mean you won't ever lose money. But owning a mix of investments can help reduce the risk. That way if some investments drop, others may rise, helping you reach your goals.
6. The devil you know: Ambiguity aversion
What it is: People tend to be more comfortable with things that are predictable and shy away from uncertainty.
How it plays out: You might be tempted to load up on investments that offer predictable returns—like money market funds or bonds with a fixed rate of return, versus a growth stock with no dividend and uncertain returns.
The problem: Sometimes sticking to your comfort zone is risky. For example, if your goal is to grow your money over a long time period, investments with predictable returns might not give you the best chance to achieve your goals.
How to prevent it: Establish a financial plan centered on your goals and situation. Build an investment mix that can include stocks, bonds, and cash to help achieve those goals in your chosen time frame. And then stick to it.
The bottom line
Understanding the mental shortcuts we're primed to take is the first step in combating their influence on our decision-making. That task is made easier by developing—and sticking to—a solid financial plan that's squarely focused on achieving your individual goals. In times of uncertainty, that plan can remind you of your priorities and help you build the resources you need to reach your goals.
<<<
A comparison of how the various asset classes performed in 2008 during the big financial crisis -
Treasury Bonds (8 yr maturity) - up 20%
Cash - no change
Total Bond Market - down 12%, fully recovered in 3 months
Gold Bullion - down 30%, fully recovered in 4 months
Stocks - down 60%, fully recovered in 36 months
Gold Miners - down 70%, fully recovered in 12 months
Triumph for indexing - >>> Active fund managers trail the S&P 500 for the ninth year in a row in triumph for indexing
Trader Talk
MAR 15 2019
by Bob Pisani
https://www.cnbc.com/2019/03/15/active-fund-managers-trail-the-sp-500-for-the-ninth-year-in-a-row-in-triumph-for-indexing.html
Active managers who claim that they would do better during periods of heightened volatility are going to have to find another argument. For the ninth consecutive year, the majority (64.49 percent) of large-cap funds lagged the S&P 500 last year.
After 10 years, 85 percent of large cap funds underperformed the S&P 500, and after 15 years, nearly 92 percent are trailing the index.
It’s the triumph of indexing: Fund managers continue to trail their benchmarks.
This week, S&P Dow Jones Indices released its annual report on how actively managed funds performed against their benchmarks. The conclusion is that active managers continue to show dismal performance against their passive benchmarks. For the ninth consecutive year, the majority (64.49 percent) of large-cap funds lagged the S&P 500 last year.
“The figures highlight that heightened market volatility does not necessarily result in better relative performance for active investing,” the report said.
“What’s different about 2018 was the fourth quarter volatility,” Aye M. Soe, a managing director at S&P and one of the authors of the report, told CNBC. “Active managers claimed that they would outperform during volatility, and it didn’t happen.”
The study will bolster the claims of many financial advisors, who say that investing in low-cost, passive funds remains the soundest long-term investment.
This is not a one-year phenomenon. S&P has been doing this study for 16 years, and the long-term results only strengthen the claims for index investing. Indeed, while a fund manager may outperform for a year or two, the outperformance does not persist. After 10 years, 85 percent of large cap funds underperformed the S&P 500, and after 15 years, nearly 92 percent are trailing the index.
Long-term, the numbers were not much better in other categories like small-cap stocks or fixed income: “Over long-term horizons, 80 percent or more of active managers across all categories underperformed their respective benchmarks,” the report concluded.
Looking at managers’ overall record last year versus the broader S&P 1500 Composite, 2018 was the fourth-worst year for stock managers since 2001.
Critically, the study adjusts for “survivorship bias.” Many funds are liquidated because of poor performance, so the survivors give the appearance the overall group is doing better than it really is.
“The disappearance of funds remains meaningful,” the report notes. Over 15 years, 57 percent of domestic equity funds and 52 percent of all fixed income funds were merged or liquidated.
<<<
>>>2 Investments To 'Load Up' Before The Recession
Nov. 28, 2019
Jussi Askola
REITs, real estate, research analyst
https://seekingalpha.com/article/4308392-2-investments-load-up-recession
Summary
The investment world is faced with an unprecedented challenge: both stocks and bonds have simultaneously become overvalued and risky.
Investors are quickly seeking refuge in real assets such as commercial properties, pipelines, farmland, airports, timberland, and other.
While investing in real assets may have been reserved to high net worth individuals in the past, today there exists a lot of publicly-traded alternatives.
Below we present 2 of our favorite real assets and explain why their cash flows are resilient to recessions.
Looking for a portfolio of ideas like this one? Members of High Yield Landlord get exclusive access to our model portfolio. Get started today »
Investors are today faced with a big challenge:
"There is nothing interesting to buy."
On one hand, stocks are trading at a 30% premium to historical averages – despite slowing growth in a late cycle economy:
And on the other hand, bonds pay historically low interest rates that may not even cover inflation in the long run.
This creates two major problems to investors:
Stocks: With high valuations in a late cycle, risks are very high and investors could suffer significant capital losses from a return to historic valuation multiples.
Bonds: Not enough income is earned to meet investor's immediate needs. This is particularly dangerous to large institutions and retirees.
What is then the solution to deal with these challenges?
Our preferred strategy is to invest in Real Assets. Commercial properties, farmland, timberland, energy pipelines and other similar real assets are the only remaining investments that can still provide high income and inflation protection – without taking an enormous amount of risk.
These are not just the empty words of a Seeking Alpha author. Over the past 10 years, institutional capital in the real asset space has grown by $30 trillion. Yes that’s trillion with a “t”. Over the coming 10 years, another $50 trillion is expected to shift to real asset investments.
real asset allocations on the rise
Stocks and bonds are not providing the needed returns and professional investors are quickly changing portfolio allocations. By 2030, the allocations to real assets are expected to reach up to 40% of intuitions portfolios:
So far, individual investors have been slow to react. With poorer access to research and no expertise in real asset investing, individual investors continue to overexpose themselves to the risks of owning traditional stocks and bonds.
Fortunately, you do not need to be a multi-billion-dollar institution to invest in real assets. At High Yield Landlord, we specialize in liquid alternatives to gain exposure to high yielding real assets. This includes REITs, MLPs, Utilities, and other listed infrastructure companies.
If you've read until here, we want to share with you two of our "Top Picks" among high-yielding REIT opportunities. These two REITs are particularly well-positioned in today’s late cycle economy because of their more defensive nature, steady cash flow growth, and high level of dividend security.
INVESTMENT #1 – Medical Properties Trust (MPW)
MPW is our one and only Healthcare REIT investment at the moment.
The Buy Thesis in 3 Bullet Points:
Superior Cap Rates: Most REITs compete for properties in the 5-7% cap rate range. MPW is able to target greater cap rates at closer to 8% by specializing in hospitals - a property type that is mostly ignored by the investment community.
Resilience in Late Cycle: People need hospitals - regardless of economic conditions. MPW's tenants are healthy and enjoy strong rent coverage ratios. If we were to go into a recession tomorrow, we would expect the cash flow to remain stable - allowing it to pay a sustainable 5.3% dividend yield.
Strong Acquisition Pipeline: As the only "pure-play" Hospital REIT, MPW enjoys valuable relationships with operators to conduct sale and leaseback transactions. With a strong acquisition pipeline and the capital to fund it, we expect 5-8% annual growth in the coming years.
You can read our full investment thesis here:
Investing In Hospitals: Recession Resilience, High Growth, And 5.6% Yield
Recap of 3rd Quarter Results:
This company is doing absolutely amazing:
It beat on FFO and revenue expectations. It also reaffirmed its full year guidance – which it already boosted during the last quarter.
The CEO talks about a “record-breaking year” with “monumental results”. This is because year-to-date, the company has grown its assets by 40%!
Its new acquisitions are done at ~8% cap rates – which results in immediately accretive growth.
They note that they have a pipeline of up to $5 billion for transactions in the coming quarters. The company is not slowing down.
The investment story was already strong in MPW, but with these new acquisitions, the story is only getting better. We also love the recent expansion to more global markets including the UK and Switzerland which have very favorable demographics for hospitals. With such healthy spreads, and defensive properties, we believe that MPW is a near certain future outperformer. If the share price remains around $20 per share, we will buy more shares in the near term.
INVESTMENT #2 – EPR Properties (EPR)
EPR Properties (EPR) is one of our oldest investments. We invested heavily when it traded at mid-$50 and have a large capital gain at $77 today. To this day, it remains our Favorite net lease REIT investment idea.
The Buy Thesis in 3 Bullet Points:
Alpha-Rich Strategy: EPR targets specialty net lease assets that are ignored by most other investors. These include movie theaters, golf complexes, ski resorts, and other entertainment assets. They come with greater cap rates, longer leases, and higher rent increases.
History of Successful Execution: EPR has historically been a massive outperformer and everything points out to further outperformance in the long run.
Simple Story: The company beats its peers on all fronts. It pays a higher yield (6%), it grows faster (5-8%), and it has more upside potential due to its discounted multiple (14x FFO).
You can read our full investment thesis here:
A New Opportunity Has Emerged In EPR Properties
Recap of 3rd Quarter Results:
EPR has a long history of consistently beating expectations and surprising to the upside. The last quarter was no different:
It beat FFO and revenue expectations for the quarter. It also boosted its full year guidance.
It invested $118 million in new properties over the past 3 months alone. A big portion went into golf complexes such as the one illustrated above.
EPR is currently enjoying historically high spreads on its new investments and the guidance for further acquisitions is very strong.
EPR also issued $500 million in senior unsecured notes with a 10-year term at a 3.75% interest rate during the quarter. This cheap capital was used to refinance its previous notes that were yielding 5.75%.
The dividend is up by 4.2% as compared to same quarter last year.
We expect another dividend increase sometime in the coming quarters, likely in early 2020. We are very bullish and recently upgraded EPR into a Strong Buy. The discount to peers is historically high and the company is stronger than ever before. We expect ~15% upside from repricing to a higher FFO multiple and 5-8% annual FFO growth. Add to that a 6% dividend yield, and you have a recipe for consistent and predictable outperformance.
It's by targeting this type of defensive, yet undervalued REITs that we aim to outperform in today's volatile and uncertain environment.
As of today, our Core Portfolio has a 7.4% dividend yield with a conservative 68% payout ratio. Beyond the dividends, the core holdings are trading substantially below intrinsic value at just 9.2x Cash Flow - providing both margin of safety and capital appreciation potential.
<<<
>>> 5 Ideas to Build Wealth Outside the Stock Market
Yield Street
MILIND MEHERE, FOUNDER & CEO
https://www.yieldstreet.com/five-ways-to-make-money-outside-the-stock-market?utm_source=Taboola&utm_medium=cpc&utm_campaign=NEW_WL_Desktop&utm_content=K3hh&bloomberg
Having passed the 10th anniversary of the start of the Great Recession, we are now in the longest bull run in the American economy since WW2. Historical data reveals it is only a matter of time before the market pulls back.5
With the U.S. unemployment rate at lows near 4%, the federal government has executed on a fiscal stimulus package which, according to Ben Bernanke, former Chairman of the U.S. Federal Reserve, "is going to hit the economy in a big way this year and next year, and in 2020, Wile E. Coyote is going to go off the cliff".6
Today, many investors are unaware of new alternative investment options with typically low correlation to the stock market that can be added to their portfolio to protect against the fluctuations in the broader economy.
Rather than putting all of your hard earned money in the same basket, consider these 5 strategies outside the stock market:
1. Rental properties and Vacation homes:
A drop in homeownership rates has led to a rental boom, so purchasing a second property can be a great way to boost your finances.
Rental investments can generate returns, plus any rise in equity; however, it can be difficult to be a passive landlord. If you don’t want to manage tenants and handle maintenance yourself, you’ll need to hire a trustworthy property manager.
If you want to build equity, you also must purchase property in a market that has strong interest in rentals and vacation homes. While many online portals will give you a feel for the market, you will need to build your own payback/investment model.
• Set-up: Hard
• Time commitment: High
• Money required: Medium ($20,000 to $100,000)
• How: Self-research
2. Commercial property:
The approach is similar to that of rental properties, but in this case, you’re buying into properties like a one- or two-star hotel (think Days Inn [WYN] or Holiday Inn [IHG]) or a strip mall.
The initial investment is significant, and you need to vet potential partners to ensure they’re reliable and have domain expertise.
But if you’re willing to put in the initial time and capital, you can potentially expect a 6% to 12% return, compared to around a 1% to 4% return on a single-family home.
• Set-up: Hard
• Time commitment: Medium
• Money required: High ($250,000+)
• How: Self-research
3. Franchise play:
Invest in a single franchise or a group of successful chains, such as Subway or Dunkin’ Donuts. The franchise industry is set to grow this year, and that trend could very likely hold.
A franchise investment could earn you a 10% to 15% return on your investment.
The biggest drawback is that buying just one or two will not generate enough income to make it interesting. You’ll need to purchase several for the investment to be worthwhile, which usually means a larger check size and additional time spent finding the right partner. To get started, you could attend a franchising trade show to get the lay of the land.
• Set-up: Hard
• Time commitment: Medium to high (if you run it yourself)
• Money required: High ($50,000 to $1 million)
• How: Self-research
4. Peer-to-peer lending, social lending, and crowdfunding:
These platforms enable borrowers to connect with a wide range of potential lenders (that’s you!) instead of having to rely on traditional banks for financing. The borrowers are individual consumers or small businesses, and the investments usually target an 8% to 12% return.
Even by conservative estimates, the industry is growing rapidly. Most platforms focus on consumer lending and SMB lending, and you need to be aware of credit cycles and changes in interest rates.
• Set-up: Easy
• Time commitment: Short
• Money required: Low ($5,000+)
• How: Online platform
5. Alternative lending:
Investing in specialty finance products such as real estate, commercial loans, and legal settlements can yield 8%-20% returns, and it requires less time and energy than buying and managing physical investments.
In the past, these alternative investments were generally exclusive to investors with ultra-high net worth and large investment banks.
Today, they’re increasingly available to retail investors through platforms like YieldStreet, an alternative investment marketplace that offers investment opportunities in real estate, litigation finance, and consumer lending.
• Set-up: Easy
• Time commitment: Short
• Money required: Low ($5,000+)
• How: Online platform
?
In Conclusion:
Diverse, lucrative investment options exist outside of the stock market - If you‘re willing to understand and go after them.
<<<
>>> Calls Persist for Negative U.S. Yields Even as Fed Signals Pause
Bloomberg
By Vivien Lou Chen
November 3, 2019
https://www.bloomberg.com/news/articles/2019-11-03/calls-persist-for-negative-u-s-yields-even-as-fed-signals-pause?srnd=premium
Belly of curve could go below zero by 2021: BofA’s Braizinha
Moody’s Analytics also raises prospect of sub-zero yields
The Federal Reserve may be hinting at a pause in its policy easing, but Bruno Braizinha at Bank of America Corp. sees a risk that yields on some Treasuries will go negative by 2021 as the U.S. central bank cuts rates all the way to zero.
While that may seem like a remote scenario to some, the strategist says the market can’t ignore the possibility that 5- and 7-year yields -- both presently within a few basis points of 1.60% -- could fall below zero. He says now’s the time to hedge against that prospect.
Braizinha wrote about the risk of sub-1% yields in the U.S. just ahead of August’s historic Treasuries rally, which drove 10-year yields as low as 1.43% on Sept. 3. That rate has since rebounded to around 1.71%, but his central view is that the benchmark yield will go even lower -- to around 1.25% -- in the next three months. In addition to that, he also sees the Fed being forced to return to near-zero rates amid a deterioration in the American economy and an eventual realization by investors that a U.S.-China trade deal won’t be a panacea.
Yields in belly of Treasury curve have fallen over the past year
“It’s important to acknowledge those risks and not overlook these scenarios,” he said by phone. “All the positive sentiment on trade is fading, and what’s changed now is that it’s more likely that at some point the Fed is going to have to cut again.”
A day after the Fed signaled a pause on Oct. 30, yields plummeted across the curve. In Braizinha’s view, the moves reflected a bias that permeated the bond market based on expectations for worsening economic data, lower yields and a flatter curve.
Yields regained some of that ground on Friday amid stronger-than-expected American jobs data and positive developments on the U.S.-China trade relationship, although a poor reading on the Institute for Supply Management’s factory gauge created a slightly more mixed view.
To get to negative yields in the belly of the curve, Braizinha says the Fed would need to push its target to around zero -- from 1.50% to 1.75% currently -- like it did a decade ago in the midst of the global financial crisis. Rates on Treasuries out to around three years would then be “anchored around 10 basis points to 15 basis points” in his view, while demand for dollar duration would send 5- and 7-year yields negative.
The Bank of America analyst, who recommends betting on 30-year Treasuries in anticipation that yields will go much lower, is not alone in contemplating negative Treasury yields.
Ryan Sweet, head of monetary policy research at Moody’s Analytics, said he also sees a risk that Treasury yields could go below zero if the U.S. falls into recession. And, according to him, this could happen even if the Fed doesn’t cut its target below zero.
In the options market, meanwhile, some traders have been hedging in the past month against the possibility of U.S. policy rates heading to zero or even negative levels.
Bank of America currently expects one additional Fed rate cut in the first quarter and “there are still many hurdles to get to negative interest rate policy in the U.S.,” according to Braizinha. One of these is that “it is not clear that it worked as it was intended” in other economies.
“What I find more likely is that we reach a policy exhaustion point where the Fed cuts down to near zero, which requires only six 25-basis-point moves, and the curve continues to be pressured by lower long-term inflation expectations and global duration demand,” he said.
<<<
>>> Thank These Five Stocks as S&P 500 Reaches New Record
Apple, Microsoft, Visa, MasterCard and Oracle are buttressing a market with little breadth.
Bloomberg
By Robert Burgess
October 28, 2019
https://www.bloomberg.com/opinion/articles/2019-10-28/s-p-500-propelled-by-apple-microsoft-visa-mastercard-oracle?srnd=premium
If someone woke from a coma and saw that the S&P 500 Index was up 21% for the year and reaching a new record high on Monday, the immediate reaction would most likely be that everything is great. But that’s far from true.
The list of reasons stocks should be down is much longer than the one for why they should be up. The economy has slowed, and a majority of chief financial officers anticipate a recession within a year. Earnings have stopped growing, and estimates are being cut. Stock valuations are high. The U.S.-China trade war has not been resolved. Congress has started an impeachment inquiry against President Donald Trump. On the other hand, the Federal Reserve is easing monetary policy, but that’s only because the outlook has deteriorated.
So why are equities roaring ahead? The answer comes down to a handful of stocks: Apple Inc., Microsoft Corp., Visa Inc., MasterCard Inc. and Oracle Corp. Those five companies account for half of the S&P 500 tech sector, which has surged 30.2% for the year. Exclude that sector and the S&P 500 would be up only about 14%, according to DataTrek Research. That’s still good but nothing special when compared with the returns in the rest of the world, with the MSCI All-Country World Index excluding the U.S. having gained 12%.
Therein lies the hidden risk embedded in the market, which is that any missteps by any of these highfliers could spell doom for equities more broadly. It also underscores just how lacking in breadth this latest leg up has been. For one, the percentage of stocks on the New York Stock Exchange closing above their 200-day moving averages has dropped to 53% from 59% in mid-September.
This Is Animal Spirits?
Fewer equities are breaching important technical levels that would confirm broad strength
Not only that, but the spread between the share of S&P 500 members closing at 52-week highs and the share at 52-week lows has been in a general downtrend since June.
Downward Trend
Stocks reaching annual highs are barely exceeding those falling to lows
To be sure, it’s not unusual that a handful of stocks have led the broader market higher. Before this year, it was the FAANG group of stocks: Facebook Inc., Apple, Amazon.com Inc., Netflix Inc., Google parent Alphabet Inc. and a few others. A few years ago, AQR Capital Management’s co-founder and chief investment officer, Clifford Asness, published a paper examining the impact of individual stocks on the S&P 500 from 1994 to 2014. What he found was that while the S&P 500 rose 9.3% a year, the top 10 stocks accounted for 4.1 percentage points of that gain on average.
Then there’s the awkward fact that smaller stocks that make up the vast majority of the market are down about 11% from their records reached in August 2018 based on the S&P Small Cap 600 and Russell 2000 indexes.
Missing Out
Most stocks remain well below their previous records set in 2018
This stock market has delivered plenty of surprises, and betting against it has been a losing proposition. In January, when the S&P 500 was trading at about 2,600, the median estimate of about 25 Wall Street strategist surveyed by Bloomberg was for it to end the year at 2,913. It surpassed that level in April and ended Friday at 3,203. But those same strategists are more cautious, predicting the benchmark to drop to 3,000 by the end of the year.
Of course, they could raise their forecasts, but that would be awkward given the trend in profits and the slowing economy. Third-quarter earnings are tracking at a 3% decline from a year earlier, and forecasts for the fourth quarter have been cut to a gain of 1.2% from the 5.4% increase that was forecast at the end of July, according to Cantor Fitzgerald. The S&P 500’s price-to-earnings ratio, at just shy of 20 times, is the highest since last October, just as the benchmark was beginning a tumble that led to a 14% drop in the final three months of the year.
All that suggests investors need to look beyond the headlines about yet another record.
<<<
>>> Q4 market update: Late cycle and lower rates
Can interest rate cuts by central banks restart global growth despite trade tensions?
BY DIRK HOFSCHIRE, CFA, SVP; LISA EMSBO-MATTINGLY, DIRECTOR; JAKE WEINSTEIN, CFA | SENIOR ANALYST; AND RYAN CARRIGAN, CFA L ANALYST, ASSET ALLOCATION RESEARCH
FIDELITY VIEWPOINTS
10/11/2019
Key takeaways
The US is firmly in the late phase of the business cycle which is a time when stock market volatility typically increases.
Interest rate cuts by the Federal Reserve and other central banks have yet to reaccelerate slowing global economic growth.
Trade tensions between the US and China are continuing to create uncertainty which is slowing business investment.
Government bond yields are dropping and stocks are turning more volatile, so it’s important to have a diverse mix of investments.
During Q3, the Federal Reserve and other central banks eased monetary policy in an effort to counter flagging global-growth momentum. However, further escalation of the US-China trade conflict continued to weigh on confidence, and it remains unclear whether monetary easing alone is sufficient to catalyze economic acceleration. The mature global business cycle continues to warrant smaller cyclical allocation tilts.
See our interactive presentation for in-depth analysis.
With lackluster global growth and increased policy uncertainty, the continued drop in government bond yields during Q3 spurred gains across less risky bond categories, gold, and interest rate-sensitive equity sectors such as real estate investment trusts (REITs). Year-to-date returns for all major asset categories remained in positive territory, with US stock and bond markets registering strong gains.
Economy/macro backdrop: Mature US and global business cycles
The global business cycle continues to mature, with the US and most major economies in the late-cycle phase. Sagging trade and industrial activity continued to weigh on global growth, with the share of major countries with expanding manufacturing sectors dropping to its lowest level since 2012. This weakness occurred despite an upturn in our diffusion index of China's industrial production. For the first time in the past decade, China's stimulus measures and manufacturing upswing have failed to lift global trade and industrial activity. While China's monetary and fiscal policy easing has helped stabilize industrial activity, we believe high debt levels and US-China trade uncertainty supports our stance that material economic reacceleration remains unlikely.
The US is firmly in the late-cycle phase, but the economy remains supported by consumption, which represents around 70% of GDP. Historically, consumer spending and employment growth stay positive during the late cycle, typically not falling until the onset of recession. Several leading indicators suggest the labor market is nearing peak levels, including consumers’ extremely favorable assessment of the job market, which tends to be most elevated just prior to recession.
Ten-year US Treasury yields dropped due to a decline in both inflation expectations and real interest rates, with both measures decreasing to near multi-year lows. Yields on 10-year Treasurys remained below 3-month Treasurys, keeping the yield curve inverted. Curve inversions have preceded the past 7 recessions and may be interpreted as the market signaling weaker expectations relative to current conditions. The time between inversion and recession has varied considerably, however, and the curve also has flashed 2 "head fakes" in which expansion lasted for at least 2 more years.
Core inflation has been generally stable at about 2% in recent years, but tariff hikes have lately pushed goods prices upward, helping boost core CPI to a multi-year high. Tariffs also have negatively impacted demand—for example, last year's tariffs on washing machines both boosted prices and lowered consumption. The near-term inflation outlook remains balanced amid uncertain trade policy and downside economic risk.
We think global economic momentum has peaked and that trade-policy friction is negatively influencing capital expenditures. Global central banks lowered interest rates during Q3, and the Fed ended its balance-sheet drawdown while the European Central Bank (ECB) reinitiated quantitative easing. However, the global liquidity backdrop is much less favorable than it was in 2016–2017, with US Treasury increases of cash held at the Fed offsetting recent central-bank accommodation. Monetary policy may be showing its limitations, with a number of challenges blunting the effects of easing.
Asset markets: US assets led widespread rally
In Q3, equity sectors and factor segments that typically are less cyclical and may benefit from lower interest rates led the equity markets: Utilities, real estate, consumer staples, and minimum-volatility stocks fared best. Treasury bonds and other less risky debt types were the top performers among fixed income sectors. Gold was the best-performing commodity segment. Emerging-market equities struggled.
Returns for categories of assets -
Q3 (%) YTD (%)
Real estate stocks - 7.5, 27
Long government and credit bonds - 6.6, 20.9
US corporate bonds - 3, 12.6
Investment grade bonds - 2.3, 8.5
High yield bonds - 1.2, 11.5
US mid cap stocks - 0.5, 21.9
Gold - 4.5, 14.8
Commodities - (1.8), 3.1
US large cap stocks - 1.7, 20.6
US small cap stocks - (2.4), 14.2
Non-US small cap stocks - (0.4), 12.1
Non-US developed country stocks - (1.1), 12.8
Emerging market bonds - 1.3, 12.1
Emerging market stocks - (4.1), 5.9
US earnings growth continued to decelerate during Q3, after receiving a boost from corporate tax cuts in 2018. Meanwhile, non-US developed-market (DM) and emerging-market (EM) profit growth stayed in negative territory. Forward estimates point to market expectations of a convergence of global profit growth in the mid-single-digit range over the next 12 months.
Continued rising US stock prices pushed equity valuations further above the long-term US historical average this quarter, while trailing price-earnings (P/E) ratios for non-US developed and emerging markets remained below their respective long-term averages. Further, using 5-year peak inflation-adjusted earnings, DM and EM equity P/E ratios remained lower than those for the US, providing a relatively favorable long-term valuation backdrop for non-US stocks. After moving sideways during the first half of 2019, the US dollar appreciated during Q3, resulting in generally expensive valuations versus many of the world's major currencies.
In fixed income, modest inflation, flagging growth expectations, and the Fed's dovish shift pushed bond yields lower for the third quarter in a row. Credit spreads experienced some volatility but ended the quarter roughly unchanged. Many bond categories have dropped to the bottom-yield deciles relative to their own long-term histories. Credit spreads also are generally below their long-term averages.
Historically, the mid-cycle phase has tended to favor riskier asset classes and produce broad-based gains across most asset categories. Meanwhile, late cycle has produced the most mixed performance results of any business cycle phase. Another frequent feature of late cycle has been an overall more limited upside for a diversified portfolio, although returns for most asset categories have, on average, been positive.
<<<
>>> Markets: Late cycle and more volatile
Stick close to your long-term target asset mix and stay diversified.
Fidelity Investments
BY DIRK HOFSCHIRE, CFA, SVP; LISA EMSBO-MATTINGLY, DIRECTOR; JACOB WEINSTEIN, CFA, RESEARCH ANALYST, ASSET ALLOCATION RESEARCH AND CAIT DOURNEY, ANALYST
09/24/2019
Key takeaways
Around the world, most big economies are in the late phase of the business cycle.
We expect financial markets to become more volatile than they have been in recent years.
Central bank monetary policy may boost asset prices without necessarily stimulating global economic growth.
In this environment, prioritize portfolio diversification.
United States
The US is firmly in the late-cycle phase as evidenced by tight labor markets, challenged corporate profit margins, and a flat/inverted yield curve.
The US consumer remains solid amid low unemployment—a typical pattern during late cycle.
Corporate earnings growth has decelerated due largely to higher wages and a weak global backdrop.
The Federal Reserve (Fed) has started to ease monetary policy, although historically rate cuts have been less effective late in the economic cycle.
Global
The global business cycle continues to mature, with most major economies in the late-cycle phase and several appearing to be in an industrial production recession.
China's economy has stabilized as a result of the past year’s stimulus measures, but growth remains subdued and a reacceleration from its growth recession has remained elusive.
Rising trade tensions and higher tariffs, particularly between the US and China, have damaged corporate confidence and added to global-growth headwinds.
Overall, weaker global manufacturing and trade activity have shown few signs of abating, and it remains to be seen whether policy easing measures will prove sufficient to incite a sustained global reacceleration.
Asset allocation outlook
Consistent with a maturing business cycle, asset-class patterns may become less reliable, warranting smaller cyclical tilts and prioritization of portfolio diversification.
The move to a global monetary easing cycle may boost asset valuations and provide support for financial conditions in the near term, but heightened trade policy risks and a multitude of economic headwinds may blunt the ability of monetary easing to stimulate global growth.
Overall, we expect the late-cycle environment to provide more volatility and a less favorable risk-return profile for asset markets than during recent years.
Business cycle framework
The business cycle, which is the pattern of cyclical fluctuations in an economy over a few years, can influence asset returns over an intermediate-term horizon. Cyclical allocation tilts are only one investment tool, and any adjustments should be considered within the context of long-term portfolio construction principles and strategic asset allocation positioning.
The diagram above is a hypothetical illustration of the business cycle. There is not always a chronological, linear progression among the phases of the business cycle, and there have been cycles when the economy has skipped a phase or retraced an earlier one. *A growth recession is a significant decline in activity relative to a country's long-term economic potential. We use the "growth cycle" definition for most developing economies, such as China, because they tend to exhibit strong trend performance driven by rapid factor accumulation and increases in productivity, and the deviation from the trend tends to matter most for asset returns. We use the classic definition of recession, involving an outright contraction in economic activity, for developed economies.
Source: Fidelity Investments (AART), as of August 31, 2019.
<<<
Wow, silver resumes its climb, up almost 5% today. Gold and bonds also moving back up.
From a TA perspective, it looks like silver will soon be challenging its 2016 highs (20-21 area), and once those are taken out the new uptrend for silver will be confirmed.
The uptrend for gold was confirmed in June when it broke through its 2016,17,18 highs (~1370 area).
Considering the longer term predicament the Fed and economy is in (see last post), the tailwind for the metals should continue, and pullbacks can be considered buying opportunities (imo). Some headwinds for the metals (and bonds) could come from -
1) Trade war with China resolved
2) War with Iran receeds
3) US economy picks up
I would be buying any dips with the idea of holding gold/silver long term. The debt situation is past the point of no return, and the noose will gradually tighten on the dollar, with the Fed's policy options dwindling and eventually running out.
Not thrilled with these conclusions, but you have to be a realist. The question now is what allocation to give to gold - 10%, 20%, etc. I'll probably follow Rickards' basic recommendations.
Recent interview with Jim Rickards -
Since the Fed has failed in its attempt to normalize, it's time to start considering some endgame scenarios. The Fed still has some 'ammo', although limited -
Interest rates - the interest rate 'ammo' available to the Fed (approx 2%) will be used up quickly during the next recession. Historically a 3-4% drop in interest rates is required to get out of a recession, and we only have 2% available.
Fed's balance sheet - Looking at the Fed's balance sheet available for more QE, the big question is what will be the upper limit (6, 8, 10 trillion) before confidence is lost in the dollar? Currently the balance sits at approx $4 tril.
Even a mild recession will put us at ZIRP or even NIRP, and on the Fed's balance sheet side, they can probably expand from $4 tril to $6 tril without a run on the dollar. But how much higher than that before you reach the confidence limit for the dollar?
Bottom line, we can see where this is heading (SDR bailout), and the only real question is how long? The key factors will be -
1) The severity of the next recession
2) Whether there is an associated financial crisis
With all the Derivatives out there, some type of financial crisis wouldn't be surprising once stresses start to build. Just look at the past week, where the Fed was forced to pump $275 bil into the repo market over four days.
To delay the process, all sources of instability should be minimized. So resolve the China trade war, avoid war with Iran, etc.
Meanwhile for us investors -- gold (10%), cash (30%), hard assets, Treasury notes, and for stocks mainly focus on the resource sectors (gold mining, oil, water, land, etc).
Allocation strategy for 2020 -
It's pretty clear now that the 'sanity will prevail' idea can be permanently shelved when it comes to Trump. Even the idea that Trump will act in his own self interest (reelection) is in serious doubt.
Below are the reasons why Trump's kamikaze course will not abate until the 2020 election at the earliest (and why all we can do as investors is go to cash, bonds, gold, etc) -
Looking at the entities that could restrain/remove Trump -
1) Republican Party - they won't because they want to stay in power and believe Trump is their only chance. So they'll ride this horse for better or worse.
2) Democrat Party - like the Reps, all the Dems care about is regaining power. Since Trump is self destructing so spectacularly on his own, they can sit back and watch as he drives the US into recession. However, with such a lame lineup of candidates for 2020, the Dems have to worry that they'll still lose the election even if there's a recession.
3) Neocons - I think Trump has promised them action on Iran after the election, so the Neocon faction will just sit pat until then.
4) Deep State / Finance Oligarchy - this is the big question. If they are ready for the SDR transition, Trump can be used as the fall guy to induce the required crisis. Under Trump, the crisis will likely start in China, which may be the ideal scenario - to have China weakened heading into the SDR financial 'reset'.
If the Finance Oligarchy isn't ready for the SDR crisis, why aren't they doing more to reign in Trump's kamikaze tariff insanity? It could be that the deranged Trump has become uncontrollable by normal means, in which case extraordinary means would become necessary (?) Possible, but if the powers that be really wanted Trump to cease/desist on China, ultimately they could do it.
My conclusion - all us small fry investors can really do is to batten down the hatches and get into cash, bonds, and gold. For bonds, mainly Treasuries and high quality corporates (avoid junk bonds, leveraged loans). Stock exposure should be reduced toward the minimum allowed in one's asset allocation model.
This chart says it all -

And what it says is batten down the hatches for a recession. Unfortunately the Fed is no shape to deal with a recession, and the world's other central banks are in even worse shape - already near ZIRP or even in NIRP. The Fed balance is still bloated up near $4 tril, and the US is already running trillion plus budget deficits.
So..
What tools are available to deal with a big global recession? And what if the downturn morphs into a financial crisis? You're looking at an IMF bailout of the world with their SDRs. As Rickards says, the IMF has the only clean balance sheet left in the world.
The SDR system is what the global financial elites have been building to replace the current dollar reserve system. Whether they want the change to come now or later I'm not sure, but they don't want to get the blame for the crisis required to bring in the SDRs, and in Trump they have a convenient scapegoat. Dumbass Don walked right into it, both guns blazing.
>>> Swagger Seeping Out of Stocks as Bond Market Signals Get Louder
By Elena Popina and Sarah Ponczek
August 16, 2019
https://www.bloomberg.com/news/articles/2019-08-16/swagger-seeping-out-of-stocks-as-bond-market-signals-get-louder?srnd=premium
Equities have dropped and Treasuries gained for three weeks
Concern grows that companies will lose taste for investment
All year, whenever you felt like panicking over the bond market’s dismal message, you could find comfort in stocks, where optimism about the economy drove the biggest first-half gain since 1987.
That kind of solace is getting harder to find.
While a rousing rally took some of the sting out on Friday, it wasn’t enough to rescue the week for equities -- the third straight in which they’ve dropped while Treasuries soared. The stock index has lost 4.5% from its July 26 record and recently posted its two worst days of 2019. Bonds, meanwhile, saw their two best days, as buyers sought shelter from gathering clouds.
In short, if your biggest concern in 2019 was that signals sent by dueling rallies in stocks and bonds were in disagreement, you can stop worrying about that. And start worrying about what it means now that they agree.
“Concern about a recession is going up,” Michael O’Rourke, JonesTrading’s chief market strategist, said by phone. “Stocks are still up double-digits for the year, and we have the potential to decline further.”
Alignment in the markets’ messages has been building for a while. Using the biggest exchange-traded funds as proxies, equities and fixed income have now moved in the opposite direction for 16 straight weeks, the longest streak since 2012.

SPY and TLT have moved in different directions for 16 consecutive weeks
While a few down weeks have barely dented their year-to-date performance, U.S. equities face a lengthening list of problems. Beyond anxiety over plunging yields and the sight of central banks rushing to add stimulus, there’s still a trade war raging and the prospect that earnings growth will grind to zero in 2019. Leading the concerns this week was the yield curve inverting, when rates on longer-dated Treasuries slip below nearer ones. It’s a phenomenon with a nearly unblemished record of portending recessions.
“An inverted curve can signal concern over future growth, which could impact investment decisions and confidence,” said Chris Hyzy, chief investment officer at Bank of America Global Wealth & Investment Management. “The uncertainty over trade appears to be impacting some decisions in addition to concerns over slower growth and the inverted yield curve.”
The 2s10s yield curve inverted for the first time since 2007
In particular, with the bond market looming as a giant argument against taking on long-term risk, anxiety is starting to coalesce around anything that might imply weaker growth in the future. One of those is corporate investment, viewed as economic lifeblood without which a recession becomes harder to stop. Non-residential capital spending dropped 0.6% in the second quarter for the first time since 2015, data released last month showed. Spending on structures fell by the most since 2016 and outlays for intellectual property slowed by half.
Flattening return expectations could signal a world where executives become hesitant to borrow for new projects, concerned that by the time factories are built, growth will have slowed to a point that doesn’t justify the investment. Couple that with a trade war with China with the potential to snarl supply chains, and the reason for the anxiety becomes clear.
“Confidence is what really matters, and confidence has been hit with a trade war and growth uncertainty,” Sanford Bernstein’s Philipp Carlsson-Szlezak said. “As long as hiring continues and jobs are safe, they’ll keep spending and that’s what will help the economy, and the stock market, to tick along. At this point, you didn’t have a pick-up in capex that the cycle could rely on.”
<<<
GLDM - >>> Pinch Pennies With a New Gold ETF
Investopedia
BY TODD SHRIBER
Jun 25, 2019
https://www.investopedia.com/news/pinch-pennies-new-gold-etf/
Investors looking for a more cost-effective avenue for investing in gold have a new exchange-traded fund (ETF) to consider following Tuesday's debut of the SPDR Gold MiniShares Trust (GLDM). The SPDR Gold MiniShares Trust is the latest product in the long-running partnership between State Street Global Advisors (SSgA) and the World Gold Council (WGC), the groups behind the SPDR Gold Shares (GLD). GLD is the largest gold ETF in the world by assets and the largest commodities ETF trading in the U.S.
"GLDM will be initially listed at a per-share trading price of 1/100th of an ounce of gold, as represented by the LBMA Gold Price PM," according to a statement issued by SSgA and the WGC. By comparison, ownership of one GLD share represents one-tenth of an ounce of gold. The differences do not end there. GLDM's annual expense ratio is just 0.18%, or $18 on a $10,000 position. That is less than half the 0.40% annual fee found on GLD. That makes GLDM the least expensive gold ETF currently trading in the U.S.
"GLDM offers the lowest available total expense ratio among all gold exchange-traded products, with a net and gross expense ratio of 0.18 percent," according to the statement. (See also: Fee War Makes Its Way to Gold ETFs.)
While GLD is the world's largest ETF backed by physical holdings of gold, the ETF faces competition from lower-cost rivals. For example, the iShares Gold Trust (IAU) has an annual fee of just 0.25%. As has been proven time and again in the world of ETFs, fees matter. This year, investors have pulled $620.22 million from GLD, but IAU has seen $1.26 billion in inflows.
Due to its robust liquidity and tight bid/ask spreads, GLD is a favorite commodities ETF among professional traders and institutional investors, likely explaining why SSgA and the WGC opted to introduce GLDM rather than paring GLD's expense ratio.
"For many investors, costs associated with buying and selling the shares in the secondary market and the payment of GLDM's ongoing expenses will be lower than the costs associated with buying and selling gold bullion and storing and insuring gold bullion in a traditional allocated gold bullion account," according to SSgA. (For additional reading, check out: Fees Matter With Gold ETFs, Too.)
<<<
>>> Gold ETFs Rally As Demand Jumps
ETF.com
Sumit Roy
August 5, 2019
https://finance.yahoo.com/news/gold-etfs-rally-demand-jumps-124500642.html
Treasury bonds aren’t the only safe havens rallying this year. As trade war and global growth concerns have continually flared throughout the year, another safety play is doing just as well: gold. Prices for the yellow metal currently hover near $1,450/oz, a level not seen in six years.
Investors have taken notice. The SPDR Gold Trust (GLD), the $38 billion gold ETF, is up 12.5% so far this year and has taken in $1.7 billion in fresh cash from investors. The No. 2 gold ETF on the market, the iShares Gold Trust (IAU), has taken in $1.3 billion in the same period.
At the same time, the SPDR Gold MiniShares Trust (GLDM) and the GraniteShares Gold Trust (BAR) have gathered a combined $600 million. The two ETFs offer some of the cheapest exposure to gold out there, with annual fees of 0.18% or less.
Zero Yield Looks Good
It is clear why investors have taken a liking to gold this year. Bond yields around the globe are at or near record lows, and could move even lower if central banks continue to cut interest rates. Bloomberg estimates that $14 trillion of debt in the world is yielding less than zero, or nearly 26% of the market.
It’s a bizarre situation, and makes gold look much more appealing by comparison. When investors literally have to pay to lend money, gold’s “zero yield” is downright attractive.
Indeed, that is probably why demand for gold ETFs in Europe, where government bond yields are broadly negative, has been even stronger than in the U.S, where rates are still positive. The World Gold Council estimates that inflows for European gold ETFs totaled $3.9 billion as of the end of June.
Separate data from Bloomberg shows that total holdings of gold in ETFs stood at 75.6 million troy ounces as of Aug. 1, the highest in six years, and only 8.6% below the all-time high set in 2012.
2 Pillars Driving Gold
Strong demand for gold ETFs is one pillar driving overall gold demand to its highest level in three years. It’s also helped offset tepid physical investment demand for gold bars and coins (which fell to its lowest point since 2009 during the first half of 2019), and surging gold supply (which reached the highest level since 2016, according to the World Gold Council).
The other big factor driving gold demand higher this year has been central bank buying. Gold demand from these institutions surged 57% year over year during the first half of 2019, on pace for the strongest year in decades.
The total net purchases of 374.1 metric tons by central banks equaled 17.1% of total global gold demand between January and June.
“Sluggishness, exacerbated by trade and geopolitical tensions, continued to cast a dark cloud over the global economy,” wrote the WGC. “Central banks, like other investors, sought safety in gold as they looked to protect themselves in the face of many looming risks.”
Poland, Russia, China, India and Turkey were among the biggest gold-buying central banks this year.
Outlook
Looking ahead, the gold rally will depend on the factors that have lifted it to where it is now. ETF demand may largely be driven by investors’ appetite for portfolio hedging against an economic downturn or for safe-haven alternatives to low-yielding bonds.
Meanwhile, central bank buying may be influenced by the relations between the U.S. and other countries. Tensions between the U.S. and China, the U.S. and Russia, etc., may push those countries to diversify their dollar-denominated foreign exchange reserves into gold.
<<<
>>> A Decade of Low Interest Rates Is Changing Everything
Cheap money has transformed the world of borrowers, savers, bankers, money managers, and retirees.
Bloomberg
By Liz McCormick
July 23, 2019
https://www.bloomberg.com/news/articles/2019-07-23/a-decade-of-low-interest-rates-is-changing-everything?srnd=premium
It’s hard to wrap your head around just how low U.S. interest and bond yields are—still are—a decade after the Great Recession ended. Year after year, prognosticators said that rates were bound to go back up soon: Just be ready. That exercise has proved to be like waiting for Godot.
In 2018, Jamie Dimon, chief executive officer of JPMorgan Chase & Co., put Americans on alert to the likelihood of higher interest rates. He said the global benchmark for longer-term rates, the yield on a 10-year Treasury bond, could go above 5%. Right now it’s just a hair above 2%. Thirty-year mortgage rates are a fraction of long-run averages, and companies too are paying very little to borrow. All that cheap money has been helping the economy along. On the other side of the ledger, bank depositors are getting paid only a fraction of 1% on their savings.
The longevity of low rates has upended long-standing assumptions about money and reshaped a generation of investors, traders, savers, and policymakers. The Federal Reserve has tried to push the U.S. into a higher-rate regime, raising rates nine times since 2015, when the key short-term rate was near zero. But now the central bank appears ready to reverse course and start cutting again when it meets at the end of July. “This is the new abnormal,” says David Kelly, chief global strategist at JPMorgan Asset Management, which oversees $1.8 trillion. “Normally when you are in this phase of an expansion, you have a rising inflation problem, a Federal Reserve overtightening to slow the economy, and businesses that can’t afford to borrow. None of that is true right now.”
Investors are betting that a quarter-percentage-point rate cut is all but certain, according to prices in the futures market. Fed Chair Jerome Powell reinforced those views with remarks to Congress on July 10 and 11. He cited rising global risks, low inflation, and weakening business investment and manufacturing. Depressed U.S. rates come as other central banks, including the European Central Bank, have turned more dovish—even with their rates already set below zero.
relates to A Decade of Low Interest Rates Is Changing Everything
Fed chairman Jerome Powell.PHOTOGRAPHER: ANDREW HARRER/BLOOMBERG
Anne Walsh, chief investment officer of fixed income at Guggenheim Partners, says there’s been “a paradigm shift of epic proportion for investors.” Not only are short-term rates low, but long-dated bond rates are minuscule, too, suggesting that investors see little likelihood of rates—and the economic conditions they reflect—changing anytime soon. (Bonds’ yields fall as their prices rise.)
Borrowers of all kinds have been clear benefactors of this sea change, with many nations and companies locking in low rates for as long as a century. Belgium and Ireland have sold 100-year bonds, as did Austria this year at a yield of 1.171%. In 2015, Microsoft Corp. sold 40-year bonds and the University of California issued 100-year debt. Subdued rates have also buffered the U.S. Treasury from rising interest costs on the federal debt.
For banks, the squeeze in long-term rates isn’t ideal. That’s because they tend to fund long-term investments with short-term debt, so they prosper when long-run rates are significantly higher than short ones. In the U.S., banks have still been able to profit, with the top five firms cracking $30 billion in quarterly earnings for the first time. But some big commercial banks have warned that lower interest rates are weighing on their outlooks for revenues from lending.
Individuals have had to get used to earning paltry rates. The national average rate on savings accounts is 0.10%, little changed from four years ago and down from 0.30% in 2009, according to data from Bankrate.com. In 2000, well before the financial crisis, the rate was 1.73%. “We never got to the would-be promised land with respect to higher rates,” says Mark Hamrick, senior economic analyst at Bankrate.com. “This has been the difference for savers between having more money and not.”
The problem is the same for institutions that manage savings on behalf of others. Pension funds, overseeing trillions in retirees’ future cash, have been ratcheting down return expectations. The 30-year Treasury bond, a favored debt security, yields about 2.5%—compared with an average 6.5% since the 1970s. Even a record rise in stock prices hasn’t solved the low-return problem for pension funds, because many of them cut their allocations to equities after the financial crisis. Ben Meng, chief investment officer of the California Public Employees’ Retirement System, said in June that the expected return for his pension portfolio over the next 10 years would be 6.1%, down from a previous target of 7%.
Where low rates really bite isn’t in current returns but in the future gains investors can reasonably expect. Interest rates set a kind of baseline for the return on all assets. As they fall, bond values rise and stocks often do, too. But once rates have settled at or near rock bottom, there’s less room for that kind of price appreciation.
All this has sent investors looking under every available rock for more return—even if it means taking more risk. The fear is this could lead to the formation of bubbles and eventually destabilize the financial system. “Institutional investors are out there in the great truffle hunt for yield,” says Walsh, at Guggenheim. “This is particularly true of large institutions, like banks and insurance companies and pension funds. These firms are searching for yield and potentially taking on unintended risk because that is what they need to do.”
It’s a global phenomenon. Japan Post Bank Co., the banking unit of Japan Post Holdings Co., a publicly traded company that’s majority-owned by the government, held $577 billion in bonds outside its low-yielding home market in March. Norinchukin Bank, a cooperative that invests the deposits of millions of Japanese farmers and fishermen, has $69 billion in collateralized loan obligations—essentially, loans to companies with less-than-stellar credit—in the U.S. and Europe.
While some Fed officials wish they could get back to more-normal rates, so they have more room to ease again in the future if they need to fight a downturn or fresh financial crisis, they seem to have their hands tied. For all the problems low rates may cause, policymakers see them as a stimulant to growth. Although unemployment rates are very low, the economy took an agonizingly long time to recover from the financial crisis. And now a slowdown in global growth and headwinds from Trump’s trade war have made risks to U.S. output too strong to ignore.
This has some wondering if we’ve been thinking about the economy all wrong. “The traditionalist views on monetary policy and monetarism are really being questioned,” says Mark Haefele, chief investment officer at UBS Global Wealth Management, referring to to the notion that central banks always have the ability to juice the economy—or put the brakes on it—when needed. “That has led to a wide range of alternative theories including Modern Monetary Theory, and just how to re-stimulate growth.” According to MMT, for example, government policymakers should be willing to run bigger deficits, at least until a boom in demand causes inflation to kick in.
The surprising persistence of low rates has even quietly reordered the hierarchy on Wall Street. Hedge fund managers may still be glamorous on shows like Billions, but in real life they’ve had to fight to retain clients. Partly that’s because many hedge fund managers thrive on volatility, and in a world where the dreaded spike in interest rates has never arrived, there’s been too little of that for them. The long fall in rates has made it easier so far to earn money with simple investments such as stock and bond index funds. Meanwhile, cheap financing costs and rising asset values have been a boon for private equity firms. Investors have committed about $4 trillion to them in the last decade, according to data from research firm Preqin Ltd.
In 2009, bond powerhouse Pacific Investment Management Co. saw all this coming, when they dubbed their multiyear investment outlook “the new normal” and predicted lower long-term yields. They saw the same issues the Fed and central bankers around the world are grappling with now: slow growth, a combination of technological innovation and low-cost global labor that eases inflationary pressure, and a glut of savings as the populations of rich countries age. Looking ahead, with many of those 2009 factors remaining, “the new wrinkle is concern around global trade and countries looking more inward,” Pimco Group Chief Investment Officer Dan Ivascyn says. “Yields can absolutely go a lot lower.”
<<<
Looking at that TMC vrs GDP chart (reportedly Buffett's favorite metric for determining overall market valuations), the next recession should bring it back down from 140 toward the mean of 80. A recession is overdue and could come next year, even with the Fed now in dovish mode and trying engineer a soft landing. But that chart speaks volumes, and the fact that Buffett uses it also speaks volumes.
John Bogle said that his personal 'most bearish' asset allocation was 50/50 stocks to bonds (he would normally be 70% or 80% in stocks). Adjusting the asset allocation is about as close as Bogle would ever come to market timing, and because stocks have a much higher return over the long haul, avoiding stocks completely is a very bad idea. As we know, Bogle was strongly against market timing and trying to pick individual stocks.
>>> One of Warren Buffet's favorite metrics is flashing red — a sign that corporate profits are due for a hit
Fortune
by Shawn Tully
7-17-19
https://www.msn.com/en-us/money/savingandinvesting/one-of-warren-buffets-favorite-metrics-is-flashing-red-%e2%80%94-a-sign-that-corporate-profits-are-due-for-a-hit/ar-AAEtoGA?li=BBnb7Kz&ocid=mailsignout#page=2
Here's a crucial question for investors that the Wall Street crowd seldom addresses: Can corporate profits keep booming by growing faster than the economy? Is this the new normal, or will the GDP-gobbling trend reverse, as it always has in the past, turning today's record-shattering rally into a rout?
Shareholders beware. It's the unhinging of profits from the overall economy that has been propelling stock prices, and that dynamic is now in danger. Either the normal ebb and flow of markets will pull equity values back to their traditional share of GDP, or Congress is likely to do the job by attacking Big Tech and mandating that workers get a lot more of the bounty now flowing to shareholders. Either way, America's companies and its economy are one in the same. Over the long-term, they need to move in tandem. And if they stray too far apart, getting back to balance can pummel share prices.
The S&P 500's fantastic performance since late 2016 is all about earnings. Since the fourth quarter of that year, profits, based on the trailing twelves months of GAAP earnings, have jumped 41% to a blowout record of $134.39 per share. In that period, share prices have followed earnings like a postage stamp on a letter, rising precisely the same number to just over 3000. That's because investors are awarding shares a consistent P/E multiple in the 22 to 24 range.
But it's critical to assess whether or not a profit bubble has driven shares to unsustainably high prices.
To gauge if that's happened, let's examine one of the best measures of where stocks stand on the continuum from excessively cheap to dangerously expensive. It's the ratio of Total Market Cap (TMC), the value of all U.S. publicly traded companies, versus GDP, the value of all goods and services produced annually within our borders. Put simply, it shows the dollar size of the equity market as a share of the economy.

If the value of equities represents a far bigger than average share of national income, it probably means that epic earnings are devouring a much bigger share of national income than usual, leaving less for wages. That's certainly the case today. In the past, the gravitational force of competition for both goods and labor has always restored balance by curbing excessive profits, and in most cases, driving down stock prices.
The TMC to GDP ratio is a favorite yardstick of Warren Buffett, who's stated, that "it's probably the best measure of where valuations stand at any given moment." (We'll refer to the measure as the "cap ratio.")
Today, the value of all stocks to national income stands at 146.4. That's the second highest reading in the past half-century, exceeded only by the 148.5 posted at the peak of the dot.com bubble on March 30, 2000. The cap ratio has averaged around 80 over the past decade, so it now exceeds that benchmark by 80%.
The cap ratio has varied widely over the past five decades, but typically returns to that reading of 80 after spiking well above, and plunging far below, that mean. By definition, over each period the ratio starts and ends at 80, earnings simply grow with GDP. (We'll express GDP in 'nominal,' not inflation-adjusted terms.) Still, it's informative to study the careening course in between.
We'll start at the 80 mark reached at the start of 1971. The cap ratio fell as low as 35 in the deep 1982 recession, and generally stayed below 50 from 1976 to 1986. It didn't get back to 80 until the end of 1995, an interlude of 25 years. Over that period, the S&P 500 rose on average 7.3% a year, reflecting economic growth inflated by high inflation from the oil shock of the 1970s and early 1980s.
From that 80 reading at the end of 1995, through March 30 of 2000, the cap ratio went wild, jumping 86% to that record level of almost 150 at the height of the internet craze. Then, gravity took over, and by April of 2003, the "cap" had crashed back to 80. Over that 7-plus year period, the S&P 500 rose by a more or less normal 5.6%, half as fast as in the past half-decade, once again, tracking GDP.
From the 80 reading in early 2003, the ratio plunged to the low 50s during the 2009 financial crisis, and didn't hit 80 again until October of 2011. Over those seven-and-a-half years, the S&P gained just 3.1% annually, as cratering home prices hobbled the economy.
Since returning to a "normal" level in late 2011, the cap ratio soared hockey-stick style, hitting the current 146.2 while suffering only minor blips along the way. Over those 7 years and 9 months, GDP rose 35%, from $15.6 trillion to $21.1 trillion. Total market cap leaped from $12.6 trillion to $3.014 trillion, or 148%. The S&P 500 delivered annual gains of 11%, while national income rose less than half as fast, by 4%.
Put simply, companies cut back on workers, held down wages, feasted from low interest rates on their debt, and otherwise benefited from a perfect calm for profits. And those trends totally trumped mediocre economic growth.
Two additional measures are flashing red. I often interviewed Milton Friedman, the legendary economist, before his death in 2006. Friedman told me that "in the long term, earnings cannot remain above their historical average as a share of national income." The Nobel laureate also declared that although profit performance determines companies' values over lengthy periods, "markets in the short term are far from 'efficient,'" meaning that equity prices can vary significantly from the enterprises' underlying value.
Today, according to the St. Louis Federal Reserve, corporate profits account for 9.2% of GDP. That's one-third higher than the half-century average of 7%. Since profits normally "revert to the mean" a la Friedman, that gap is destined to shrink. Operating margins also look unsustainably high. According to S&P, the figure for the S&P 500 averaged 11.25% over the past four quarters, 25% above the average of 9% posted in the previous 30 quarters.
It's conceivable that our economy really has changed, as the break-up-tech crowd in Congress argues, and that internet is enabling tech giants to operate as monopolies. That's the position adopted by a number of influential economists, including former Treasury Secretary Larry Summers. Another possibility: Because they're so profitable, these players are prime targets by hungry startups that will eventually erode their profitability.
The best bet is that equity valuations return to a more normal share of national income. The past few years look like the kind of crazy uncoupling that happens every couple of decades, not a structural downshift from the world's most competitive market to a network of cartels.
The market hasn't failed to rein in runaway profits yet, and it won't fail this time.
<<<
Gold's role in asset allocation -
Trying to figure out where gold 'should' be trading is tough since central banks have routinely suppressed the price to make their own unbacked fiat currencies look better/less bad. And China has possibly been suppressing the gold price in order to continue accumulating on the cheap.
As Jim Rickards points out, gold itself isn't really good for very much except as money, or as a backing for money. Countries like China and Russia have been aggressively building up their gold reserves over the past decade for a reason. When the coming financial reset comes (SDR), having large gold reserves will give a country a strong place at the global 'dinner table'.
There's a good chance the SDR will need to be partially backed by gold, at least in the beginning. Rickards does the math, and to provide a 40% backing would put the gold price at approx $10,000/ounce. During the transition to the SDR, US paper assets like stocks/bonds will be hit big time. Rickards says the US standard of living could drop 60% overnight as the dollar loses its role as the world's reserve currency to the SDR. The dollar will become just another 'local' currency for use within the US.
Rickards recommends investors have 10% in physical gold as disaster insurance. You hope the gold doesn't do well since that means your paper investments are still doing OK. In a $1 mil portfolio with $100 K in gold (70 ounces), $200 K in cash, $350 K in stocks, $350 K in bonds, if the stocks and bonds dropped 50% and gold went to $10,000/oz, your portfolio would be worth $1.25 mil instead of the $600 K it would be worth without the gold.
So think of gold as portfolio insurance, a diversification tool. You don't want a huge position in gold, but 10% could save the day when the dollar system unravels, as it eventually will. The global finance 'oligarchy' have been preparing the way for the SDR for a long time. They know the US dollar won't be suitable as the world's reserve forever, and the SDR has many advantages.
>>> Sector investing using the business cycle
It may be possible to enhance returns over an intermediate time horizon.
FIDELITY VIEWPOINTS
5/31/2019
https://www.fidelity.com/viewpoints/investing-ideas/sector-investing-business-cycle?ccsource=email_weekly
Key takeaways
The business cycle can be a determinant of sector performance over the intermediate term.
The phases of the economy provide a framework for sector allocation.
For example, the consumer discretionary and industrials sectors tend to outperform in the early cycle.
Over the intermediate term, asset performance is often driven largely by cyclical factors tied to the state of the economy, such as corporate earnings, interest rates, and inflation. The business cycle, which encompasses the cyclical fluctuations in an economy over many months or a few years, can therefore be a critical determinant of equity market returns and the performance of equity sectors. This article demonstrates Fidelity’s business cycle approach to sector investing, and how it potentially can enhance returns over an intermediate time horizon.
Asset allocation framework
Fidelity’s Asset Allocation Research Team (AART) conducts economic, fundamental, and quantitative research to produce asset allocation recommendations for Fidelity’s portfolio managers and investment teams. Our framework begins with the premise that long-term historical averages provide a reasonable baseline for portfolio allocations. However, over shorter time horizons—30 years or less—asset price fluctuations are driven by a confluence of various short-, intermediate-, and long-term factors that may cause performance to deviate significantly from historical averages. For this reason, incorporating a framework that analyzes underlying factors and trends among the following 3 temporal segments can be an effective asset allocation approach: tactical (1–12 months), business cycle (1–10 years), and secular (10–30 years).
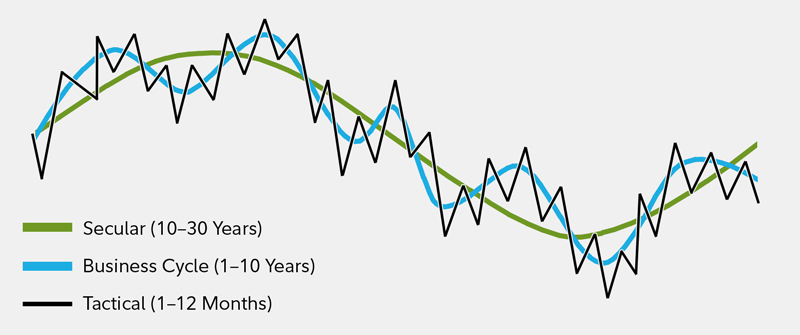
Asset performance is driven by a confluence of various short-, intermediate-, and long-term factors
This chart shows that asset performance is driven by a confluence of various short-, intermediate-, and long-term factors.
For illustrative purposes only. Source: Fidelity Investments, Asset Allocation Research Team (AART).
Understanding business cycle phases
Every business cycle is different in its own way, but certain patterns have tended to repeat themselves over time. Fluctuations in the business cycle are essentially distinct changes in the rate of growth in economic activity, particularly changes in 3 key cycles—the corporate profit cycle, the credit cycle, and the inventory cycle—as well as changes in the employment backdrop and monetary policy. While unforeseen macroeconomic events or shocks can sometimes disrupt a trend, changes in these key indicators historically have provided a relatively reliable guide to recognizing the different phases of an economic cycle. Our quantitatively backed, probabilistic approach helps in identifying, with a reasonable degree of confidence, the state of the business cycle at different points in time. Specifically, there are 4 distinct phases of a typical business cycle (see chart).
Early-cycle phase: Generally, a sharp recovery from recession, marked by an inflection from negative to positive growth in economic activity (e.g., gross domestic product, industrial production), then an accelerating growth rate. Credit conditions stop tightening amid easy monetary policy, creating a healthy environment for rapid margin expansion and profit growth. Business inventories are low, while sales growth improves significantly.
Mid-cycle phase: Typically the longest phase of the business cycle. The mid-cycle is characterized by a positive but more moderate rate of growth than that experienced during the early-cycle phase. Economic activity gathers momentum, credit growth becomes strong, and profitability is healthy against an accommodative—though increasingly neutral—monetary policy backdrop. Inventories and sales grow, reaching equilibrium relative to each other.
Late-cycle phase: Often coincides with peak economic activity, implying that the rate of growth remains positive but slows. A typical late-cycle phase may be characteristic as an overheating stage for the economy when capacity becomes constrained, which leads to rising inflationary pressures. While rates of inflation are not always high, rising inflationary pressures and a tight labor market tend to crimp profit margins and lead to tighter monetary policy.
Recession phase: Features a contraction in economic activity. Corporate profits decline and credit is scarce for all economic actors. Monetary policy becomes more accommodative and inventories gradually fall despite low sales levels, setting up for the next recovery.
The performance of economically sensitive assets such as stocks tends to be the strongest during the early phase of the business cycle, when growth is rising at an accelerating rate, then moderates through the other phases until returns generally decline during the recession. In contrast, more defensive assets such as Treasury bonds typically experience the opposite pattern, enjoying their highest returns relative to stocks during a recession, and their worst performance during the early cycle.
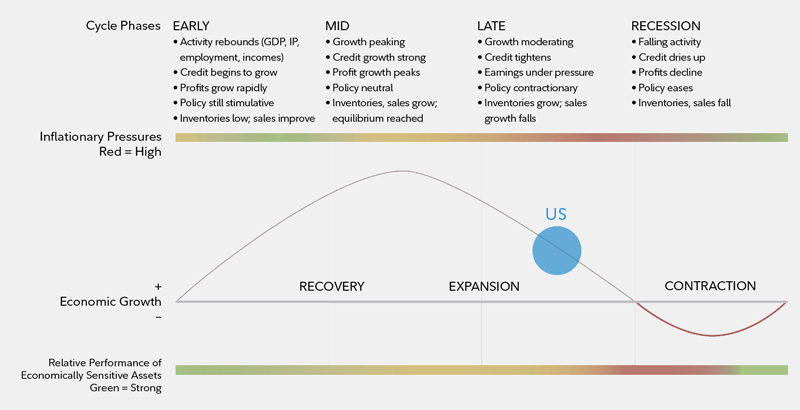
The business cycle has 4 distinct phases. The US is firmly in the late cycle as of 2019.
This graphic shows that the US is firmly in the late cycle as of 2019.
Note: The diagram above is a hypothetical illustration of the business cycle. There is not always a chronological, linear progression among the phases of the business cycle, and there have been cycles when the economy has skipped a phase or retraced an earlier one. Economically sensitive assets include stocks and high-yield corporate bonds, while less economically sensitive assets include Treasury bonds and cash. We use the classic definition of recession, involving an outright contraction in economic activity, for developed economies. Source: Fidelity Investments (AART), as of March 31, 2019.
Equity sector performance patterns
Historical analysis of the cycles since 1962 shows that the relative performance of equity market sectors has tended to rotate as the overall economy shifts from one stage of the business cycle to the next, with different sectors assuming performance leadership in different economic phases.1 Due to structural shifts in the economy, technological innovation, varying regulatory backdrops, and other factors, no one sector has behaved uniformly for every business cycle. While it is important to note outperformance, it is also helpful to recognize sectors with consistent underperformance. Knowing which sectors of the market to reduce exposure to can be just as useful as knowing which tend to have the most robust outperformance.
Early-cycle phase
Historically, the early-cycle phase has featured the highest absolute performance. Since 1962, the broader stock market has produced an average total return of more than 20% per year during this phase, and its average length has been roughly one year. On a relative basis, sectors that typically benefit most from a backdrop of low interest rates and the first signs of economic improvement have tended to lead the broader market’s advance. Specifically, interest-rate-sensitive sectors—such as consumer discretionary, financials, and real estate—historically have outperformed the broader market (see chart). These sectors have performed well, due in part to industries within the sectors that typically benefit from increased borrowing, including diversified financials and consumer-linked industries such as autos and household durables in consumer discretionary.
Elsewhere, economically sensitive sectors—such as industrials and information technology—have been boosted by shifts from recession to recovery. For example, the industrials sector has some industries—such as transportation and capital goods—in which stock prices often have rallied in anticipation of economic recovery. Information technology and materials stocks typically have been aided by renewed expectations for consumer and corporate spending strength.
Laggards of the early-cycle phase include communication services and utilities, which generally are more defensive in nature due to fairly persistent demand across all stages of the cycle. Energy sector stocks also have lagged during the early phase, as inflationary pressures—and thus energy prices—tend to be lower during a recovery from recession. From a performance consistency perspective, consumer discretionary stocks have beaten the broader market in every early-cycle phase since 1962, while industrials also have exhibited impressive cycle hit rates. The financials and information technology sectors both have had healthy average and median relative performance, though their low hit rates are due in part to the diversity of their underlying industries. The communication services sector has historically underperformed in the early-cycle phase, but its evolving mix of industries provides less confidence in the persistence of this pattern moving forward.
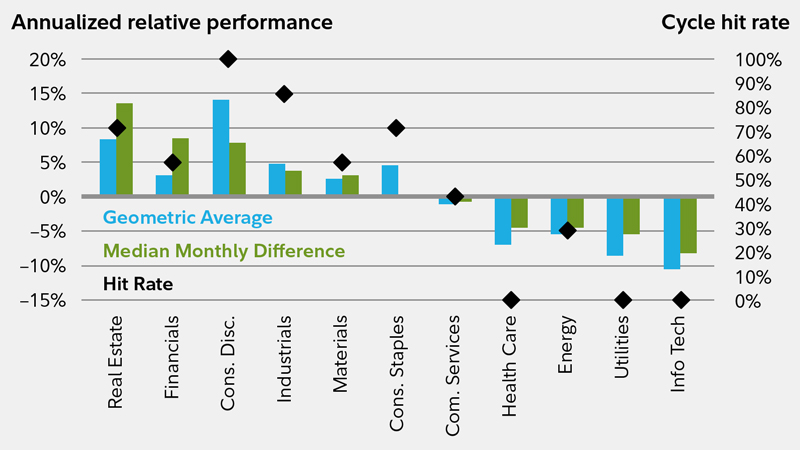
Sectors that have performed well in the early cycle are interest-rate sensitive and economically sensitive sectors
This chart shows sectors that have performed well in the early cycle.
Includes equity market returns from 1962 through 2016. Returns are represented by the top 3000 US stocks ranked by market capitalization. Sectors as defined by GICS. Source: Fidelity Investments (AART), as of March 31, 2019. Past performance is no guarantee of future results.
Mid-cycle phase
As the economy moves beyond its initial stage of recovery and as growth rates moderate, the leadership of interest-rate-sensitive sectors typically has tapered. At this point in the cycle, economically sensitive sectors still have performed well, but a shift has often taken place toward some industries that see a peak in demand for their products or services only after the expansion has become more firmly entrenched. Average annual stock market performance has tended to be fairly strong (roughly 15%), though not to the same degree as in the early-cycle phase. In addition, the average mid-cycle phase of the business cycle tends to be significantly longer than any other stage (roughly 3.5 years), and this phase is also when most stock market corrections have taken place. For this reason, sector leadership has rotated frequently, resulting in the smallest sector-performance differentiation of any business cycle phase. No sector has outperformed or underperformed the broader market more than 75% of the time, and the magnitude of the relative performance has been modest compared with the other 3 phases.
Information technology has been the best performer of all the sectors during this phase, having certain industries—such as semiconductors and hardware—that typically pick up momentum once companies gain more confidence in the stability of an economic recovery and are more willing to make capital expenditures (see chart). We also expect the new communication services sector to outperform during the mid-cycle phase, largely due to the strength of the media industry at this point in the cycle.
From an underperformance perspective, the materials and utilities sectors have lagged by the greatest magnitude. Due to the lack of clear sector leadership, the mid-cycle phase is a market environment in which investors may want to consider keeping their sector bets to a minimum while employing other approaches to generate additional active opportunities.
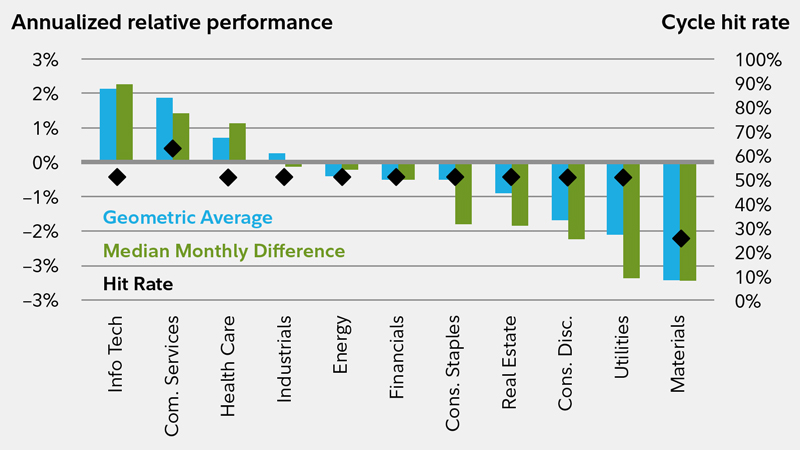
Sector leadership has rotated frequently in the mid-cycle phase, resulting in the smallest sector performance differentiation of any business cycle phase
This chart shows how sector leadership has rotated frequently in the mid-cycle phase.
Sectors as defined by GICS. Source: Fidelity Investments (AART), as of March 31, 2019. Past performance is no guarantee of future results.
Late-cycle phase
The late-cycle phase has had an average duration of roughly a year and a half, and overall stock market performance has averaged 6% on an annualized basis. As the economic recovery matures, the energy and materials sectors, whose fate is closely tied to the prices of raw materials, previously have done well as inflationary pressures build and the late-cycle economic expansion helps maintain solid demand (see next chart below).
Elsewhere, as investors begin to glimpse signs of an economic slowdown, defensive-oriented sectors—those in which revenues are tied more to basic needs and are less economically sensitive, particularly health care, but also consumer staples and utilities—generally have performed well. Looking across all 3 analytical measures, the energy sector has seen the most convincing patterns of outperformance in the late cycle, with high average and median relative performance along with a high cycle hit rate.
Information technology and consumer discretionary stocks have lagged most often, tending to suffer the most during this phase, as inflationary pressures crimp profit margins and investors move away from the most economically sensitive areas.
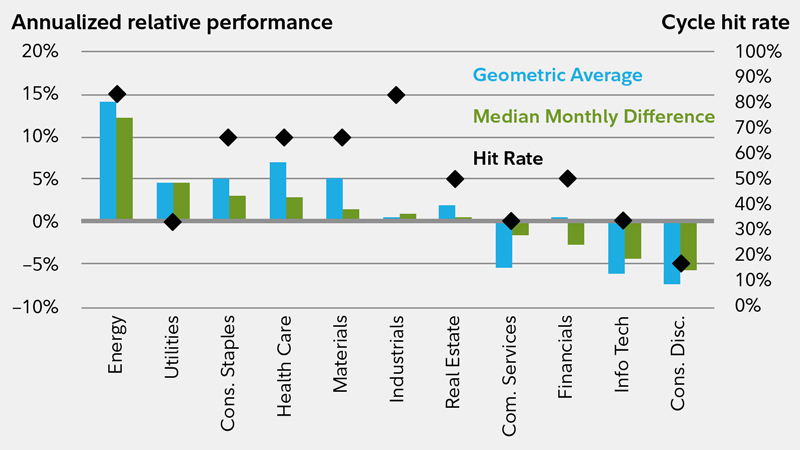
As the economic recovery matures, the materials and energy sectors have typically performed well, as have defensive-oriented sectors
This chart shows which sectors have performed well as the economic recovery matures.
Sectors as defined by GICS. Source: Fidelity Investments (AART), as of March 31, 2019. Past performance is no guarantee of future results.
Recession phase
The recession phase has historically been the shortest, lasting slightly less than a year on average—and the broader market has performed poorly during this phase (-15% average annual return). As economic growth stalls and contracts, sectors that are more economically sensitive fall out of favor, and those that are defensively oriented move to the front of the performance line. These less economically sensitive sectors, including consumer staples, utilities, and health care, are dominated by industries that produce items such as toothpaste, electricity, and prescription drugs, which consumers are less likely to cut back on during a recession (see next chart below). These sectors’ profits are likely to be more stable than those in other sectors in a contracting economy. The consumer staples sector has a perfect track record of outperforming the broader market throughout the entire recession phase, while utilities and health care are frequent outperformers. High-dividend yields provided by utility and telecom companies also have helped these sectors hold up relatively well during recessions. On the downside, economically and interest-rate-sensitive sectors— such as industrials, information technology, and real estate—typically have underperformed the broader market during this phase.
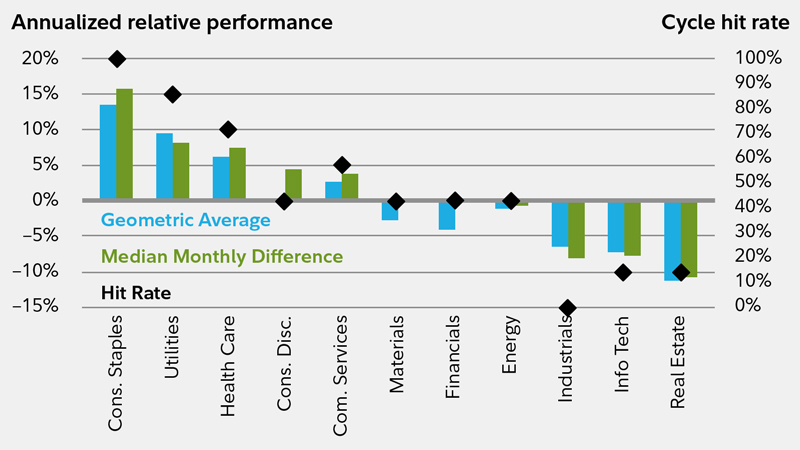
This chart shows that defensive-oriented sectors tend to outperform during the recession phase.
Sectors as defined by GICS. Source: Fidelity Investments (AART), as of March 31, 2019. Past performance is no guarantee of future results.
The merits of the business cycle approach
For those interested in a more active approach to managing their equity exposure, the business cycle approach offers considerable potential for taking advantage of relative sector-performance opportunities. As the probability of a shift in phase increases—for instance, from mid-cycle to late-cycle—such a strategy allows investors to adjust their exposure to sectors that have prominent performance patterns in the next phase of the cycle (see next chart below). Our views on these phase shifts are presented in recurring monthly updates on the business cycle.2 By its very nature, the business cycle focuses on an intermediate time horizon (i.e., cycle phases that rotate on average every few months to every few years). This may make it more practical for some investors to execute than shorter-term approaches.
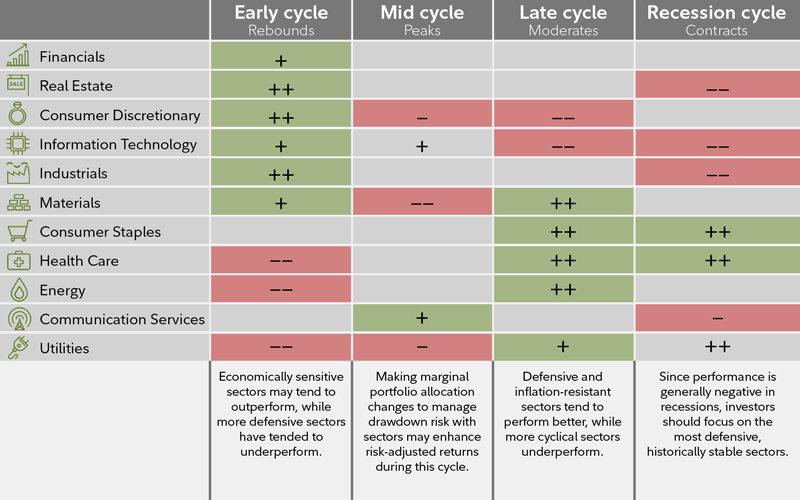
Looking at sectors throughout the business cycle
Note: The typical business cycle shown above is a hypothetical illustration. There is not always a chronological progression in this order, and in past cycles the economy has skipped a phase or retraced an earlier one.
Source for sector performance during business cycle: Fidelity Investments (AART). Unshaded (white) portions above suggest no clear pattern of over- or underperformance vs. broader market. Double +/– signs indicate that the sector is showing a consistent signal across all three metrics: full-phase average performance, median monthly difference, and cycle hit rate. A single +/– indicates a mixed or less consistent signal. Returns data from 1962 to 2016. Annualized returns are represented by the performance of the largest 3,000 US stocks measured by market capitalization, and sectors are defined by the Global Industry Classification Standard (GICS®). Past performance is no guarantee of future results. See below for important information.
Additional considerations for capturing alpha in sectors
Incorporating analysis and execution at the industry level may provide investors with greater opportunities to generate relative outperformance (“alpha”) in a business cycle approach. Industries within each sector can have significantly different fundamental performance drivers that may be masked by sector-level results, leading to significantly different industry-level price performance (see next chart below).
In addition, there are other strategies that can be incorporated to complement the business cycle approach and potentially capture additional alpha in equity sectors. Consider the following:
Macro-fundamental analysis: Macro-fundamental industry research can identify—independently of typical business cycle patterns—variables specific to the dynamics of each industry that may affect performance. For example, a significant change in the cost of key raw material inputs—such as oil prices for airlines—can drive a deviation in an industry's performance.
Bottom-up analysis: Company-specific analysis— through individual security selection—can identify unique traits in individual companies that may outweigh the impact of the typical business cycle pattern on that company’s future performance.
Global business cycle analysis: The US stock market has global exposure, which may warrant allocating toward or away from domestically focused sectors, depending on the phase of the US business cycle relative to the rest of the world. When the US business cycle is more favorable than the global cycle, sectors with more global exposure are likely to face greater headwinds to revenue growth, while more domestically linked sectors could fare relatively well.
Inflation overlay: The inflation backdrop can heavily influence some sectors’ profitability. Short-term inflation trends tend to ebb and flow with the movement of the business cycle, but longer-term inflation trends sometimes move independently of the business cycle.
Secular overlay: Long-term secular trends that are expected to unfold over multiple business cycles can warrant a permanently higher or lower allocation to a given sector than a pure business cycle approach would suggest.
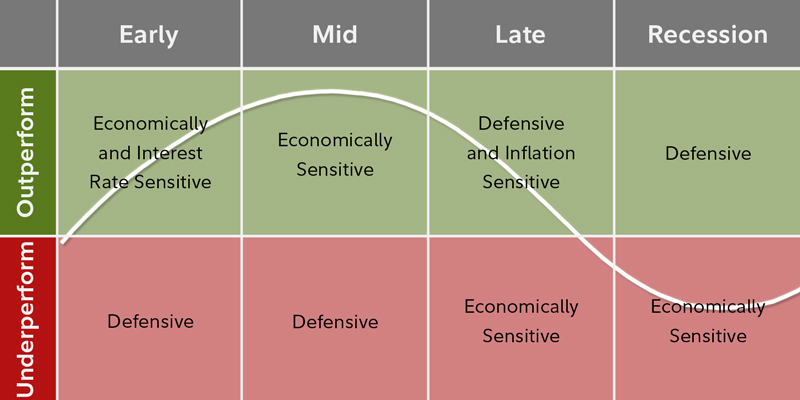
This graphic shows that each industry within a sector has specific drivers that may affect performance.
Investment implications
Every business cycle is different, and so are the relative performance patterns among equity sectors. However, using a disciplined business cycle approach, it is possible to identify key phases in the economy and to use those signals in an effort to achieve active returns from sector allocation.
Analyzing relative sector performance
Certain metrics help evaluate the historical performance of each sector relative to the broader equity market (all data are annualized for comparison purposes):
Full-phase average performance: Calculates the (geometric) average performance of a sector in a particular phase of the business cycle, and subtracts the performance of the broader equity market. This method better captures the impact of compounding and performance that is experienced across full market cycles (i.e., longer holding periods). However, performance outliers carry greater weight and can skew results.
Median monthly difference: Calculates the difference in the monthly performance of a sector compared with the broader equity market, and then takes the midpoint of those observations. This measure is indifferent to when a return period begins during a phase, which makes it a good measure for investors who may miss significant portions of each business cycle phase. This method mutes the extreme performance differences of outliers, and also underemphasizes the impact of compounding returns.
Cycle hit rate: Calculates the frequency of a sector’s outperforming the broader equity market over each business cycle phase since 1962. This measure represents the consistency of sector performance relative to the broader market over different cycles, removing the possibility that outsized gains during one period in history influence overall averages. This method suffers somewhat from small sample sizes, with only 7 full cycles during the period, but persistent outperformance or underperformance still can be observed.
We updated our Business Cycle Sector Framework as a result of the September 2018 changes to the Global Industry Classification Standard (GICS) structure. This framework was last refreshed in 2016, following the elevation of real estate as the 11th GICS sector.
As of September 2018, the newly formed communication services sector combined the legacy telecommunication services sector with entertainment software, traditional media, and internet media companies. As a result, this new sector is more cyclical than its more-defensive predecessor, telecom, and we expect it to perform well in the mid cycle and underperform during recessions. Our assessment of communication services is more qualitative than that of the other sectors, given its evolving mix of industries.
Other sectors were also impacted by the shift in the GICS structure. Consumer discretionary lost some large internet media companies and gained online marketplaces. The departure of internet companies made the outlook for consumer discretionary less favorable in the mid cycle. Information technology was also affected by losing some internet and entertainment software companies, but the overall business cycle playbook for information technology companies did not change as a result.
<<<
The gold breakout has resolved some of the questions that have surrounded gold. The question now isn't whether to have gold in your asset allocation, but -
1) How much?
2) Buy now, or wait for a pullback?
3) Physical gold, or ETFs?
4) Gold mining sector?
Rickards has been recommending up to 10% in physical gold, and has mentioned having some exposure to the miners.
Buy now or wait? It might be best to average in over the next period of months. The breakout has been strong, but there could be a pullback to re-test the breakout level (1350-65).
>>> Wealthy Families Are Adding Forests to Their Portfolios
It’s a long-term bet on growth.
Bloomberg
By Lananh Nguyen
June 16, 2019
https://www.bloomberg.com/news/articles/2019-06-17/wealthy-families-are-adding-forests-to-their-portfolios?srnd=premium
Tom Crowder spent much of his two-year career in the NFL running away from men who weighed upwards of 300 pounds. These days? He worries about bears and snakes. As a senior vice president at Bank of America Corp., Crowder spends most days in the woods, from the evergreen forests of New England to the wetlands of the Carolinas, scouting U.S. timberland assets for people with a net worth of at least $100 million and a minimum of $10 million to invest.
“Trees don’t move as fast as Pro Bowl linebackers,” Crowder says on a recent field trip to a client’s timber farm in South Carolina overlooking the alligator-populated Waccamaw River. As turtles sun themselves and wild turkeys roam, he recounts over a picnic lunch the “neat experience” of his stint as a wide receiver and safety for the Dallas Cowboys. After a busted jaw and emergency surgery, he was happy to go back to his roots, as a third-generation forester.
Crowder is among more than 200 experts employed by Bank of America’s Specialty Asset Management group, or SAM, which manages more than 94,000 assets with a value of $13.6 billion for individuals and institutions. The target client is looking for timberland, farms, ranches, energy interests, or real estate, so-called alternative investments that can diversify portfolios mostly made up of stocks and bonds and can provide a hedge against inflation.
Returns for timberland totaled 3.2% in 2018, compared with 2.4% so far this year, according to an index from the National Council of Real Estate Investment Fiduciaries.
John Kelley, a SAM national executive, says “long-term themes” sell. The decline in arable land and rising global food demand, for example, are reasons to invest in farmland. “People have to eat, and what we believe about the intrinsic nature of these assets is that they have real value and they will persist over time,” he says.
For clients willing to make these long-term bets, SAM brings in what it calls boots-on-the-ground specialists from 38 offices across the U.S. They have an average of more than 15 years of experience, Kelley says, and some have been in their field for more than 30 years. Many, like Crowder, come from families who’ve been in those businesses for generations.
An exception is Nancy Fahmy, the head of alternative investments who was tapped to also lead SAM last year after spending most of her 23-year career dealing in esoteric financial assets in New York. “This is a different world for me,” she says, recalling the novelty of climbing onto a tractor for the first time and being intrigued by meeting a colleague wearing an impeccably tailored suit and alligator-skin cowboy boots, the product of a family hunt.
For Crowder, who grew up in Arkansas on his family’s timber farm, it’s familiar territory. While on the trip to the client’s timber tracts, a half-hour drive from Myrtle Beach in South Carolina, he used GPS maps on an extra-large iPad to show off an aerial view of pine trees annotated by the date they were planted. Then he offered instructions on how to use a T-shaped forestry tool, called an increment borer, to extract a section of wood about the size of a drinking straw from a tree to count its rings and gauge its pace of growth.
“People have to eat, and what we believe about the intrinsic nature of these assets is that they have real value and they will persist over time”
Crowder covered a lot of ground over the course of a day, giving a crash course in timber management. He detailed the widespread problem of wild hogs damaging timber properties. He talked about the benefits of recreational hunting clubs, which can offer a revenue stream for owners. He laughed about a catchphrase among colleagues—“release the deer”—a reference to the Chevy Chase movie Funny Farm. That’s what SAM staff say when an impressive animal is spotted on a site visit, as if they’d arranged it specifically to impress prospective buyers.
The bank’s roster of clients includes people from both the U.S. and overseas. Investors new to the arena are strongly encouraged to visit what they might be buying into, and it’s during these trips that the idea of passing on a legacy to future generations hits home, Kelley says. Wealthy families are also becoming more interested in environmental and sustainable investments, he says.
“It has a transformative effect in a lot of ways when they actually get to see it, feel it, touch it, and—sometimes in the case of farmland—smell it,” Kelley says. “It goes beyond the numbers.”
And the numbers for real-asset deals, such as predicted profits and hurdle rates, don’t correspond to typical Wall Street metrics. In some cases, the bank has to explain to sophisticated investors that the investments might not work for them.
The assets do produce revenue—in the form of logs, crops, livestock, or oil and gas—but buyers have to get comfortable with multiyear time horizons for returns. A timber farm could generate immediate sales or take years to harvest, depending on tree maturity and market conditions, or decades if starting from seed.
“This is not like stocks and bonds,” Kelley says. “This is not something that you buy on Monday and sell on Wednesday. That’s not the deal. If you’re not coming in with at least a minimum of a 10-year investment horizon, you really don’t belong in this investment class.”
There are other reasons to be careful. Universities including Yale and Harvard ran into trouble with their forestry investments in recent years after endowment funds bought into huge tracts of land as a way to hedge against inflation. The bets paid off handsomely until 2017, when returns slumped and the universities came under criticism from local residents and environmentalists. The various complaints included concerns about overlogging, destruction of scenery, and the disruption of animal habitats.
The California Public Employees’ Retirement System, the largest U.S. public pension system, is restructuring its forestland portfolio after its investments lost an average of 1.1% annually over the last 10 years, according to a presentation at a September meeting. The forestlands program has been under review the past few years and will likely be part of a broader examination by Ben Meng, who started in January as chief investment officer, CalPERS spokesman Joe DeAnda says.
That’s why Bank of America emphasizes the importance of its experts, who handpick properties for direct purchases. Farmland specialist Katie VanMeter comes from a family who owns thousands of acres of wheat and chickpeas in Montana. Shelda Owens, who runs operations for the timber business, has a master of science in forest economics. It might be argued that Crowder’s forestry experience goes as far back as his childhood. He cultivated his own sandbox-size plot of trees when he was a kid and had to make “hard decisions” about which ones to thin so the others could grow.
That depth of knowledge is important when the SAM experts are sitting across a table from savvy investors and being grilled by them—and, of course, when they’re showing off the land.
Crowder goes to great lengths out there. He once waded through a waist-deep river, holding the iPad overhead, to assess a property that housed a cave of endangered bats. It wasn’t a good fit, and the bank decided not to manage the property. He prepares for site visits in great detail, readying contingency plans for weather-related disruptions. And he’s learning Mandarin to speak to Chinese clients, but it’s hard going: The Rosetta Stone program doesn’t always understand his Arkansas accent.
Among his clients are New Yorkers who consider Central Park a forest. He points out differences—on timber farms, there are no sidewalks, no lights, and sometimes no cellphone coverage. That off-the-grid experience and the opportunity to learn about nature are refreshing for visitors who might be titans of industry. Crowder enjoys being their guide.
“It’s incredible to make a career out of something that you’re so passionate about,” Crowder says. He spends much of his free time hiking in the forest next to his home in Little Rock, accompanied by his 100-pound giant schnauzer, Ranger. “That’s his passion, too.”
<<<
>>> How to Invest and Profit in the Next Recession
A slump is likely in the next year or so. There are ways to prepare for it.
By Barry Ritholtz
June 17, 2019
https://www.bloomberg.com/opinion/articles/2019-06-17/how-to-invest-and-profit-in-the-next-recession?srnd=premium
Ever since the Great Recession ended in June 2009, investors have been treated to a stream of forecasts warning that another slump is right around the corner. As we have seen, none of these predictions have come to pass. Smart investors paid little heed to predictions that were subjective and of little value.
Enter Campbell R. Harvey. He's a finance professor at Duke University’s Fuqua School of Business. He also is a research associate at the National Bureau of Economic Research, which among other things provides the official start and end dates of expansions and contractions. Most important of all, he maintains one of the more rigorous models for analyzing the potential for a future economic contraction.
Harvey is not an alarmist; to the contrary, he is a sober-minded researcher. In a recent YouTube discussion of the warning signs of an impending recession, he cited four signals. One is the Duke-CFO Global Business Outlook survey, which this month found that more than two-thirds of corporate chief financial officers expect that a recession will be underway by the end of 2020. His second factor is “the realization of anti-growth protectionism,” aka tariffs and rising trade-war tensions; the third is market volatility, which he notes frequently gives false signals, but has generally been on the rise the past few months.
The last, and most important component, is the yield curve, or the schedule of bond yields based on maturity dates. His focus is on the five-year Treasury bond yield, which now is lower than the yield on three-month Treasury bill. According to Harvey’s research, when this inversion -- short-term rates being higher than long-term rates -- lasts for a full quarter, or 90 days, then a recession will occur in 12 to 18 months.
Inversion occurred on March 7 and earlier this month we crossed the 90-day threshold. Thus, all four of the conditions for a future recession in Harvey’s model now have been met. 1
I am not in the business of predicting recessions. However, since the previous one was a decade ago, I am quite comfortable with the idea we are closer to the next one than we are to the last one.
Since we can all agree that another recession is inevitable, I am going to go out on a limb and suggest that now is the time to plan for it. Maybe these will help you get through relatively unscathed:
No. 1. Clean out your portfolio: We all accumulate holdings for reasons that are too silly to go into and look terrible in hindsight: your brother-in-law’s stock recommendation, the initial public offering that didn’t work out, the hot tip from a broker.
Sell ‘em all! With markets near record highs, this is your best opportunity to minimize your losses, since this might be as good as it gets. Remember, weaker companies will do much worse than average ones in recessions. If you own any junk bonds sell them, too.
No. 2. Pay down debt: Today, markets are near all-time highs, unemployment is near 50-year lows and wages are rising. It might not be this easy to lower your outstanding obligations for a while. Give yourself a little maneuvering room and maybe sock away some cash in your emergency fund.
No. 3. Be ready to buy when stock prices plunge: Markets typically tank in recessions. Use the cash you raised from selling your garbage holdings and develop a plan of action while you are still calm and objective. Have the confidence to act when the time comes.
It can be simple, too. For example, plan on deploying your cash in tranches: Buy a U.S. index fund when markets are down 20 to 25%; add a developed global index fund when markets fall by 30%. And if we are lucky enough to enjoy a 35 to 40% decline (that's assuming you prepared for this moment), buy emerging-market stocks.
The trick to create this plan NOW, set some alerts and be prepared to put the cash to work when the predetermined levels are hit. You might look (and feel) foolish for a few months, but seem like a genius a few years later.
No. 4. Check and clean up your credit score: I found an erroneous blemish on my credit rating some time ago that took two years of arduous work to remove. Improving your credit score allows you to borrow at more advantageous prices. This helps if you want to refinance when mortgage rates drop, which usually happens during recessions, or take advantage of falling prices to buy a home. Improve your credit score when you don’t have to.
I hope I am wrong, and we don’t see a recession for a long time to come, although that seems unlikely. But even if we are fortunate enough to never have another recession, all of the steps described above will serve to help you get your financial house in order and make you a better investor.
Harvey says the model has delivered no false signals in the modern era, and a variety of out-of-sample evidence has also validated the model.
<<<
>>> Barry Ritholtz is a Bloomberg Opinion columnist. He founded Ritholtz Wealth Management and was chief executive and director of equity research at FusionIQ, a quantitative research firm. He is the author of “Bailout Nation" <<<
>>> Powell’s Concern Over Zero Rates Expected to Lower Bar for Fed Cut
Bloomberg
By Craig Torres
June 16, 2019
https://www.bloomberg.com/news/articles/2019-06-16/powell-s-concern-over-zero-rates-seen-lowering-bar-for-fed-cut?srnd=premium
Fed chairman says extending expansion an ‘overarching’ goal
No interest rate move expected when officials meet this week
Chairman Jerome Powell’s frequent assurance that sustaining the U.S. economic expansion is the Federal Reserve’s “overarching’’ goal is opening the door to potentially aggressive interest-rate cuts.
The timing, size and whether such moves are indeed in his plans may become clearer when Powell and his colleagues meet on Tuesday and Wednesday in Washington.
While investors are agitating for the Fed to shift, economists don’t see a move this week and are divided on whether officials will cut at all in 2019. The median estimate of Bloomberg’s most recent survey shows a quarter point reduction in December, though it was a close call.
Policy rate has been closer to zero compared with any expansion since 1950s
The suspicion of a number of Fed watchers, though, is that the hint of a slowdown would be enough for the Fed to move, and that policy makers will acknowledge that readiness this week. One reason is that the chairman has signaled he’s concerned about how just low rates still are, meaning it may be better to act sooner and avoid a recession than wait and find the economy slumping with the Fed having limited room to act.
Prospects for a shift have mounted in recent weeks as President Donald Trump’s trade war with China has escalated and the U.S. economy had displayed some signs of weakness.
“They will be very reactive if the data even confirms a small amount of slowing,’’ said Priya Misra, global head of interest rate strategy at TD Securities. “They are going to be more pre-emptive and more aggressive. They will open the door for a rate cut’’ at the meeting this week.
That perspective of Fed policy has a lot to do with Powell’s perception of risk at a time of high uncertainty and Trump’s dispute with China.
The Fed’s benchmark policy rate has never been this low during a prolonged economic expansion in records going back to the 1950s. That means when the next recession occurs rates will be closer to the zero limit: in effect, U.S. central bankers have less room to cut.
The Fed chairman described the zero boundary as “the preeminent monetary policy challenge of our time, tainting all manner of issues’’ in a speech in Chicago this month.
Fed watchers read those words as a new trigger point for the central bank. It won’t take an overwhelming confirmation of weakness in data for the Fed to ease, in their view, and a sense that risks are particularly heightened might be enough to prompt a move.
“The bar for precautionary cuts is lower if you are worried about the zero lower bound,’’ said Michael Gapen, chief U.S. economist at Barclays Plc, which predicts 0.75 percentage points of easing this year, one of the most aggressive calls on Wall Street.
That said, economists are still parsing how much weight the Fed will put on the economic data in hand versus risks and uncertainties, and there isn’t much consensus. Twelve firms expect at least one cut this year, the Bloomberg survey showed, while 12 expect two cuts. Sixteen firms expected no cut at all, and two projected a hike.
“I am hard pressed to figure out what all the fuss is about,’’ said Ward McCarthy, chief financial economist at Jefferies LLC, who expects rates to remain unchanged this year. “I think the slowdown’’ in the data now “is the slowdown we are going to get.’’
Monthly job growth in 2019 has slowed to an average of 164,000, down from 230,000 in the first five months of 2018. Job openings remain near record highs and consumption is holding up, but concerns over tariffs have hit household confidence. It all paints a picture of an economy that’s down-shifted a bit with inflation below the Fed’s 2% target.
“We see weak inflation impulses,’’ said Julia Coronado, founder of MacroPolicy Perspectives LLC, who forecasts two rate cuts this year. “It is not like the consumer has rolled over, but you are now seeing a slowing in the pace of growth that makes the economy look more vulnerable to the uncertainties ahead.’’
Perhaps the biggest source of uncertainty is Trump. World leaders meet in Osaka for the G-20 summit later this month, and investors hope for fresh trade talks between the U.S. and China.
Anything short of a clearly positive reset between Trump and Chinese President Xi Jinping would weigh on business confidence and investment as it could upset supply chains and roil markets. That risks a steeper slowdown in U.S. growth that Fed officials won’t tolerate, warned Barclays economists, who predict a 0.50 percentage point cut as soon as July.
Fed independence will also be on Powell’s mind. Trump has relentlessly attacked the central bank for months for having tightened too far, including a fresh broadside on Friday.
If rates were lowered back to zero, the Fed would have to return to emergency-era policies such as buying bonds, an unpopular measure with lawmakers of both parties.
“In the long wake of the crisis, they just don’t have that much political capital to fall back on. Add to that unprecedented presidential pressure and party polarization and it gets ugly,” said Mark Spindel, co-author of a recent book about the Fed’s relations with Congress. “They are the only game in town -- and they are without deep pockets or ammo” to address the next recession.
<<<
>>> Opinion: This is the only protection your stock-market investments will ever need
MarketWatch
By Howard Gold
May 30, 2019
https://www.marketwatch.com/story/this-is-the-only-protection-your-stock-market-investments-will-ever-need-2019-05-30?siteid=yhoof2&yptr=yahoo
Bonds are the simplest and cheapest way to hedge your investment portfolio
As the Dow Jones Industrial Average DJIA and S&P 500 index have fallen more than 5% from their recent highs, investors have rushed toward safety. Funds that aim to lower risk and limit stock market losses raised almost $10 billion in the first four months of 2019, The Wall Street Journal reported.
But there’s a much simpler, cheaper way to hedge your stock-market investments — bonds. And they’ve been the most effective way to do that for more than a decade. Recently, haven buyers have scooped up 10-year Treasury notes, driving yields down a full percentage point since last October, to as low as just above 2.20% at one point Wednesday.
New research by Christine Benz, Morningstar’s director of personal finance, confirmed the superiority of bonds — especially Treasurys — as hedges over the long run.
Benz looked at asset classes traditionally considered stock-market hedges over different periods, from one year to 15 years. She used Morningstar Direct’s database and stuck mostly to funds and ETFs available to institutional and individual investors.
Benz looked at the correlation coefficient between different pairs of asset classes over time. That’s a number between -1 and 1 that measures how closely two variables move together. A correlation of 1 means the two are perfectly in sync, 0 means no correlation, and -1 means the two are going in the opposite direction. In short, it tells us how much other assets have zagged when stocks zigged, and vice versa. Ideally, to hedge your equity risk, you’d want something that has as negative a correlation with the S&P 500 as possible.
“The goal is when stocks tumble, that you have something in your portfolio with the ability to at least hold its ground, or maybe even earn a little bit,” said Benz. That’s important for maximizing your holdings’ long-term growth.
This table tells the story.
Bonds: The best hedge
Correlation - 5-year, 10-year, 15-year
Asset class
Real estate 0.57 0.69 0.74
SPDR Gold Shares (GLD) -0.18 0.06 NA
Managed futures 0.12 0.22 NA
Cash 0.04 -0.01 -0.11
U.S. Aggregate Bond -0.05 -0.13 0
U.S. Treasury 20+ Year -0.18 -0.46 -0.3
U.S. Treasury 5-10 Year -0.28 -0.37 -0.28
Real estate, often recommended as a portfolio diversifier, actually is highly correlated with stocks — 0.74 over 15 years. Managed futures, which have been touted by some investment advisers, are mediocre hedges at best, showing positive correlations with stock prices. Developed and emerging markets international stocks had similarly high correlations with U.S. equities over the past 10 to 15 years, as did high-yield bonds. Long-only commodities also were highly correlated with stocks — 0.4 to 0.5.
Gold GLD was an excellent hedge over the past five years and cash did its job over the last 15; both were solidly in negative territory over those periods.
Then there were two categories — long-short equity and market-neutral — that supposedly mimic the strategies of hedge funds. Their high correlation with stocks (up to 0.97 for long-short and 0.47 for market-neutral) point to why the only thing hedge funds have successfully hedged against over the past decade has been good returns.
But the big winner across the board was bonds. The Bloomberg Barclays U.S. Aggregate Bond index AGG, which covers a broad swath of Treasury, agency, and investment-grade corporate bonds, had zero correlation with stocks for 15 years, but negative correlations over five and 10 years.
Treasurys did even better protecting against equity risk, and here’s the big surprise: Treasurys with maturities longer than 20 years weren’t much better at protecting your portfolio than intermediate-term Treasurys; over the past five years, they did worse.
That’s great news for investors, because intermediate-term Treasurys — those with maturities of five to 10 years — are less interest-rate-sensitive and less volatile than long bonds.
In that category, I like the Vanguard Intermediate-Term Treasury ETF VGIT, the SPDR Bloomberg Barclays Intermediate Term Treasury ETF ITE, or the Schwab Intermediate-Term U.S. Treasury ETF SCHR. All have full exposure to intermediate Treasurys and rock-bottom expense ratios.
Bonds haven’t always been good hedges; in the four decades before the 1990s, stocks and bonds had positive correlations, a study by Graham Capital Management found. But I doubt the complex alternative investing products the ETF industry has concocted over the past few years would have done better — if anybody can figure out how they actually work.
“So, the takeaway is that for most investors, at least based on…history, simpler and cheaper has been better than investing in alternatives,” said Benz.
Nobel Prize-winning economist Harry Markowitz reportedly called diversification “the only free lunch in finance.” If that’s true, then bonds, especially Treasurys, are the only free dinner.
<<<
>>> The Fed May Have No Choice But to Bail Out Trump
The stage is set for an interest-rate cut, but probably not until September.
Bloomberg
By Tim Duy
June 6, 2019
https://www.bloomberg.com/opinion/articles/2019-06-06/the-fed-may-have-no-choice-but-to-bail-out-trump
The U.S.-China trade war may force the Federal Reserve to cut rates.
Federal Reserve Chair Jerome Powell addressed nervous market participants this week by assuring them that the central bank “will act as appropriate” to keep the U.S. expansion on track. This wasn’t a signal that a rate cut is imminent. It was, however, a clear signal that the bar to lowering rates is fairly low. Considering the growing risks to the outlook, the Fed only needs a push to justify a cut. The push will likely come in the form of softer economic data, but could also be a severe bout of financial turmoil.
Fed officials have resisted sending signals about the direction rates, assigning equal possibilities of either an increase or a cut. The shifting balance of risks, however, make that an increasingly difficult story to sell. The escalation of trade wars from China to Mexico create substantial uncertainty for the outlook, and none of it good.
Some complain that the Fed would only be bailing out President Donald Trump in his ill-advised use of tariffs by cutting rates. Such charges will fall on deaf ears at the Fed. Policy makers may not like responding to Trump’s escapades with easier policy, but they ultimately have little choice but to do so. The Fed responds to shocks in a systematic fashion, even those created by the government. The Fed will respond to this shock with easier policy as they seek to sustain the expansion and meet their employment and inflation objectives.
Won’t the inflationary impact of tariffs stay the Fed’s hands when it comes to rate cuts? Most likely not. First, the Fed views tariffs as a temporary price shock expected to fade over time. They will look through any acceleration in inflation.
Second, Fed officials adhering to a symmetric price target will tolerate inflation overshoots to the same degree they tolerate undershoots. In practice, this means that just like they have not pursued an excessively easy policy to push the rate inflation back up to their 2% target, they will not pursue an excessively tight policy to push it back down. Going forward we may see a distribution of inflation outcomes centered above 2%. This would have the benefit of proving the Fed’s inflation target is in fact symmetric.
Third, the Fed will err on the side of caution. The Fed is well aware of the dangers of the zero bound in rates. I suspect that those dangers will lead them to conclude that the policy risks are very asymmetric. Their tools will prove more effective at pulling down an inflation overshoot in the future relative to stimulating the economy at the zero bound. There is much to be said for an insurance rate cut, especially at this challenging point in the business cycle where growth is slowing and companies worry that they should be retrenching in anticipation of the next recession.
The Fed, however, still needs to see greater evidence that growth is in fact slowing as forecast. Policy makers do not see large macro impacts from tariffs, which makes it difficult to justify substantial changes to the outlook on tariffs alone. Moreover, while we have seen some softness in the data, it is not excessive. The Institute for Supply Management’s manufacturing report for May showed that the sector was still expanding. The ISM’s services report, covering the much larger sector, revealed that activity, including hiring, accelerated in May.
In contrast, the ADP Research Institute’s employment report indicated that job growth slowed in May. A sustained slowdown in job growth would go a long way toward justifying a rate cut. The ADP number, however, is not always a reliable signal. The Fed will pay much more attention to the Labor Department’s employment report for May that comes Friday. But even there one weak number will be seen as an outlier, not a trend. The Fed typically needs a wider range of data to shift gears.
Although the stage is set for the Fed to cut rates, policy makers won’t have sufficient data to act until the end of the summer. A move at the September meeting is a reasonable baseline at this point. If the data deteriorate more quickly, or if markets seize up, pull that cut forward into July. If trade tensions ease and growth stays strong, push it back.
<<<
Performance comparison of HDGE, short S+P ETFs, and long Treasury ETFs during the big December swoon -
S+P 500 (SPX) - down 16%
________________________
HDGE - up 19%
1X Short S+P (SH) - up 19%
2X Short S+P (SDS) - up 40%
3X Short S+P (SPXS) - up 69%
________________________
1X Long 20+ year Treasuries (TLT) - up 8%
3X Long 20+ year Treasuries (TMF) - up 22%
________________________
So while the Treasury approach won't give you the best 'bang for the buck' for short term trading, as an asset allocation tool to reduce risk and overall volatility, Treasuries work well.
>>> Asset Allocation for Beginners
An Introduction to Diversifying Between Asset Classes
BY JOSHUA KENNON
December 30, 2018
https://www.thebalance.com/asset-allocation-basics-357311
In its simplest terms, asset allocation is the practice of dividing resources among different categories such as stocks, bonds, mutual funds, investment partnerships, real estate, cash equivalents, and private equity. The theory is that the investor can lessen risk because each asset class has a different correlation to the others; when stocks rise, for example, bonds often fall. At a time when the stock market begins to fall, real estate may begin generating above-average returns.
The amount of an investor’s total portfolio placed in each class is determined by an asset allocation model. These models are designed to reflect the personal goals and risk tolerance of the investor. Furthermore, individual asset classes can be sub-divided into sectors (for example, if the asset allocation model calls for 40% of the total portfolio to be invested in stocks, the portfolio manager may recommend different allocations within the field of stocks, such as recommending a certain percentage in large-cap, mid-cap, banking, manufacturing, etc.)
Model Determined by Need
Although decades of history have conclusively proved it is more profitable to be an owner of corporate America (viz., stocks), rather than a lender to it (viz., bonds), there are times when equities are unattractive compared to other asset classes (think late-1999 when stock prices had risen so high the earnings yields were almost non-existent) or they do not fit with the particular goals or needs of the portfolio owner. A widow, for example, with one million dollars to invest and no other source of income is going to want to place a significant portion of her wealth in fixed income obligations that will generate a steady source of retirement income for the remainder of her life.
Her need is not necessarily to increase her net worth but to preserve what she has while living on the proceeds. A young corporate employee just out of college, however, is going to be most interested in building wealth. He can afford to ignore market fluctuations because he doesn’t depend upon his investments to meet day to day living expenses. A portfolio heavily concentrated in stocks, under reasonable market conditions, is the best option for this type of investor.
Model Types
Most asset allocation models fall somewhere between four objectives: preservation of capital, income, balanced, or growth.
Preservation of Capital.
Asset allocation models designed for the preservation of capital are largely for those who expect to use their cash within the next twelve months and do not wish to risk losing even a small percentage of principal value for the possibility of capital gains. Investors that plan on paying for college, purchasing a house or acquiring a business are examples of those that would seek this type of allocation model. Cash and cash equivalents such as money markets, treasuries, and commercial paper often compose upwards of eighty percent of these portfolios. The biggest danger is that the return earned may not keep pace with inflation, eroding purchasing power in real terms.
Income.
Portfolios that are designed to generate income for their owners often consist of investment-grade, fixed income obligations of large, profitable corporations, real estate (most often in the form of Real Estate Investment Trusts, or REITs), treasury notes, and, to a lesser extent, shares of blue-chip companies with long histories of continuous dividend payments. The typical income-oriented investor is one that is nearing retirement. Another example would be a young widow with small children receiving a lump-sum settlement from her husband’s life insurance policy and cannot risk losing the principal; although growth would be nice, the need for cash in hand for living expenses is of primary importance.
Balanced.
Halfway between the income and growth asset allocation models is a compromise known as the balanced portfolio. For most people, the balanced portfolio is the best option not for financial reasons, but for emotional. Portfolios based on this model attempt to strike a compromise between long-term growth and current income. The ideal result is a mix of assets that generate cash as well as appreciates over time with smaller fluctuations in quoted principal value than the all-growth portfolio. Balanced portfolios tend to divide assets between medium-term investment-grade fixed income obligations and shares of common stocks in leading corporations, many of which may pay cash dividends. Real estate holdings via REITs are often a component as well. For the most part, a balanced portfolio is always vested (meaning very little is held in cash or cash equivalents unless the portfolio manager is absolutely convinced there are no attractive opportunities demonstrating an acceptable level of risk.)
Growth.
The growth asset allocation model is designed for those that are just beginning their careers and are interested in building long-term wealth. The assets are not required to generate current income because the owner is actively employed, living off his or her salary for required expenses. Unlike an income portfolio, the investor is likely to increase his or her position each year by depositing additional funds. In bull markets, growth portfolios tend to outperform their counterparts significantly; in bear markets, they are the hardest hit. For the most part, up to one hundred percent of a growth modeled portfolio can be invested in common stocks, a substantial portion of which may not pay dividends and are relatively young. Portfolio managers often like to include an international equity component to expose the investor to economies other than the United States.
Changing with the Times
An investor that is actively engaged in an asset allocation strategy will find that his or her needs change as they move through the various stages of life. For that reason, some professional money managers recommend switching over a portion of your assets to a different model several years prior to major life changes. An investor that is ten years away from retirement, for example, would find himself moving 10% of his holding into an income-oriented allocation model each year. By the time he retires, the entire portfolio will reflect his new objectives.
The Rebalancing Controversy
One of the most popular practices on Wall Street is “rebalancing” a portfolio. Many times, this results because one particular asset class or investment has advanced substantially, coming to represent a significant portion of the investor’s wealth. To bring the portfolio back into balance with the original prescribed model, the portfolio manager will sell off a portion of the appreciated asset and reinvest the proceeds. Famed mutual fund manager Peter Lynch calls this practice, “cutting the flowers and watering the weeds.”
What is the average investor to do? On the one hand, we have the advice given by one of the managing directors of Tweedy Browne to a client that held $30 million in Berkshire Hathaway stock many years ago. When asked if she should sell, his response was (paraphrased), “has there been a change in fundamentals that makes you believe the investment is less attractive?” She said no and kept the stock. Today, her position is worth several hundred millions of dollars. On the other hand, we have cases such as ?Worldcom and Enron where investors lost everything.
Perhaps the best advice is only to hold the position if you are capable of evaluating the business operationally, are convinced that the fundamentals are still attractive, believe the company has a significant competitive advantage, and you are comfortable with the increased dependence upon the performance of a single investment. If you are unable or unwilling to commit to the criteria, you may be better served by rebalancing.
Strategy
Many investors believe that by merely diversifying one’s assets to the prescribed allocation model is going to alleviate the need to exercise discretion in choosing individual issues. It is a dangerous fallacy. Investors that are not capable of evaluating a business quantitatively or qualitatively must make it absolutely clear to their portfolio manager that they are interested only in defensively selected investments, regardless of age or wealth level.
<<<
| Name | Symbol | % Assets |
|---|---|---|
| Apple Inc | AAPL | 3.23% |
| Microsoft Corp | MSFT | 2.88% |
| Amazon.com Inc | AMZN | 2.43% |
| Facebook Inc A | FB | 1.14% |
| Alphabet Inc Class C | GOOG | 0.78% |
| Alphabet Inc A | GOOGL | 0.77% |
| Johnson & Johnson | JNJ | 0.71% |
| Berkshire Hathaway Inc Class B | BRK.B | 0.68% |
| Procter & Gamble Co | PG | 0.62% |
| Visa Inc Class A | V | 0.61% |
| Volume | |
| Day Range: | |
| Bid Price | |
| Ask Price | |
| Last Trade Time: |


