The following are futures positions of non-commercials as of September 27, 2016.
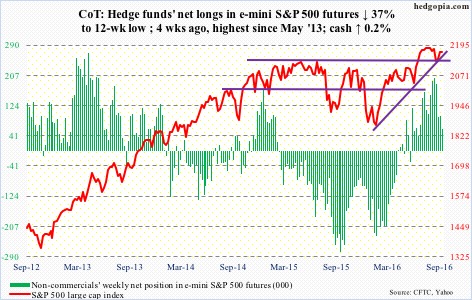
E-mini S&P 500: The S&P 500 index struggled one more time at 2175-2180 … rose to 2175.3 intra-day Friday, before closing at 2168.27, literally closing at the 50-day moving average. The average is now flattish to down – potentially important development.
Buybacks hold the key.
In the week ended Wednesday, SPY, the SPDR S&P 500 ETF, attracted $1.7 billion, coming on the heels of outflows of $6.4 billion in the prior two (courtesy of ETF.com).
In the same week, for a change, U.S.-based equity funds attracted $622 million – the first positive week in six weeks (courtesy of Lipper). In the August 17th week, $307 million came in, but in the next five, north of $25 billion was withdrawn. Therein lies the problem. Outflows are dominant.
Currently net long 60.1k, down 35.3k.
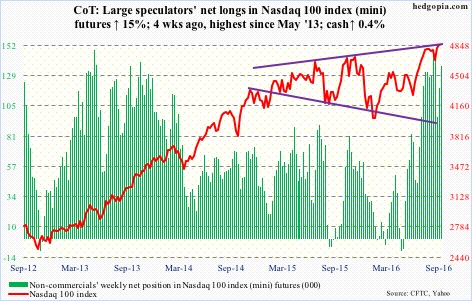
Nasdaq 100 index (mini): The Nasdaq 100 is having to work hard to save the mini break out of 4840 seven sessions ago.
Of the top five tech names, Amazon (AMZN), up 3.9 percent for the week to yet another record, was the only one rising more than the Nasdaq 100’s 0.35-percent rise. The e-retailer has gone parabolic. A breather is due, at least near term.
In the week ended Wednesday, QQQ, the PowerShares Nasdaq 100 ETF, saw $456 million in inflows, following inflows of $1.5 billion in the prior week (courtesy of ETF.com).
Currently net long 136.5k, up 17.8k.
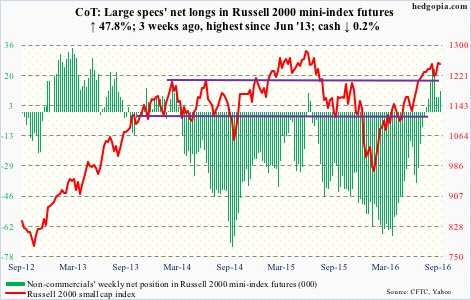
Russell 2000 mini-index: The all-time high of 1296 reached in June last year continues to be elusive. At last week’s high, the Russell 2000 was only 2.6 percent away. Of major U.S. indices, this is the only one yet to score a new high, which probably remains that way at least for a while.
The weekly chart produced a hanging man candle. Momentum is waning.
In the week ended Wednesday, IWM, the iShares Russell 2000 ETF, gained $927 million, owing primarily to $1.6 billion in inflows last Friday (courtesy of ETF.com).
Currently net long 11.5k, up 3.7k.
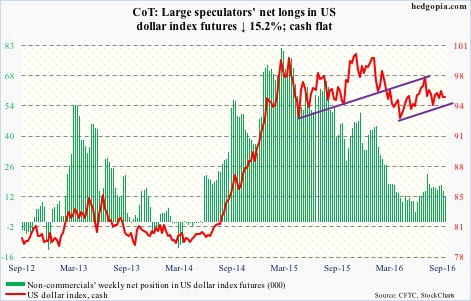
US Dollar Index: On Wednesday through Friday, the spot was rejected at the 50-day moving average, which is now slightly declining. The week produced a doji.
Going forward, the early-May 2016 rising trend line is worth watching. Dollar bulls have continued to defend that support, and it will be tested around 95.
Currently net long 12.2k, down 2.2k.
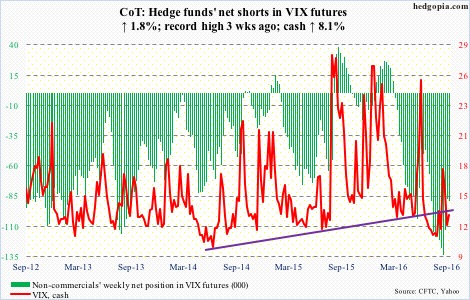
VIX: The spot continues to be volatile, with a range of 12.14 and 15.69 on Thursday, and 12.53 and 15.20 on Friday. That said, the 50-day moving average is now beginning to rise, although ever so slightly – potential reason for volatility bulls to get emboldened should this persist.
Since August 5 this year, spot VIX has been making higher highs, confirmed by daily MACD.
Click on "In reply to", for Authors past commentaries
Information posted to this board is not meant to suggest any specific action, but to point out the technical signs that can help our readers make their own specific decisions. Your Due Dilegence is a must! • DiscoverGold
Register for free to join our community of investors and share your ideas. You will also get access to streaming quotes, interactive charts, trades, portfolio, live options flow and more tools.


 News
News  Market Data
  Discover